5.1. Poisson Regression Model Result
To eliminate explanatory variables exhibiting multicollinearity, we used the Exploratory Regression tool in ArcGIS Pro to calculate the VIF indicators of each potential explanatory variable and to obtain the covariates of variables with VIF values greater than 10. The inspection results are shown in
Table 7, which indicates that six variables had a VIF greater than 10: AGE2, AGE3, AGE4, AGE5, JD and PD. Based on the covariate column, four age variables were linearly correlated with each other, and JD and PD also presented a strong linear relationship. Thus, we excluded AGE3, AGE4, AGE2 and JD but retained AGE5 and PD, which had a smaller VIF relative to their covariates.
After solving the multicollinearity problem, we ran the global Poisson regression model using STATA to examine the relationship between the remaining variables and the dependent variable. In this paper, we set the significance level at
P < 0.05 and assumed that variables with a
P-value greater than 0.05 did not have a significant influence on the dependent variable and should be excluded from the Poisson regression model. We eliminated each insignificant variable using an iterative approach, and the final modeling results are shown in
Table 8. A total of 17 variables were left after the down-selection. These variables were considered to significantly influence the transfer volume.
5.2. GWPR Model Results
Moran’s
I test was conducted to determine whether some of these 17 variables were spatially autocorrelated and thus whether it is necessary to use the GWPR model for fitting these independent variables. Again, we used ArcGIS Pro to estimate the Moran’s
I index of each selected explanatory variable after plotting the data on the geographical map with x-y coordinates. The estimation results are listed in
Table 9. It can be seen that POLR, TDB, ROM, ROB, BUSD, BIKED, METROD and ENTERTAINMENT showed spatial autocorrelation with a significance level of
P < 0.01, whereas the other explanatory variables did not show geographical variability.
Therefore, a GWPR model was applied to explore the spatial heterogeneity of these variables with geographical variability. The modeling results are shown in
Table 10. To further demonstrate the superiority and feasibility of the GWPR model, we compared it with the global Poisson regression model, which had the same explanatory variables as the GWPR model above. We calculated the AICc and AIC of the two models and found that the GWPR model had a significantly smaller AICc and AIC (shown in
Table 11). This result indicates that GWPR better explained the data, suggesting that the GWPR model had a higher goodness-of-fit and better explanatory power.
5.3. Analysis and Discussion
As shown in
Figure 2,
Figure 3,
Figure 4,
Figure 5,
Figure 6,
Figure 7,
Figure 8 and
Figure 9, the effect of explanatory variables on metro-bikeshare transfer volume could be spatially investigated as in previous research [
43,
44,
45]. The estimated coefficients of each paired metro-bikeshare station varied across regions, indicating that each selected variable was affected by local characteristics. Therefore, an analysis of the GWPR modeling performance can be used as a reference for government and bikeshare operators.
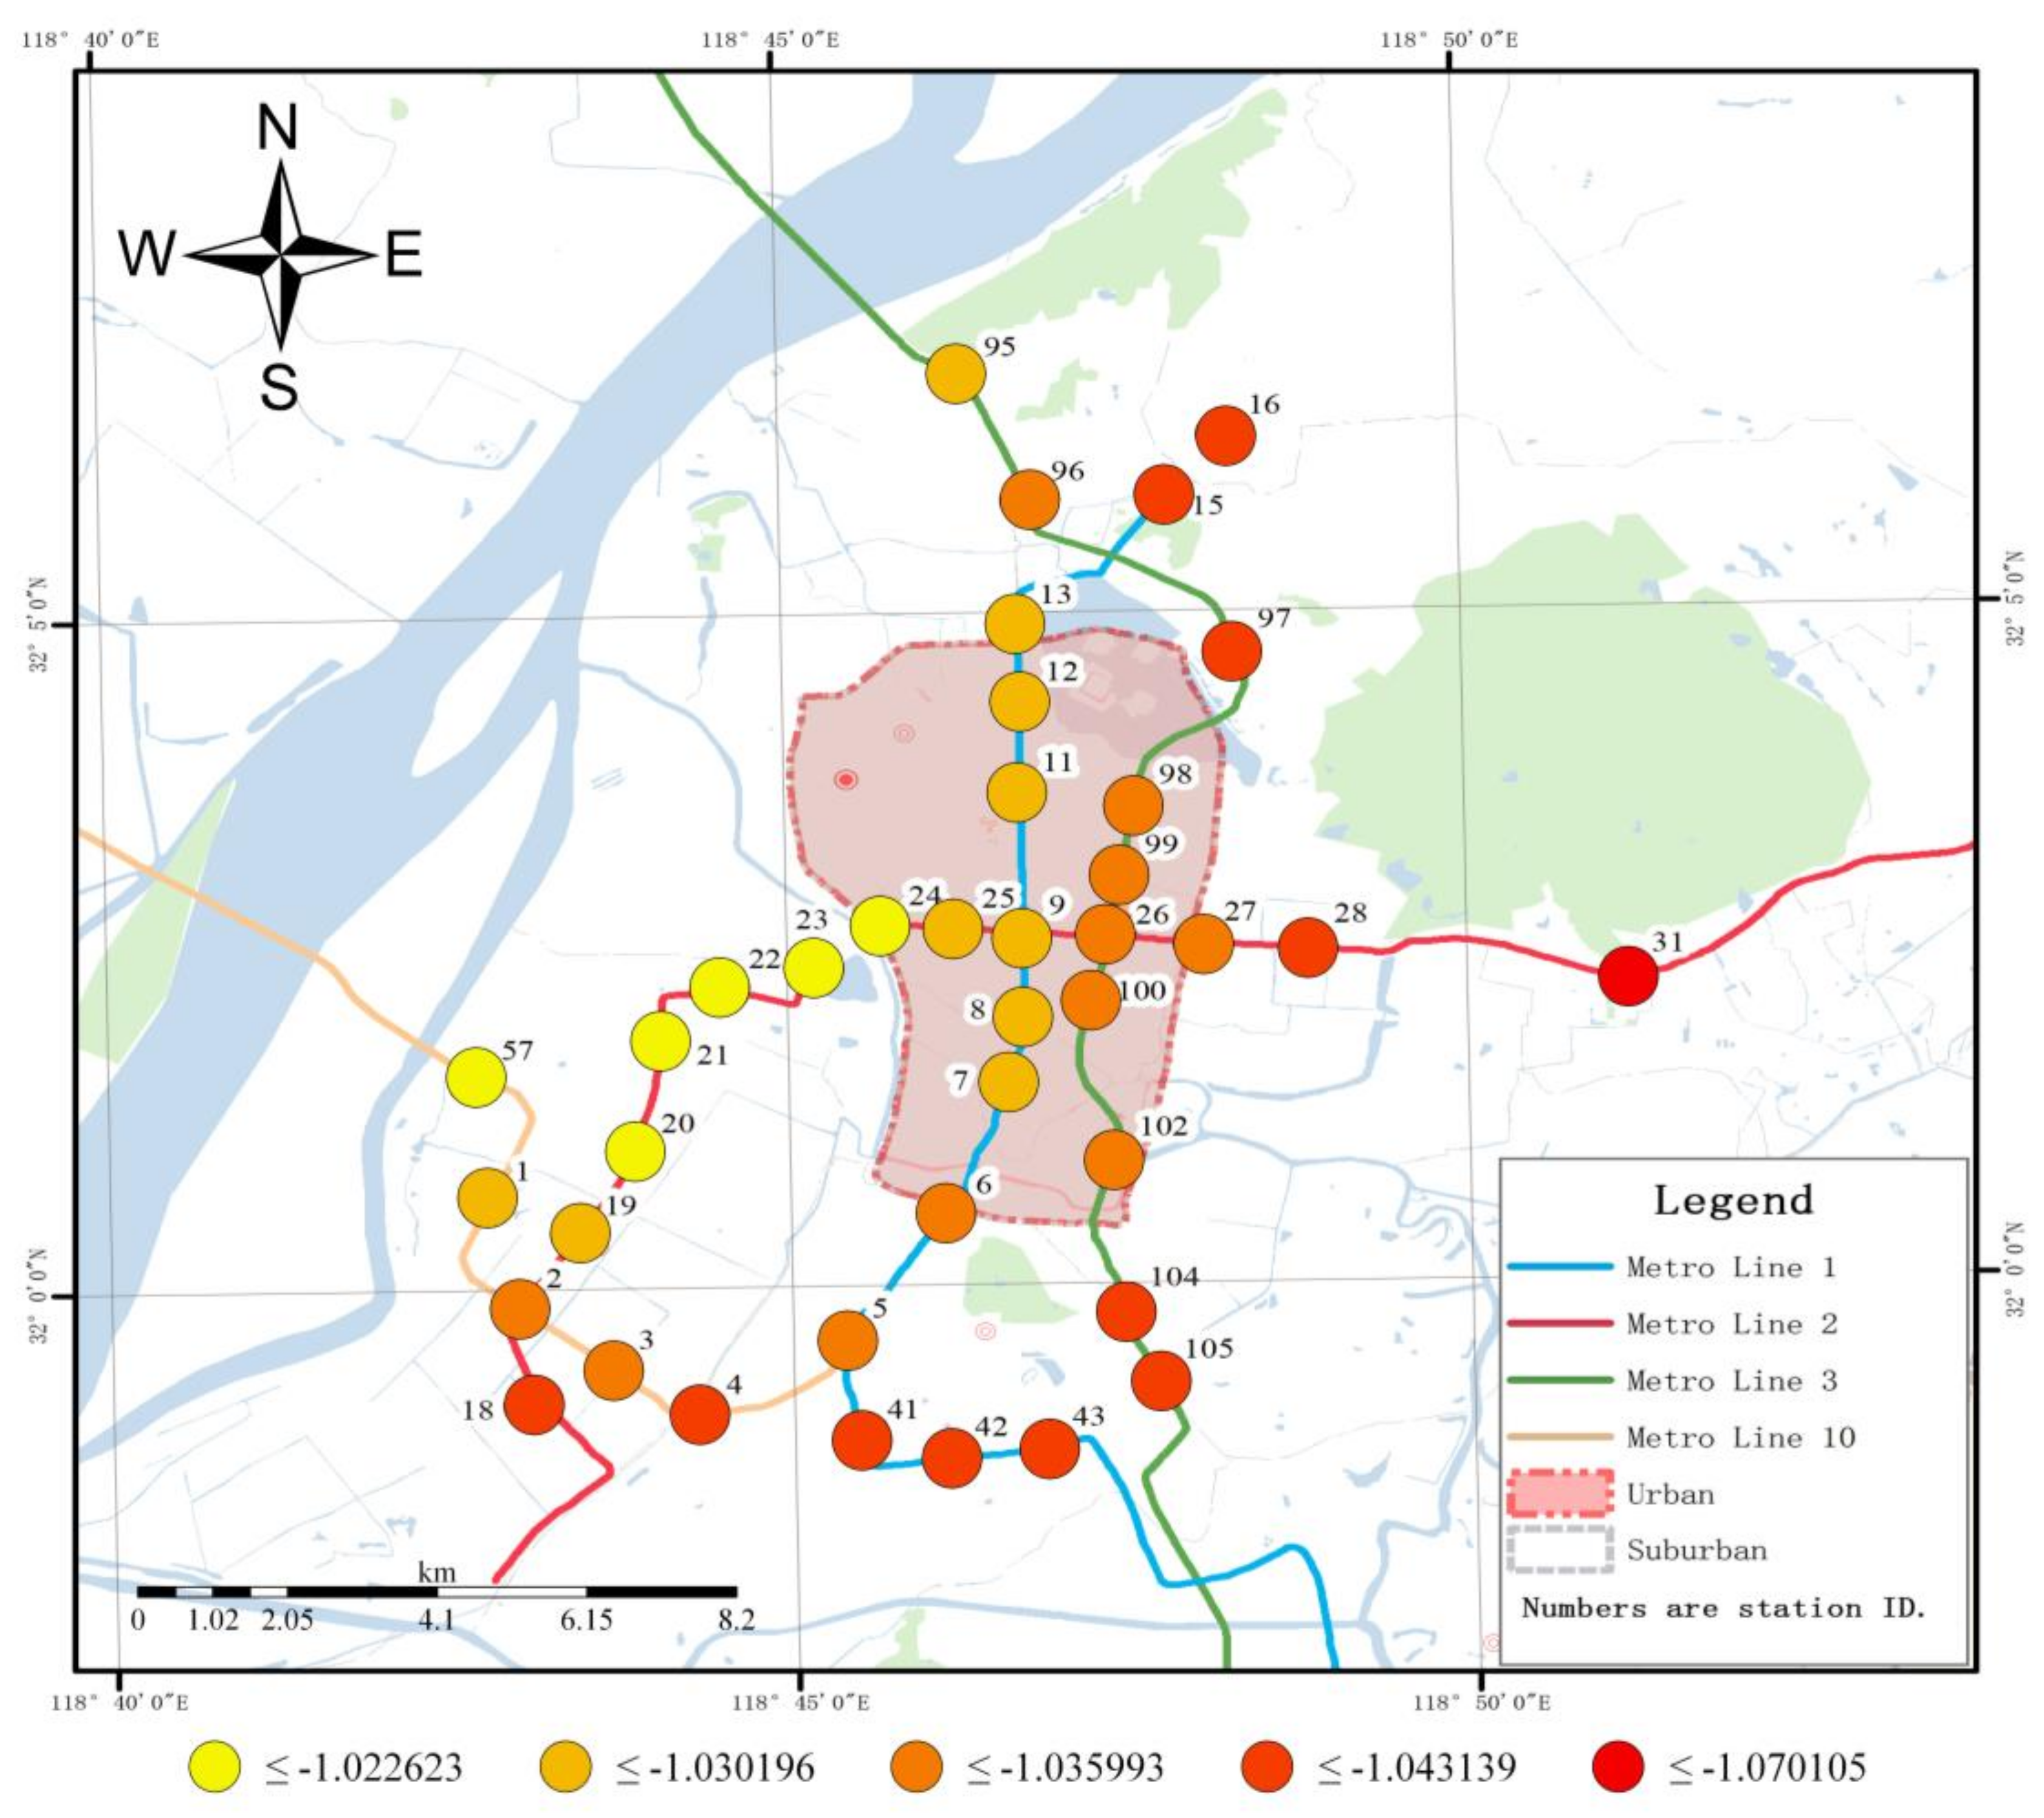
As shown in
Figure 2, there were clear negative correlations between proportion of local Residents (POLR) and metro-bikeshare transfer usage based on their coefficient values. As for the distribution of coefficients of POLR, the value was the lowest in the northwestern suburban area, where housing prices, which are US
$5499 (34,369 RMB) per square meter, are higher than the average price of US
$4800 (30,000) per square meter in Nanjing [
58], indicating higher income and better life quality of local residents living in this area. As a result, these residents may use private vehicles for commuting, thus reducing the likelihood of using the metro-bikeshare transfer mode. The metro-bikeshare service should be enhanced, including suburban cycling infrastructure, among other metro-bikeshare services to greatly increase the metro-bikeshare usage by shifting local commuters away from using private vehicle travel modes.
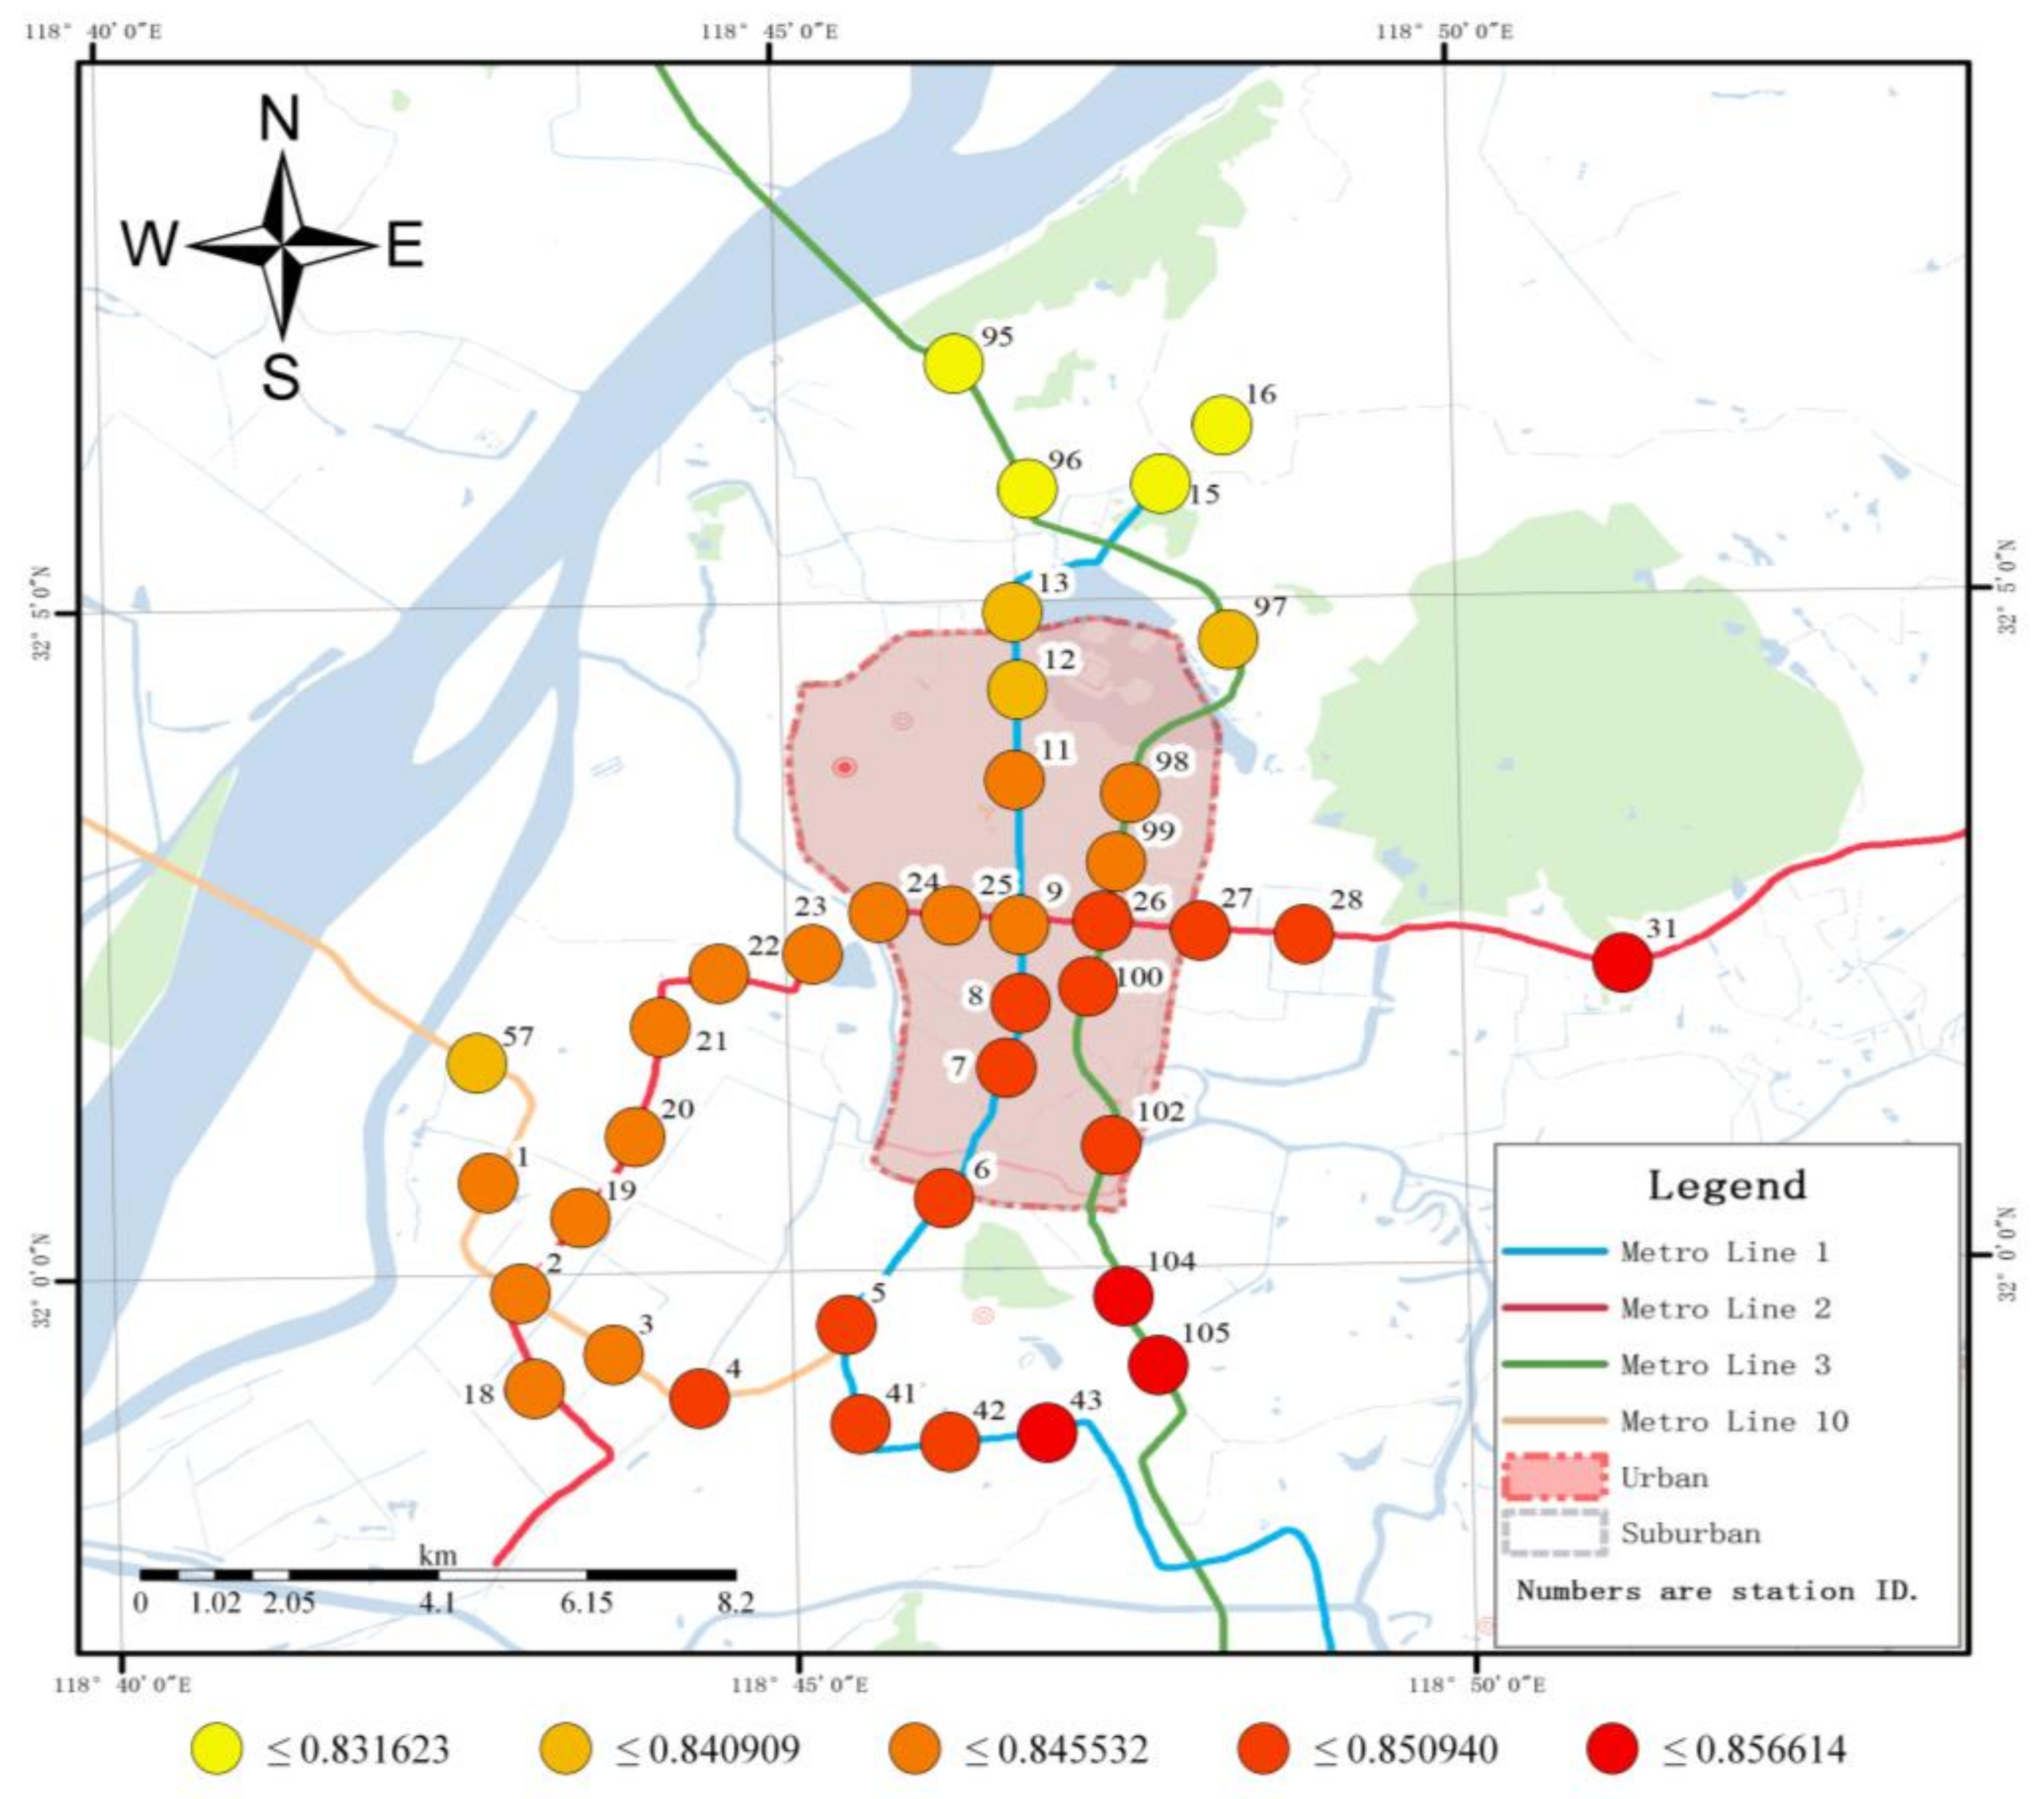
A few European studies have shown that travel distance is a key factor that can explain the relationship between bike-and-ride, and faster public transportation tools (such as metro) tend to attract passengers from larger access and egress distances [
22]. However, no research to date has examined how the travel distance on bikeshare affects metro-bikeshare integration in the context of Chinese cities. Our findings indicate that negative correlations exist between riding distance and metro-bikeshare transfer usage, which is quite understandable considering that people who use bikeshare for a longer distance are more likely to conduct the entire trip by bike and without needing to transfer to metro or any other modes for the remainder of their trip. As is show in
Figure 3, the coefficient values were generally lower at the edge of the city, especially in underdeveloped areas. This phenomenon suggests that the combination of metro and bikeshare is still inadequate, and metro stations in those areas are sparsely distributed, so that people may have to take a bus, walk or use other transfer modes (but not metro) to finish their trips. Therefore, the government should provide more metro stations and support bikeshare stations within 2 km of metro stations in underdeveloped areas.
Figure 4 and
Figure 5 show the spatial distribution of the coefficients for ridership of metro and bikeshare, respectively. It can be seen that positive correlations between ridership of metro and metro-bikeshare usage are primarily in the north of the city. Compared to the price in other areas in the suburbs, housing prices in northern regions, which are at US
$4097 (25,608 RMB) per square meter, are relatively low [
58]. Passengers living in this area use metro or metro-bikeshare to commute to urban areas as these two travel modes are more cost-effective [
59,
60]. In the south of the city, however, correlations between ridership of bikeshare and metro-bikeshare usage are much positive, compared with the least positive correlations in northern regions. A possible explanation is that when the first-stage bikeshare program of Nanjing was launched in the southern area in 2010, passengers there had accepted bikeshare as a feeder mode to metro [
61]. Therefore, a scientific and reasonable dispatching approach needs to be implemented to solve the bikeshare imbalance problem in the northern and southern areas of the city. Additionally, an incentive policy to attract new users, such as a reduced price of any transfer between bikeshare and other public transit if a smart card is used, should be enacted.
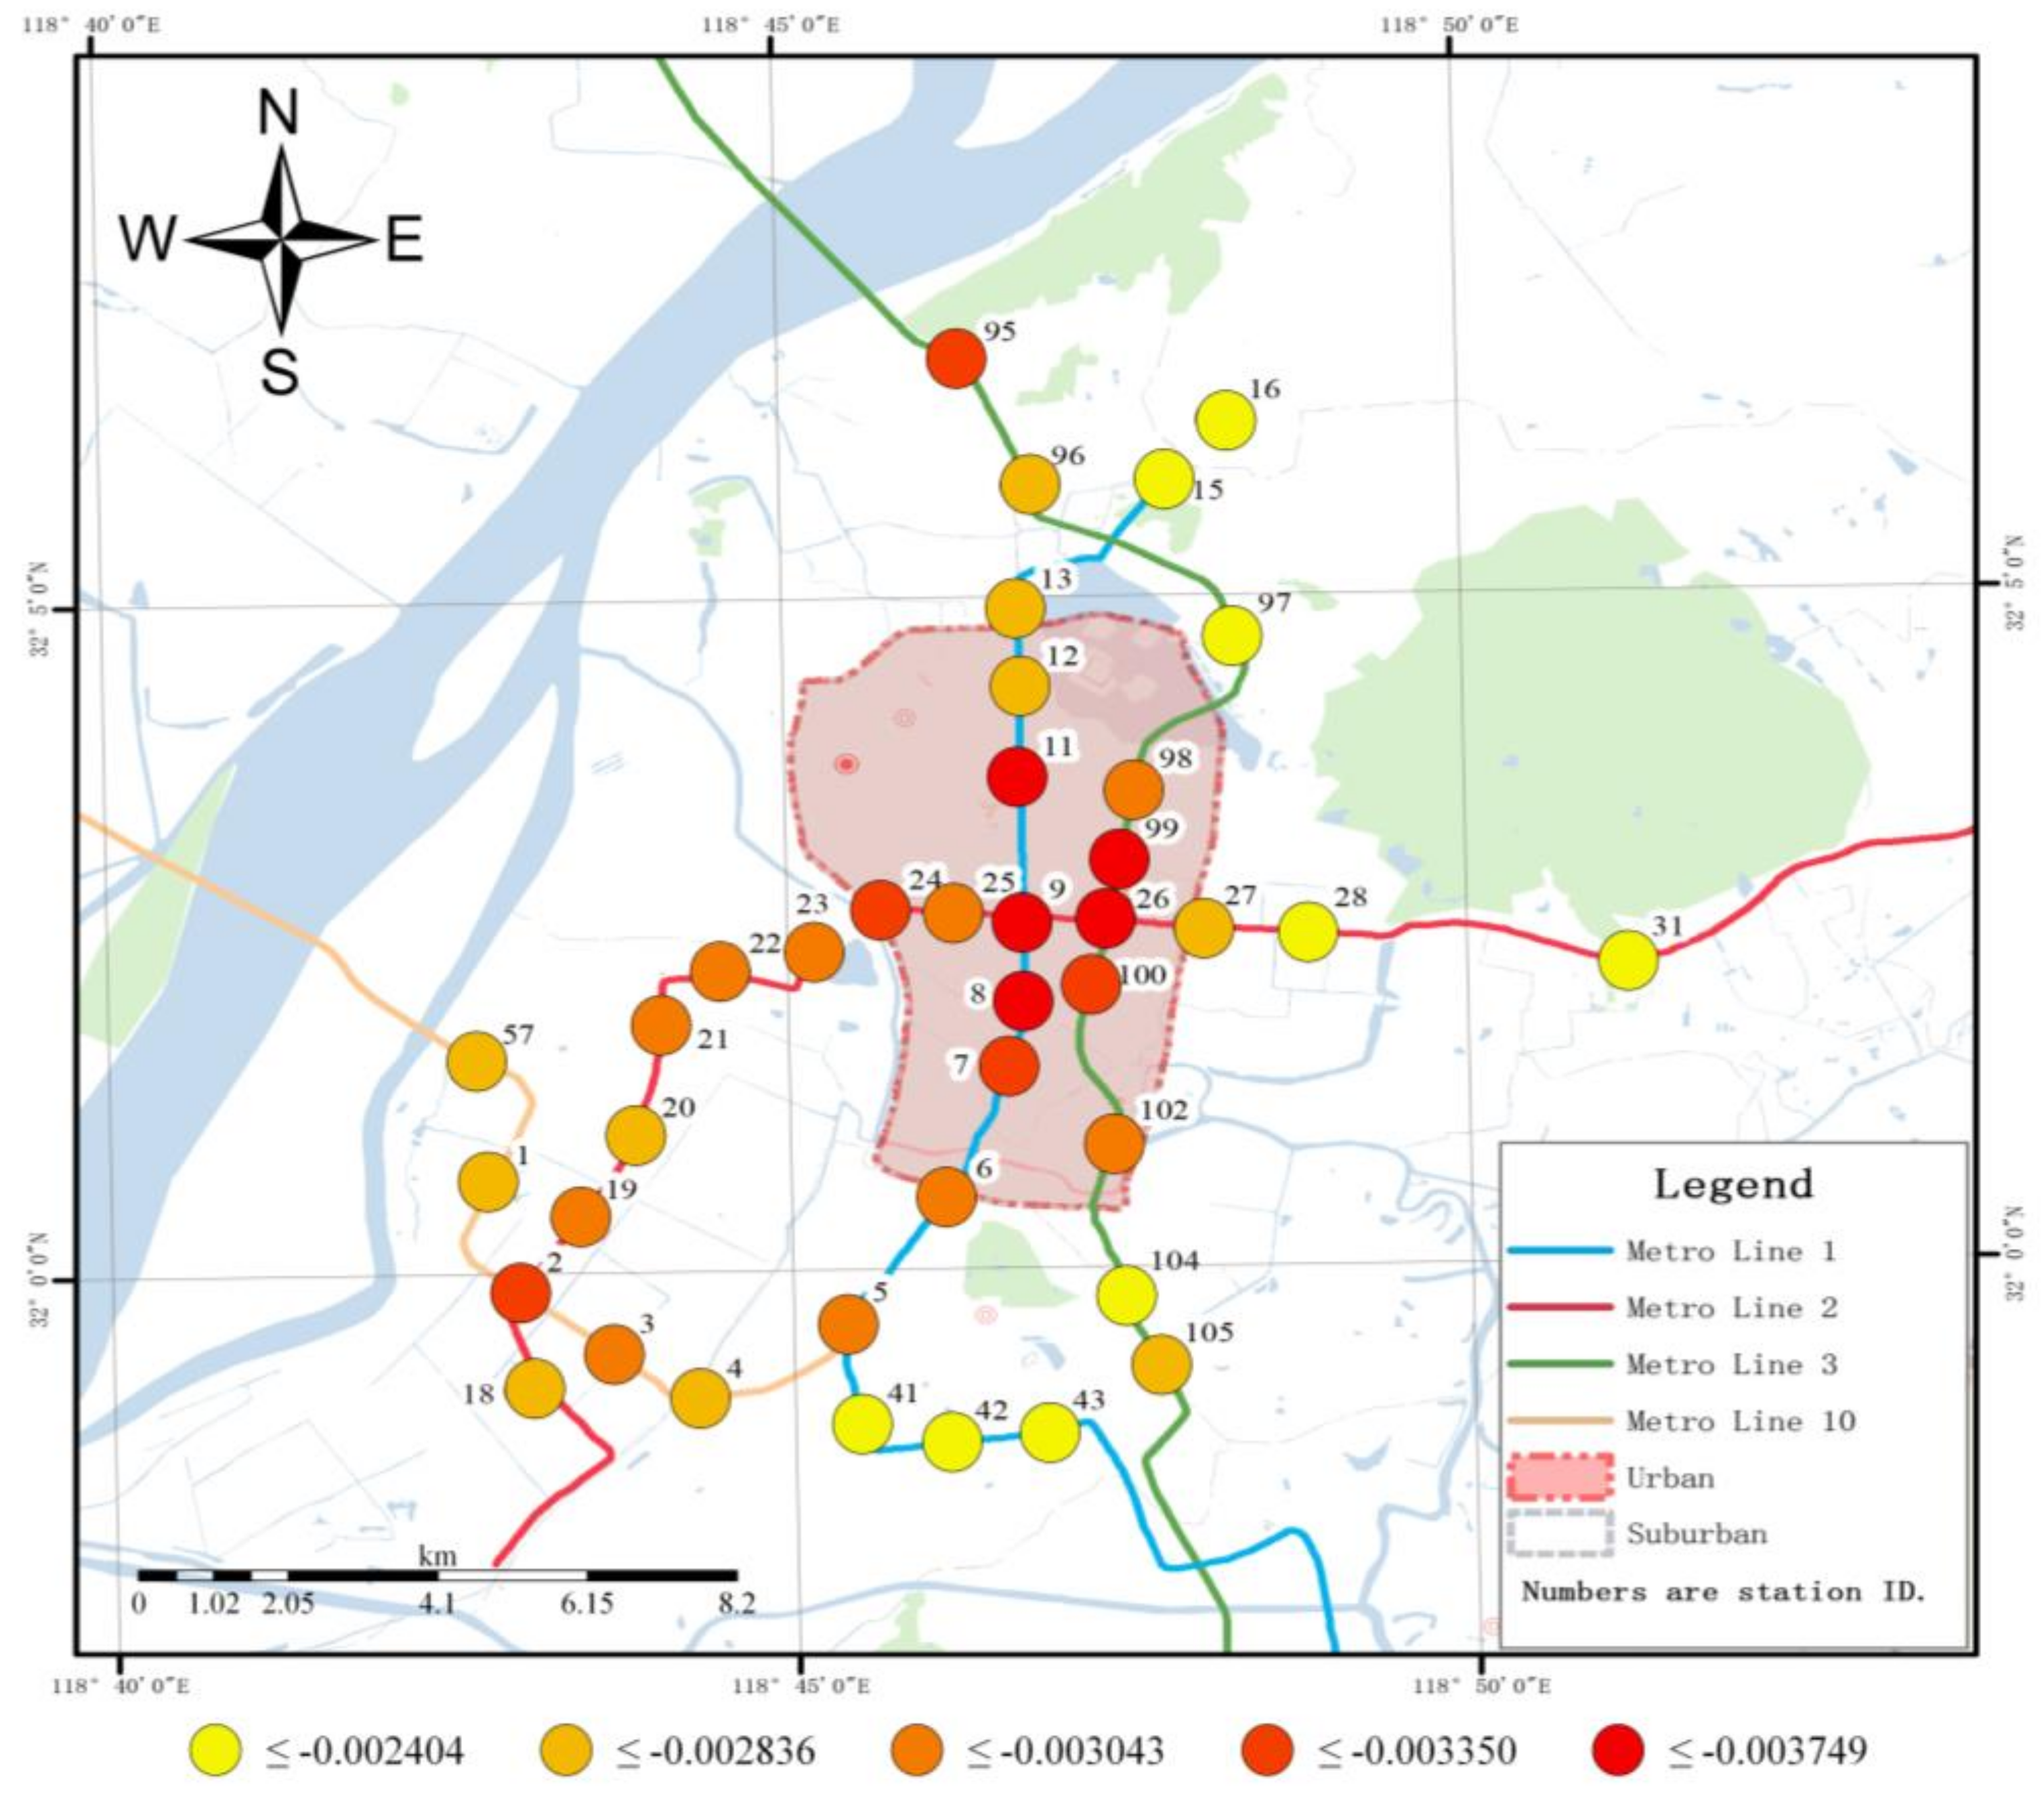
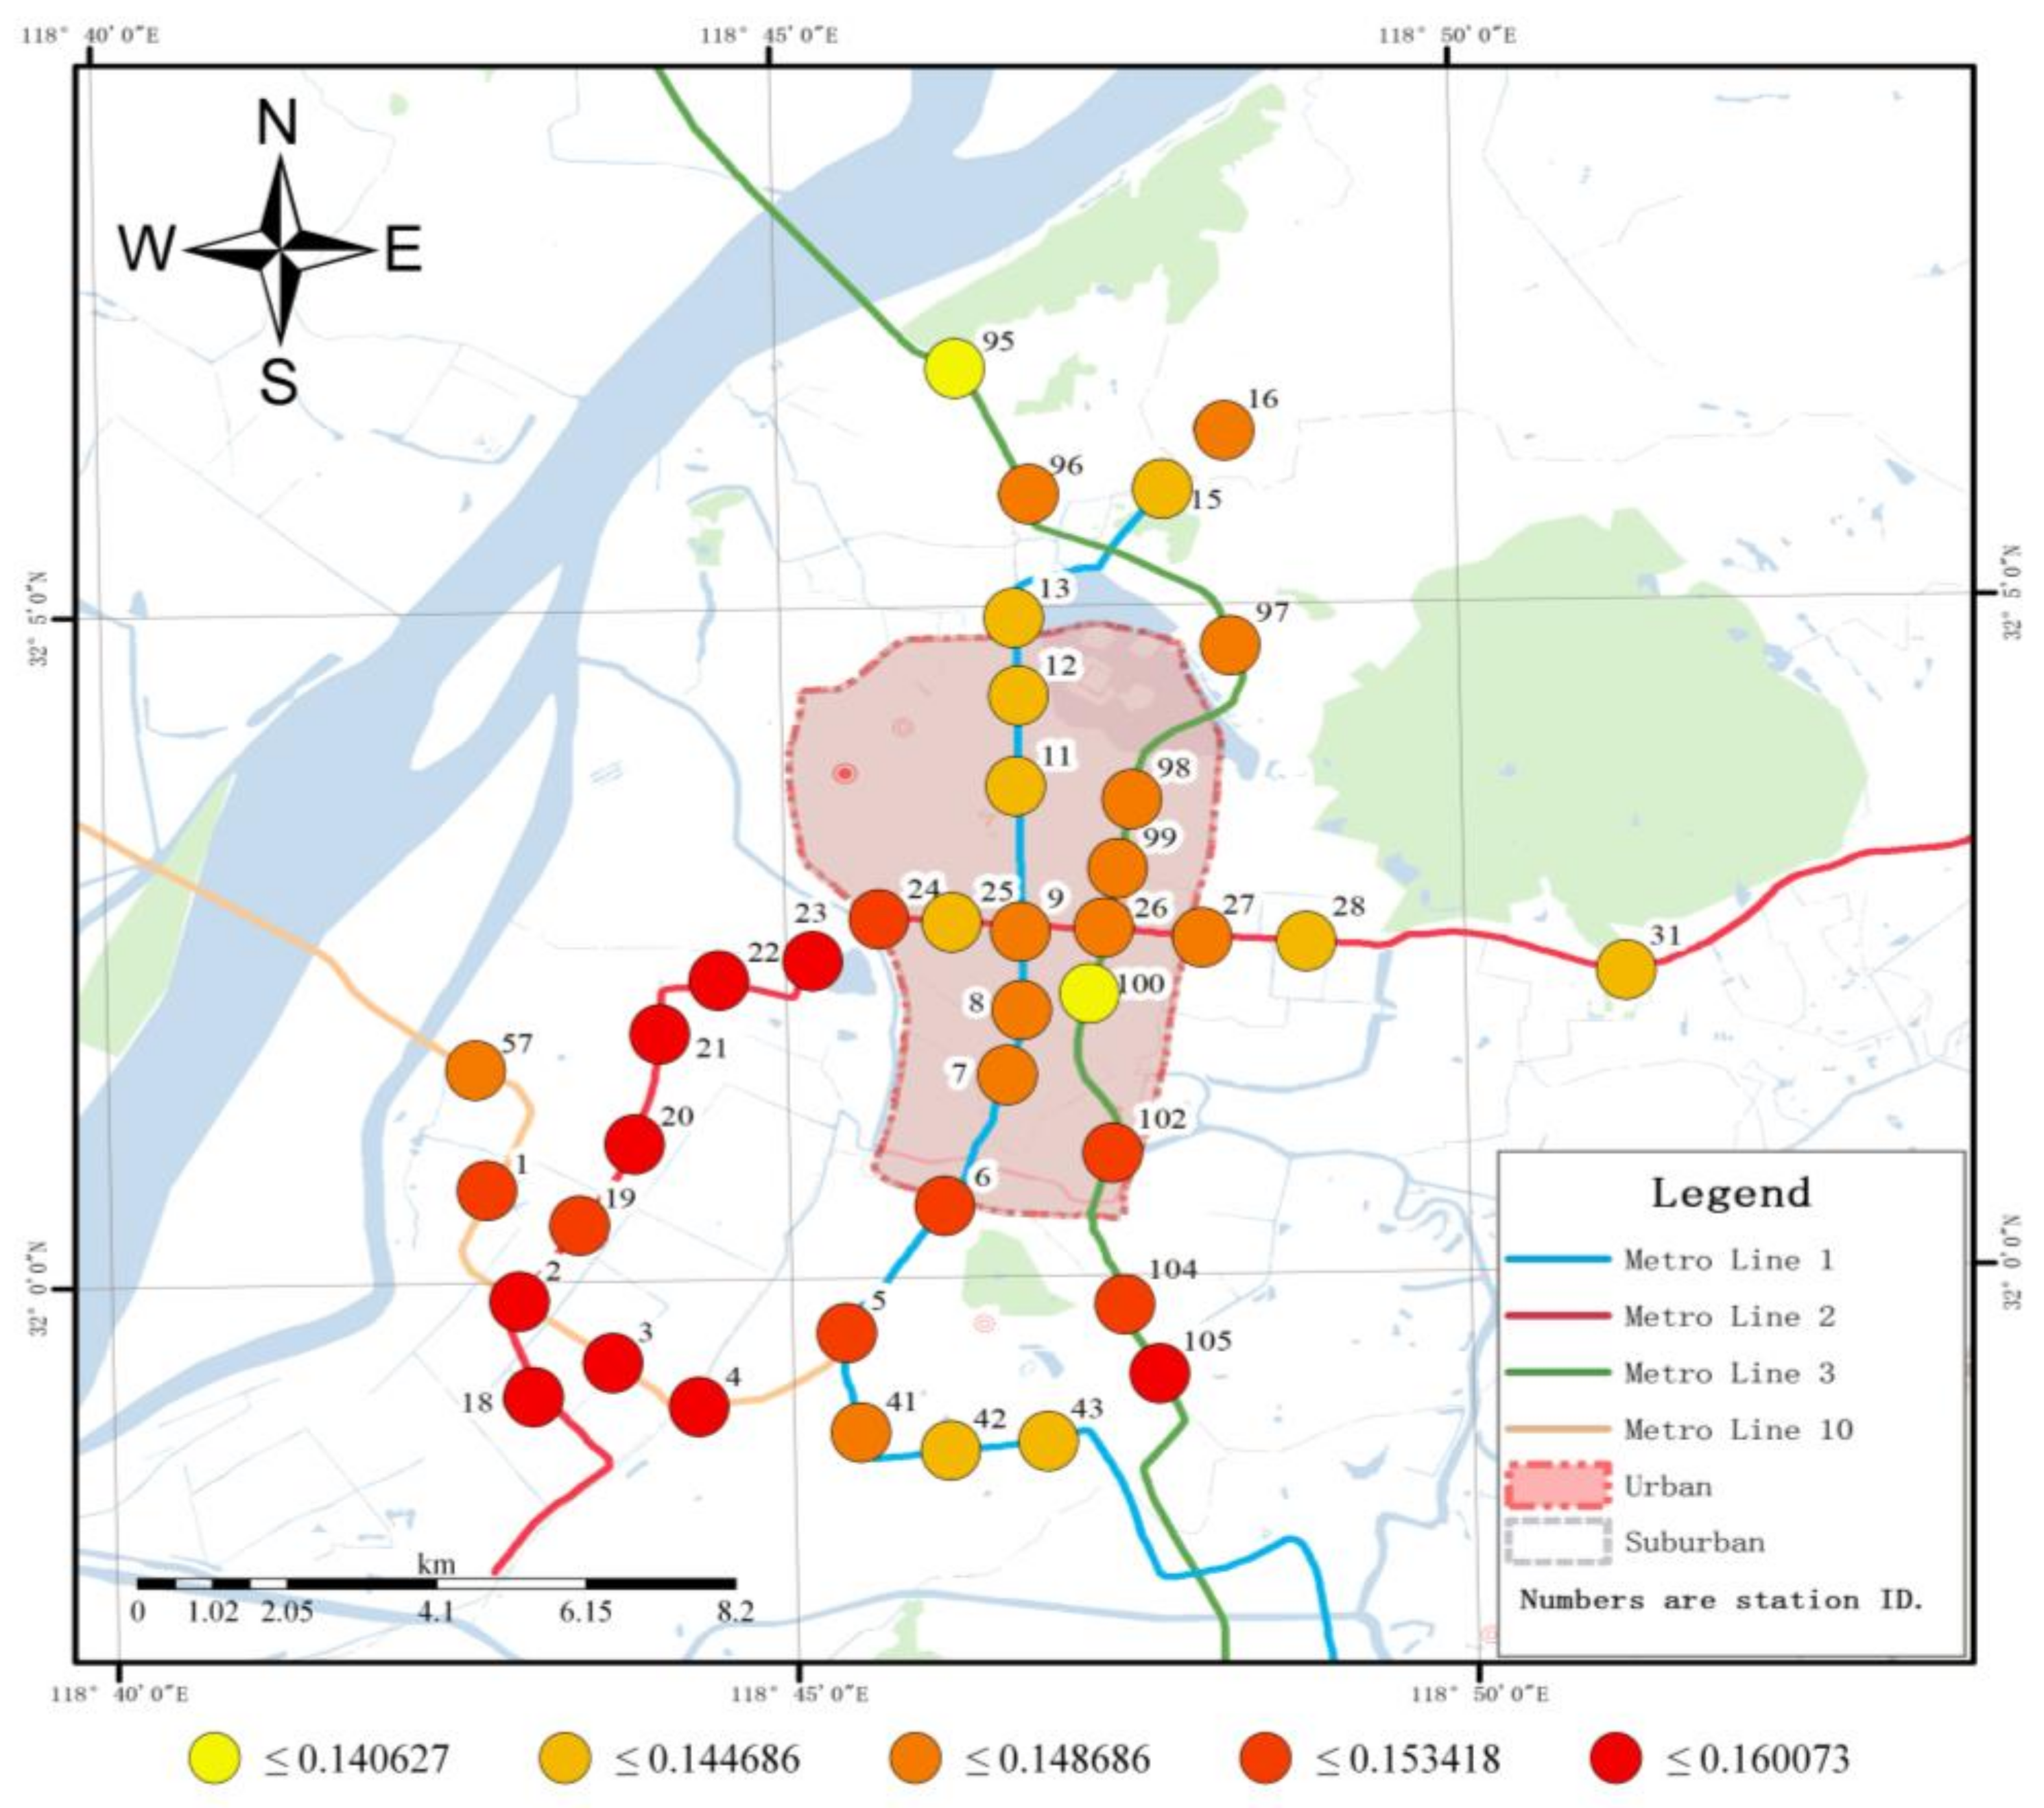
Moreover, the density of bus, bikeshare, and other metro stations within a 2 km radius of a metro station had a great impact on the metro-bikeshare transfer volume. Specifically, bus and other metro stations nearby had a negative correlation with the transfer demand at one metro station. As for spatial patterns, the coefficients of bus and metro stations’ density show similar distributions in
Figure 6 and
Figure 7, reaching peaks in the core urban area. One factor that can explain this finding is the relatively well-developed public transport network, including more bus lines and a higher frequency of each line in urban areas, which makes bus another important feeder mode to metro in addition to bikeshare. When the density of bus stations increases, part of the transfer demand for metro-bikeshare will shift to metro-bus. Furthermore, the density of metro stations has a highly positive relationship with local development level. High density in urban areas often indicates heavy on-road traffic and, therefore, a higher risk of injury when riding bicycles. Thus, the higher the density, the more discouraged is the usage of bikeshare. In light of this, to improve metro-bikeshare service in urban areas, more bike lanes should be built, and illegal occupation of exclusive bicycle lanes by cars should be punished according to the law.
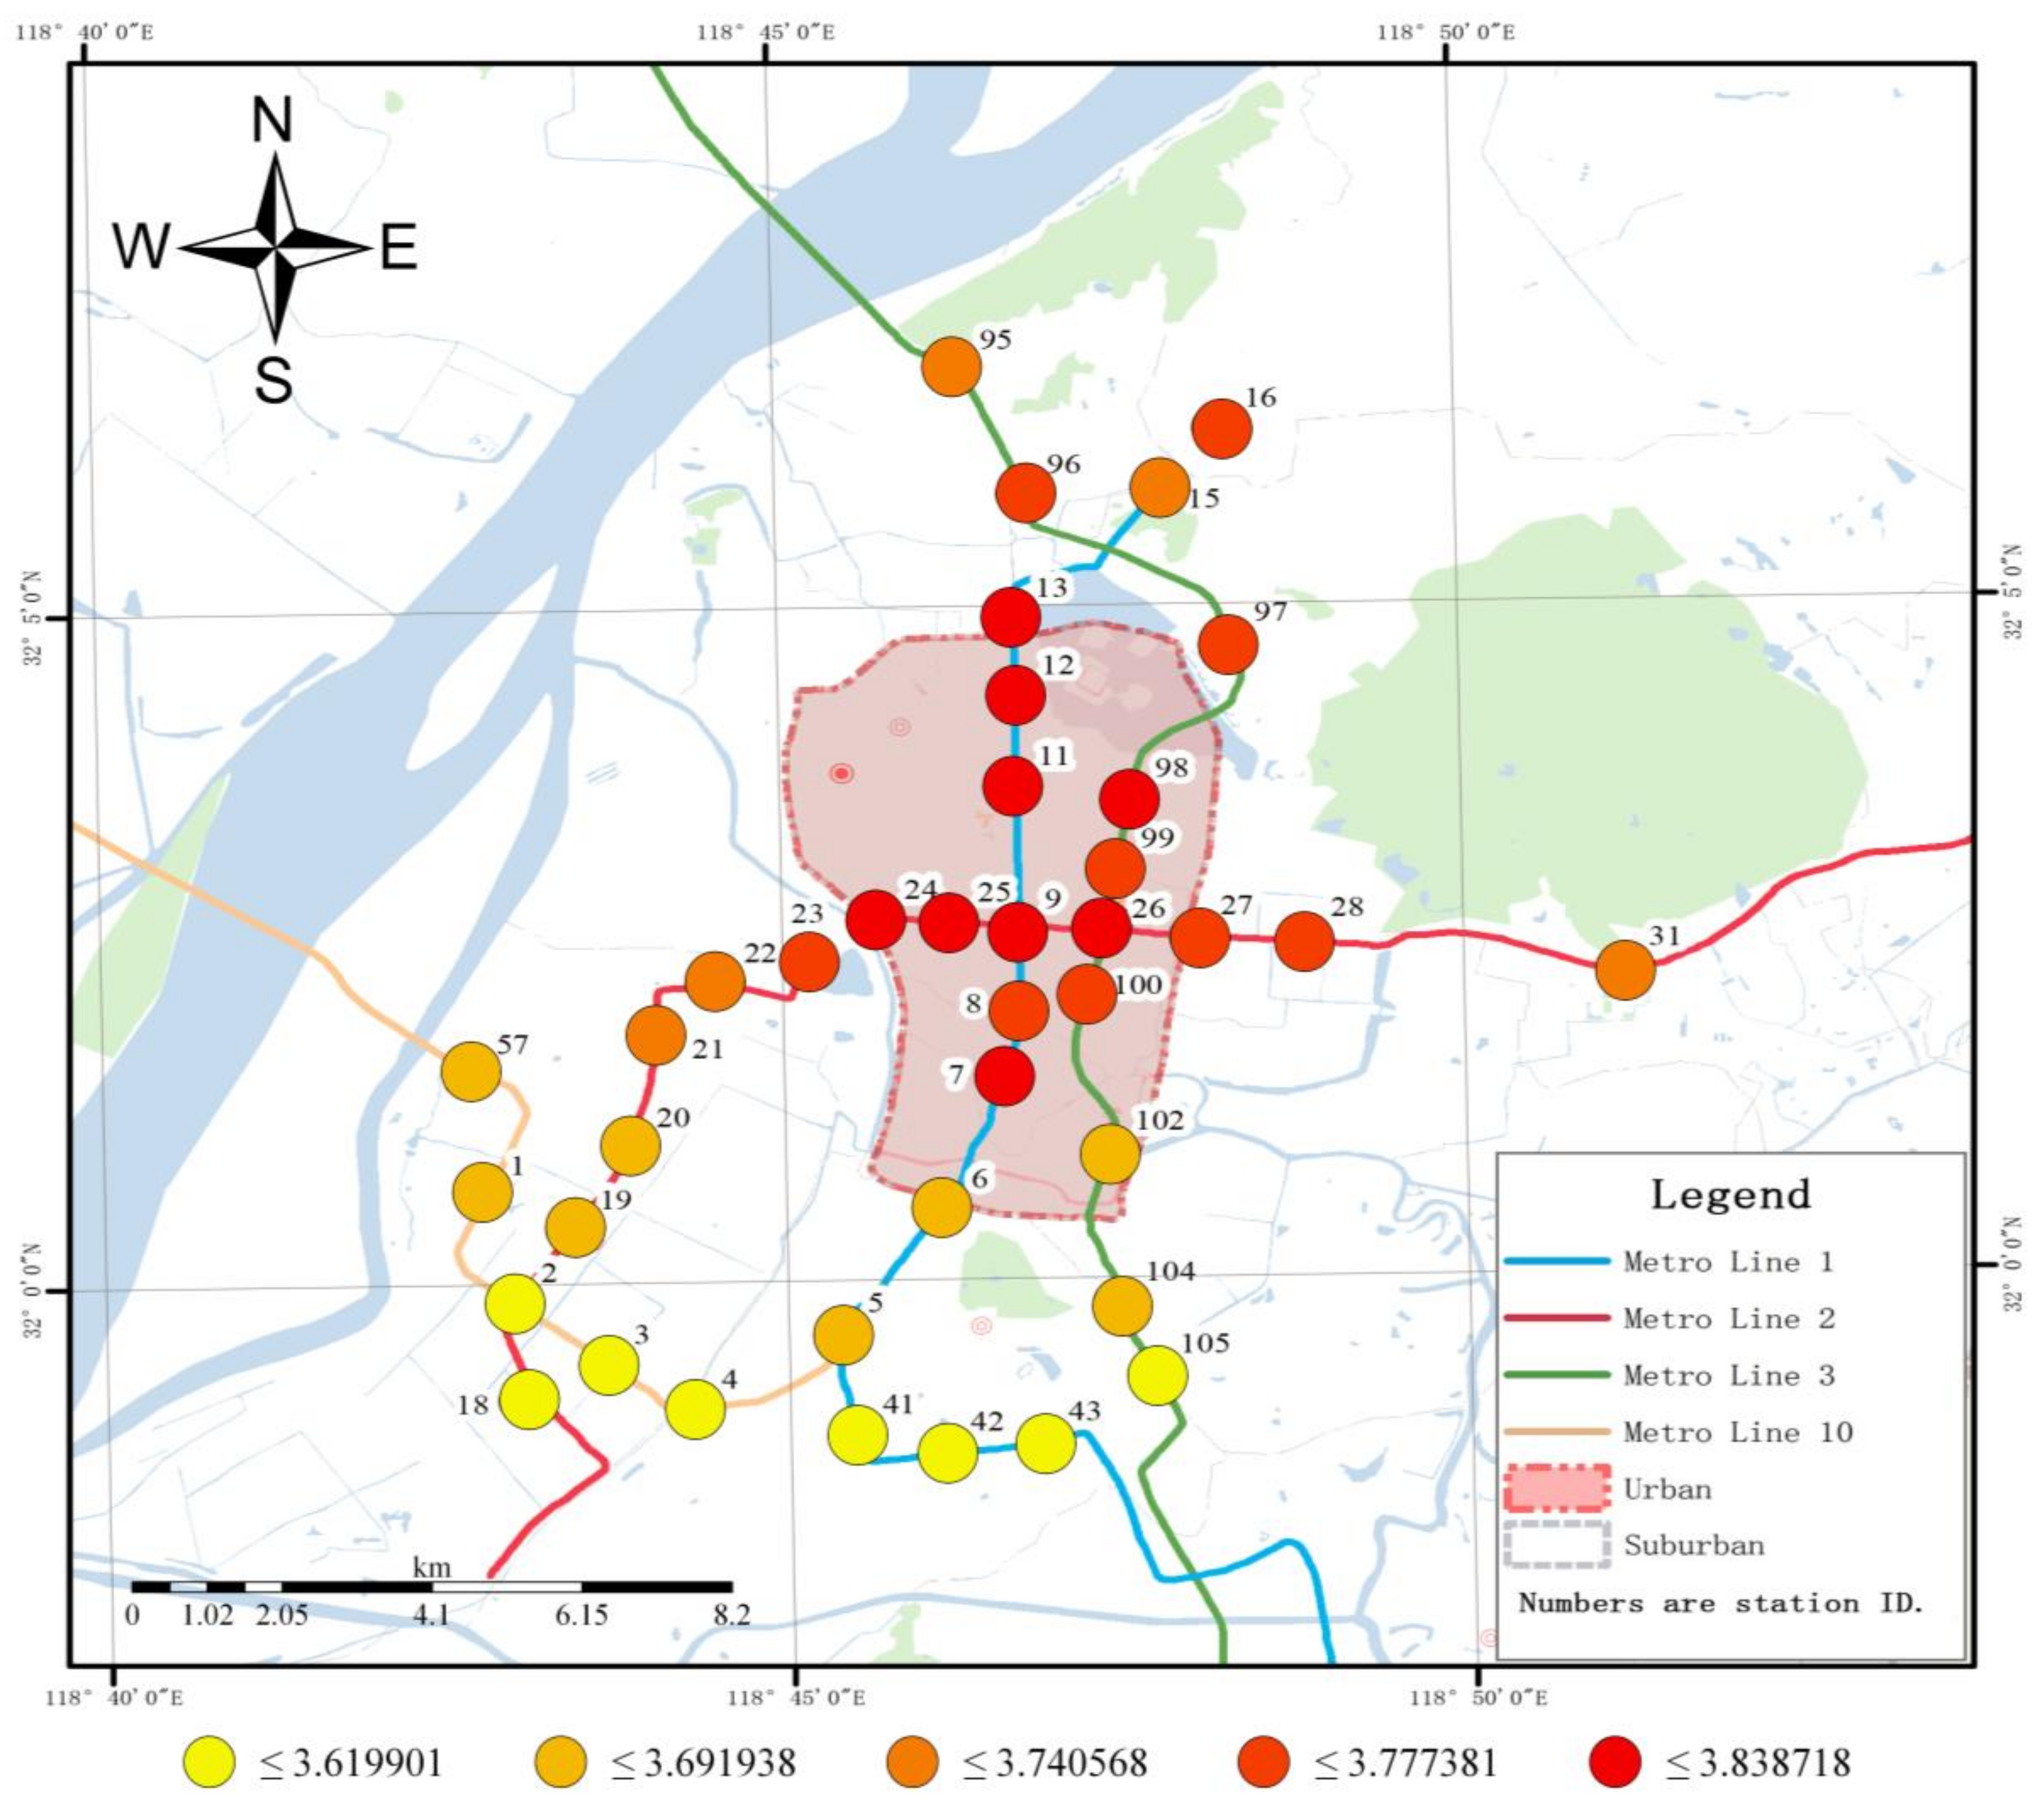
As
Figure 8 shows, the density of bikeshare stations within a 2 km radius of a metro station is found to be positively correlated with metro-bikeshare usage. The coefficient reaches its highest value in the southern regions of suburban areas, which may indicate that the average riding distance in this area is currently quite unsatisfying, and the potential market for metro-bikeshare transfer is great. As a result, more bikeshare stations should be built in suburban areas to shorten the average riding distance and potentially attract more people to apply bikeshare as a feeder mode to metro, consistent with the results of Parkin et al. [
62] and Faghih-Imani A et al. [
63].
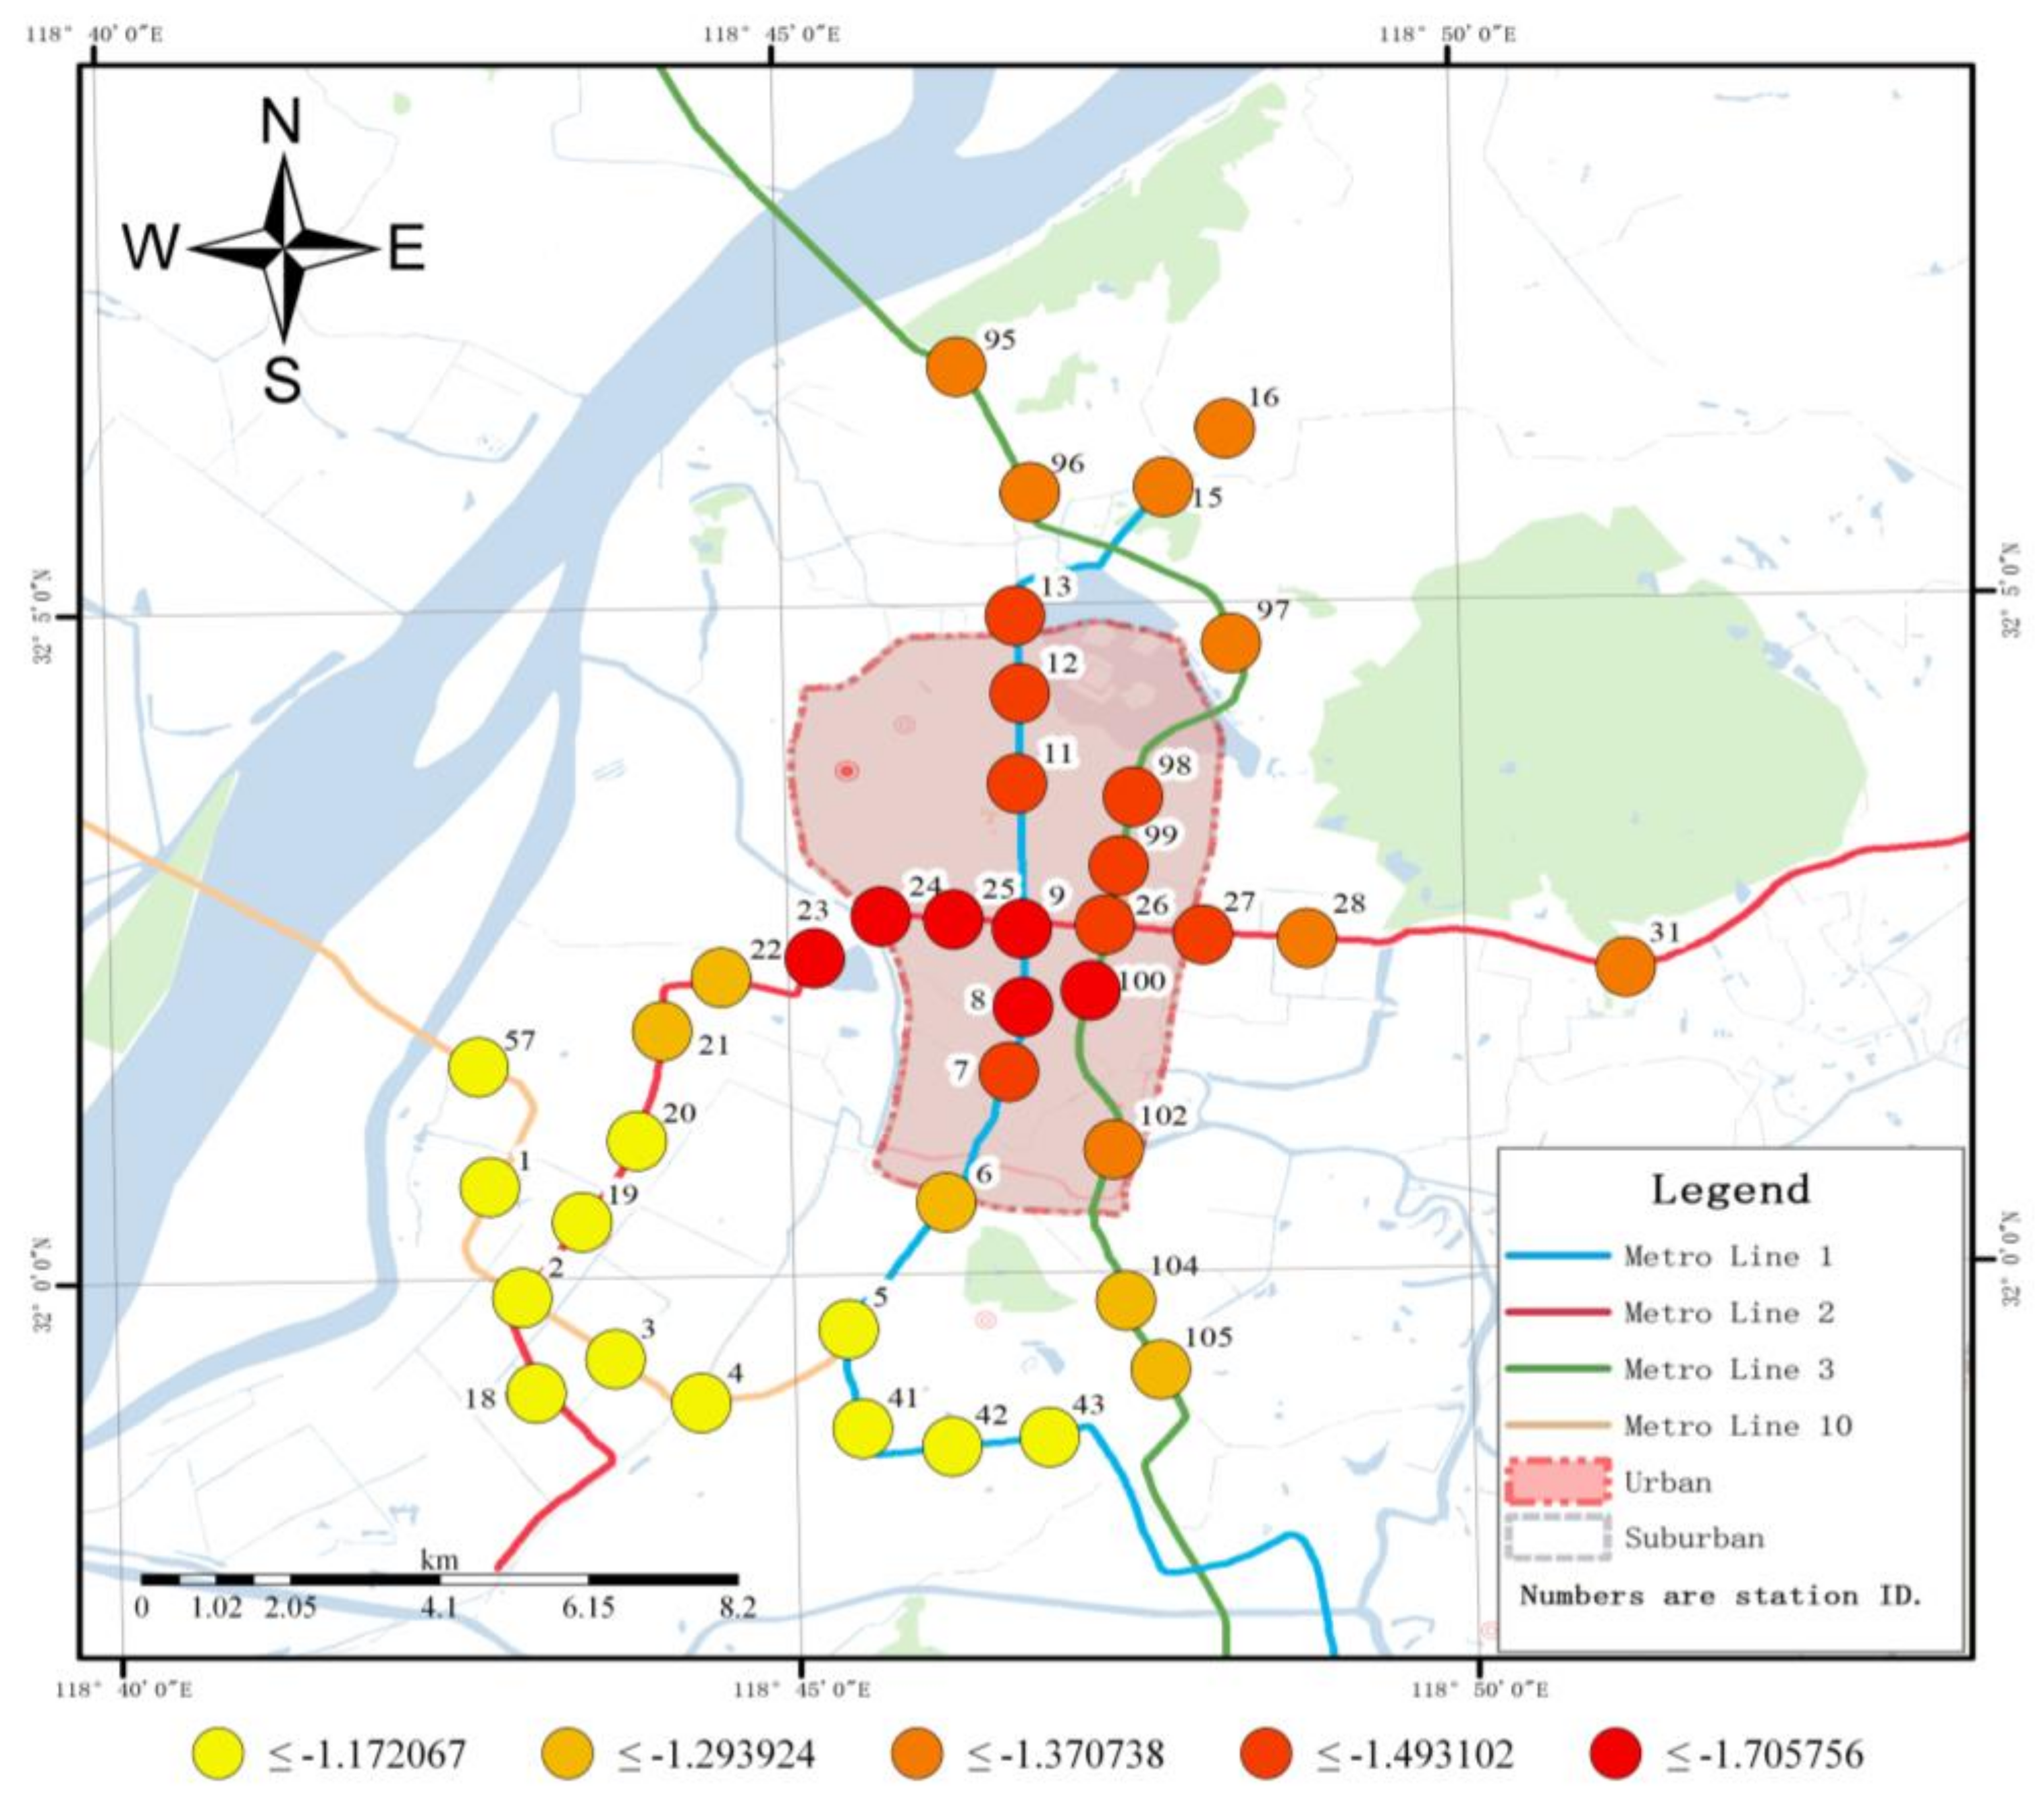
As shown in
Figure 9, the coefficient of entertainment POI was highest in the urban area, especially around Station 9 (XinJieKou metro station), where most of the major shopping centers are located. This result indicates that more recreational area is expected to bring more metro-bikeshare transfers. This finding is intuitive because the traffic conditions around the entertainment POI are congested, especially during peak transit hours. The relatively higher density of bikeshare stations in urban areas improves the accessibility of bikeshare. Passengers who prefer cheaper and time-saving travel modes are more likely to choose bikeshare to reach entertainment destinations. On the other hand, the roads in suburban areas are mainly built for the sake of motorized vehicles, and metro stations in suburban areas fail to serve many large-scale entertainment sites, so that people must arrive there by car or taxi. Few people are willing to choose the bikeshare-metro travel mode for entertainment in suburban districts, principally due to the low density of metro stations. Therefore, it is suggested that the government should increase metro stations in suburban districts to improve the accessibility of some entertainment places, which will in turn attract more people to choose the metro-bikeshare travel mode.


