The Economic Effect of Virtual Warehouse-Based Inventory Information Sharing for Sustainable Supplier Management
Abstract
:1. Introduction
2. Literature Survey
2.1. Sustainable Supplier Management through Manufacturer-Supplier Partnerships
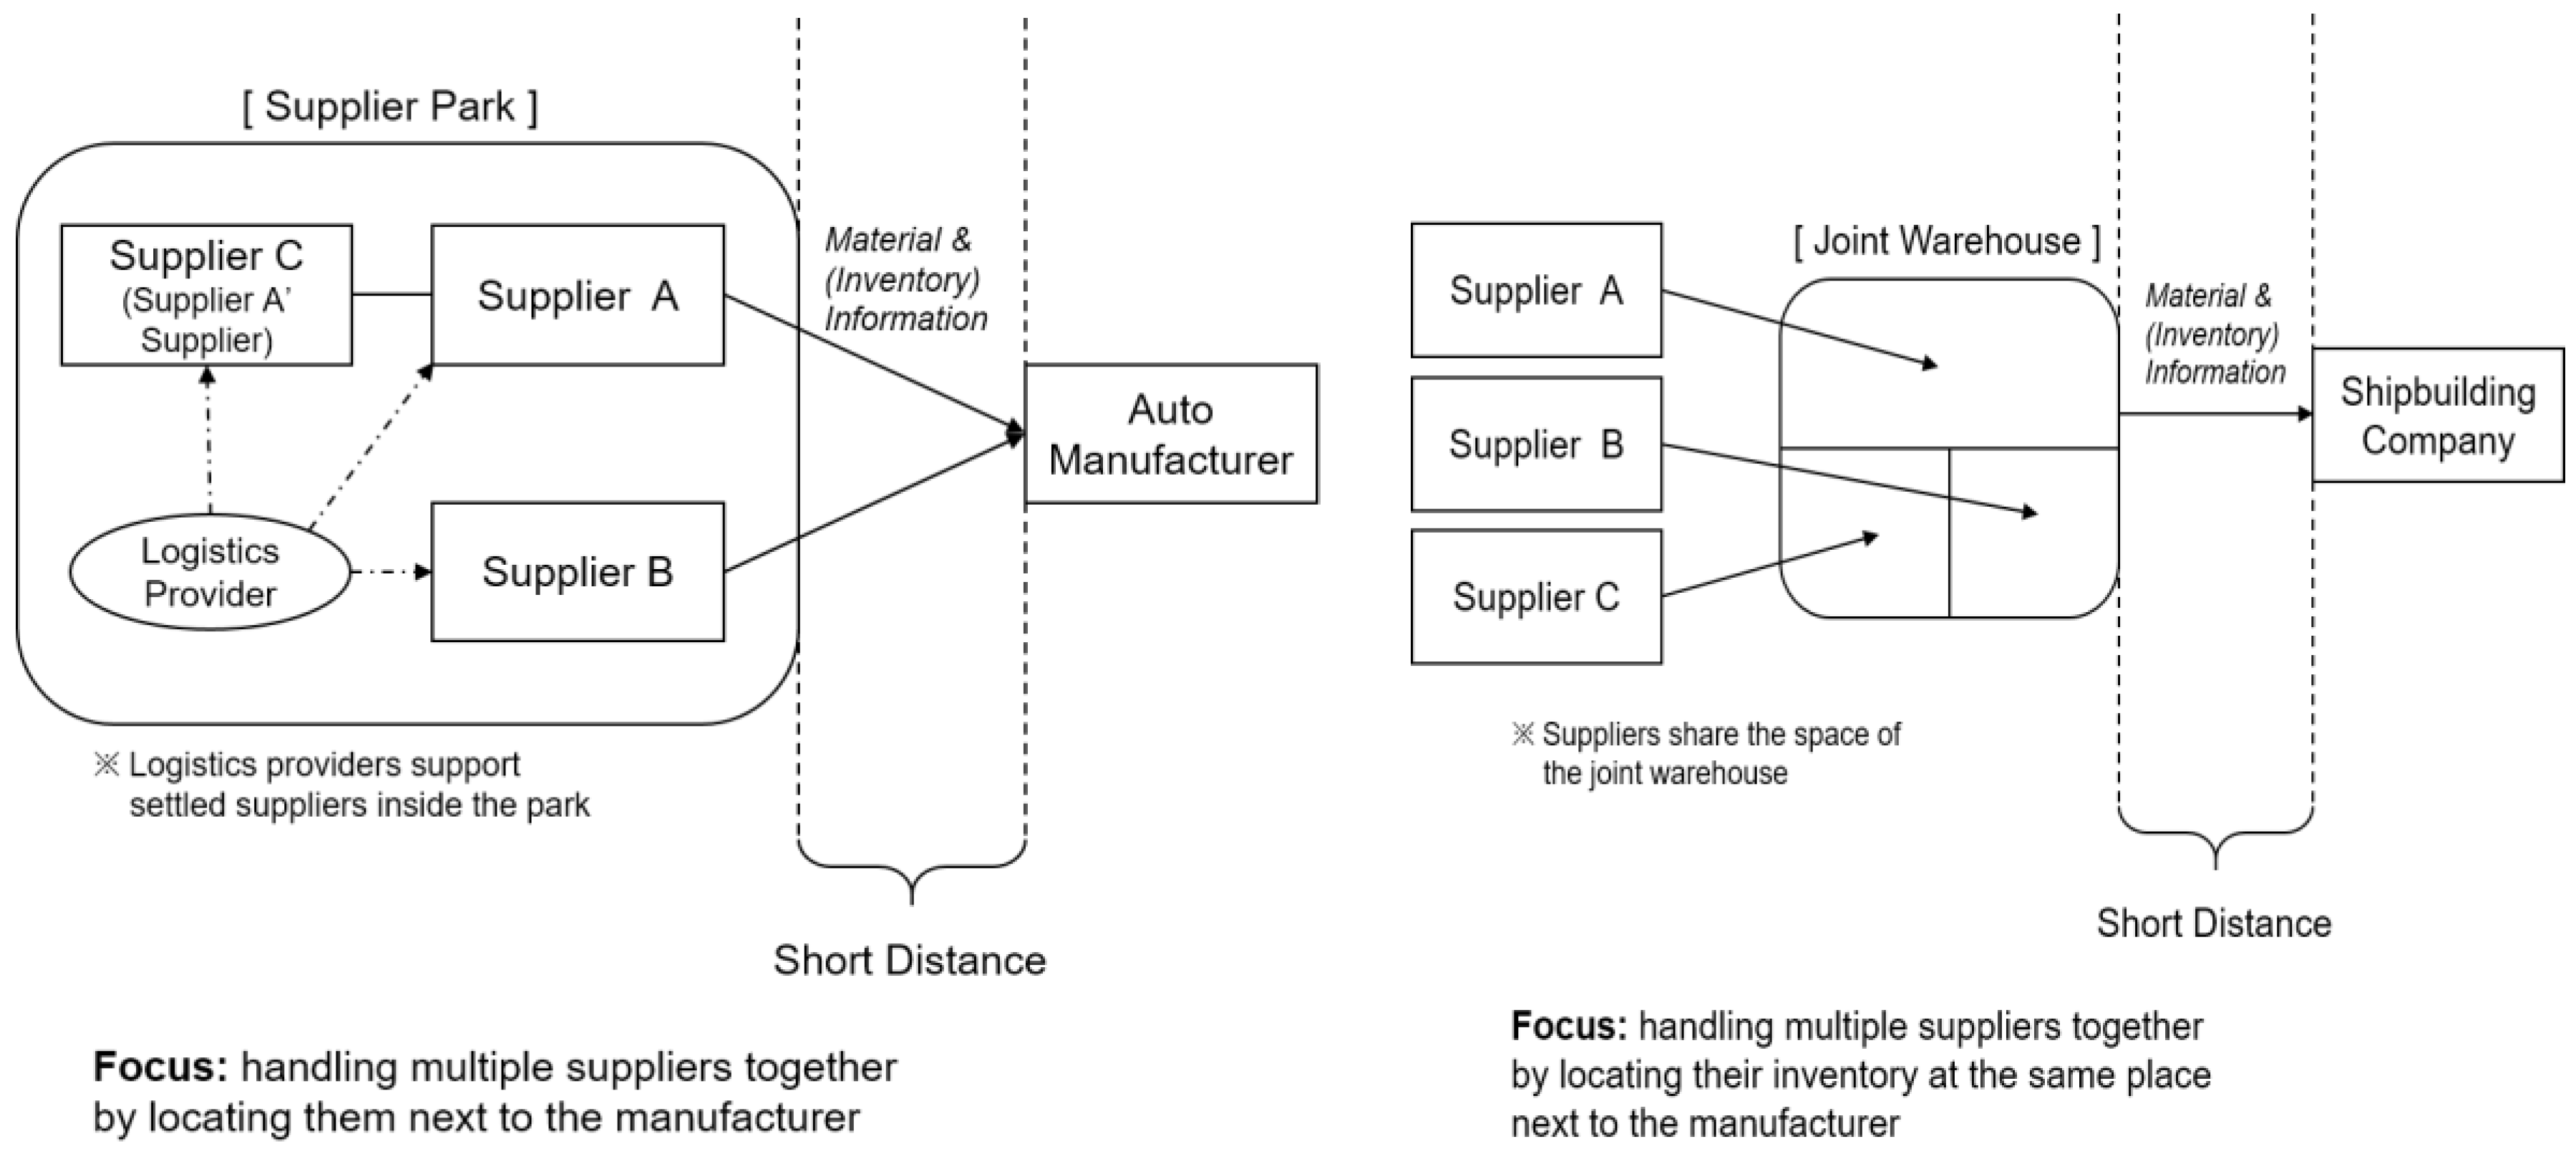
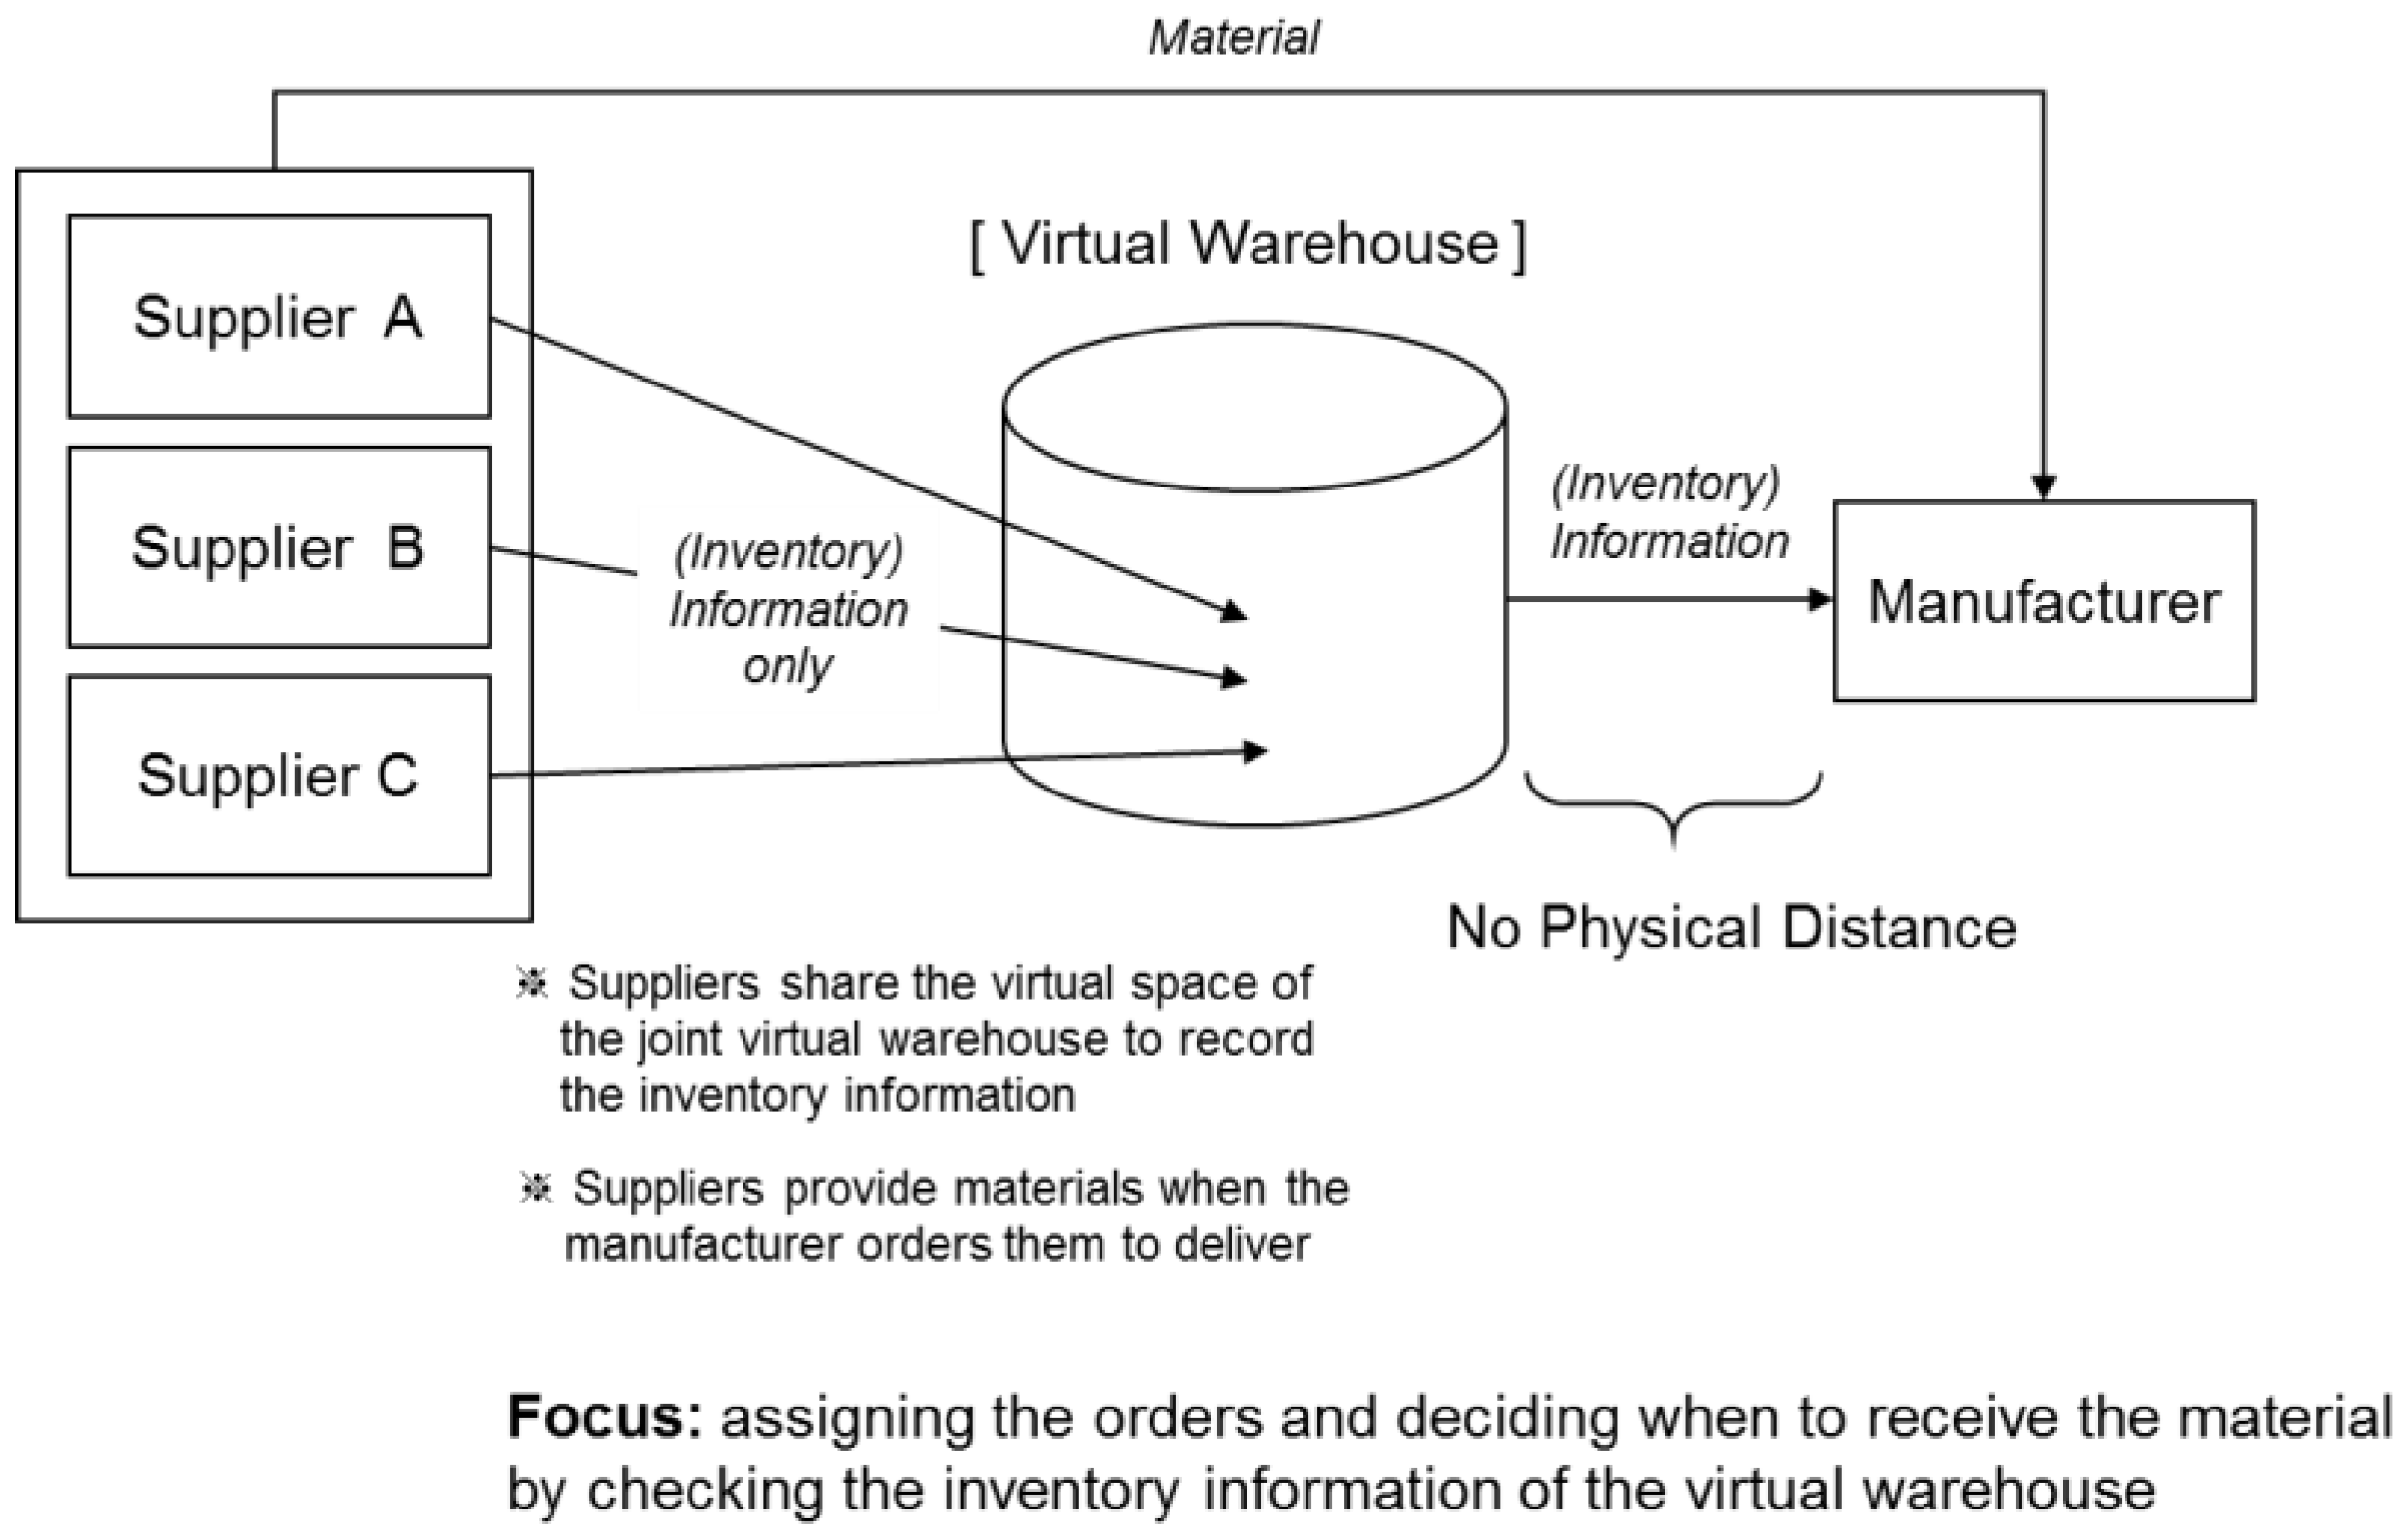
2.2. Virtual Warehouse
2.3. System Dynamics-Based Simulation
3. Case Study
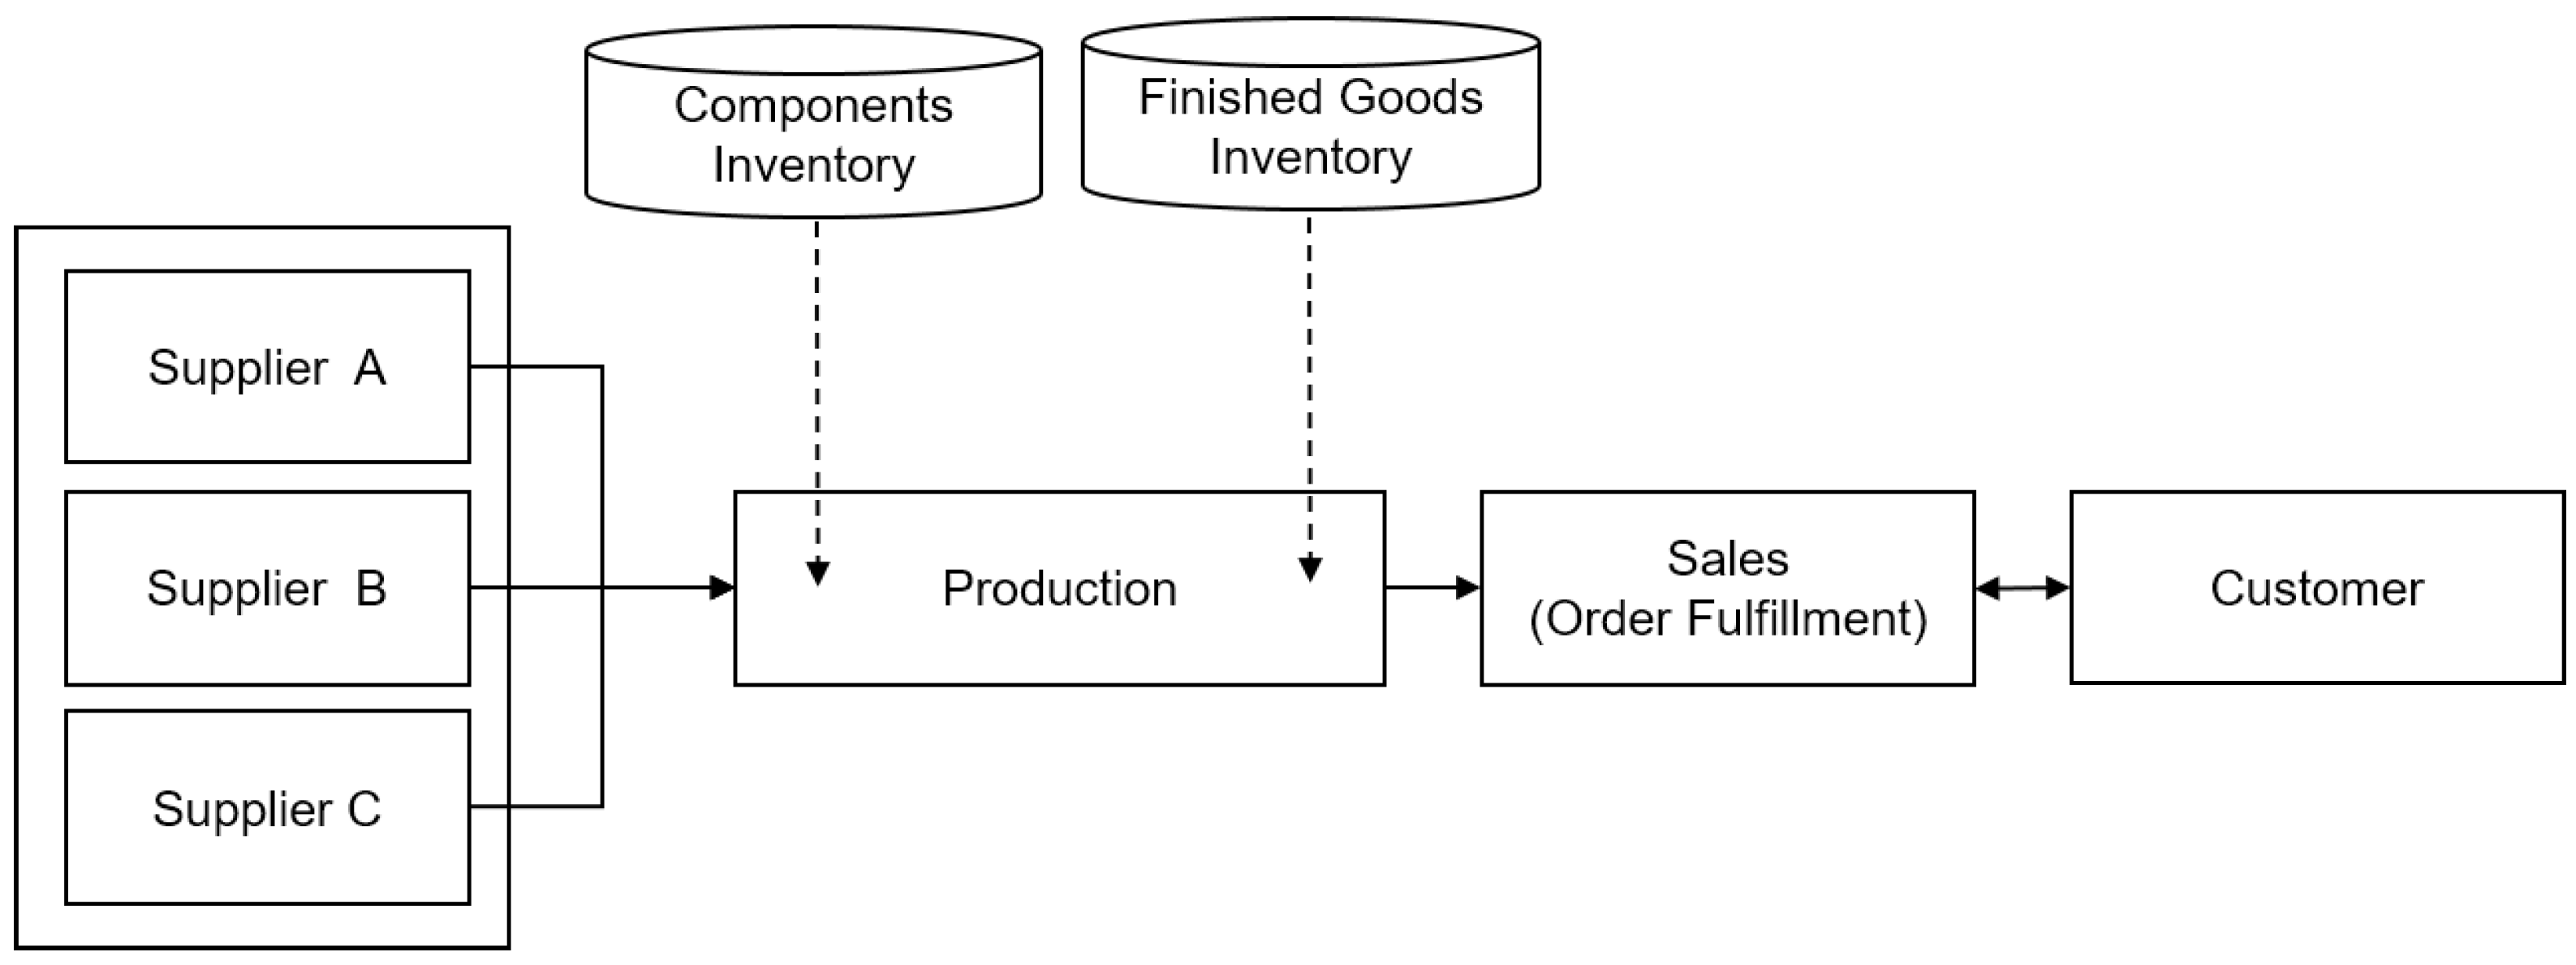
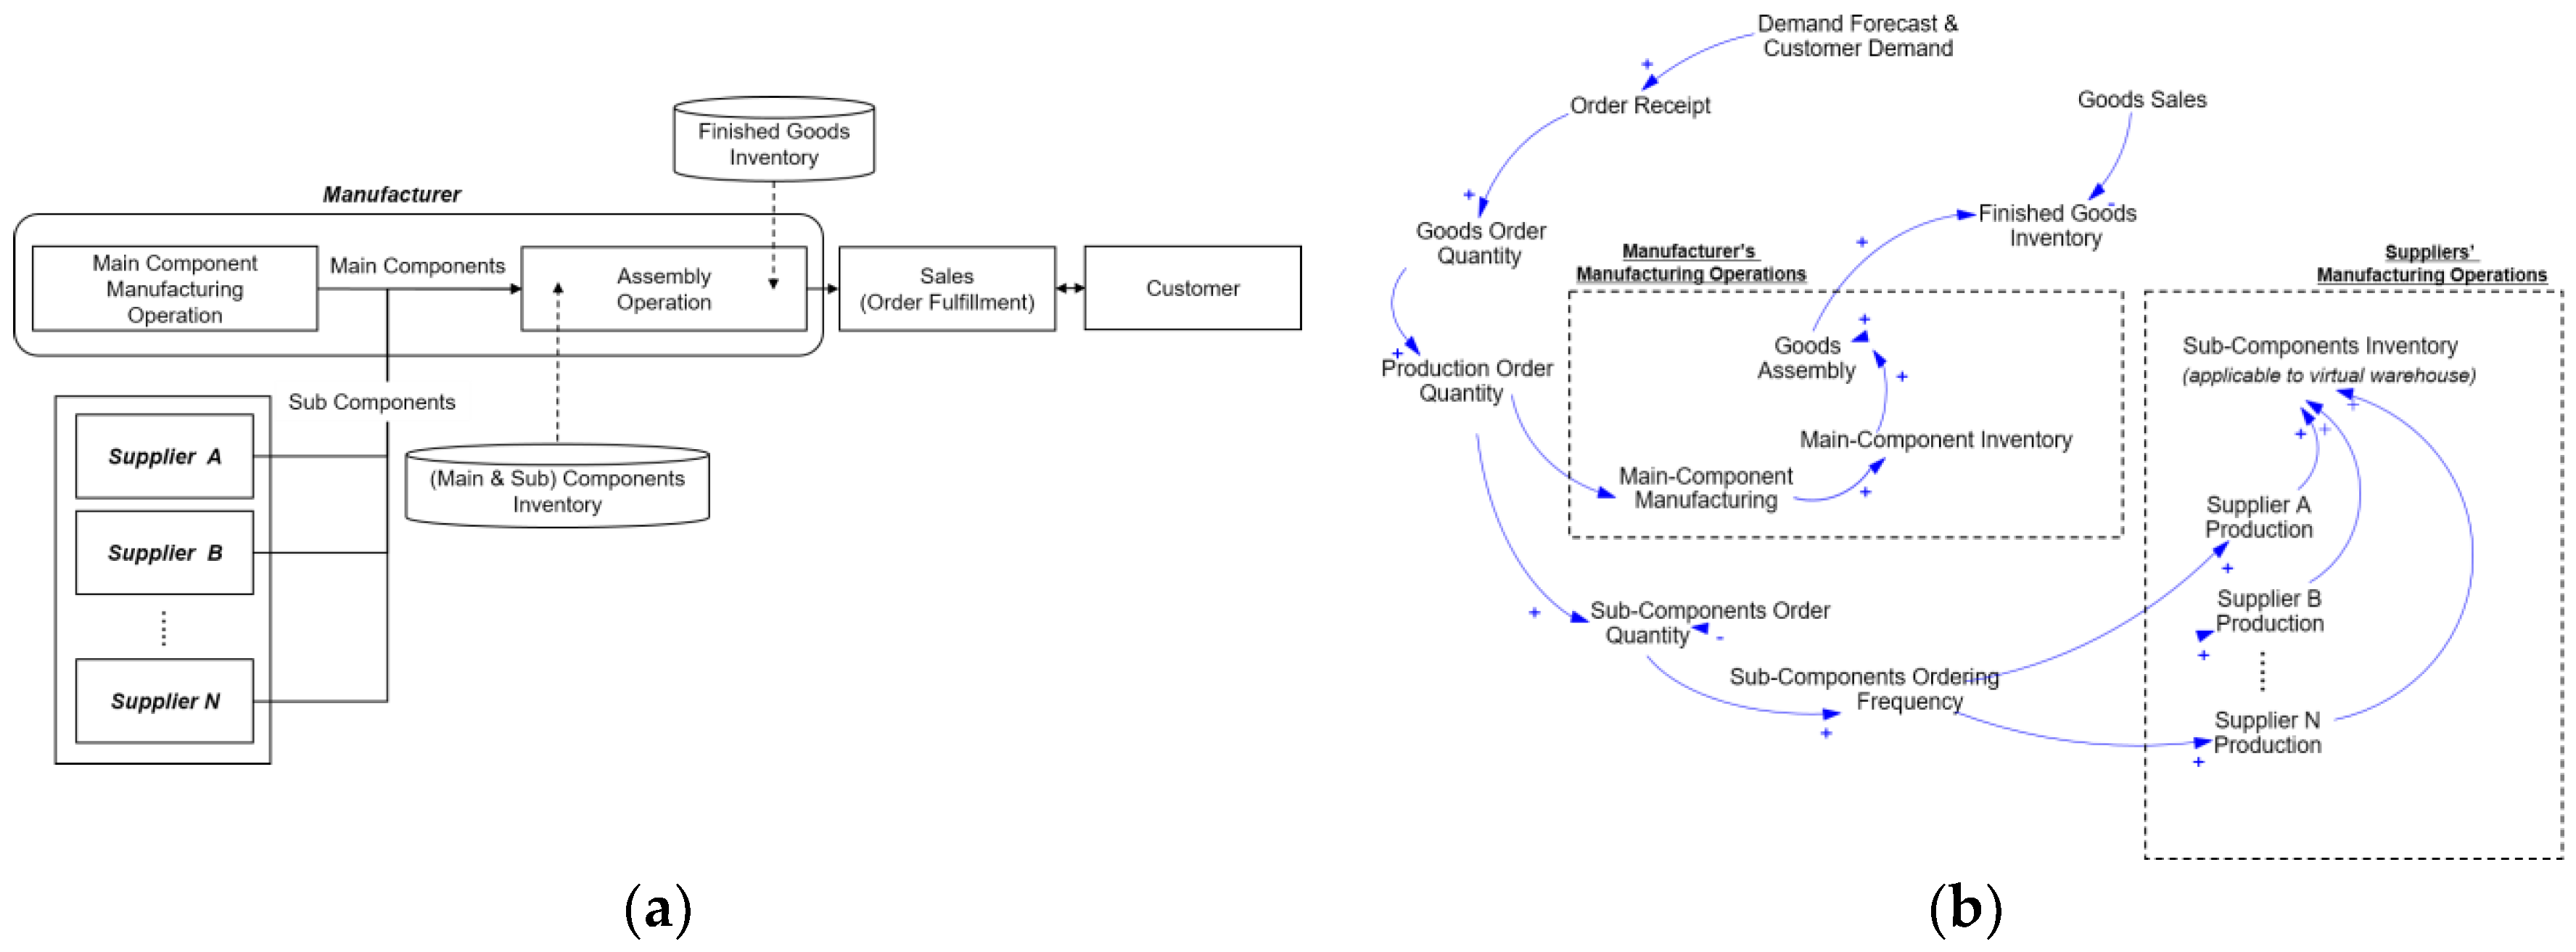
3.1. The Supply Chain Flow of Company H
3.2. Causal Diagram
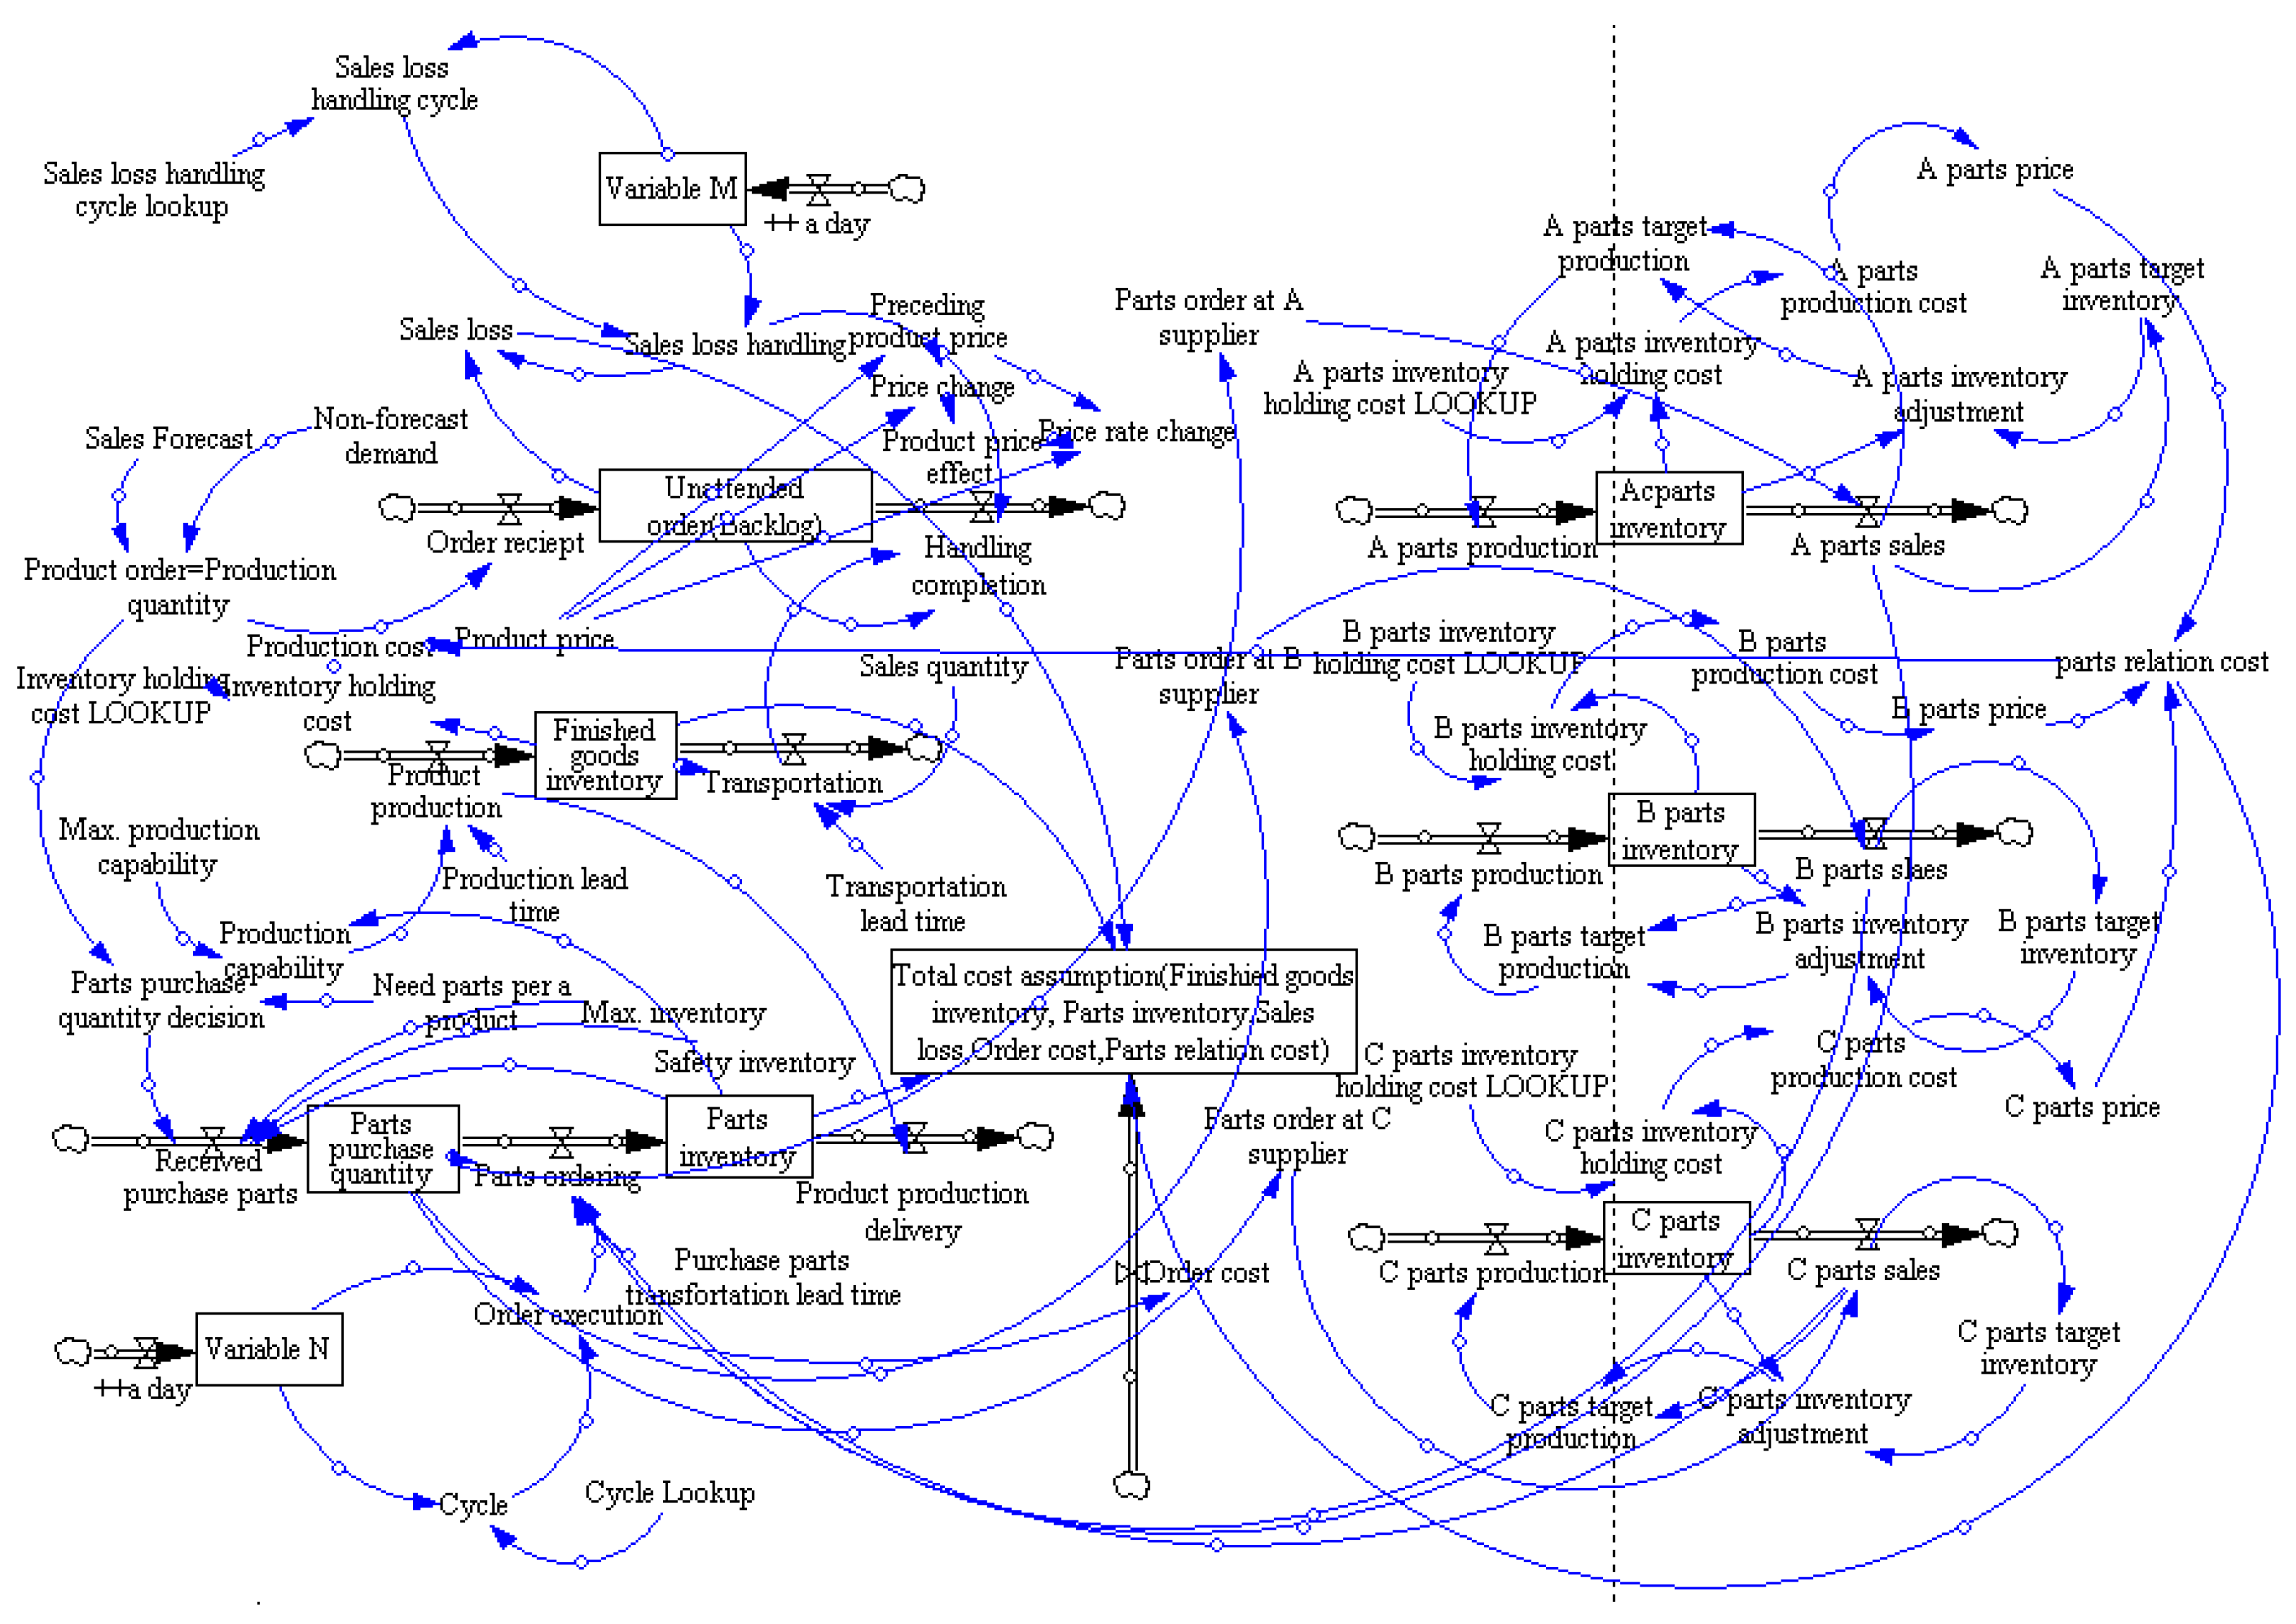
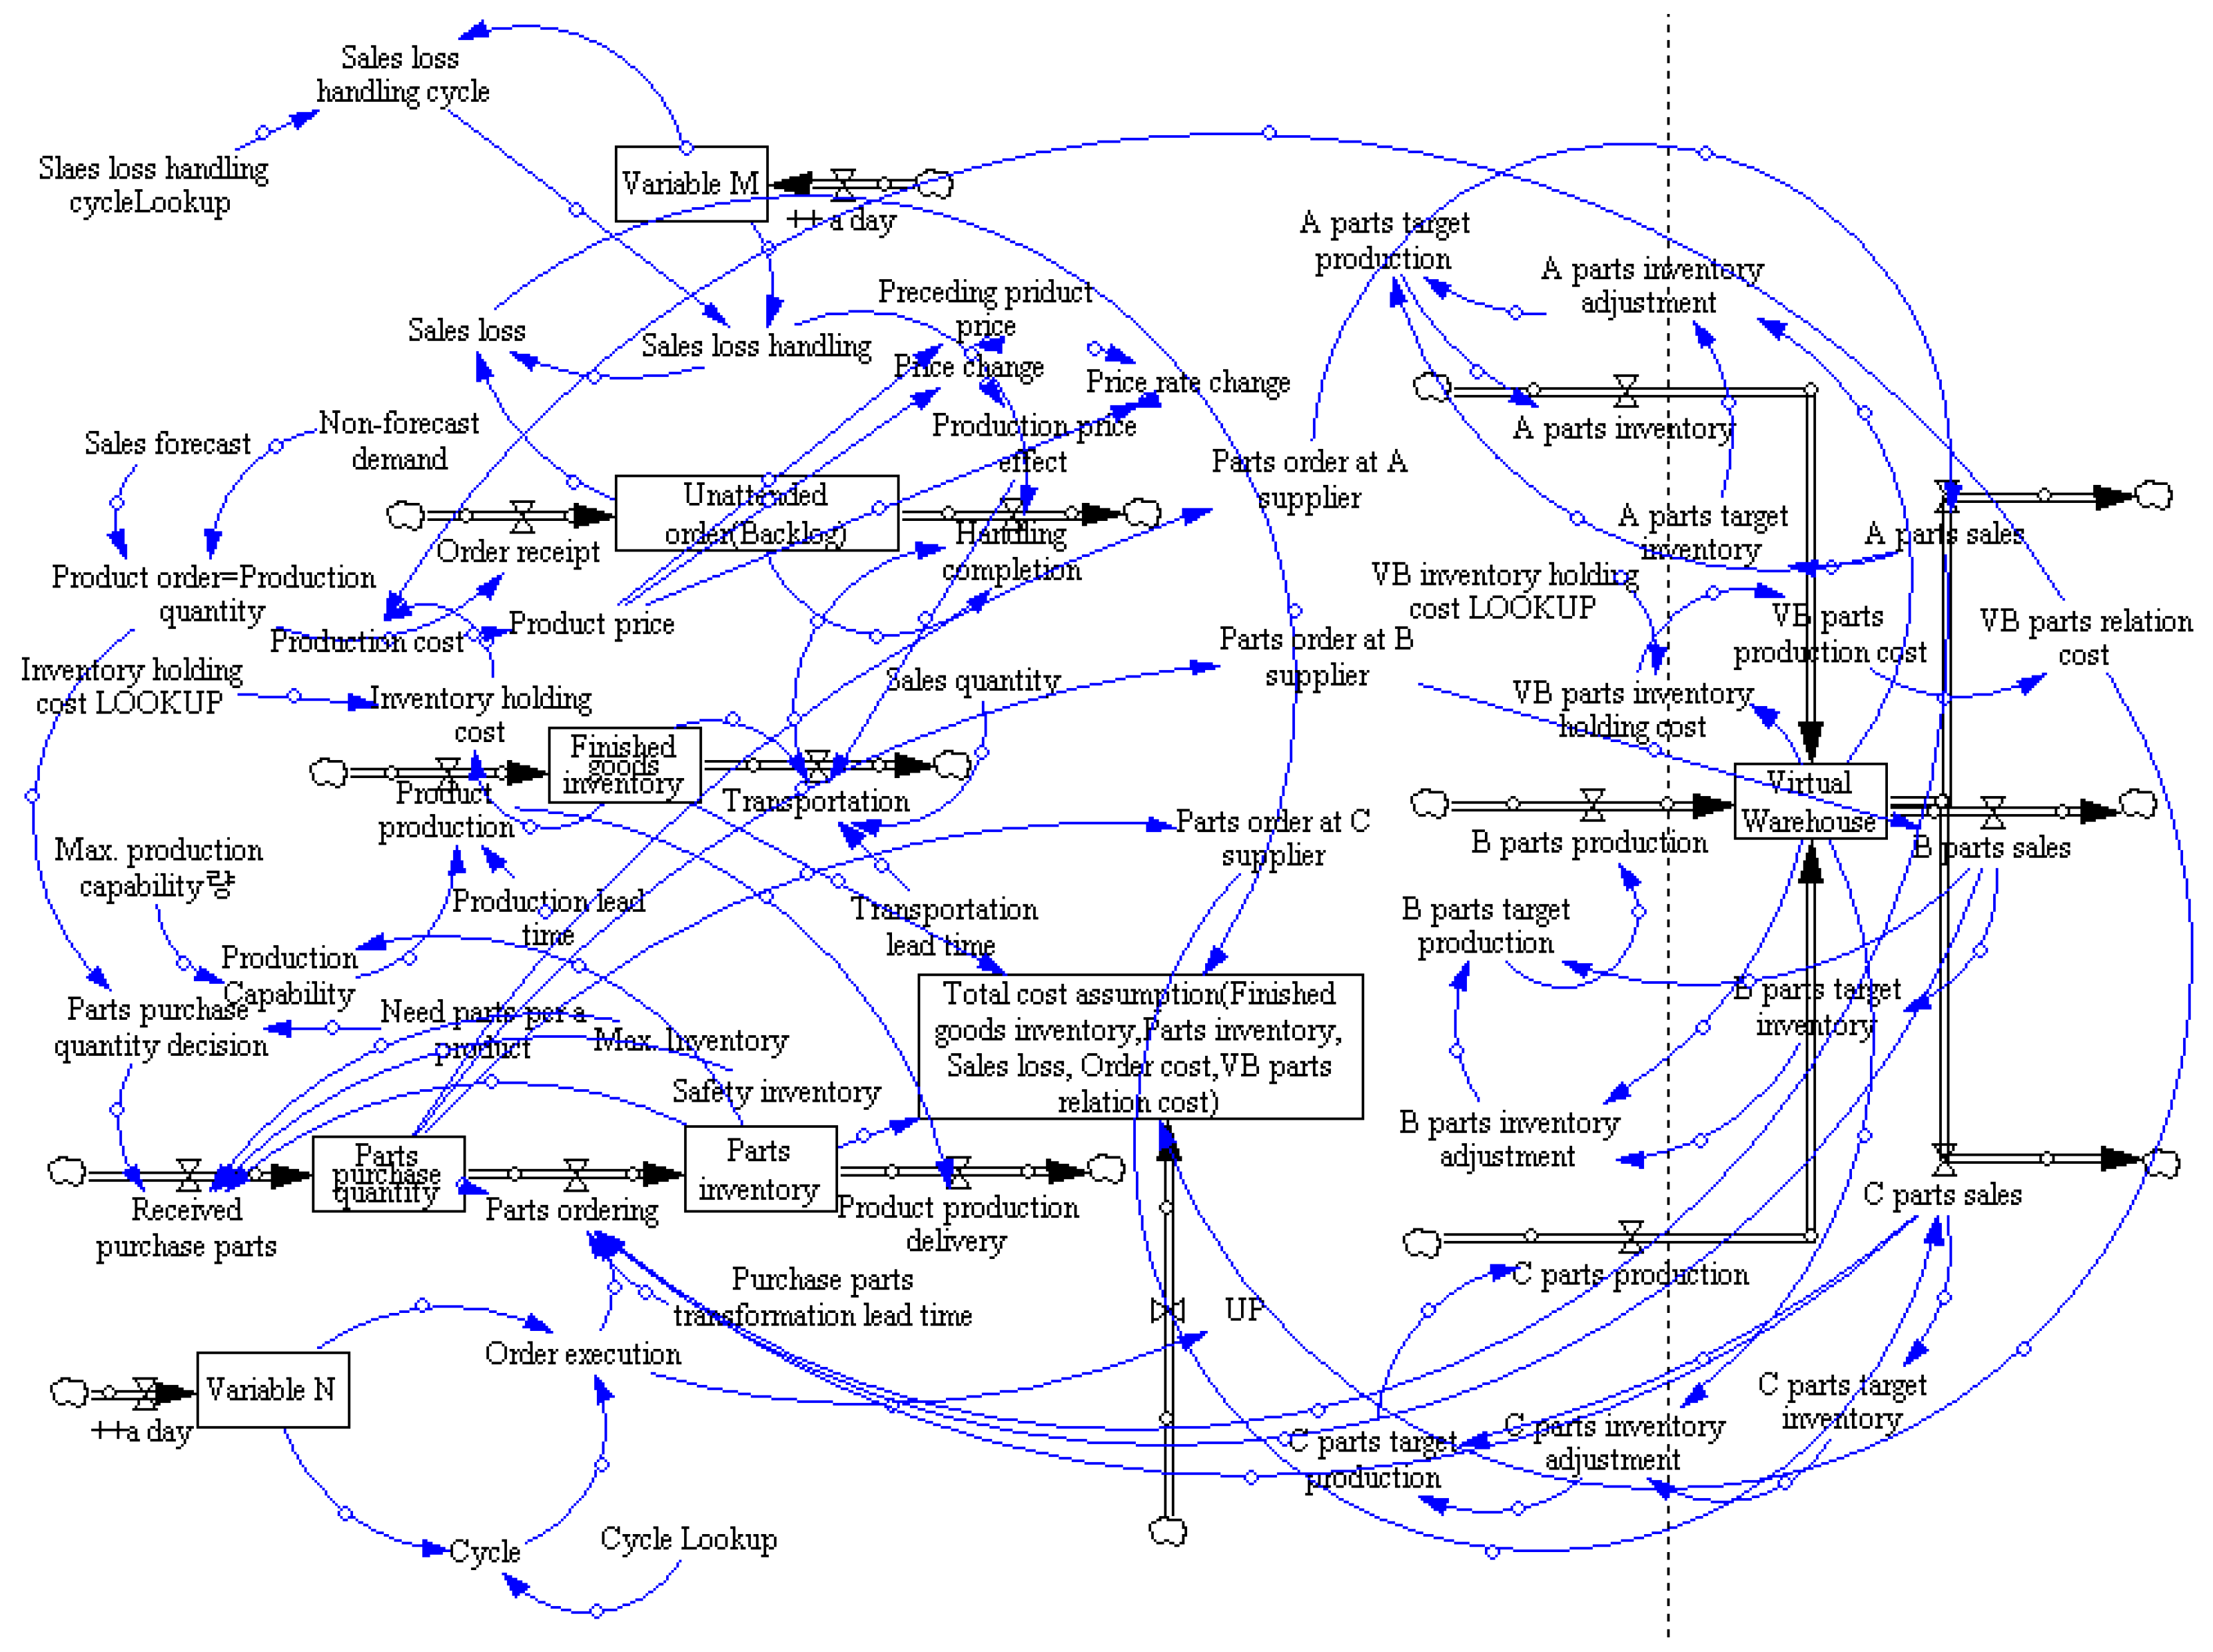
3.3. Modeling of the System Structure
3.4. The Case with No Inventory Sharing System (without VW)
- “Parts order” = “Parts purchase quantity” × (4/10)
- “Parts target production” = “Parts sales” + “Parts inventory adjustment”
- “Parts production” = “Parts target production”
- “Parts target inventory” = “Parts sales” × 0.15
- “Parts production” = “Parts target production”
- “Parts transportation capacity” = 100
- “Parts transportation cost per unit” = 500
- “Parts sales” = “Parts order”
- “Parts inventory” = INTEG (Parts production - Parts sales, 0)
- “Parts inventory adjustment” = Parts target inventory - Parts inventory
- “Parts inventory holding cost” = Parts inventory holding cost lookup (Parts inventory)
- “Parts inventory holding cost lookup (((0,0) − (300,30)), (0,0), (100,10), (200,20), (300,30))
- “Parts transportation cost” = Roundup (“Parts purchase quantity/”Parts transportation capacity, 0) × Part transportation cost per unit
3.5. The Case with Inventory Sharing System (With Virtual Warehouse)
- “VB parts production cost” = VB parts inventory holding cost + 2
- “VB parts price” = “VB parts production cost” + 2
- “VB parts inventory holding cost” = VB inventory holding cost lookup (((0,0) − (300,30)), (0,0), (100,10), (200,20), (300,30))
- “VB transportation capacity” = 100
- “Parts transportation cost per unit” = 500
- “VB transportation cost” = Roundup (“VB Parts purchase quantity/”VB Parts transportation capacity, 0) × VB Part transportation cost per unit
- “Virtual warehouse” = INTEGRAL ((A parts production + B parts production + C parts production) − (A parts sales + B parts sales + C parts sales), 0)
4. Experimental Results
4.1. Verification of Simulation
4.2. The Effect of Virtual Warehouse Practices for Sustainable Supplier Management
4.3. The Contrast of Order Cycle (30 Days, 14 Days, and 7 Days)
4.4. Findings and Implications
4.5. Generalization of the Proposed Simulation Model
5. Conclusions
Author Contributions
Acknowledgments
Conflicts of Interest
Appendix A. Variables and Equations Used in Sales Logic
- Backlog = INTEG (Order receipt - Order completion, 0)
- Order receipt = Product order
- Order completion = IF THEN ELSE (Sales loss handing = 1, Backlog, Transportation)
- Sales forecast = 23 + sin(RANDOM UNIFORM (6, 6.28, 0))
- Non-forecast demand = RANDOM NORMAL (0, 8, 4, 3, 0)
- Product order = Sales forecast + Non-forecast demand
- Sales loss = IF THEN ELSE (Sales loss handing = 1, Backlog, 0)
- Variable M = INTEG (“++ a day”, 0)
- Sales loss handling cycle = Lookup for sales loss cycle (Variable M)
- Lookup for sales loss cycle = Lookup ([(0,0)-(365,400)], (0,0.5), (29,0.5), (30,30), (31,0.5), (59,0.5), (60,60), (61,0.5), (89,0.5), (90,90), (91,0.5), (119,0.5), (120,120), (121,0.5), (149,0.5), (150,150), (151,0.5), (179,0.5), (180,180), (181,0.5), (209,0.5), (210,210), (211,0.5), (239,0.5), (240,240), (241,0.5), (269,0.5), (270,270), (271,0.5), (299,0.5), (300,300), (301,0.5), (329,0.5), (330,330), (331,0.5), (359,0.5), (360,360), (361,0.5), (364,0.5), (365,365))
Appendix B. Variables and Equations Used in Production Logic
- Production capability = IF THEN ELSE (Parts inventory/50) <= Max. Production capability, Parts inventory/50, Max. Production capability)
- Max. Production capability = 80 + RAMP (0.5, 60, 120)
- Finished goods inventory = INTERG (Product production-Transportation, 5)
- Transportation = IF THEN ELSE (Finished goods inventory <= 0, 0, IF THEN ELSE Finished goods inventory >= sales quantity/Transportation lead time, Finished goods inventory/Transportation lead time))
- Transportation lead time = 1.5
- Sales quantity = 22 + (4 × ABS (SIN (RANDOM UNIFORM (0, 3, 3))))
- Product price effect = IF THEN ELSE (Product price < Preceding product price, 1/(Preceding product price - Product price) × (Preceding product price/Product price), (Preceding product price - Product price) × (Preceding product price/Product price))
- Preceding product price = DELAY FIXED (Product price, 1, 0)
- Sales rate = RANDOM UNIFORM (150, 200, 1)
- Price change = 1/(Preceding product price - Product price)
- Price change rate = IF THEN ELSE (Preceding product price = 0, Preceding product price/Product price)
- Product price = Production cost + 5
Appendix C. Variables and Equations Used in Purchasing Logic
- “Parts purchase quantity decision” = “Product order = Production quantity” × “Need parts per a product”
- “Need parts per a product” = 50
- “MAX. Inventory” = 10000
- “Safety Inventory” = 3000
- “Received purchase parts” = IF THEN ELSE (“Parts inventory” > “MAX. Inventory”:OR:Parts inventory < Safety Inventory, IF THEN ELSE (Parts inventory < Safety, Inventory Parts purchase quantity decision + Safety Inventory, 0), Parts purchase quantity decision)
- “Parts ordering” = IF THEN ELSE (Order execution = 1, Parts purchase quantity/Purchase parts transportation lead time, 0)
- “Variable N” = INTEG (“++a day, 0)
- “Purchase parts transportation lead time”
- “Parts inventory” = INTEG (“Parts ordering” - “Product production delivery”)
- “Product production delivery” = “Product production” × 50
- “Order cost” = IF THEN ELSE (Order execution = 1, 2400, 0)
- “++a day” = 1
- “Cycle” = “Cycle Lookup” (Variable N)
- “Cycle Lookup” =
- “Order execution” = IF THEN ELSE (Variable N/“Cycle” = 1, 1, 0)
- “Product lead time” = 7
- “Assumptive total cost (Finished goods inventory, Parts inventory, Sales loss, Order cost and Parts relation cost)” = INTEG ((Finished goods inventory × 0.2) + (“Sales loss” × 0.4) + Order cost + Parts relation cost, 0)
References
- Fu, X.; Han, G. Trust-embedded information sharing among one agent and two retailers in an order recommendation system. Sustainability 2017, 9, 710. [Google Scholar] [CrossRef]
- Taylor, S.Y. Just-in-time. In Handbook of Logistics and Supply Chain Management; Brewer, A.M., Button, K., Hensher, D.A., Eds.; Elsevier Science: Oxford, UK, 2001; pp. 213–224. [Google Scholar]
- Pfohl, H.-C.; Gareis, K. Supplier parks in the German automotive industry. Int. J. Phys. Distrib. Logist. Manag. 2005, 35, 302–317. [Google Scholar] [CrossRef]
- Khaji, M.R.; Shafaei, R. A system dynamics approach for strategic partnering in supply networks. Int. J. Comput. Integr. Manuf. 2011, 24, 106–125. [Google Scholar] [CrossRef]
- Josefa, M.; Francisco, C.B.; Manuel, D.M. A system dynamics model for the supply chain procurement transport problem: Comparing spreadsheets, fuzzy programming and simulation approaches. Int. J. Prod. Res. 2013, 51, 4087–4104. [Google Scholar]
- Rabelo, L.; Sarmiento, A.T.; Helal, M.; Jones, A. Supply chain and hybrid simulation in the hierarchical enterprise. Int. J. Comput. Integr. Manuf. 2015, 28, 488–500. [Google Scholar] [CrossRef]
- Chicksand, D. Partnerships: The role that power plays in shaping collaborative buyer-supplier exchanges. Ind. Mark. Manag. 2015, 48, 121–139. [Google Scholar] [CrossRef]
- Duffy, R.S. The Impact of Supply Chain Partnerships on Supplier Performance: A Study of the UK Fresh Produce Industry. Ph.D. Dissertation, University of London, London, UK, 2002. [Google Scholar]
- Dyer, J.H. Effective interfirm collaboration: How firms minimize transaction costs and maximize transaction value. Strateg. Manag. J. 1997, 18, 535–556. [Google Scholar] [CrossRef]
- Song, X.M.; Parry, M.E. A cross-national comparative study of new product development processes: Japan and the United States. J. Mark. 1997, 61, 1–18. [Google Scholar] [CrossRef]
- Chung, S.; Kim, G.M. Performance effects of partnership between manufacturers and suppliers for new product development: The supplier’s standpoint. Res. Policy 2003, 32, 587–603. [Google Scholar] [CrossRef]
- Goffin, K.; Lemke, F.; Szwejczewski, M. An exploratory study of ‘close’ supplier-manufacturer relationships. J. Oper. Manag. 2006, 24, 189–209. [Google Scholar] [CrossRef] [Green Version]
- Tanskanen, K.; Aminoff, A. Buyer and supplier attractiveness in a strategic relationship—A dyadic multiple-case study. Ind. Mark. Manag. 2015, 50, 128–141. [Google Scholar] [CrossRef]
- Yao, Y.; Evers, P.T.; Dresner, M.E. Supply chain integration in vendor-managed inventory. Decis. Support Syst. 2007, 43, 663–674. [Google Scholar] [CrossRef]
- Dong, Y.; Xu, K. A supply chain model of vendor managed inventory. Trans. Res. Part E Logist. Transp. Rev. 2002, 38, 75–95. [Google Scholar] [CrossRef]
- Disney, S.M.; Towill, D.R. A procedure for the optimization of the dynamic response of a Vendor Managed Inventory system. Comput. Ind. Eng. 2002, 43, 27–58. [Google Scholar] [CrossRef]
- Tyan, J.; Wee, H.-M. Vendor managed inventory: a survey of the Taiwanese grocery industry. J. Purch. Supply Manag. 2003, 9, 11–18. [Google Scholar] [CrossRef]
- Arora, V.; Chan, F.T.S.; Tiwari, M.K. An integrated approach for logistic and vendor managed inventory in supply chain. Expert Syst. Appl. 2010, 37, 39–44. [Google Scholar] [CrossRef]
- Yu, U.; Wang, Z.; Liang, L. A vendor managed inventory supply chain with deteriorating raw materials and products. Int. J. Prod. Econ. 2012, 136, 266–274. [Google Scholar] [CrossRef]
- Krause, D.R.; Handfield, R.B.; Tyler, B.B. The relationships between supplier development, commitment, social capital accumulation and performance improvement. J. Oper. Manag. 2007, 25, 528–545. [Google Scholar] [CrossRef]
- Fung, S.H.; Cheung, C.F.; Lee, W.B.; Kwok, S.K. A virtual warehouse system for production logistics. Prod. Plan. Control 2005, 16, 597–607. [Google Scholar] [CrossRef]
- Landers, T.L.; Cole, M.H.; Walker, B.; Kirk, R.W. The virtual warehousing concept. Transp. Res. Part E Logist. Transp. Rev. 2000, 36, 115–125. [Google Scholar] [CrossRef]
- Ballou, R.H.; Burnetas, A. Planning multiple location inventories. J. Bus. Logist. 2003, 24, 65–89. [Google Scholar] [CrossRef]
- Wanke, P.F.; Saliby, E. Consolidation effects: Whether and how inventories should be pooled. Transp. Res. Part E Logist. Transp. Rev. 2009, 45, 678–692. [Google Scholar] [CrossRef]
- Wanke, P.F. Consolidation effects and inventory portfolios. Transp. Res. Part E Logist. Transp. Rev. 2009, 45, 107–124. [Google Scholar] [CrossRef]
- Braglia, M.; Frosolini, M. Virtual pooled inventories for equipment-intensive industries: An implementation in a paper district. Reliab. Eng. Syst. Saf. 2013, 112, 26–37. [Google Scholar] [CrossRef]
- Yang, J.; Ma, Z. Research on the strategy of spare parts supply network virtual inventory under emergency. In Proceedings of the 11th International Conference on Service Systems and Service Management, Beijing, China, 25–27 June 2014. [Google Scholar]
- Mathien, L.D.; Suresh, N.C. Inventory management in an e-business environment: A simulation study. World J. Manag. 2015, 6, 229–247. [Google Scholar] [CrossRef]
- Ballou, R.H. Business Logistics Management; Prentice-Hall: Upper Saddle River, NJ, USA, 1992. [Google Scholar]
- Van der Zee, D.J. Building insightful simulation models using Petri Nets—A structured approach. Decis. Support Syst. 2011, 51, 53–64. [Google Scholar] [CrossRef]
- Willis, K.O.; Jones, D.F. Multi-objective simulation optimization through search heuristics and relational database analysis. Decis. Support Syst. 2008, 46, 277–286. [Google Scholar] [CrossRef]
- Tako, A.A.; Robinson, S. The application of discrete event simulation and system dynamics in the logistics and supply chain context. Decis. Support Syst. 2012, 52, 802–815. [Google Scholar] [CrossRef] [Green Version]
- Brailsford, S.C.; Hilton, N.A. A comparison of discrete event simulation and system dynamics for modelling health care systems. In Proceedings of the 26th Meeting of the ORAHS Working Group 2000, Glasgow, Scotland, July 30–August 4 2000; pp. 18–39. [Google Scholar]
- Sweetser, A. A comparison of system dynamics (SD) and discrete event simulation (DES). In Proceedings of the 17th International Conference of the System Dynamics Society, Wellington, New Zealand, 20–23 July 1999. [Google Scholar]
- Taylor, K.; Lane, D. Simulation applied to health services: Opportunities for applying the system dynamics approach. J. Health Serv. Res. Policy 1998, 3, 226–232. [Google Scholar] [CrossRef] [PubMed]
- Forrester, J.W. Industrial Dynamics: A Major Breakthrough for Decision Makers. Harv. Bus. Rev. 1958, 36, 37–66. [Google Scholar]
- Senge, P.M.; Sterman, J.D. System thinking and organizational learning: Acting locally and thinking globally in the organization of the future. Eur. J. Oper. Res. 1992, 59, 137–150. [Google Scholar] [CrossRef]
- Paich, M.; Sterman, J.D. Boom, bust and failures to learn in experimental markets. Manag. Sci. 1993, 39, 1439–1458. [Google Scholar] [CrossRef]
- Campuzano, F.; Mula, J.; Peidro, D. Fuzzy estimations and system dynamics for improving supply chains. Fuzzy Sets Syst. 2010, 161, 1530–1542. [Google Scholar] [CrossRef]
- Feng, Y. System dynamics modeling for supply chain information sharing. Phys. Procedia 2012, 25, 1463–1469. [Google Scholar] [CrossRef]
- Costantino, F.; Gravio, G.D.; Shaban, A.; Tronci, M. The impact of information sharing and inventory control coordination on supply chain performances. Comput. Ind. Eng. 2014, 76, 292–306. [Google Scholar] [CrossRef]
- Cannella, S.; Framinan, J.M.; Bruccoleri, M.; Barbosa-Povoa, A.P.; Relvas, S. The effect of inventory record inaccuracy in information exchange supply chains. Eur. J. Oper. Res. 2015, 243, 120–129. [Google Scholar] [CrossRef] [Green Version]
- Radzicki, M.J.; Sterman, J.D. Evolutionary economics and system dynamics. In Evolutionary Concepts in Contemporary Economics; England, R.W., Ed.; University of Michigan Press: Ann Arbor, MI, USA, 1994; pp. 61–89. [Google Scholar]
- Bowersox, D.J.; Closs, D.J.; Helferich, O.K. Logistical Management: A Systems Integration of Physical Distribution, Manufacturing Support, Materials Procurement; Macmillan Publishing Company: New York, NY, USA, 1986. [Google Scholar]
- Jung, H. A fuzzy AHP-GP approach for integrated production-planning considering manufacturing partners. Expert Syst. Appl. 2011, 38, 5833–5840. [Google Scholar] [CrossRef]



| Criteria | DES (Discrete Event Simulation) | SD (System Dynamics) |
|---|---|---|
| Representation | Network of queues and activities | System as set of stocks and flows |
| Change of states | Changes at discrete points of time (irregular discrete time steps) | Changes continuously over time (small discrete steps of equal length) |
| Setting of attributes | Specific attributes are assigned to each entity | Individual entities are not specifically modelled, but they are represented as a continuous quantity in a stock |
| Application areas | Appropriate when analyzing the problems at an operational or tactical level | Appropriate when taking a ‘distant’ perspective (i.e., strategic) where events and decisions are seen in the form of patterns of behavior and system structure |
| Before | After | Discrepancy | GAP (%) | |
|---|---|---|---|---|
| Accumulated inventory quantity | 25,067 | 19,368 | 5699 | 22.7 |
| Accumulated part purchase quantity | 53,927,730 | 48,320,775 | 5,606,955 | 10.4 |
| Accumulated unattended order (backlog) | 80,567.49 | 75,006.29 | 5561 | 6.9 |
| Parts transportation cost | 8,868,000 | 7,944,000 | 2,336,500 | 26.3 |
| Accumulated total cost | 174,220,635 | 154,580,608 | 19,640,027 | 11.3 |
| The cost per a day | 477,317 | 423,509 | 53,808 |
| Parts Order Cycle | The Yearly Total Order | Avg. Parts Purchase Quantity per Order | Accumulated Parts Inventory | Accumulated Finished Goods Inventory | Accumulated Assumptive Total Cost * | Avg. Sales Loss per Year |
|---|---|---|---|---|---|---|
| 30 days | 28,800 | 132,385 | 4,846,823 | 19,095 | 162,406,410 | 602 |
| 14 days | 62,400 | 65,598 | 3,679,455 | 19,433 | 153,372,873 | 553 |
| 7 days | 124,800 | 33,854 | 3,693,012 | 18,790 | 153,464,094 | 486 |
© 2018 by the authors. Licensee MDPI, Basel, Switzerland. This article is an open access article distributed under the terms and conditions of the Creative Commons Attribution (CC BY) license (http://creativecommons.org/licenses/by/4.0/).
Share and Cite
Jung, H.; Jeong, S. The Economic Effect of Virtual Warehouse-Based Inventory Information Sharing for Sustainable Supplier Management. Sustainability 2018, 10, 1547. https://doi.org/10.3390/su10051547
Jung H, Jeong S. The Economic Effect of Virtual Warehouse-Based Inventory Information Sharing for Sustainable Supplier Management. Sustainability. 2018; 10(5):1547. https://doi.org/10.3390/su10051547
Chicago/Turabian StyleJung, Hosang, and Sukjae Jeong. 2018. "The Economic Effect of Virtual Warehouse-Based Inventory Information Sharing for Sustainable Supplier Management" Sustainability 10, no. 5: 1547. https://doi.org/10.3390/su10051547
APA StyleJung, H., & Jeong, S. (2018). The Economic Effect of Virtual Warehouse-Based Inventory Information Sharing for Sustainable Supplier Management. Sustainability, 10(5), 1547. https://doi.org/10.3390/su10051547


