1. Introduction
Sustainability is not a new concern; since the introduction of the concept in 1987, there has been a proliferation of competing notions of sustainability to the extent that it has become an empty box, a fragmented concept. It seems that sustainability is what you make of it [
1]. The etymology of the word “sustainability” originates from the Latin sustin_ere in which the words sub—from below—and ten_ere—held up—combine to generate the idea of something that supports, maintains, or endures [
2]. However, the term ‘sustainability’ is increasingly used in the context of ecological, economic, and social studies. In green economics it is often used interchangeably with the term ‘sustainable development’, defined by the World Commission on Environment and Development as, “development which meets the needs of the present without compromising the ability of future generations to meet their own needs” [
3]. The concept of sustainable development refers to the ideas of “our common future” based upon a report published by the United Nations World Commission on Environment and Development [
4]. In fact, sustainable development is all about ensuring a better quality of life for everyone, now and for generations to come [
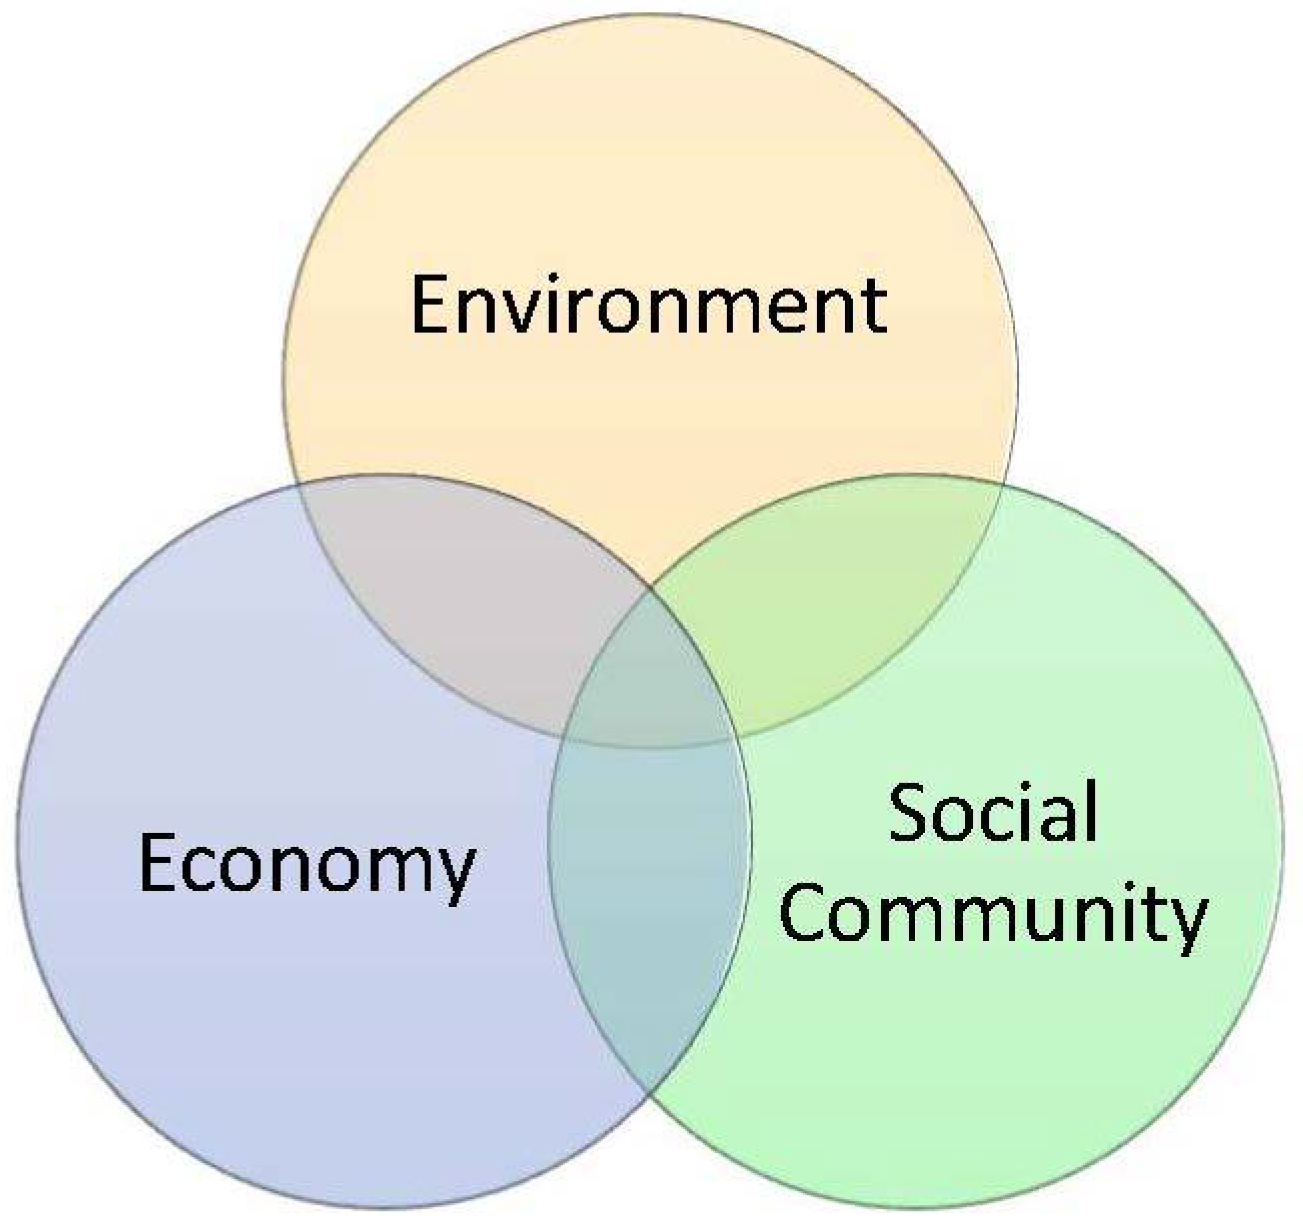
5]. The World Commission of Environment and Development identified sustainable development as a development that can fulfill requirements, including two concepts:
Based on a 1987 Brundtland report, sustainable development is rooted in sustainable forest and environmental issues in the 20th century. ‘Sustainability’ should be considered as humanity’s target goal of human-ecosystem equilibrium, while sustainable development refers to the holistic approach and temporal processes [
10]. Furthermore, it can be considered as the practice of maintaining processes of productivity indefinitely by replacing resources used with resources of equal or greater value without degrading or endangering natural biotic systems [
11].
In the territory of environmental sustainability, sustainable architecture has been introduced as the most prominent component. Environment and its changes, reduction in energy consumption, and green building are the most important factors in shaping different approaches of sustainable architecture [
12]. A building, energy and resource efficient to sustain the lifecycle of its operations, meanwhile conducive to the health and comfort of its occupants, could be considered a green building [
13]. Sustainable architecture is a way of prolonging the aging process of existing architecture [
14]. Furthermore, is the inclusive part of the Green Building paradigm—the comprehensive professional philosophy, design methodology, and assessment toolkit that came into use in the 1990s along with the introduction of the BREEAM (Building Research Establishment Environmental Assessment Method) sustainability assessment system that has identified ten performance areas to measure sustainability of new or in-use buildings [
15]. Recently, many similar systems elaborate analogous assessment criteria and are used for creating sustainable architecture internationally, regionally, or nationally.
Architectural sustainability in developing countries such as Iran, is still in the early stages compared with developed countries. Although, in recent decades, construction has been one of the most beneficial industries in Iran, but, unfortunately, most of the buildings suffer from a lack of sustainability. In Iran, the running architect’s education programs still poorly address the questions of sustainable architecture, there is no sustainability assessment tradition, and for this reason there is a great need for scientifically-based methods for prioritizing the sustainable architecture indicators. Zarghami et al., in 2018, published a report investigating the opportunities to customize the well-known sustainability assessment systems for the Iranian architecture and construction environment and underline the need for a method that explicitly displays the key factors of sustainable architecture [
16]. In 2017, Shareef and Altan published research analyzing the sustainability assessment systems that are in use in the Middle East and globally, to determine qualitative and quantitative ways to weight the selected sustainability indicators and use this for developing the national sustainability codes, including the digital calculation systems [
17]. The scope of sustainability theories, methodologies, and assessment systems often unreasonably limit themselves to the scale of a separately-taken building with its internal systems, as Hashemkhani and Zolfani note in 2018 [
18]. At the same moment, architects and planners seamlessly neglect the necessity of an integrated approach with the superior urban structures as blocks and districts and urban systems as mobility and technical infrastructure. There, urban planners and architects make the strategic decisions for sustainability and clients harvest the major benefits, and we aim to check this for the Iranian environment.
Statistics indicate that, in the developing countries, approximately 40% of the energy is consumed in the construction sector [
19]. It is predicted that this percentage will rise up to 50% by the year 2050 [
20]. Consequently, each year a great amount of energy, and financial and non-financial resources are wasted during the process of building, and even during the regular use of the built buildings. The main aim of this particular research is to increase the pace of sustaining Persian architecture by applying innovative analysis methods and relevant conceptual tools. Moreover, the results of the following research could cause a reduction of energy, financial, and non-financial resources that the construction industry annually uses in Iran. For this reason, key factors of environmental sustainability in the contemporary architecture of Iran have been introduced and prioritized. Prioritizing these key factors will help the architecture and the other related companies to put more emphasis on necessary factors that will lead to sustainable buildings in the context of sustainable city spaces.
In the following, related subjects to this paper, such as sustainable architecture, Persian contemporary architecture, best-worst, and the complex proportional assessment (hereafter COPRAS) methods have been demonstrated.
3. Research Methodology
In this section, at first, best-worst multi-criteria decision-making method (BWM), complex proportional assessment method (COPRAS), fuzzy sets theory, and a defuzzification technique are explained in detail. Afterwards, the stages of multi-criteria analysis of prioritizing key factors of sustainability in Persian contemporary architecture are described.
3.1. Best-Worst Method (BWM)
BWM is one of the newest methods for solving multi-criteria decision-making problems, and was introduced by Rezaei [
45] in 2015. In this method, first, the best (e.g., most desirable, most important) and the worst (e.g., least desirable, least important) criteria are chosen by the decision-maker. Afterwards, upon the BWM questionnaire, pairwise comparisons should be performed between each of these two criteria (best and worst) and the other criteria. For determining the weights of decision-making criteria a maximum problem is formulated. In order to check the reliability of the comparisons a consistency ratio is proposed for the BWM [
45]. In our proposed approach, this method was employed in order to weight the decision-making criteria, considering each one’s advantages in comparison with other existing MCDM methods, being the requirement of less comparison data in conjunction with more consistent comparisons and more reliable results.
In 2017, Gupta and Barua applied BWM in order to select suppliers among SMEs on the basis of their green innovation ability [
46]. Likewise, Ahmadi et al. performed BWM in favor of assessing the social sustainability of supply chains [
47]. Van de Kaa, Kamp, and Rezaei practiced the mentioned method for the selection of biomass thermochemical conversion technology in the Netherlands [
48]. BWM was also tested to analyze the barriers to humanitarian supply chain management by Sahebi et al. [
49]. In addition, a supplier selection life cycle approach integrating traditional and environmental criteria by using BWM, was presented by Rezaei et al. [
50]. Eventually, Mokhtarzadeh et al., presented a hybrid model including BWM to analyze the technology portfolio selection problem [
51]. In this part, the steps of BWM for deriving the weights of the criteria are described [
45].
Step 1. A set of decision criteria have to be determined.
Step 2. The best and the worst criteria in general are identified by the decision-maker.
Step 3. Based on the BWM questionnaire, the preference of the best criterion over all the other criteria using a number between 1 and 9 should be determined. The resulting best-to-others vector would be:
where
indicates the preference of the best criterion
B over criterion
j. It is clear that
.
Step 4. According to the BWM questionnaire the preference of all the criteria over the worst criterion using a number between 1 and 9 must be determined. The resulting others-to-worst vector would be:
where
indicates the preference of the criterion
j over the worst criterion W. It is clear that
.
Step 5. Finding the optimal weight
by solving Equation (3). It should be mentioned that the optimal weight for the criteria is the one where for each pair of
and
, we have
and
. Considering the non-negativity and sum condition for the weights, the following problem results:
By using
, the consistency ratio can be calculated. It is clear that the greater the
, the higher the consistency ratio, and the less reliable the comparisons are [
45]. The consistency ratio can be obtained from the following formula (
Table 3):
Considering uncertain circumstances, the following two models are used to calculate the lower and upper bounds of the weights of criterion
j based on the grey systems [
52]:
Solving these two models for each criterion, the optimal weights as interval values can be determined. For ranking the criteria the center of the intervals can be used. However, another option is to rank the criteria based on the interval weights by the help of a matrix of preferences [
52].
3.2. Complex Proportional Assessment Method (COPRAS)
The COPRAS method was introduced by Zavadskas et al. [
53]. The reliability and accuracy of the COPRAS method is acknowledged by several scholars and, nowadays, it is used to solve different engineering and management multi-attribute problems [
54,
55,
56,
57,
58]. Moreover, the accuracy of performance measures in the COPRAS method assumes direct and proportional dependence of the significance and utility degree of investigated alternatives on a system of criteria [
59].
COPRAS with fuzzy sets information is a developed method for solving decision-making problems under uncertain situations, introduced by Zavadskas and Antucheviciene [
60]. In this paper, the assessment and prioritizing of the key factors of environmental sustainability in contemporary rural buildings is analyzed by the fuzzy COPRAS method.
In 2016 Beheshti et al. performed the COPRAS method for strategy portfolio optimization [
53]. Pitchipoo et al. applied the COPRAS method in order to optimize blind spots in heavy vehicles [
61]. In addition, the mentioned method was used to assess the neglected areas in Vilnius by Bielinskas et al. [
62]. By applying the COPRAS method, the evaluation of construction projects of hotels based on environmental sustainability was practiced by Hashemkhani Zolfani et al. [
18]. Moreover, Polat et al. applied the COPRAS method as a tool for mechanical designer selection [
63].
Lithuanian scientists Zavadskas and Kaklauskas presented a method of multi-criteria complex proportional evaluation for formulating construction and engineering multi-objectives and multi-attribute problems since 1996 [
64]. The four stages of this method are presented as below.
Stage 1: Calculate the normalized matrix by the following formula [
18,
65,
66]:
Remark that
xij demonstrates the
ith criterion in the
jth alternative, m presents the number of criteria, where
n stands for alternatives. Moreover,
qi illustrates the weight of
ith criteria and
Dij is the normalized weighted value of each criterion. Note that:
The values of weight
qi are usually determined based on the experts’ point of view [
18]. The influence of weight
qi on
aj distributes in proportion to the values of the investigated criterion
xij:
Stage 2: Following Equation (7),
indicates the normalized weighted value of the
th criteria, which could be a benefit criteria (+) or cost (−). Thus, the
th alternative would be indicated by maximizing
, where i is a benefit and minimizing
, where
i is a cost [
67]. Maximizing the higher value and minimizing the lower value would be more desirable. Minimizing indices (
) and maximizing indices
) are calculated for each
jth alternative. The sum of weighted normalized minimizing and maximizing indices
and
, are calculated by [
18,
67]:
In all the cases,
is the sum of maximizing values from
row’s alternative and
is the sum of minimizing values from
row’s alternative [
68]:
Stage 3: The relative significance (
) of each alternative aj should be determined according to positive
and negative
. It could be calculated by the following formula [
69]:
Stage 4: After stage 3, the priority of alternatives would be determined. The assessment results of alternatives reflect the initial data submitted by experts [
68]. Based on Equation (7), the normalized weighted value of each
th criterion
; would have a direct and proportional relationship with the variables
and
. According to Equations (10) and (11), it is clear that the sums of
and
are linear functions of
. In addition, based on Equation (14), the generalizing criterion
has a direct linear relationship with the values and weights of the investigated criteria [
60]. As a result, the greater the value of the generalizing criterion
, the more effective the alternative will be. The satisfaction degree of demands and goals pursued by experts would be indicated by
of
. The significance
will always be the highest [
60].
In order to visually assess the efficiency of alternative the utility degree
can be calculated. The degree of utility is determined by comparing the alternative analyzed with the most efficient alternative from the set of alternatives [
70]. By comparing the variant which is analyzed with
, the degree of the variant utility (
) can be determined [
60]:
All the utility degree values related to the alternatives analyzed range from 0% to 100%.
3.3. Fuzzy Numbers
Considering the fuzziness of the available data, hereby, the decision matrix can be converted into a fuzzy decision matrix and a weighted normalized fuzzy decision matrix will be constructed [
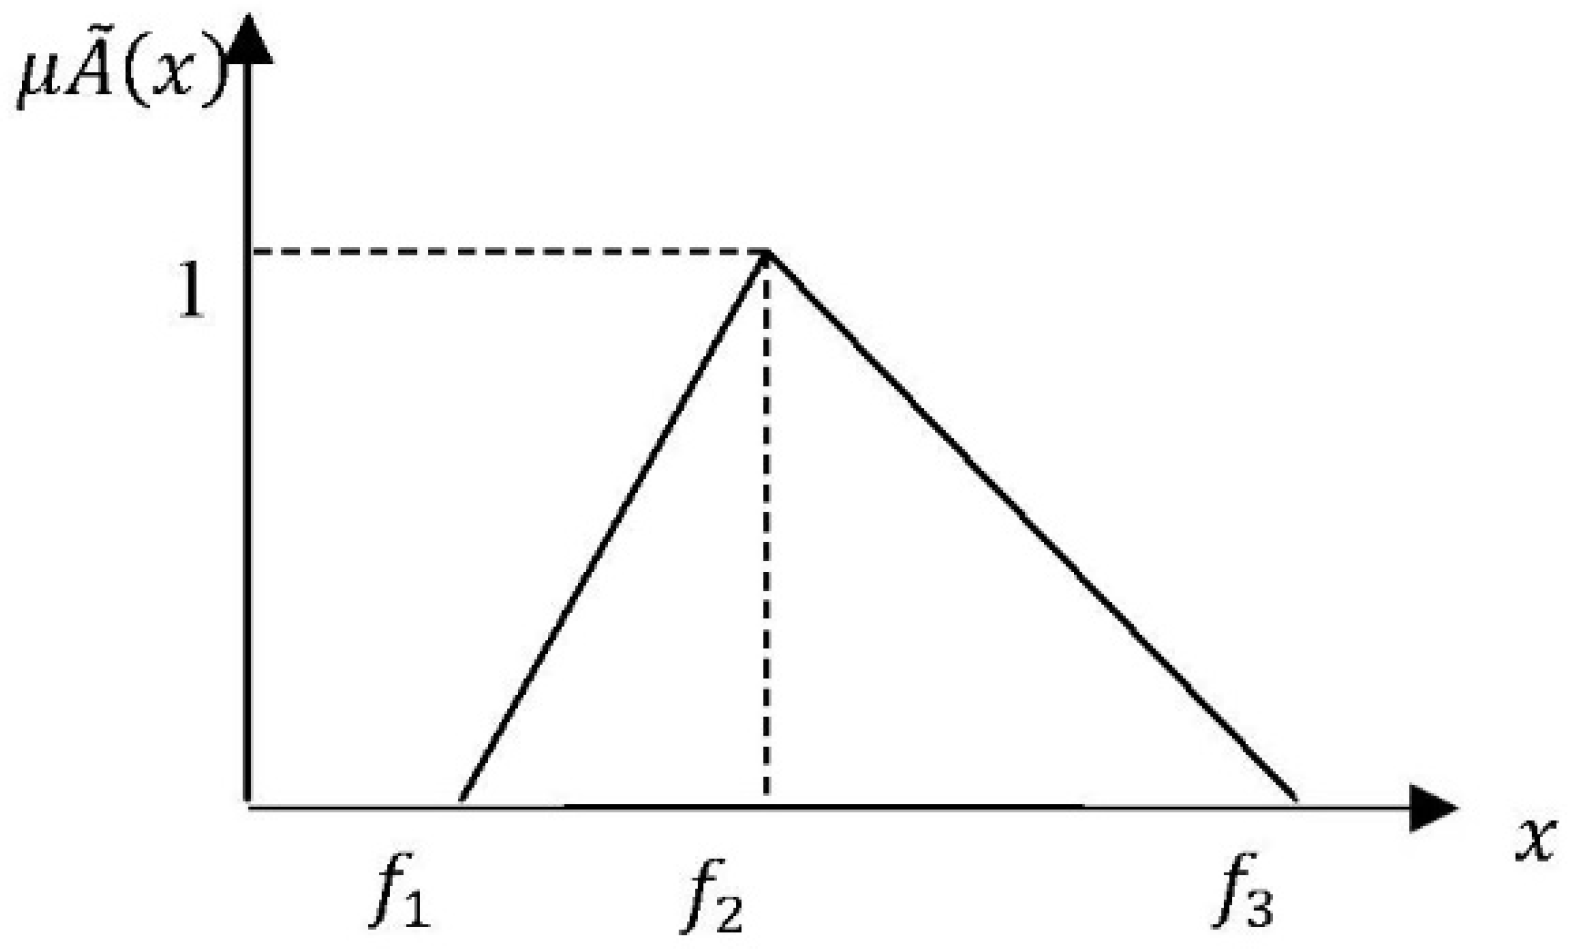
71]. In this paper the triangular fuzzy numbers were applied [
72]. A triangular fuzzy number
f̃ can be defined by a triplet (
f1,
f2,
f3) and is shown in
Figure 6.
The membership function μ
f̃ of
f̃ is defined as [
67]:
The operations on fuzzy triangular numbers used in this research are defined as follows [
72,
73].
3.3.1. A Linguistic Variable
According to Zadeh, it is complicated for a conventional quantification to reasonably express those situations being complex to describe. Accordingly, a linguistic variable is useful in such circumstances [
71,
74]. Fuzzy numbers can represent linguistic variables. The relationship between linguistic variables and TFN are presented in
Table 4 and
Table 5.
In this paper, the ratings of qualitative criteria and the weights, and evaluating key factors of environmental sustainability in contemporary architecture of Iran, are considered as linguistic variables.
3.3.2. Defuzzification
The results of fuzzy decisions are fuzzy numbers. As a result, a problem of ranking fuzzy numbers may appear in MCDM. In order to solve this problem a defuzzification should be performed. The procedure of defuzzification is to locate the best non-fuzzy performance (BNP) value [
72]. Several methods of defuzzification are available, such as mean-of-maximum, center-of-area, and a-cut methods [
76,
77]. In this research the center-of-area method is used. The defuzzified value of a fuzzy number would be obtained by applying the following equation [
74]:
where BNP is the best non-fuzzy performance value,
f2 is a mode, and
f1 and
f3 are the lower and the upper limits of fuzzy triangular number
f, respectively.
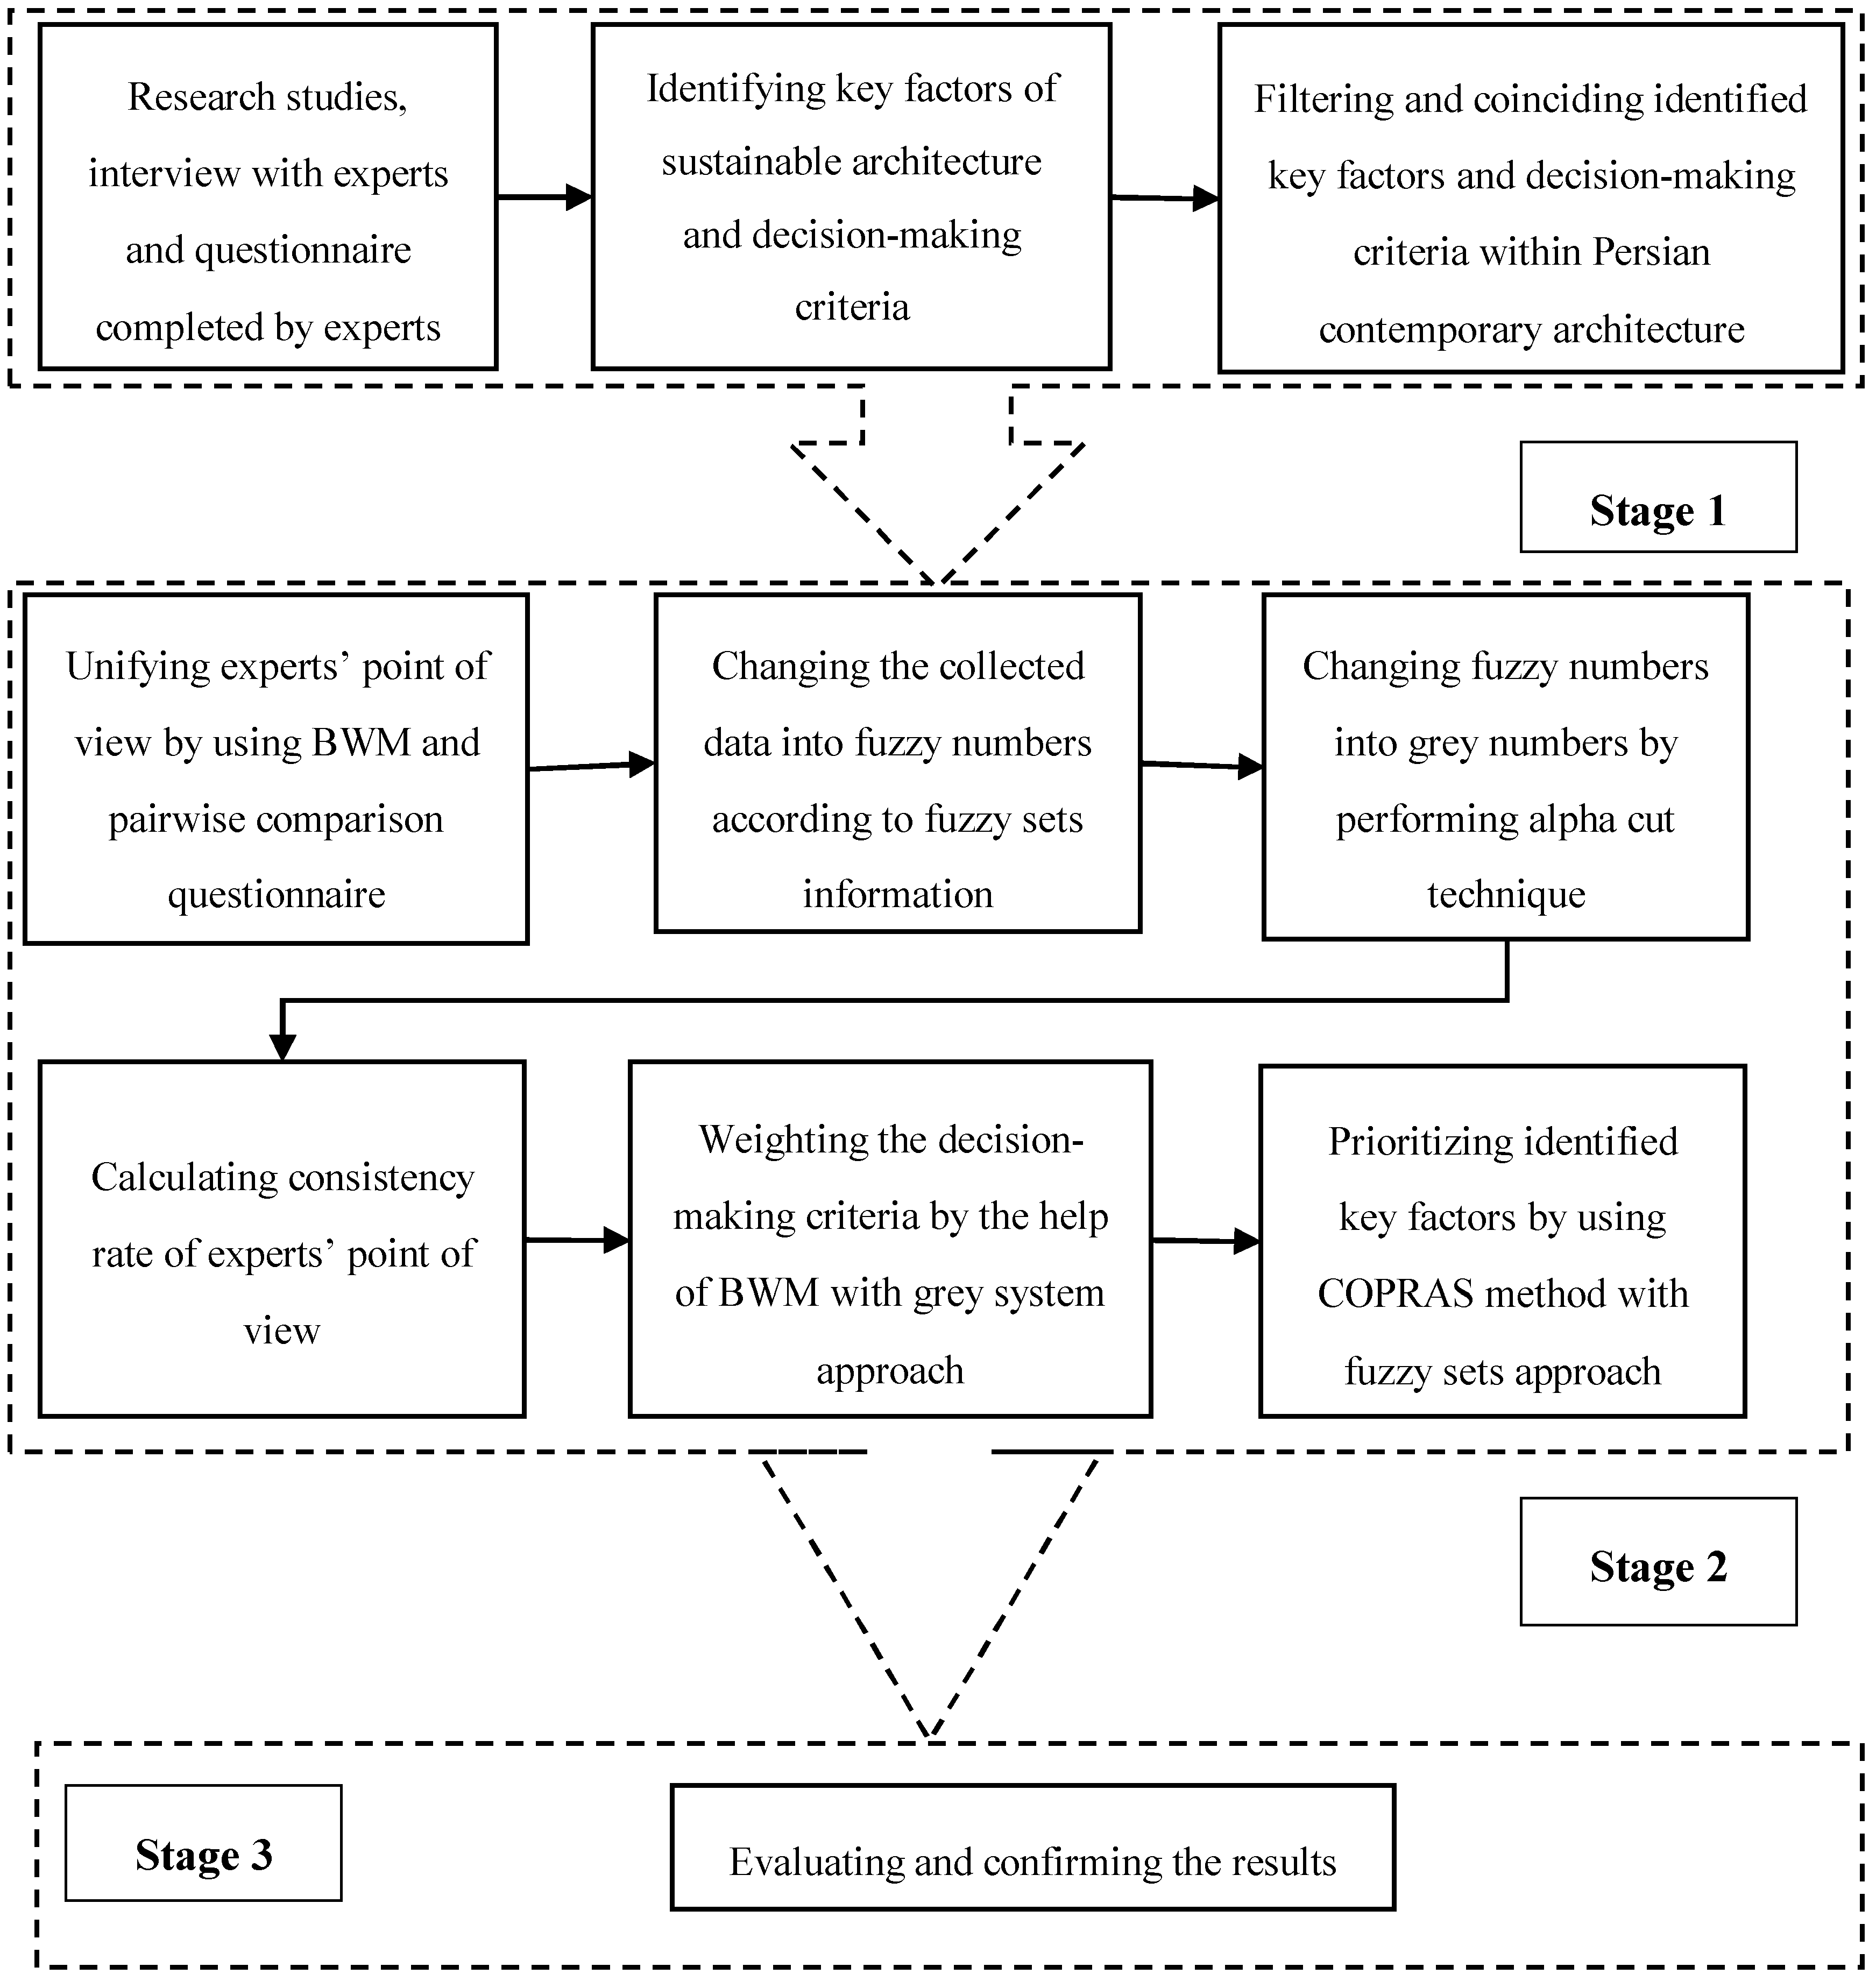
3.4. Proposed Approach
The process of multiple-criteria analysis in identifying and prioritizing key factors of environmental sustainability of Iranian contemporary architecture by performing the fuzzy set approach is performed in several stages, being presented in
Figure 7.
Stage 1. According to the method of multiple-criteria decision-making, the key factors of environmental sustainability should be determined. For this reason, the initial information was collected by the help of research studies, interviews, and questionnaires.
Stage 2.
Step 1
After identifying key factors and criteria of the decision-making problem according to the experts, their opinions should be unified. For this reason, at first, the best and the worst criteria are resolved. Thereupon, the experts determine the preference of the best criterion over all the other criteria. Moreover, preference of the criteria over the worst criterion is determined accordingly.
Step 2
Step 3
Since the mathematical model of BWM is a deterministic nonlinear model, in this step, the average of the triangular fuzzy numbers should be transformed into grey numbers through alpha cut technique by using the following equation:
Step 4
After changing triangular fuzzy numbers into grey numbers by the help of the alpha cut technique, AB (the preference of the best criterion over all the other criteria) and AW (the preference of all the criteria over the worst criterion) can be created based on the different amounts of alpha between zero and one.
Since the center of the grey numbers for different amounts of alpha is the same, based on Equation (3), a mathematical model could be defined. By solving the model, ξ
* is obtained. According to ξ
* and
Table 3, the consistency ratio can be calculated.
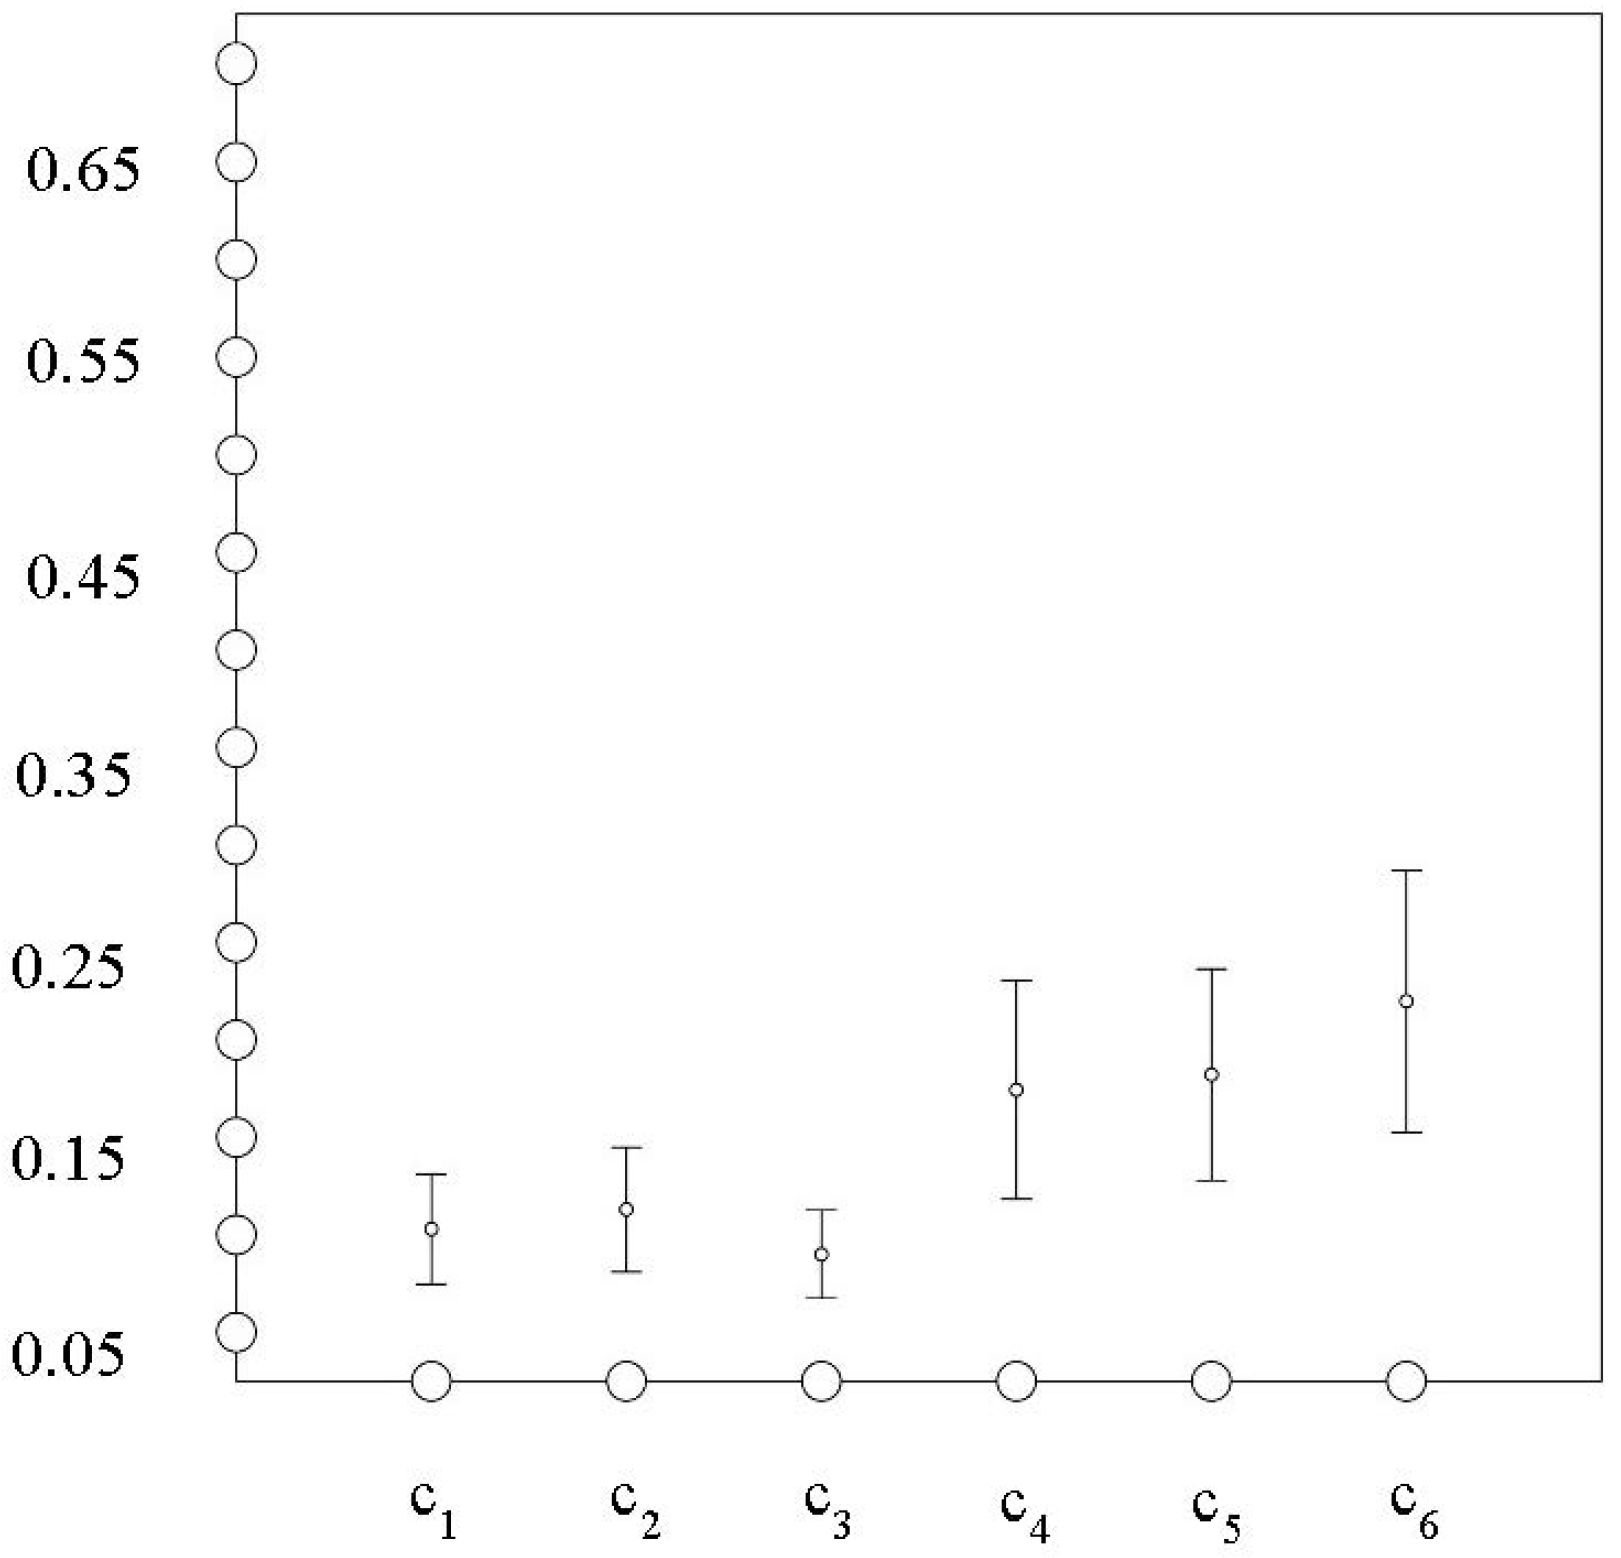
Step 5
In order to determine the lower and upper bounds of the weight of criterion j, two mathematical models should be proposed for different amounts of alpha based on Equations (5) and (6). By solving these two models for all the criteria, the optimal weights of the criteria can be determined as interval values.
Step 6
In this part, each expert fills out the evaluation questionnaire of alternatives over decision-making criteria based on fuzzy numbers. Next, by means of unification, the average of triangular fuzzy numbers is calculated.
In order to prioritizing alternatives with COPRAS method, first of all, the decision-making matrix with triangular numbers must be created. Afterwards, the decision-making matrix should be turned into normalized weighted matrix.
After creating the normalized weighted decision-making matrix, the values and have to be figured out for all the alternatives.
In the last step, the relative significance of each alternative () is determined according to positive and negative . Then, the determined should be defuzzied () and, finally, the degree of the variant utility () is calculated by a comparison of the variant that is analyzed with the most efficient one.
Stage 3.
5. Conclusions
In this research, key factors of environmental sustainability were analyzed with an emphasis on Iranian contemporary architecture, and by combining economic benefits of sustainable architecture, environmental potential, and social interest. Six possible alternatives for sustaining Persian architecture were suggested, including using building management systems, applying rules of continental design, using renewable energy and construction resources, applying human design, applying ecological rules in design, and creating engagement between buildings and other urban systems. Ranking of alternatives was performed on the mathematical statistical calculations and was based on the criteria system, as developed by the experts.
Calculations by applying fuzzy COPRAS and BWM were suggested, which took into consideration the uncertainty caused by incomplete and inconsistent information that related to sustainable development. The consistency ratio was calculated and the priority of alternatives was determined (
Table 17). It has been concluded that among the alternatives, creating engagement between buildings and other urban systems has the first priority, and proving building management systems has the last one. The alternative of applying rules of continental design has the second, performing human design has the third, adopting ecological rules in design has the fourth, and practicing renewable resources presents the fifth priority.
In order to complete this research, and based on the limitations that the authors had been faced with, some suggestions could be mentioned for future studies. Instead of using a lower and upper bounded grey model, the grey model could be solved with other approaches. Approaches possible to perform in uncertain conditions, such as the interval-valued intuitionistic fuzzy approach, could be applied instead of fuzzy and grey approaches. Moreover, one could observe and evaluate other components of sustainable development, like economic sustainability and social sustainability, next to environmental sustainability.
The findings are important for further driving the development of sustainable architecture in Iran, mainly by giving the grounds for weighting different sustainability criteria for the decision-making in the strategy, design, implementation, and impact assessment phases. It is important to note that the number and the list of sustainability criteria may change depending on the country, the region, or the urban setting analyzed, and the method will still work. The demonstrated method allows the architects and urban planners to compose the individually-shaped set of sustainability indicators and weight them accordingly. In particular, both the authorities and the specialists may adapt the findings of this paper to the national sustainability standards and design guidelines, as well as for the sustainability assessment tools in Iran and beyond. The wider question remains: how the research findings can find their way to the regulatory and professional development environments, and this may be the topic for coming research.

 ,
, 


