Abstract
South Korea’s new and renewable energy (NRE) policy experienced a drastic shift from the Feed-in Tariff (FIT) to the Renewable Portfolio Standard (RPS) in 2012. This study looks at the changes in the efficiency of NRE policy in this transition through DEA (Data Envelopment Analysis) and MI (Malmquist Index) methods, using investment for NRE technology development and for NRE dissemination as input factors and the number of firms, the number of employees, and the volume of NRE power generation as output factors. The results show a temporary drop in efficiency in 2012 during the transition period for the NRE industry as a whole. However, apart from those energy types with ulterior factors, the implementation of RPS increased the technical change (TC) of most NRE types. Furthermore, the findings highlight that, among South Korea’s three focal NRE industries—photovoltaic, wind power, and fuel cell energies—only fuel cell energies showed an increase in efficiency over time. South Korea’s policy shifts from FIT to RPS and the resulting effects on NRE policy’s efficiency provide a useful reference and guideline for government decision-making on NRE policy changes.
1. Introduction
South Korea’s new and renewable energy (NRE) policy was implemented full-scale in 2001 with the introduction of the Feed-in Tariff (FIT) policy to promote the NRE industry and to reduce the use of fossil fuels. One of the problems behind FIT is that the policy usually results in imposing financial burdens on taxpayers, distributors, and/or the government [1]. The increase in financial burden adversely affects the public acceptance of the policy, and consequently leads to pressures on the government or congress for policy change [2]. The South Korean government was no exception to this pressure, and in 2012, the government shifted its NRE policy from FIT to the Renewable Portfolio Standard (RPS) for reasons of high financial burden [3].
South Korea’s shift from FIT to RPS presents a meaningful case study for NRE policies not only because people were paying more and more interest to energy efficiency [4], but also as such a complete shift in national policy is rarely found. According to South Korea’s New and Renewable Energy Center, other than South Korea, only three countries—Belgium, Italy, and Japan—have undergone a similar policy shift from FIT to RPS [5]. The exceptional case of South Korea becomes further highlighted when considering that Italy revised its policy back to incorporate FIT sometime after its shift to RPS and Japan, who made the shift from FIT to RPS, moved back to FIT only after a few years. The uniqueness of South Korea’s policy shift opens a rare opportunity to investigate the difference in outcomes between the FIT and RPS policies. So far, however, while there is much research done from the public policy perspective with regard to this policy shift, few studies have been conducted on how the shift in policy affected the efficiency of South Korea’s NRE policy on the whole and/or by NRE type.
This study looks into the effect of South Korea’s NRE policy shift from FIT to RPS on the policy’s efficiency using data envelopment analysis (DEA) and the Malmquist index (MI). In particular, this study looks not only at the changes in the efficiency of the overall NRE policy due to the policy shift, but also in the efficiency of each NRE type. Through this investigation, we aim to provide novel insight into NRE policy-making for future reference to countries that are contemplating a shift between FIT and RPS in their NRE policy. Section 2 gives the background and literature review pertaining to NRE, followed by the details of the methodology and data in Section 3. The results and discussion in Section 4 elaborate the interesting findings made in this study, including the temporary drop in the efficiency of South Korea’s overall NRE policy in 2012 when the policy shift was made and the recovery of efficiency in the years afterward, and the effect of RPS on increasing technical change (TC) in most of NRE types. However, only fuel cell energy, among the South Korean government’s three strategic NRE areas, showed significant and consistent growth rate after the policy shift. Lastly, Section 5 presents the conclusion and policy implications of the study. Overall flow of this study is shown in Figure 1.
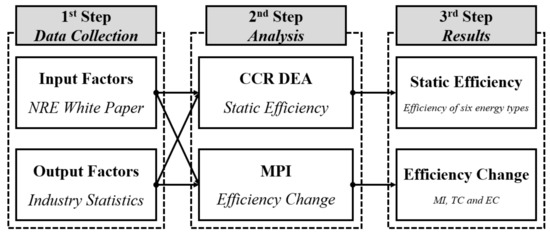
Figure 1.
Overall flow of the study.
2. Background and Literature Review
2.1. South Korea’s New and Renewable Energy Policy
The importance of NRE has become widely acknowledged over the years [6]. However, due to its relatively late introduction as an alternative energy source, NRE lacks competitiveness in production cost compared to existing fossil fuel-based energy, which has been a barrier for its greater use and diffusion. Thus, at the present stage, government policies promoting the use of NRE are essential for the development and growth of the nation’s NRE industry [7]. Various policies are adopted by countries around the world towards this end, and these policies can be broadly categorized into two types: FIT and RPS (RPS is sometimes called Renewable Obligation (RO) in countries such as the United Kingdom and Australia, however, the basic concept behind RPS and RO is very similar (Dong [8]). For the purposes of this study, RPS will be understood to include RO.) [9]. Table 1 below provides a summarized comparison of FIT and RPS based on Dong [8] and Trappey et al. [10] in terms of their concepts, countries of implementation, and advantages and disadvantages.

Table 1.
Comparison of FIT and RPS.
In South Korea, the implementation of FIT in 2001 laid provisions for subsidizing NRE power producers with the government’s Electric Power Industry Base Fund to make up the difference between the production cost and the market price for power produced and supplied using NRE. At the time FIT was implemented in 2001, the goal was to expand the production and dissemination of NRE-based power in order to alleviate the dependency on fossil fuel and to develop alternative energy sources. However, as those receiving subsidy under FIT expanded, so did the financial burden on the South Korean government. Consequently, on 25 April 2008, an economic policy adjustment meeting was held to review the FIT policy and the decision was made to adjust the price standard to a lower level with the goal to ultimately discontinue FIT at the end of 2011 to minimize the budgetary concerns caused by the policy. Instead, in 2012, in place of FIT, RPS was introduced [11]. This shift relieved the government’s financial burden as the trend in South Korea’s NRE-related government budget over the past few years show: From 876 billion KRW in 2010 and 1.3 trillion KRW in 2011 when the burden reached its height due to FIT, to 998 billion KRW in 2012, 851 billion KRW in 2013, and 802 billion KRW in 2014 with the shift to RPS.
The following paragraphs illustrate the details of RPS implemented in South Korea based on the “2014 New & Renewable Energy White Paper” published by the Ministry of Knowledge Economy and the South Korea Energy Management Corporation, the “Act on the Promotion of the Development, Use, and Diffusion of New and Renewable Energy,” and the Ministry of Trade, Industry, and Energy’s “Guidelines on the Management and Operation of Obligatory Renewable Energy Supply Program.”
South Korea’s RPS policy delineates, in the “Act on the Promotion of the Development, Use, and Diffusion of New and Renewable Energy,” the responsibility for all power producers with non-NRE power production facilities over a 500 MW capacity (obligatory producers) to meet an RSP target ratio for NRE-based power generation. As of 2015, a total of 17 power producers, including South Korea Hydro & Nuclear Power and South Korea South East Power are under RPS, and their obligatory renewable service supply ratio is set at 3% of their total power generation. This obligatory ratio is to be increased incrementally to reach 10% by 2024. Also, for photovoltaic energy, whose production unit cost is still relatively steeper than other NRE types, but which has the potential for great diffusion and growth, a separate obligatory ratio is given, independent from that for other NRE sources.
The power producer receives a renewable energy certificate (REC) if it produces a certain amount of power using NRE power facilities, which it is obligated to submit to prove it has fulfilled its mandatory supply ratio. REC is given to the power producers based on calculations using the NRE power (MWh) produced and supplied, multiplied by the REC weight given to the NRE type which is set by the government. For instance, if 1 MWh of NRE power was produced and supplied using geothermal energy, which has a REC weight of 2.0, the power producer will receive 2 RECs (1 MWh times 2.0). The REC weight was implemented to prevent excess investment in NRE types with low production unit costs, which can disrupt and deter the comprehensive use and diffusion of NREs. In addition, an REC trading market, under the supervision of the supply certification institution, was created to facilitate the buying and selling of RECs among power producers.
Under this new RPS policy, the South Korean government further specified three focal NRE areas, namely, photovoltaic, wind power, and fuel cell energies, and announced intentions to heavily invest in the development of core technologies and human resources for these NREs to gain key know-how on securing raw material, converting energy, and utilizing NRE power supply.
2.2. Literature Review
Previous literature on the topic of NRE and its efficiency has been reviewed for reference in setting the appropriate input and output factors for conducting DEA and MI. Unfortunately, while there are many researchers studying the efficiency of the NRE industry, we found a lack of those who investigated the efficiency of NRE policy using DEA or MI. Therefore, we focused on finding common input and output factors used by previous studies conducting DEA and/or MI on NRE-related topics to construct our research model on this novel topic. Table 2 below summarizes the literature reviewed for this study.
Table 2.
Previous literature on renewable energy and efficiency.
Halkos and Tzeremes [12] used DEA to find out the efficiency of NRE firms in Greece, using the current ratio, debt to equity ratio, and assets turnover ratio as input factors and return on equity, return on assets, margin, and gross profit margin as output factors. Meanwhile, Cristobal [13], studying renewable energy technology, used investment ratio, implement period, and operating and maintenance cost as input factors, while setting power generation, operating hours, useful life, electricity, and tons of CO2 avoided as output factors. Woo et al. [14] analyzed the environmental efficiency of NRE among OECD countries, using as input factors, total labor, total capital, renewable energy supply and as output factors, gross domestic product, carbon emission, and renewable energy generation for DEA and MI analysis. Barros [15] looked at the efficiency of hydropower plants in Portugal, using the number of workers, capital, operating cost, and investment as input factors and the amount of production in MWh and capital utilization as output factors. Lyu and Shi [16] used DEA to analyze the financing efficiency in global renewable energy industry and in different ways of financing.
Among the literature reviewed, Kim et al. [17] presented a helpful guideline for the present study due to its relevance to the topic on hand. They applied the South Korean government’s investment for renewable energy technology development and investment for renewable energy dissemination as input factors and the number of patents, power generation, and the unit cost of power generation as output factors for DEA to find out the efficiency of the South Korean government’s investment on NRE. As this study’s purpose is to analyze the efficiency of South Korea’s NRE policy, we follow Kim et al. in setting the input factors for DEA, namely, investment for renewable energy technology development and investment for renewable energy dissemination. However, for output factors, we use the number of firms and the number of employees in the NRE industry and the amount of NRE production. The reasons behind the choice of these output factors for the present analysis will be elaborated further in the next section on methodology.
3. Methodology
3.1. Data Envelopment Analysis and Malmquist Index
When measuring efficiency, SFA (Stochastic Frontier Approach), DFA (Distribution Free Approach), TFA (Thick Frontier Approach), DEA (Data Envelopment Analysis), and MI (Malmquist Index) are frequently used and each has its own advantages and disadvantages. Considering characteristics of this study, DFA, presented by Schmidt and Sikles (1984) and modified by Berger (1993), is not suitable for short period analysis since it affects the data by offsetting random errors [18,19]. TFA, introduced by Berger and Humphrey [20], needs a considerable number of DMUs to comprise the frontier. SFA, developed by Aigner et al. [21], requires an assumption of a specific function’s pattern and distribution. Thus, having data for a relatively short period and a small number of DMUs, this study used DEA for static analysis and MI for dynamic analysis in order to precisely capture the changes in energy efficiency.
Linear Programming (LP) is a mathematical technique used for optimizing the distribution of limited resources to achieve a decision-making goal. It is most often utilized in maximizing profit or minimizing cost, and in doing so, the objective function and constraints conditions are performed linearly [22]. Data envelopment analysis (DEA) makes use of linear programming to analyze the relative efficiency within a specific group, and has been applied in various areas of study since its introduction by Charnes et al. [23]. Charnes et al. [23] delineated that the ratio of the weighted sum outputs to the weighted sum of inputs of each decision-making unit (DMU) for evaluation cannot exceed 1, and defined DEA as a linear programming technique that aims to maximize the ratio of the weighted sum of outputs, assuming the condition that the weights of each input and output factor are greater than 0 [24]. The degree of inefficiency in the input-to-output ratio is most commonly analyzed in terms of ranking using the Charnes—Cooper—Rhodes (CCR) model or the further-developed Banker—Charnes—Cooper (BCC) model. The difference between the CCR model and the BCC model is that the BCC model allows an analysis of variable returns to scale [25].
Malmquist index (MI) is a dynamic analysis tool which was developed in order to overcome the shortcomings of DEA, that is, that DEA can only analyze a static situation in a specific time period. MI analyzes the ratio of input to output without assuming a specific production index, which allows for a dynamic evaluation of the changes in efficiency. MI is calculated using Malmquist analysis by multiplying the efficiency change (EC), which expresses the change in the proximity of the object of analysis to the production frontier from one period of time to another, and technical change (TC), which expresses how the change in technology occurring between one period of time and another has affected efficiency. When the concepts of EC and TC are applied to government policy, EC shows how efficiently resources are used to achieve the goal of a specific policy and TC shows the changes that occur outside the specific policy such as the introduction of a new policy.
In this study, we use the CCR-DEA model assuming constant return to scale (CRS) for static analysis and MI for dynamic analysis to understand the unique case of South Korea’s NRE policy shift from FIT to RPS from multiple angles. Detailed equation used in this study is shown below:
3.2. Data Collection
The research model showing the input and output factors used for analysis is illustrated in Figure 2 below. Two input factors and three output factors are used in this study to find out the efficiency of NRE policy by energy source: Investment for NRE technology development and investment for NRE dissemination as input factors and the number of firms, the number of workers, and the volume of power generation as output factors.
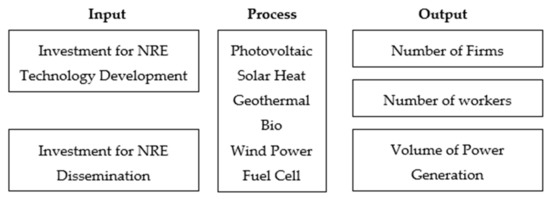
Figure 2.
Input and output model for the efficiency of NRE policy.
Of the two input factors, investment for NRE technology development refers to the amount of investment made on research and development by the South Korean government for the NRE type, and investment for NRE dissemination is the government subsidy provided towards the promotion of NRE use and diffusion. In this study, the latter includes the South Korean government’s Housing Subsidy Project, Building Subsidy Project, Regional Subsidy Project, Financial Subsidy Project, and the FIT Project. The data for the two input variables were obtained from the “2014 New & Renewable Energy White Paper,” published by the Ministry of Knowledge Economy and the South Korea Energy Management Corporation [5].
The details of the investment for NRE dissemination included in this study are described below. The Housing Subsidy Project reflects the South Korean government’s intention to provide NRE power to all homes, and the “One Million Green Home Project” is its representative project. The government subsidy was implemented since 2009 to supply the most appropriate NRE to households based on comprehensive considerations, including the environment of each region and home (e.g., the amount of solar radiation, wind speed, amount of water), industrial impact, and potential job creation. The Building Subsidy Project has been in place since 1993 with the goal to expand the NRE market and to promote the commercialization of new NRE technology in public buildings, universities, and social welfare facilities by subsidizing a part of the installation cost for NRE equipment.
The Regional Subsidy Project takes into consideration the characteristics of each local self-governing body and their potential NRE resources, and provides educational opportunities to government officers and employees in charge of NRE-related projects and directly subsidizes the installation of NRE equipment. This project has been in place since 2006. The Financial Subsidy Project started in 2000 and provides low-interest, long-term loans for NRE equipment installation to promote private sector investment in the NRE industry. Lastly, the FIT (Project), implemented in 2001, subsidizes the difference between the market price and the government-adjusted price, but, as mentioned beforehand, was discontinued in at the end of 2011 with the change in policy shift to RPS. However, for existing recipients of FIT, the subsidy will be maintained or decreased incrementally until 2030 and thus has been accounted for in this study.
The number of firms and the number of workers in the NRE industry and the volume of NRE power generation were chosen as output factors. South Korea’s NRE policy is founded on the “Act on the Promotion of the Development, Use, and Diffusion of New and Renewable Energy” and thus, aims to achieve the purpose of this law, that is, “the development, dissemination and promotion of usage of new and renewable energy and the promotion of new and renewable energy industries.” In reflection of this focus on the NRE industry, the 4th NRE Plan, announced in September 2014 under the leadership of the Ministry of Trade, Industry, and Energy, uses the number of firms and their employees in the NRE industry as the indexes for measuring the growth of South Korea’s NRE. The details of the NRE Plan make it evident that the goal of South Korea’s NRE policy is to increase the volume of NRE power generation and to promote the growth of the NRE industry, while at the same time, expanding the number of NRE-related firms for job creation. The output factors for this study follows the logic behind South Korea’s NRE policy, and the data for these output factors were compiled from the industry statistics database provided by NRE South Korea.
This study used MaxDEA Ultra 6.6 to analyze the data. Brief description of the data is shown in Table 3 below.
Table 3.
Descriptive statistics of the data (the values are averaged from 2009 to 2013).
4. Results and Discussion
4.1. Static Analysis: DEA
In this study, six energy types (photovoltaic, solar heat, geothermal, bio, wind power, and fuel cell) for the years from 2009 to 2013 have been chosen as the DMUs, making a total of 30 DMUs. CCR-DEA was conducted using investment for NRE technology development and investment for NRE dissemination as input factors and the number of firms, the number of employees, and the volume of power generation as output factors. The DEA results for relative efficiency are illustrated in Table 4, where the DMU is considered relatively more efficient if its value is closer to 1. For an easier comparison of relative efficiencies, the values in Table 4 were plotted on a graph, which is shown in Figure 3 below.
Table 4.
Results of the CCR-DEA.
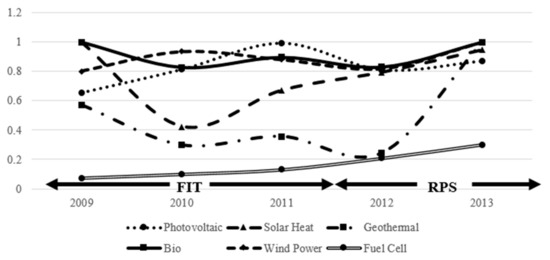
Figure 3.
Results of the CCR-DEA (graph).
Figure 3 clearly indicates that in 2012, NRE policies for four energy types (photovoltaic, geothermal, bio, and wind power) experienced a decrease in efficiency, while those of fuel cell and solar heat showed an increase. As 2012 was the year when the shift from FIT to RPS was made, this decrease in efficiency may be interpreted as a short-term drop in efficiency occurring while the NRE industry was adopting to the transition. The relative efficiencies of all NRE policies by energy type, including that of fuel cell and solar heat, increased in 2013, giving weight to this interpretation and showing that the effect of the policy shift has stabilized within South Korea’s NRE industry.
4.2. Dynamic Analysis: MI
As DEA has limitations in analyzing the dynamic changes in efficiency, this study uses the results of the DEA as a supplementary method and focuses on Malmquist analysis to see what effects South Korea’s policy shift had on the country’s NRE industry by energy type over time.
Table 5 tabulates the results of the Malmquist analysis on South Korea’s NRE policy by year, and shows that the mean values for MI and EC increased slightly to 1.0874 and 1.0915, respectively, while that for TC decreased slightly to 0.9962. Figure 4 visualizes the pattern of change in the EC, TC, and MI over time. A very clear pattern can be observed where, in 2012, EC and TC decreased, which led to a large drop in MI, which then recovered in 2013. Again, as in the results of DEA illustrated above, this can be interpreted to reflect the occurrence of the policy shift in 2012. The introduction of a new policy naturally requires a transition period for the objects of change, in this case the NRE power producers and the NRE market as well as those who implemented the change, namely the South Korean government and the government employees in charge. Thus, during the policy transition period, it can be difficult to achieve the same amount of efficiency even with the same amount of input. However, after the transition period, unlike FIT, it can be seen that RPS’ mechanism of forcing NRE power producers to meet the mandatory supply ratio came into effect despite the drop in government subsidy. Thus, as expected, the overall NRE efficiency increased after 2013, as demonstrated in Figure 4.
Table 5.
EC, TC, MI of South Korea’s NRE Policy from 2010 to 2013.
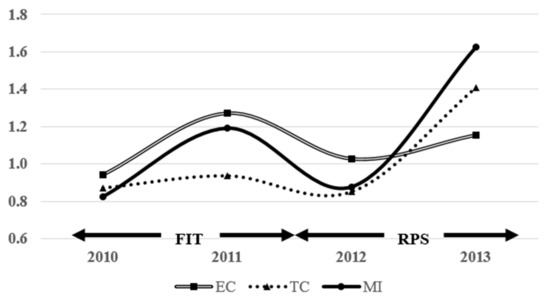
Figure 4.
EC, TC, MI of South Korea’s NRE Policy from 2010 to 2013 (graph).
Another important trend observed from Figure 4 is that, around 2012, the factor that drove the efficiency (MI) of NRE policy changed from EC to TC. As MI is the product of EC multiplied by TC, the similarity in the pattern of EC and MI before 2012, that is, in 2010 and 2011, implies that EC was the influential factor for the changes in MI during these two years. However, after 2012 and into 2013, we can see that TC, not EC, was influencing MI. Thus, the policy shift from FIT to RPS consequently shifted the driver behind NRE efficiency from EC to TC. The reason behind this change can be interpreted as follows: under FIT, the government’s focus was on maintaining a level of technical efficiency and subsidy under a consistent policy for each NRE type which gave little motivation to develop new management strategies or policies. When RPS was implemented in 2012, the effect was such as though a new technology was introduced. Two reasons can be given for this effect. First, as illustrated above in the comparison between FIT and RPS, the introduction of RPS enabled the South Korean government to set and manage NRE supply goals with more ease. Second, the competition among NRE power producers further enhanced the efficiency of the RPS policy.
Table 6 and Table 7 illustrate the EC, TC, and MI for each NRE type, the former for years 2010 and 2011 under FIT and the latter for years 2012 and 2013 under RPS.
Table 6.
EC, TC and MI for each NRE type under FIT.
Table 7.
EC, TC and MI for each NRE type under RPS.
Based on Table 6 and Table 7, Figure 5 compares the MI of NRE policy by energy type for the periods under FIT (A) and RPS (B) using TC as x-axis and EC as y-axis. Here, a clear transition can be found where the change in policy from FIT to RPS moved geothermal energy, wind power, solar heat, and fuel cell from the upper left box (where EC > 1 and TC < 1) to the upper right box (where EC > 1 and TC > 1). In other words, except for bioenergy and photovoltaic energy, the change to RPS triggered technical change in the NRE types to increase TC. Referring back to Table 6 and Table 7, the increase in TC led to a higher MI. It should be noted that bioenergy alone maintained its position from (A) to (B) in Figure 5. This reflects the South Korean government’s reluctance in investing in bioenergy due to the high reliance on imports and the fact that it can be used in combination with fossil fuels. This reluctance was expressed openly by the South Korean government, especially from the beginning of the policy shift to 2014, through consistent signals that it will limit the production of bioenergy as investment in this area will not further its NRE policy goals to promote growth in the national NRE industry [26].
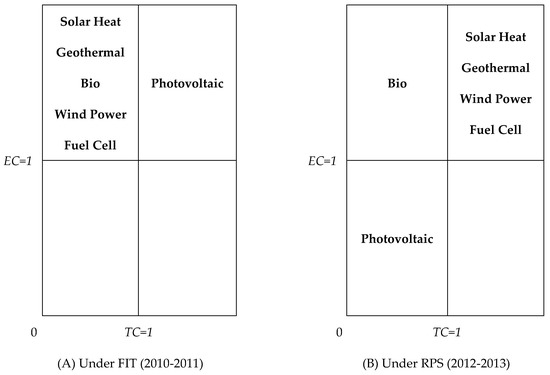
Figure 5.
MI of NRE policy by energy type.
In the case of photovoltaic energy, both EC and TC decreased to result in a diagonal shift from the upper right to the lower left box. South Korea’s RPS manages the amount of obligatory power production for photovoltaic energy independently from that of non-photovoltaic power production. Thus, even if photovoltaic power was produced beyond the mandatory amount, the excess in production is not counted towards non-photovoltaic power production. Because of this segregated management, the introduction of RPS led to a decrease in the incentive for NRE power producers to produce more photovoltaic power beyond the minimum amount. This has been a recurring issue for the solar energy industry, which has been arguing for an increase in the mandatory supply ratio for photovoltaic power and the transfer of excess photovoltaic power production towards the mandatory non-photovoltaic power supply ratio [27]. In this context, the movement of photovoltaic energy shown in Figure 5 can be interpreted as follows: The efficiency of South Korea’s photovoltaic energy was maintained at a high level thanks to the large government subsidy under FIT, but decreased with the change to RPS when there was no more subsidy coupled with a separate mandatory supply ratio leading to a segregation from other NRE sources.
To observe the chronological change in the MI of NRE policy by energy type in more detail, the cumulative values of EC, TC, and MI for each energy type was calculated under the assumption that the EC, TC, MI = 1 in 2009 and tabulated in Table 8.
Table 8.
Cumulative MI, EC, TC of NRE policy by energy type.
The values of cumulative MI in Table 8 were plotted on a graph to visualize the change over time in Figure 6. The most notable trend in Figure 6 is that, over the four-year period, the MI of fuel cell energy increased at a considerable and consistent rate compared to those of other energy types. Referring back to Table 8, we can see that this significant growth was due to the consistent increase in EC.
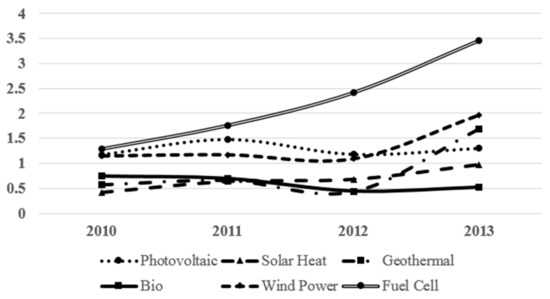
Figure 6.
Chronological change in the cumulative MI of NRE policy by energy type.
Fuel cell energy is one of the three strategic NRE types chosen by South Korea’s Ministry of Knowledge and Economy (2008) for concentrated investment [28]. The trend in fuel cell shown in Figure 6 shows that the South Korean government’s focused efforts have been effective in promoting growth in the NRE. However, the trends found in the two other NRE types chosen by the South Korean government—wind power and photovoltaic energies—should also be noted. All three strategic industries show cumulative MIs above 1 in Figure 6, however, while fuel cell has been maintaining a consistent increase rate, wind power showed a slight downturn until 2012 followed by a growth-burst in 2013 and photovoltaic energy showed no significant change. Thus, the only NRE type that seems to have actually benefited from the South Korean government’s focus was fuel cell energy. In particular, the fact that the cumulative MI for photovoltaic energy failed to show growth over time, even with the additional government support for the NRE type through the implementation of a separate mandatory supply ratio under RPS, present doubts on the effectiveness of the government’s policy for photovoltaic energy.
5. Conclusions and Policy Implications
The results found in this study hold meaningful implications for predicting how the efficiency of NRE policy can change when a policy shift is made from FIT to RPS. In this regard, the present study can provide a useful guideline for governments whose NRE policy is FIT-based but who are considering a change to RPS due to the high financial burden FIT poses. The summary of the effect of the policy shift from FIT to RPS on South Korea’s NRE industry found in this study is as follows.
First, the DEA and MI results on the change over time in the efficiencies and productivities of NRE policy by energy type showed a temporary drop in 2012 when the policy shift from FIT to RPS was made. However, after the transition period between policies, RPS was observed to be effective in bringing technological change. Second, when plotting the MI of NRE policy by energy type before and after the introduction of RPS onto four quadrants using EC and TC as the axes, it could be seen that the TC of almost all energy types increased. However, in the case of photovoltaic energy and bioenergy, the South Korean government’s regulations and negative signals have led to a different trend from other energy types. Lastly, the results for cumulative MI showed that, among the three focal areas strategically supported by the South Korean government (photovoltaic, wind power, and fuel cell), the concentrated efforts were only effective in terms of fuel cell, and had almost no effect on photovoltaic and wind power energies.
One of the limitations of this study is that it only looked at the case of South Korea to analyze the impact of NRE policy shift. Japan, Italy, and Belgium also had shifted their NRE policies similarly to South Korea, and the study of their policy shifts and their effects on the efficiency of NRE policies will add deeper insights to this study. Also, while this study looked at only the effect of the shift from FIT to RPS, further implications may have been gained from investigating the case where RPS was changed to FIT as in the case of Japan. It is suggested for future studies to pursue investigation on these other countries for a greater understanding of how a policy shift can affect the efficiency of NRE policy.
The other limitation faced by this study is the time period put under analysis. While it was originally the plan to include the time period from three years before the policy shift in 2012 (years 2009, 2010, 2011) and three years afterwards (years 2012, 2013, 2014), the data for the year 2014 was unavailable at the point in time this study was conducted. Thus, only the years 2012 and 2013 were included for the years after the policy shift. Future studies will be able to look into how RPS has influenced the NRE industry over a longer term by including the data for 2014 and 2015 to the present analysis.
Author Contributions
H.P. and C.K. conceived and designed the experiments. H.P. collected the data. The experiment was performed by all related authors. Finally, the paper is written by H.P. and revised by C.K. All authors read and approved the final manuscript.
Funding
This work was supported by Incheon National University Research Grant in 2018.
Conflicts of Interest
The authors declare no conflicts of interest.
References
- Río, P.; Gual, M.A. An integrated assessment of the feed-in tariff system in Spain. Energy Policy 2007, 35, 994–1012. [Google Scholar] [CrossRef]
- Huber, C.; Faber, T.; Haas, R.; Resch, G.; Green, J.; Ölz, S.; White, S.; Cleijne, H.; Ruijgrok, W.; Morthorst, P.E.; et al. 2004 Green-X. Deriving Optimal Promotion Strategies for Increasing the Share of RES-E in a Dynamic European Electricity Market; Final Report of the Project GREEN-X; Energy Economics Group, Vienna University of Technology, Institute of Power Systems and Energy Economics: Vienna, Austria, 2005. [Google Scholar]
- Yoon, J.-H.; Sim, K. Why is South Korea’s renewable energy policy failing? A qualitative evaluation. Energy Policy 2015, 86, 369–379. [Google Scholar] [CrossRef]
- Genovese, A.; Koh, S.L.; Acquaye, A. Energy efficiency retrofitting services supply chains: Evidence about stakeholders and configurations from the Yorskhire and Humber region case. Int. J. Prod. Econ. 2013, 144, 20–43. [Google Scholar] [CrossRef]
- New and Renewable Energy White Paper 2014; Korea’s Ministry of Knowledge Economy; Korea Energy Management Corporation New and Renewable Energy Center: Seoul, Korea, 2014.
- Rao, P. Greening production: A South-East Asian experience. Int. J. Oper. Prod. Manag. 2004, 24, 289–320. [Google Scholar] [CrossRef]
- Zhang, P.; Yang, Y.; Shi, J.; Zheng, Y.; Wang, L.; Li, X. Opportunities and challenges for renewable energy policy in China. Renew. Sustain. Energy. Rev. 2009, 13, 439–449. [Google Scholar] [CrossRef]
- Dong, C.G. Feed-in tariff vs. renewable portfolio standard: An empirical test of their relative effectiveness in promoting wind capacity development. Energy Policy 2012, 42, 476–485. [Google Scholar] [CrossRef]
- Mitchell, C.; Bauknecht, D.; Connor, P.M. Effectiveness through risk reduction: A comparison of the renewable obligation in England and Wales and the feed-in system in Germany. Energy Policy 2006, 34, 297–305. [Google Scholar] [CrossRef]
- Trappey, A.J.; Trappey, C.V.; Liu, P.H.; Lin, L.C.; Ou, J.J. A hierarchical cost learning model for developing wind energy infrastructures. Int. J. Prod. Econ. 2013, 146, 386–391. [Google Scholar] [CrossRef]
- Koo, M.G. South South Korea’s Feed-in Tariff Program and Its Implications for New Industrial Policy: Policy Design, Implementation, and Learning. A Study on Korean Public Administration. Korean J. Publ. Adm. 2013, 22, 1–27. [Google Scholar]
- Halkos, G.E.; Tzeremes, N.G. Analyzing the Greek renewable energy sector: A data envelopment analysis approach. Renew. Sustain. Energy Rev. 2008, 16, 2884–2893. [Google Scholar] [CrossRef]
- San Cristóbal, J.R. A multi criteria data envelopment analysis model to evaluate the efficiency of the renewable energy technologies. Renew. Energy 2011, 36, 2742–2746. [Google Scholar]
- Woo, C.; Chung, Y.; Chun, D.; Seo, H.; Hong, S. The static and dynamic environmental efficiency of renewable energy: A Malmquist index analysis of OECD countries. Renew. Sustain. Energy Rev. 2015, 47, 367–376. [Google Scholar] [CrossRef]
- Barros, C.P. Efficiency analysis of hydroelectric generating plants: A case study for Portugal. Energy Econ. 2008, 30, 59–75. [Google Scholar] [CrossRef]
- Lyu, X.; Shi, A. Research on the Renewable Energy Industry Financing Efficiency Assessment and Mode Selection. Sustainability 2018, 10, 222. [Google Scholar] [CrossRef]
- Kim, K.T.; Lee, D.J.; Park, S.J.; Zhang, Y.; Sultanov, A. Measuring the efficiency of the investment for renewable energy in Korea using data envelopment analysis. Renew. Sustain. Energy Rev. 2015, 47, 694–702. [Google Scholar] [CrossRef]
- Schmidt, P.; Sickles, R.C. Production Frontiers and Panel Data. J. Bus. Econ. Stat. 1984, 2, 299–326. [Google Scholar]
- Berger, A.N. Distribution-Free Estimates of Efficiency of the U.S. Banking Industry and Tests of the Standard Distributional Assumptions. J. Prod. Anal. 1993, 4, 261–292. [Google Scholar] [CrossRef]
- Berger, A.N.; Humphrey, D. The Dominance of Inefficiencies over Scale and Product Mix Economies in Bankin. J. Monet. Econ. 1991, 28, 117–148. [Google Scholar] [CrossRef]
- Aigner, D.J.C.; Lovell, A.K.; Schmidt, P. Formulation and Estimation of Stochastic Frontier Production Function Models. J. Econ. 1997, 6, 21–37. [Google Scholar] [CrossRef]
- De Koster, M.B.M.; Balk, B.M.; Van Nus, W.T.I. On using DEA for benchmarking container terminals. Int. J. Oper. Prod. Manag. 2009, 29, 1140–1155. [Google Scholar] [CrossRef]
- Charnes, A.; Cooper, W.W.; Rhodes, E. Measuring the efficiency of decision making units. Eur. J. Oper. Res. 1978, 2, 429–444. [Google Scholar] [CrossRef]
- Kim, C.; Kim, S.W. A Mathematical Approach to Supply Complexity Management Efficiency Evaluation for Supply Chain. Math. Probl. Eng. 2015, 2015, 1–8. [Google Scholar] [CrossRef]
- Banker, R.D.; Charnes, A.; Cooper, W.W. Some Models for Estimating Technical and Scale Inefficiencies in Data Envelopment Analysis. Manag. Sci. 1984, 30, 1078–1092. [Google Scholar] [CrossRef]
- Choi, H. 30% Limit on the Total Amount of Biomass. Electronic Newspapaer. 8 October 2014. Available online: http://www.etnews.com/20140808000080 (accessed on 20 May 2018).
- Lee, J.Y. RPS and FIT, We Should Expand the Domestic Market of Photovoltaic. Solar Today. 2018. Available online: http://www.solartodaymag.com/news/articleView.html?idxno=1837 (accessed on 20 May 2018).
- New and Renewable Energy’s Technical Development Basic Plan (2009~2030), 3rd ed.; Korea’s Ministry of Knowledge Economy: Seoul, Korea, 2008.


© 2018 by the authors. Licensee MDPI, Basel, Switzerland. This article is an open access article distributed under the terms and conditions of the Creative Commons Attribution (CC BY) license (http://creativecommons.org/licenses/by/4.0/).