The Relationship between Tourism, Carbon Dioxide Emissions, and Economic Growth in the Yangtze River Delta, China


Abstract
:1. Introduction
- (i)
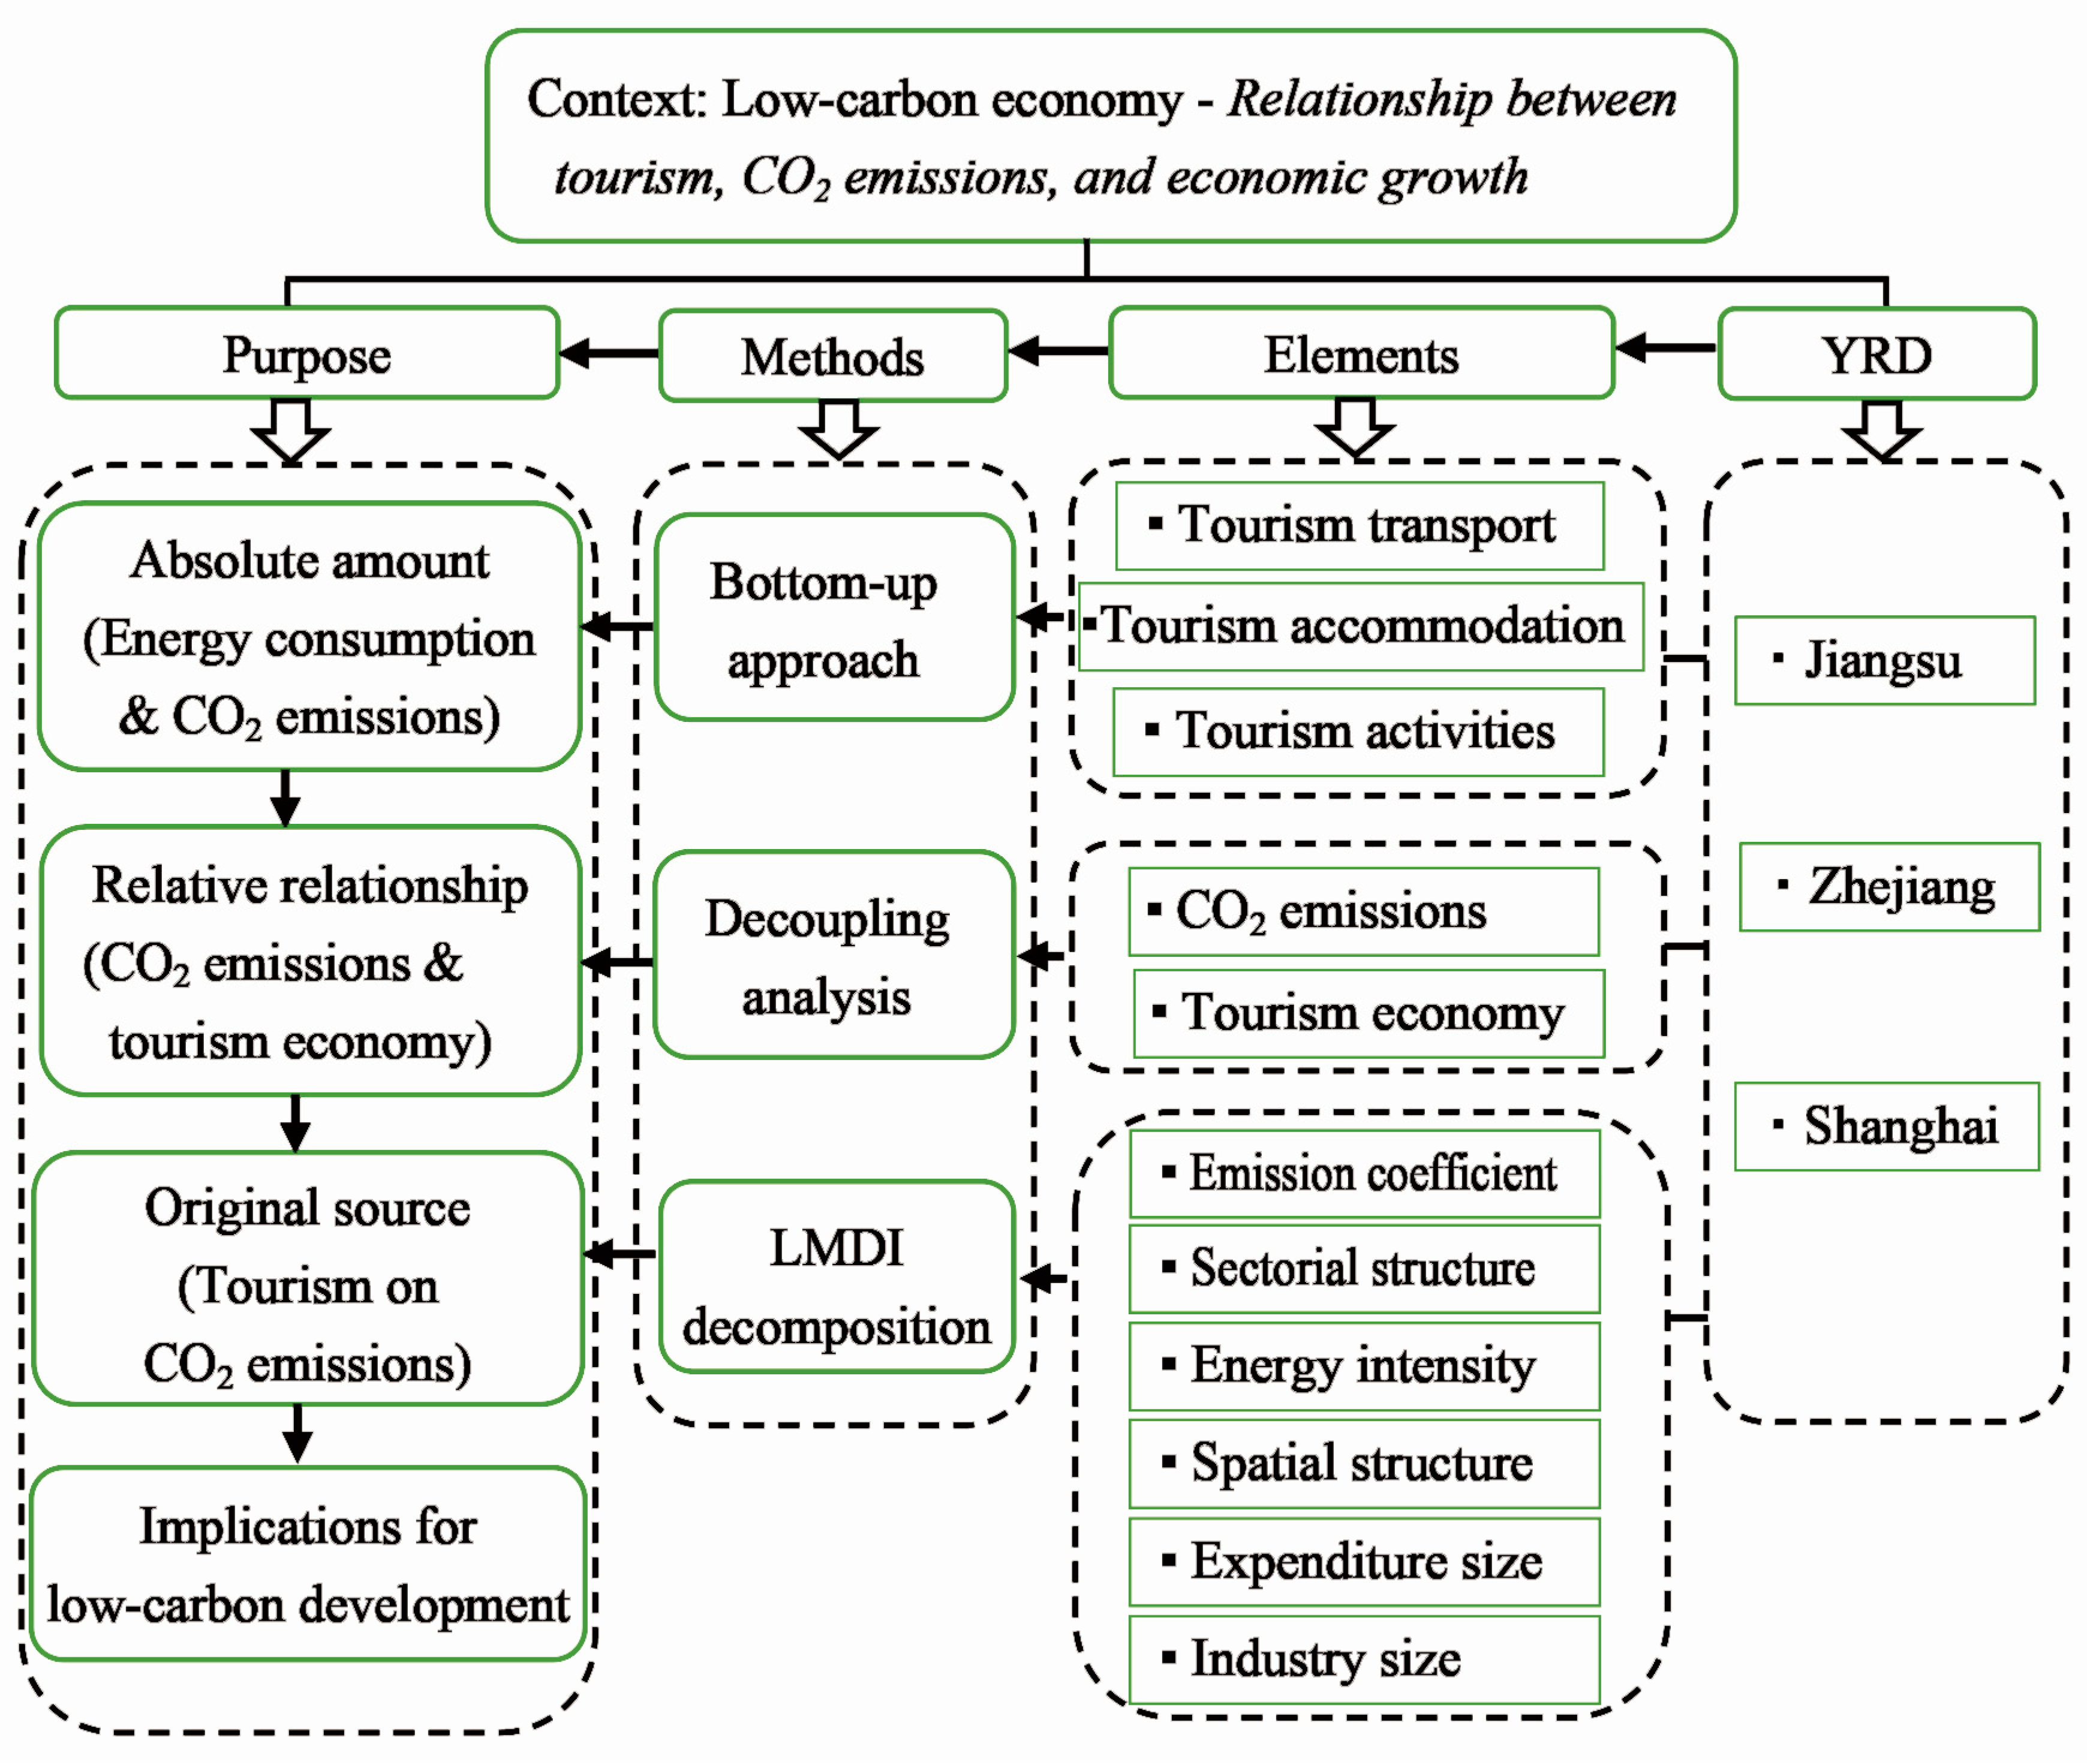
- Relative relationship between tourism-induced CO2 emissions and economic growth. This can be measured by the decoupling of carbon emissions to reveal the status of tourism development within a low-carbon economy approach. Decoupling index was proposed to evaluate the connection between economic change and environmental pressures [30,31], which can also be extended to determine the link between economic development and environmental changes induced by tourism growth.
- (ii)
- Separate effects of tourism on CO2 emissions to highlight the underlying factors to influence emissions, which can be investigated by the Logarithmic Mean Divisia Index (LMDI) decomposition method. This method has been preferred to explore the key factors that contribute to changes caused due to economic growth, environment pressures, and social development [29,32,33]. Collectively, these two issues provide a comprehensively quantitative basis to assess the linkage of tourism, carbon emissions, and economic growth. Furthermore, there is still very limited application in the use of decoupling analysis and LMDI decomposition within the tourism sector and subsectors [24,33].
2. Literature Review
2.1. Tourism-Induced CO2 Emissions: Scale and Method
2.2. Tourism-Induced CO2 Emissions in China
2.3. Decoupling Relation between CO2 Emissions and Economic Growth in Tourism
2.4. Decomposition of CO2 Emissions from Tourism Effects
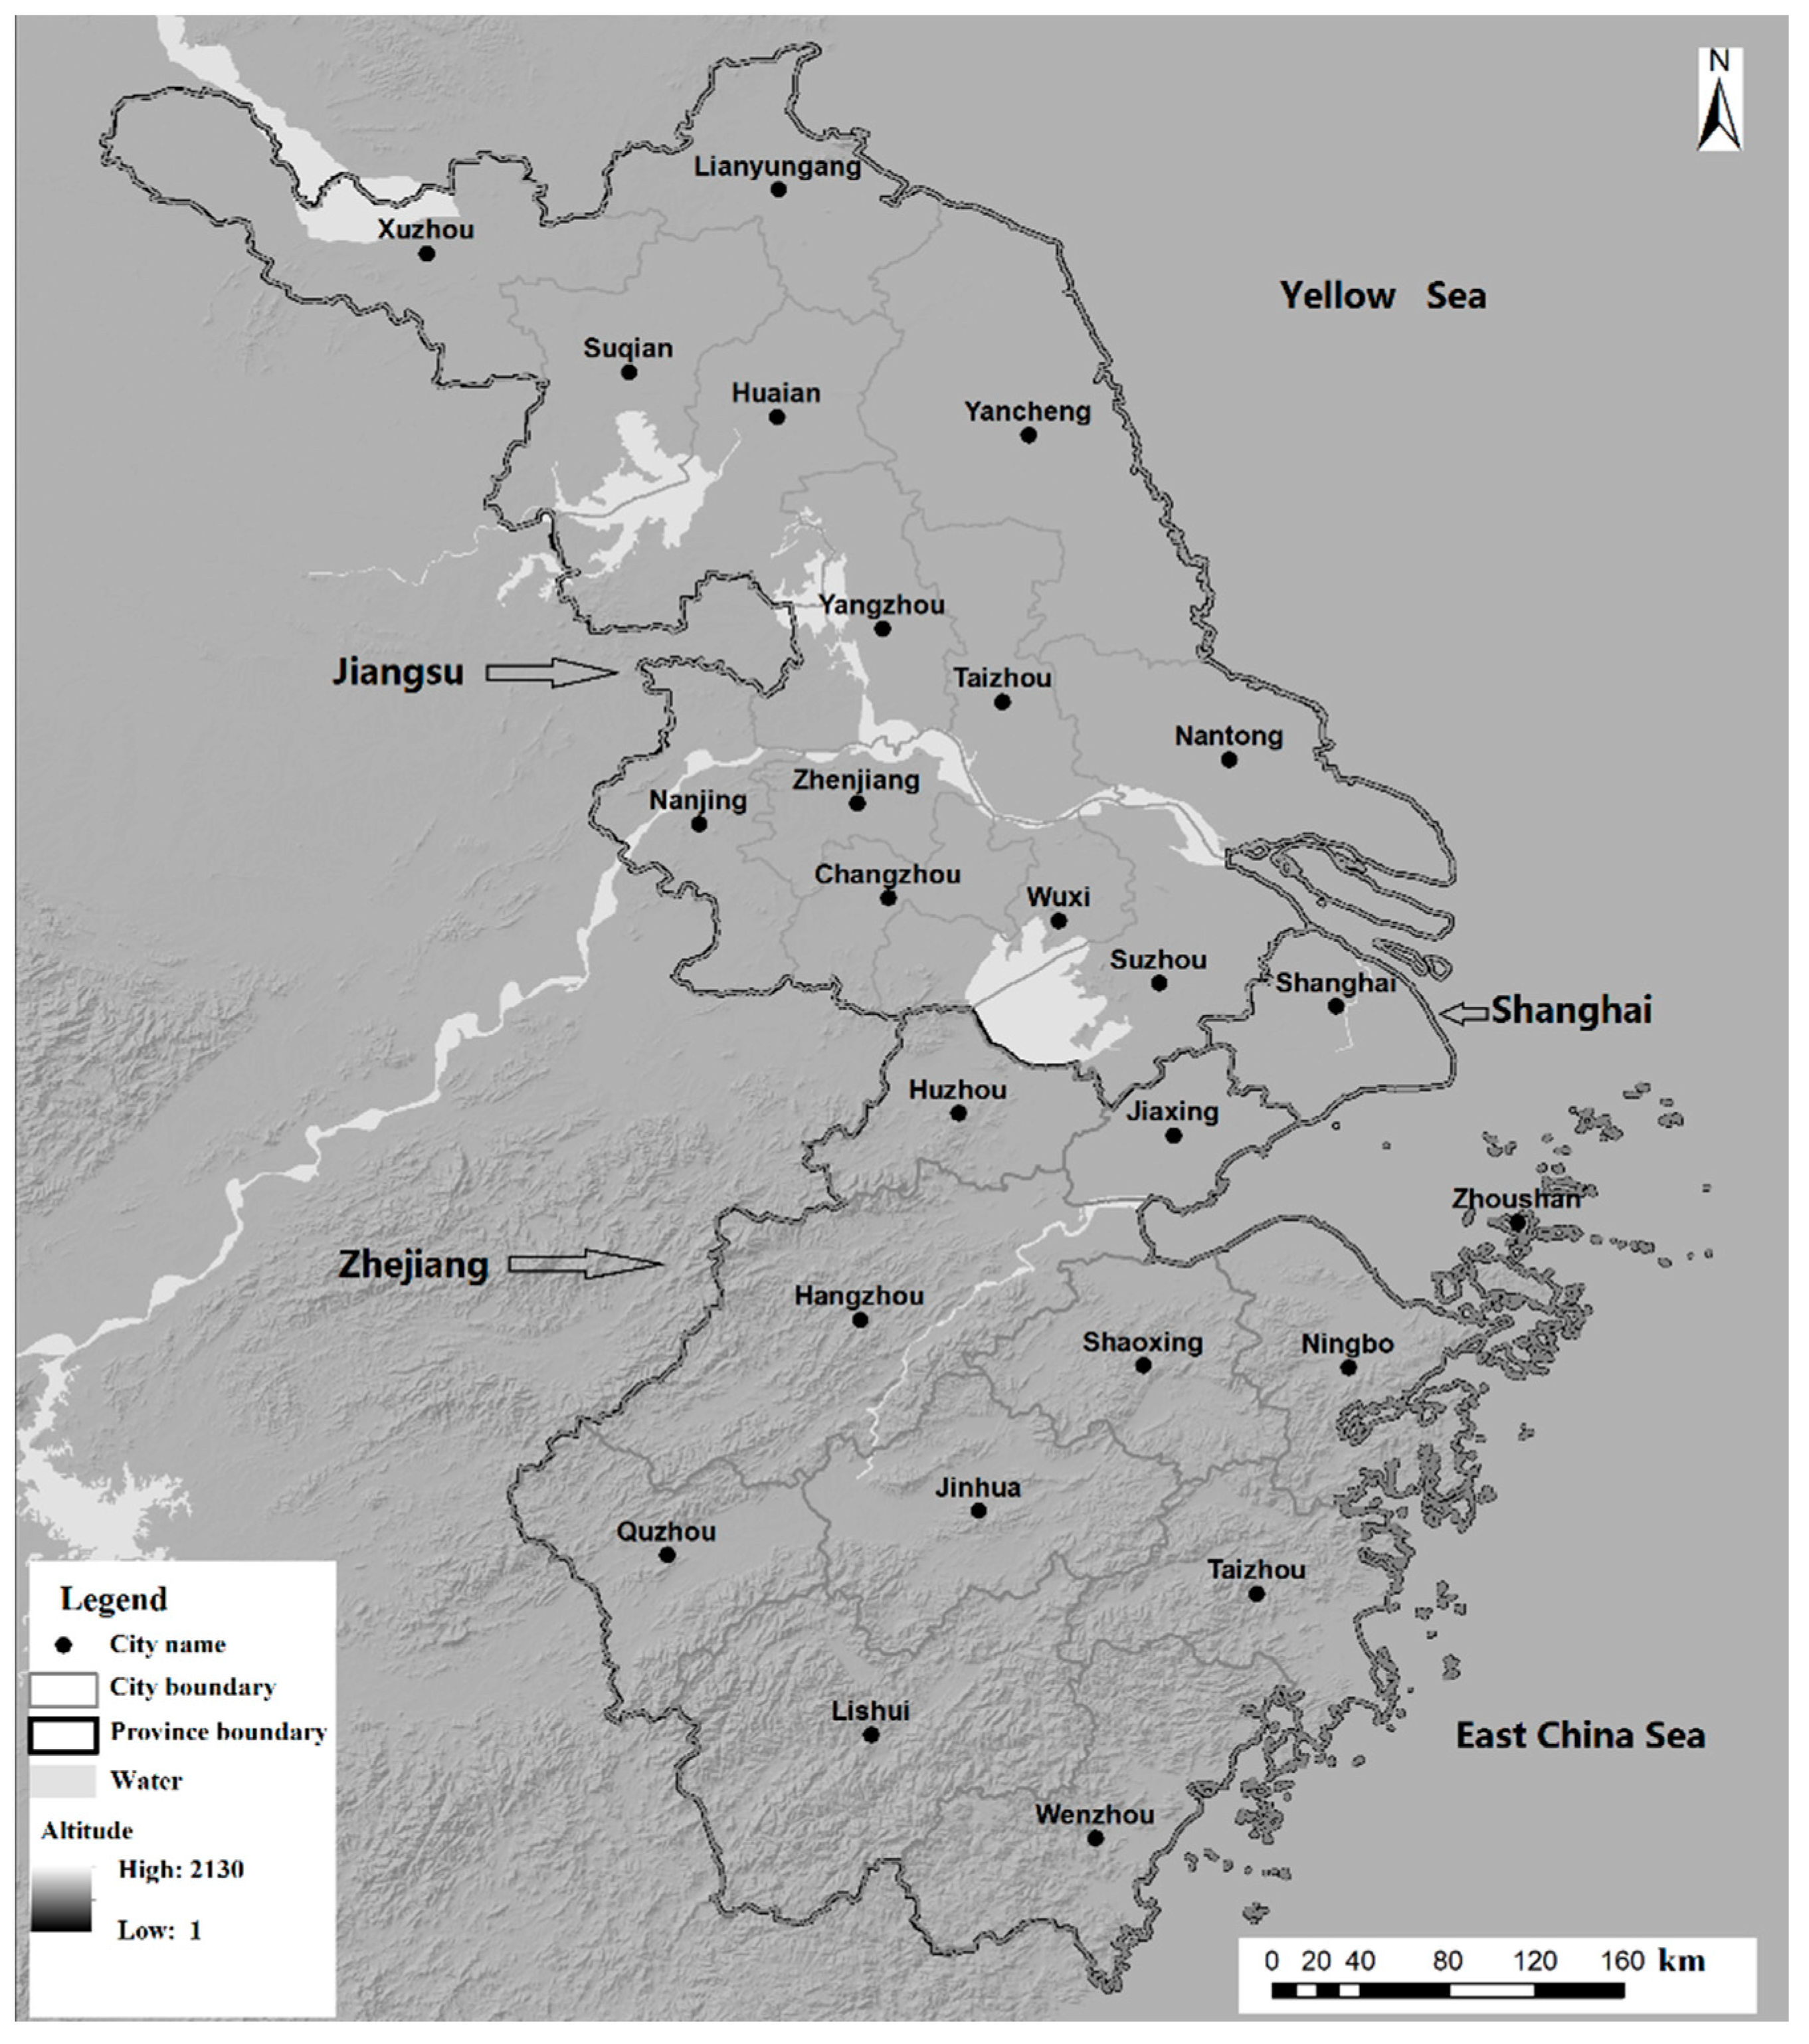
3. Study Area
4. Materials and Methods
4.1. Bottom-Up Approach
4.1.1. Tourism Transport
4.1.2. Accommodation
4.1.3. Tourism Activities
4.2. Decoupling Index
4.3. The Kaya Identity and LMDI Decomposition Model
4.4. Data Sources
5. Results
5.1. Tourism-Induced Energy Consumption and CO2 Emissions in the YRD
5.1.1. Total Amount in YRD
5.1.2. Comparison within the YRD
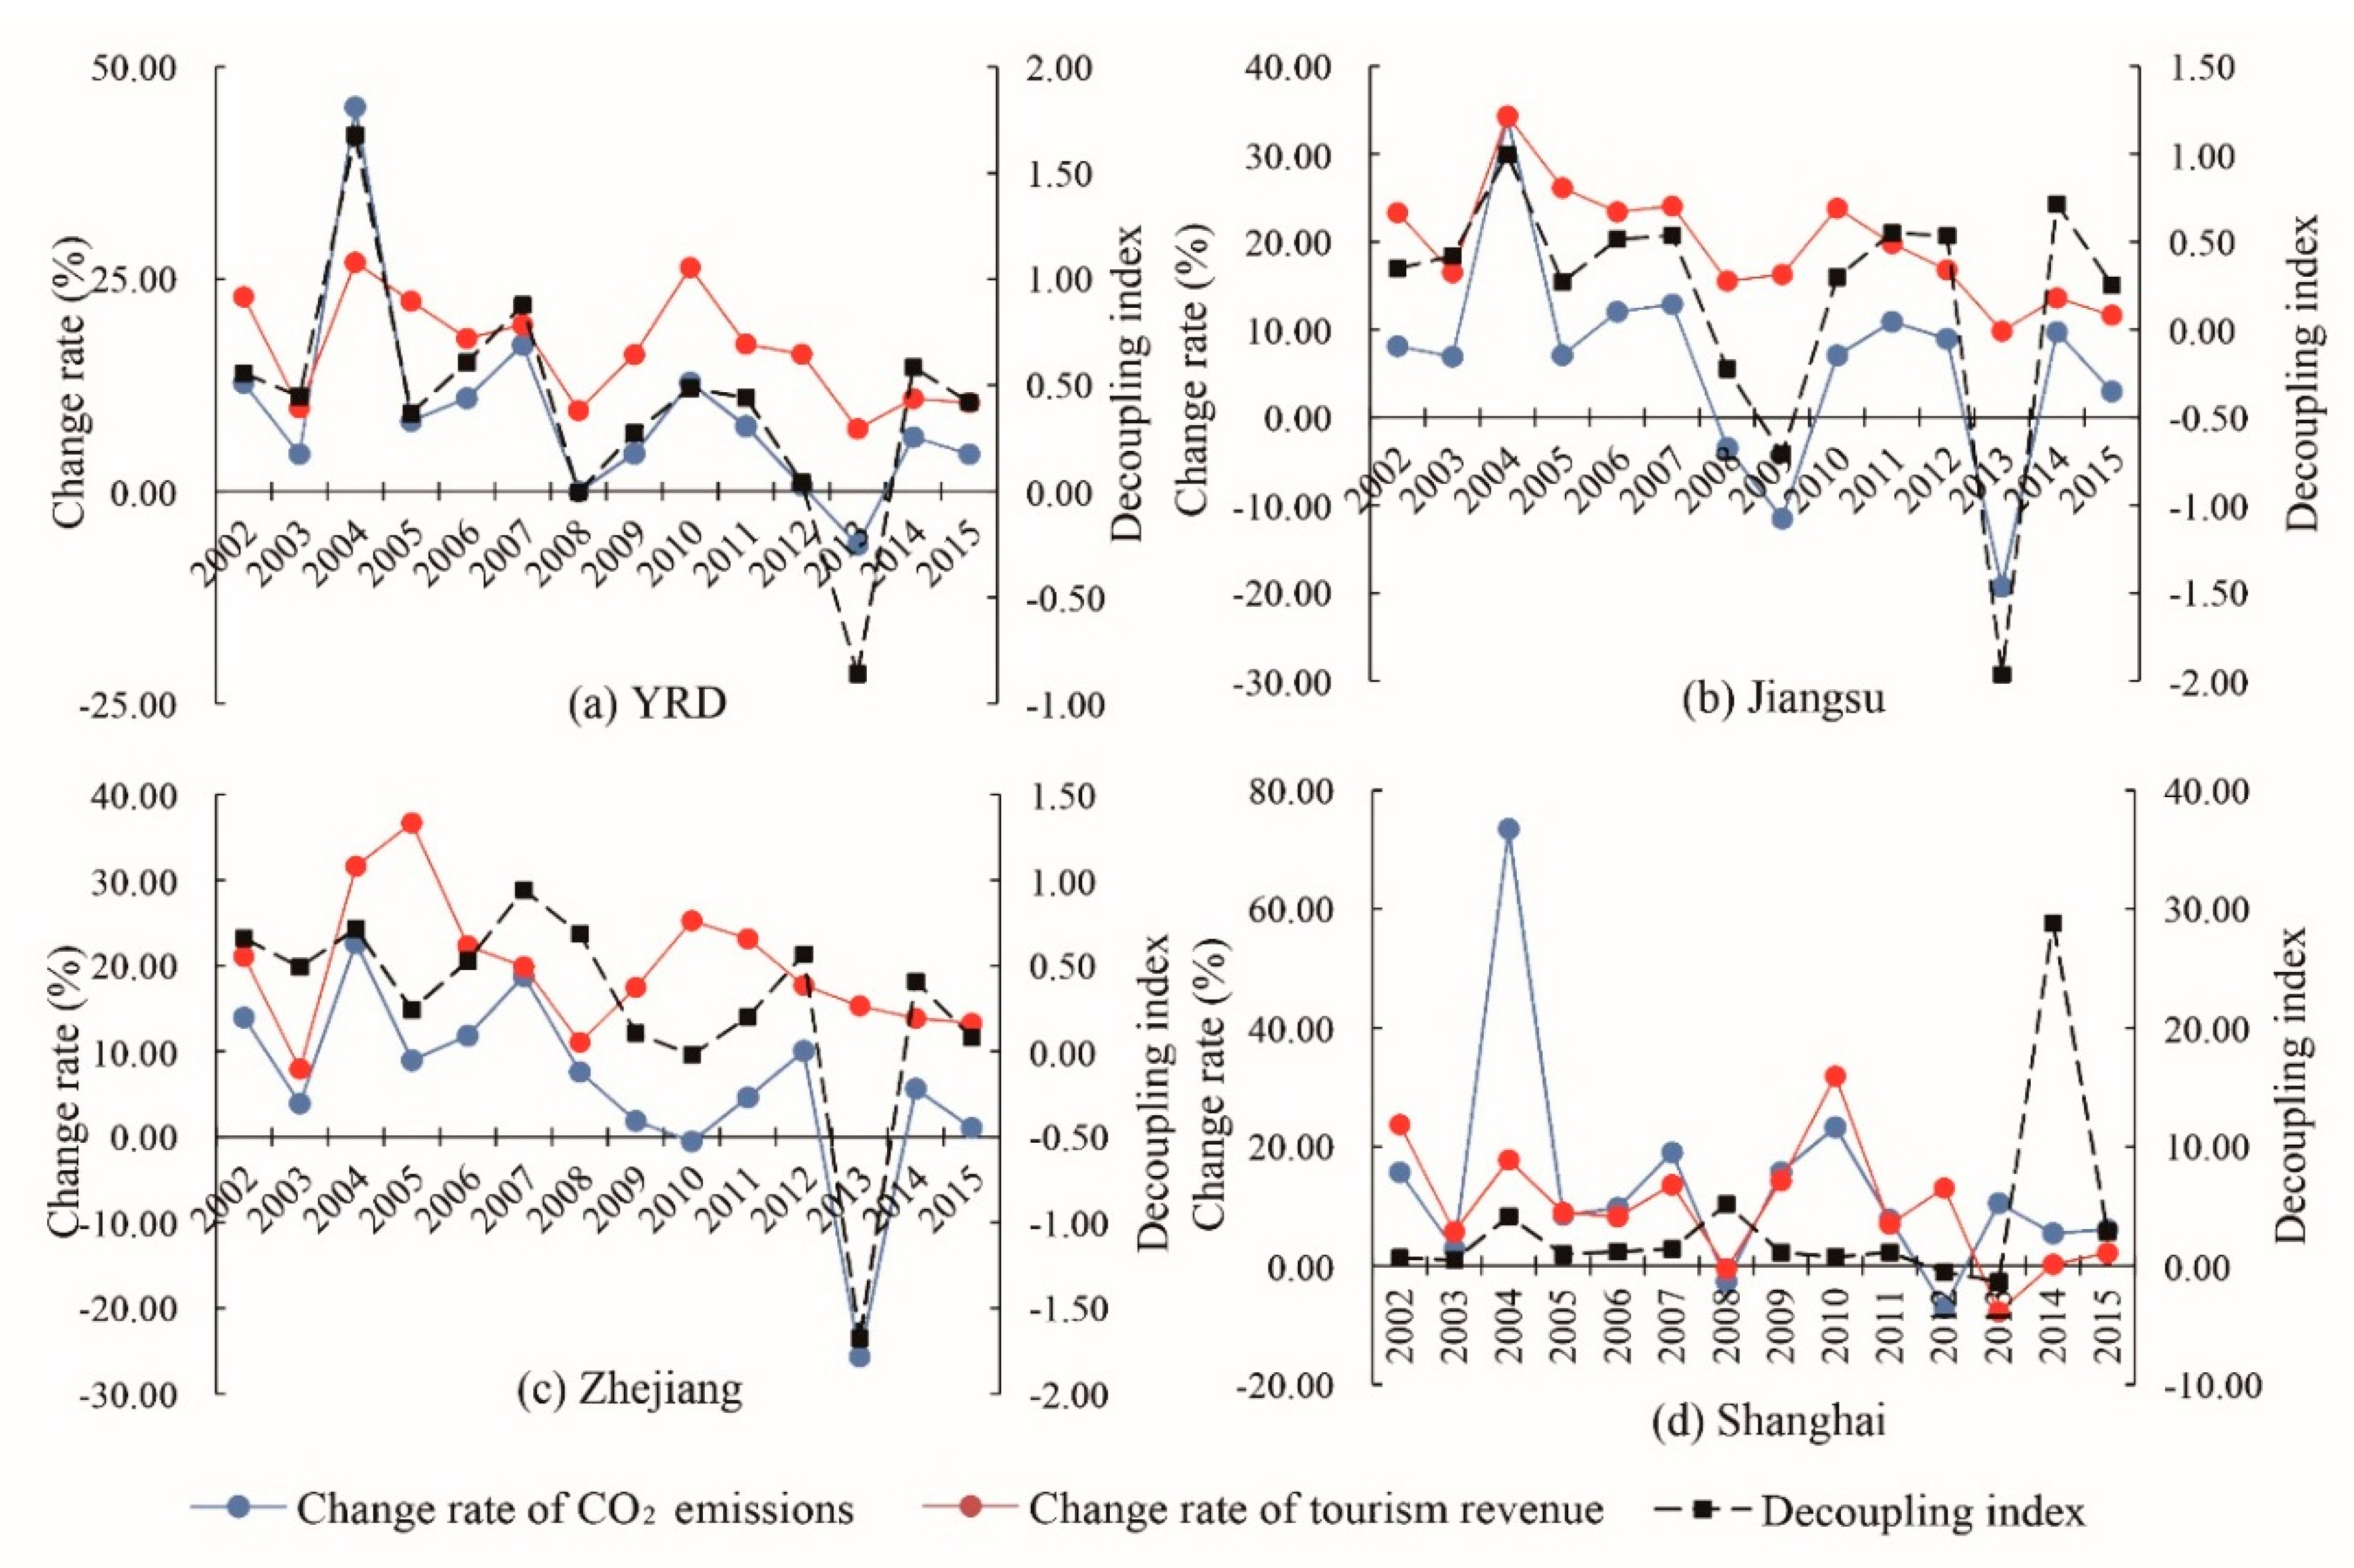
5.2. Decoupling of CO2 Emissions from YRD’s Tourism Economy
5.3. Separate Effects of Tourism on CO2 Emissions
5.3.1. Industry Size Effect
5.3.2. Expenditure Size Effect
5.3.3. Energy Intensity Effect
5.3.4. Spatial Structure Effect
5.3.5. Sectorial Structure Effect
6. Discussion
7. Conclusions
Author Contributions
Funding
Acknowledgments
Conflicts of Interest
References
- Gössling, S. National emissions from tourism: An overlooked policy challenge? Energy Policy 2013, 59, 433–442. [Google Scholar] [CrossRef]
- Gössling, S.; Buckley, R. Carbon labels in tourism: Persuasive communication? J. Clean. Prod. 2016, 111, 358–369. [Google Scholar] [CrossRef]
- UNWTO-UNEP-WMO. Climate Change and Tourism: Responding to Global Challenge; The World Tourism Organization and The United Nations Environment Programme: Madrid, Spain, 2008. [Google Scholar]
- G8. Declaration of the Leaders of the Major Economies Forum on Energy and Climate. Available online: https://www.icao.int/Meetings/AMC/MA/High%20Level%202009/HLMENV_IP003_en.pdf (accessed on 28 November 2017).
- Jiang, B.; Sun, Z.Q.; Liu, M.Q. China’s energy development strategy under the low-carbon economy. Energy 2010, 35, 4257–4264. [Google Scholar] [CrossRef]
- Lee, C.T.; Hashim, H.; Ho, C.S.; Fan, Y.V.; Klemeš, J.J. Sustaining the low-carbon emission development in Asia and beyond: Sustainable energy, water, transportation and low-carbon emission technology. J. Clean. Prod. 2017, 146, 1–13. [Google Scholar] [CrossRef]
- Aall, C. Sustainable tourism in practice: Promoting or perverting the quest for a sustainable development? Sustainability 2014, 6, 2562–2583. [Google Scholar] [CrossRef]
- Ozturk, I. The relationships among tourism development, energy demand, and growth factors in developed and developing countries. Int. J. Sustain. Dev. World 2016, 23, 122–131. [Google Scholar] [CrossRef]
- Paramati, S.R.; Alam, M.S.; Chen, C.F. The Effects of Tourism on Economic Growth and CO2 Emissions: A Comparison between Developed and Developing Economies. J. Travel Res. 2017, 56, 712–724. [Google Scholar] [CrossRef]
- Becken, S. Evidence of a low-carbon tourism paradigm? J. Sustain. Tour. 2017, 25, 832–850. [Google Scholar] [CrossRef]
- Gössling, S.; Scott, D.; Hall, C.M. Challenges of tourism in a low-carbon economy. Clim. Chang. 2013, 4, 525–538. [Google Scholar] [CrossRef]
- Shi, Y.; Du, Y.Y.; Yang, G.F.; Tang, Y.L.; Fan, L.K.; Zhang, J.; Lu, Y.J.; Ge, Y.; Chang, J. The use of green waste from tourist attractions for renewable energy production: The potential and policy implications. Energy Policy 2013, 62, 410–418. [Google Scholar] [CrossRef]
- Kasemsap, K. Sustainability, environmental sustainability, and sustainable tourism: Advanced issues and implications. In Business Infrastructure for Sustainability in Developing Economies, 1st ed.; Ray, N., Ed.; IGI Global: Hershey, PA, USA, 2016; pp. 1–24. ISBN 9781522520412. [Google Scholar]
- Zhang, J.K.; Zhang, Y. Carbon tax, tourism CO2 emissions and economic welfare. Ann. Tour. Res. 2018, 69, 18–30. [Google Scholar] [CrossRef]
- Perch-Nielsen, S.; Sesartic, A.; Stucki, M. The greenhouse gas intensity of the tourism sector: The case of Switzerland. Environ. Sci. Policy 2010, 13, 131–140. [Google Scholar] [CrossRef]
- Wu, P.; Shi, P.H. An estimation of energy consumption and CO2 emissions in tourism sector of China. J. Geogr. Sci. 2011, 21, 733–745. [Google Scholar] [CrossRef]
- Smith, I.J.; Rodger, C.J. Carbon emission offsets for aviation-generated emissions due to international travel to and from New Zealand. Energy Policy 2009, 37, 3438–3447. [Google Scholar] [CrossRef]
- Tao, Y.G.; Huang, Z.F. Review of accounting for carbon dioxide emissions from tourism at different spatial scales. Acta Ecol. Sin. 2014, 34, 246–254. [Google Scholar] [CrossRef]
- Surugiu, C.; Surugiu, M.R.; Breda, Z.; Dinca, A.I. An input-Output Approach of CO2 Emissions in Tourism Sector in Post-Communist Romania. Procedia Econ. Financ. 2012, 3, 987–992. [Google Scholar] [CrossRef]
- Dwyer, L.; Forsyth, P.; Spurr, R.; Hoque, S. Estimating the carbon footprint of Australian tourism. J. Sustain. Tour. 2010, 8, 355–376. [Google Scholar] [CrossRef]
- Martín-Cejas, R.R.; Sánchez, P.P.R. Ecological footprint analysis of road transport related to tourism activity: The case for Lanzarote Island. Tour. Manag. 2010, 31, 98–103. [Google Scholar] [CrossRef]
- Kuo, N.W.; Chen, P.H. Quantifying energy use, carbon dioxide emission, and other environmental loads from island tourism based on a life cycle assessment approach. J. Clean. Prod. 2009, 17, 1324–1330. [Google Scholar] [CrossRef]
- Ng, T.H.; Lye, C.T.; Lim, Y.S. A decomposition analysis of CO2 emissions: Evidence from Malaysia’s tourism industry. Int. J. Sustain. Dev. World 2016, 23, 266–277. [Google Scholar] [CrossRef]
- Tang, Z.; Shang, J.; Shi, C.B.; Liu, Z.; Bi, K.X. Decoupling indicators of CO2 emissions from the tourism industry in China: 1990–2012. Ecol. Indic. 2014, 46, 390–397. [Google Scholar] [CrossRef]
- Becken, S.; Simmons, D.; Frampton, C. Energy use associated with different travel choices. Tour. Manag. 2003, 24, 267–277. [Google Scholar] [CrossRef]
- UNWTO. Towards a Low Carbon Travel & Tourism Sector. Available online: http://www.greeningtheblue.org/sites/default/files/Towards%20a%20low%20carbon%20travel%20&%20tourism%20sector.pdf (accessed on 29 November 2017).
- Scott, D.; Peeters, P.; Gössling, S. Can tourism deliver its “aspirational” greenhouse gas emission reduction targets? J. Sustain. Tour. 2010, 18, 393–408. [Google Scholar] [CrossRef]
- Hsu, C.W.; Kuo, T.C.; Shyu, G.S.; Chen, P.S. Low carbon supplier selection in the hotel industry. Sustainability 2014, 6, 2658–2684. [Google Scholar] [CrossRef]
- Sun, Y.Y. Decomposition of tourism greenhouse gas emissions: Revealing the dynamics between tourism economic growth, technological efficiency, and carbon emissions. Tour. Manag. 2016, 55, 326–336. [Google Scholar] [CrossRef]
- Tapio, P. Towards a theory of decoupling: Degrees of decoupling in the EU and the case of road traffic in Finland between 1970 and 2001. Transp. Policy 2005, 12, 137–151. [Google Scholar] [CrossRef]
- Luken, R.A.; Piras, S. A critical overview of industrial energy decoupling programs in six developing countries in Asia. Energy Policy 2011, 39, 3869–3872. [Google Scholar] [CrossRef]
- Liu, J.; Feng, T.T.; Yang, X. The energy requirements and carbon dioxide emissions of tourism industry of Western China: A case of Chengdu city. Renew. Sustain. Energy Rev. 2011, 15, 2887–2894. [Google Scholar] [CrossRef]
- Robaina-Alves, M.; Moutinho, V.; Costa, R. Change in energy-related CO2 (carbon dioxide) emissions in Portuguese tourism: A decomposition analysis from 2000 to 2008. J. Clean. Prod. 2016, 111, 520–538. [Google Scholar] [CrossRef]
- China Tourism Academy. Annual Report of Tourism Statistics in 2016 and Prediction of Tourism Economy in 2017; China Tourism Academy: Beijing, China, 2017; Available online: http://www.ctaweb.org/html/2017-2/2017-2-24-9-10-97907.html (accessed on 29 November 2017). (In Chinese)
- National Tourism Administration of the People’s Republic of China. The Yearbook of China Tourism Statistics; China Travel Press: Beijing, China, 2001. (In Chinese)
- Luo, F.; Becken, S.; Zhong, Y.D. Changing travel patterns in China and ‘carbon footprint’ implications for a domestic tourist destination. Tour. Manag. 2018, 65, 1–13. [Google Scholar] [CrossRef]
- Cai, M.; Wang, Y.M. Low-carbon Tourism: A New Mode of Tourism Development. Tour. Trib. 2010, 25, 13–17. (In Chinese) [Google Scholar]
- Dou, X.S.; Cui, H.Y. Low-carbon society creation and socio-economic structural transition in China. Environ. Dev. Sustain. 2017, 19, 1577–1599. [Google Scholar] [CrossRef]
- Wang, K.; Xiao, Y.; Li, Z.M.; Liu, H.L. Decomposition of China’s tourism carbon emissions: Based on LMDI method. Tour. Sci. 2016, 30, 13–27. (In Chinese) [Google Scholar]
- Xie, Y.F.; Zhao, Y. Measuring carbon dioxide emissions from energy consumption by tourism in Yangtze River Delta. Geogr. Res. 2012, 31, 429–438. (In Chinese) [Google Scholar]
- Peeters, P.; Dubois, G. Tourism travel under climate change mitigation constraints. J. Transp. Geogr. 2010, 13, 131–140. [Google Scholar] [CrossRef]
- Becken, S.; Frampton, C.; Simmons, D. Energy consumption patterns in the accommodation sector: The New Zealand case. Ecol. Econ. 2001, 39, 371–386. [Google Scholar] [CrossRef]
- Nepal, S.K. Tourism-induced rural energy consumption in the Annapurna regional of Nepal. Tour. Manag. 2008, 29, 89–100. [Google Scholar] [CrossRef]
- Katircioglu, S.T.; Feridun, M.; Kilinc, C. Estimating tourism-induced energy consumption and CO2 emissions: The case of Cyprus. Renew. Sustain. Energy Rev. 2014, 29, 634–640. [Google Scholar] [CrossRef]
- Jones, C. Scenarios for greenhouse gas emissions reduction from tourism: An extended tourism satellite account approach in a regional setting. J. Sustain. Tour. 2013, 21, 458–472. [Google Scholar] [CrossRef]
- Becken, S.; Patterson, M. Measuring National Carbon Dioxide Emissions from Tourism as a Key Step Towards Achieving Sustainable Tourism. J. Sustain. Tour. 2006, 14, 323–328. [Google Scholar] [CrossRef]
- Sharp, H.; Grundius, J.; Heinonen, J. Carbon footprint of inbound tourism to Iceland: A consumption-based life-cycle assessment including direct and indirect emissions. Sustainability 2016, 8, 1147. [Google Scholar] [CrossRef]
- Zhong, Y.D.; Shi, S.Y.; Li, S.H.; Luo, F.; Luo, W.L. Empirical research on measurement framework construction for tourist industry carbon emission in China: A perspective of input-output. J. Cent. South Univ. For. Technol. 2015, 35, 144. (In Chinese) [Google Scholar]
- Meng, W.Q.; Xu, L.Y.; Hu, B.B.; Zhou, J.; Wang, Z.L. Quantifying direct and indirect carbon dioxide emissions of the Chinese tourism industry. J. Clean. Prod. 2016, 126, 586–594. [Google Scholar] [CrossRef]
- Bao, Z.X.; Yuan, S.Q.; Chen, G.S. Carbon dioxide emission from tourist transport in three destinations of different travel distances. Sci. Geogr. Sin. 2012, 32, 1168–1174. (In Chinese) [Google Scholar]
- Li, C.Y.; Chen, X.P.; Zhang, Z.L.; Feng, H.H. Estimation of tourism carbon emission and its decoupling with tourism development in Dunhuang. Ecol. Sci. 2016, 35, 109–116. (In Chinese) [Google Scholar]
- Tao, Y.G.; Huang, Z.F.; Wu, L.M.; Yu, F.L.; Wang, K. Measuring carbon dioxide emissions for regional tourism and its factor decomposition: A case study of Jiangsu province. Acta Geogr. Sin. 2014, 69, 1438–1448. (In Chinese) [Google Scholar]
- Wang, J.H.; Li, X. The effect of sector decoupling between China’s industrial economic growth and carbon dioxide emissions. Econ. Geogr. 2015, 35, 105–110. (In Chinese) [Google Scholar]
- Organization for Economic Co-operation and Development. Indicators to Measure Decoupling of Environmental Pressure from Economic Growth. Available online: https://www.oecd.org/env/indicators-modelling-outlooks/1933638.pdf (accessed on 29 November 2017).
- Vehmas, J.; Malaska, P.; Luukkanen, J.; Kaivo-oja, J.; Hietanen, O.; Vinnari, M.; Ilvonen, J. Europe in the Global Battle of Sustainability: Rebound Strikes Back?—Advanced Sustainability Analysis; Series Discussion and Working Papers, No. 7; Publications of the Turku School of Economics and Business Administration: Turku, Finland, 2003. [Google Scholar]
- Zhang, M.; Wang, W.W. Decouple indicators on the CO2 emission-economic growth linkage: The Jiangsu Province case. Ecol. Indic. 2013, 32, 239–244. [Google Scholar] [CrossRef]
- Vehmas, J.; Luukkanen, J.; Kaivo-Oja, J. Linking analyses and environmental Kuznets Curves for material flows in the European Union 1980–2000. J. Clean. Prod. 2007, 15, 1662–1673. [Google Scholar] [CrossRef]
- Climent, F.; Pardo, A. Decoupling factors on the energy-output linkage: The Spanish case. Energy Policy 2007, 35, 522–528. [Google Scholar] [CrossRef]
- Wang, Y.H.; Xie, T.Y.; Yang, S.L. Carbon emission and its decoupling research of transportation in Jiangsu Province. J. Clean. Prod. 2017, 142, 907–914. [Google Scholar] [CrossRef]
- Lee, J.W.; Brahmasrene, T. Investigating the influence of tourism on economic growth and carbon emissions: Evidence from panel analysis of the European Union. Tour. Manag. 2013, 38, 69–76. [Google Scholar] [CrossRef]
- Ang, B.W.; Zhang, F.Q.; Choi, K.H. Factorizing changes in energy and environmental indicators through decomposition. Energy 1998, 23, 489–495. [Google Scholar] [CrossRef]
- Ang, B.W. Decomposition analysis for policymaking in energy: Which is the preferred method? Energy Policy 2004, 32, 1131–1139. [Google Scholar] [CrossRef]
- Ang, B.W.; Liu, F.L.; Chew, E.P. Perfect decomposition techniques in energy and environmental analysis. Energy Policy 2003, 31, 1561–1566. [Google Scholar] [CrossRef]
- Lu, I.J.; Lin, S.J.; Lewis, C. Decomposition and decoupling effects of carbon dioxide emission from highway transportation in Taiwan, Germany, Japan and South Korea. Energy Policy 2007, 35, 3226–3235. [Google Scholar] [CrossRef]
- Tang, C.C.; Zhong, L.S.; Ng, P. Factors that Influence the Tourism Industry’s Carbon Emissions: A Tourism Area Life Cycle Model Perspective. Energy Policy 2017, 109, 704–718. [Google Scholar] [CrossRef]
- Albrecht, J.; Francois, D.; Schoors, K. A Shapley decomposition of carbon emissions without residuals. Energy Policy 2002, 30, 727–736. [Google Scholar] [CrossRef]
- Ye, B.; Jiang, J.J.; Li, C.S.; Miao, L.X.; Tang, J. Quantification and driving force analysis of provincial-level carbon emissions in China. Appl. Energy 2017, 198, 223–238. [Google Scholar] [CrossRef]
- Zhou, X.; Zhang, M.; Zhou, M.H.; Zhou, M. A comparative study on decoupling relationship and influence factors between China’s regional economic development and industrial energy-related carbon emissions. J. Clean. Prod. 2017, 142, 783–800. [Google Scholar] [CrossRef]
- National Development and Reform Commission. Circular of the National Development and Reform Commission on printing the Regional Plans for the Yangtze River Delta. Available online: http://www.ndrc.gov.cn/zcfb/zcfbghwb/201006/t20100622_585472.html (accessed on 28 November 2017). (In Chinese)
- Zhang, H.; Gu, C.L.; Gu, L.W.; Zhang, Y. The evaluation of tourism destination competitiveness by TOPSIS & information entropy—A case in the Yangtze River Delta of China. Tour. Manag. 2011, 32, 443–451. [Google Scholar] [CrossRef]
- National Bureau of Statistics. Statistical Bulletin on National Economic and Social Development of Provinces and Municipalities in 2015. Available online: http://district.ce.cn/zg/201602/25/t20160225_9083623.shtml (accessed on 28 November 2017). (In Chinese)
- National Bureau of Statistics. Statistical Bulletin on National Economic and Social Development of Shanghai in 2001. Available online: http://www.shanghai.gov.cn/nw2/nw2314/nw2319/nw2404/nw4361/nw4371/u26aw259.html (accessed on 28 November 2017). (In Chinese)
- National Bureau of Statistics. Statistical bulletin on national economic and social development of Jiangsu in 2001. Available online: http://www.jssb.gov.cn/jstjgove/goveinfo/201112/t20111219_23492.html (accessed on 28 November 2017). (In Chinese)
- National Bureau of Statistics. Statistical Bulletin on National Economic and Social Development of Zhejiang in 2001. Available online: http://tjj.zj.gov.cn/tjgb/gmjjshfzgb/200203/t20020307_122151.html (accessed on 28 November 2017). (In Chinese)
- Wei, Y.X.; Sun, G.N.; Ma, L.J.; Li, J. Estimating the carbon emissions and regional differences of tourism transport in China. J. Shananxi Norm. Univ. (Natur. Sci. Ed.) 2012, 40, 76–84. (In Chinese) [Google Scholar]
- Carlsson-Kanyama, A.; Lindén, A.L. Travel patterns and environmental effects now and in the future: Implications of differences in energy consumption among socio-economic groups. Ecol. Econ. 1999, 30, 405–417. [Google Scholar] [CrossRef]
- Lenzen, M. Total requirements of energy and greenhouse gases for Australian transport. Transp. Res. Part D Transp. Environ. 1999, 4, 265–290. [Google Scholar] [CrossRef]
- Gössling, S. Global environmental consequences of tourism. Glob. Environ. Chang. 2002, 12, 283–302. [Google Scholar] [CrossRef]
- Kaya, Y. Impact of Carbon Dioxide Emissions on GNP Growth: Interpretation of Proposed Scenarios; IPCC Energy and Industry Subgroup, Response Strategies Working Group: Paris, France, 1990. [Google Scholar]
- Ang, B.W.; Liu, F.L. A new energy decomposition method: Perfect in decomposition and consistent in aggregation. Energy 2001, 26, 537–548. [Google Scholar] [CrossRef]
- Ang, B.W. The LMDI approach to decomposition analysis: A practical guide. Energy Policy 2005, 33, 867–871. [Google Scholar] [CrossRef]
- Policy and Regulation Department of the National Tourism Administration. The Sample Survey Information of Inbound Tourist; China Travel & Tourism Press: Beijing, China, 2002–2009. (In Chinese)
- Policy and Regulation Department of the National Tourism Administration. Tourism Sample Survey Information; China Travel & Tourism Press: Beijing, China, 2010–2016. (In Chinese)
- Policy and Regulation Department of the National Tourism Administration. Chinese Domestic Tourism Sample Survey Information; China Travel & Tourism Press: Beijing, China, 2002–2016. (In Chinese)
- State Council. Circular of the Stat Council on Issuing the Comprehensive Work Plan for Energy Saving and Emission Reduction in the 12th Five-Year Plan. Available online: http://www.gov.cn/zwgk/2011-09/07/content_1941731.htm (accessed on 29 November 2017). (In Chinese)
- Sheng, Y.C. On the evolution of the optimization of tourism industrial structure to the contribution of economic growth of regional tourism. Tour. Trib. 2012, 27, 11–19. (In Chinese) [Google Scholar]
- Gössling, S.; Hansson, C.B.; Hörstmeier, O.; Saggel, S. Ecological footprint analysis as a tool to assess tourism sustainability. Ecol. Econ. 2002, 43, 199–211. [Google Scholar] [CrossRef]
- Gössling, S.; Peeters, P.; Ceron, J.P.; Dubois, G.; Patterson, T.; Richardson, R.B. The Eco-efficiency of Tourism. Ecol. Econ. 2005, 54, 417–434. [Google Scholar] [CrossRef]
- Sherafatian-Jahromi, R.; Othman, M.S.; Law, S.H.; Ismail, N.W. Tourism and CO2 emissions nexus in Southeast Asia: New evidence from panel estimation. Environ. Dev. Sustain. 2017, 19, 1407–1423. [Google Scholar] [CrossRef]
- Xu, X.B.; Chen, S.; Yang, G.S. Characteristics and impact mechanism of carbon emission for urban residents’ transport in the Yangtze River Delta, China. Resour. Env. Yangtze Basin 2014, 23, 1064–1071. (In Chinese) [Google Scholar]
- Becken, S. Operators’ perceptions of energy use and actual saving opportunities for tourism accommodation. Asia Pac. J. Tour. Res. 2013, 18, 72–91. [Google Scholar] [CrossRef]
- Tian, J.P. Modeling and empirical research on international metropolis tourism industrial structure multi-objective optimization model: Based on optimizing Shanghai tourism industrial structure. Shanghai J. Econ. 2012, 11, 100–111. (In Chinese) [Google Scholar]


| State | %ΔLCO2 | %ΔL | LD | Relationship with Sustainability |
|---|---|---|---|---|
| Strong decoupling | <0 | >0 | <0 | The best state towards sustainability under the low-carbon tourism economy. |
| Weak decoupling | >0 | >0 | 0 < LD < 1 | The state is desirable. |
| Negative decoupling | >0 | >0 | >1 | The state is not favorable for sustainability. |
| Recessive decoupling | <0 | <0 | >1 | The state is not favorable for sustainability. |
| Weak negative decoupling | <0 | <0 | 0 < LD < 1 | The state is not favorable for sustainability. |
| Strong negative decoupling | >0 | <0 | <0 | The worst state towards sustainability under the low-carbon tourism economy. |
| Year | Energy Consumption (108 MJ) | CO2 Emissions (104 t) | ||||||
|---|---|---|---|---|---|---|---|---|
| E1 | E2 | E3 | Total | C1 | C2 | C3 | Total | |
| 2001 | 760.85 | 106.97 | 29.09 | 896.90 | 488.70 | 169.44 | 15.41 | 673.55 |
| 2002 | 856.45 | 120.24 | 33.40 | 1010.09 | 551.46 | 190.46 | 17.64 | 759.57 |
| 2003 | 897.12 | 122.86 | 33.52 | 1053.50 | 580.57 | 194.60 | 17.65 | 792.83 |
| 2004 | 1288.31 | 183.92 | 41.12 | 1513.35 | 838.94 | 291.33 | 21.57 | 1151.84 |
| 2005 | 1428.85 | 182.13 | 47.45 | 1658.43 | 933.48 | 288.50 | 24.88 | 1246.86 |
| 2006 | 1611.26 | 188.65 | 55.72 | 1855.64 | 1055.28 | 298.83 | 29.24 | 1383.35 |
| 2007 | 1929.21 | 201.60 | 63.77 | 2194.58 | 1268.93 | 319.34 | 33.36 | 1621.63 |
| 2008 | 1994.38 | 171.46 | 72.36 | 2238.20 | 1311.01 | 271.59 | 38.20 | 1620.79 |
| 2009 | 2100.63 | 168.30 | 85.11 | 2354.03 | 1380.84 | 266.58 | 45.32 | 1692.74 |
| 2010 | 2450.10 | 152.87 | 112.61 | 2715.58 | 1606.73 | 242.15 | 60.49 | 1909.37 |
| 2011 | 2666.14 | 146.98 | 138.00 | 2951.12 | 1747.28 | 232.81 | 75.46 | 2055.54 |
| 2012 | 2614.91 | 173.60 | 161.63 | 2950.13 | 1705.75 | 274.98 | 88.48 | 2069.22 |
| 2013 | 2531.50 | 138.29 | 177.66 | 2847.45 | 1621.62 | 219.04 | 97.59 | 1938.25 |
| 2014 | 2685.06 | 137.55 | 239.57 | 3062.18 | 1704.57 | 217.88 | 139.54 | 2061.99 |
| 2015 | 2810.54 | 138.19 | 258.67 | 3207.40 | 1782.62 | 218.89 | 150.76 | 2152.27 |
| Factor | Sector | 2001–2005 | 2006–2010 | 2011–2015 | 2001–2015 |
|---|---|---|---|---|---|
| Industry size/104 t | JT | 488.51 | 1020.59 | 757.44 | 2266.54 |
| J1 | 360.77 | 824.41 | 636.63 | 1821.81 | |
| J2 | 117.35 | 169.13 | 81.52 | 368.00 | |
| J3 | 10.38 | 27.05 | 39.29 | 76.72 | |
| Expenditure size/104 t | JT | 196.41 | 42.59 | 131.10 | 370.10 |
| J1 | 145.05 | 31.36 | 110.19 | 286.61 | |
| J2 | 47.18 | 10.20 | 14.11 | 71.49 | |
| J3 | 4.18 | 1.03 | 6.80 | 12.00 | |
| Energy intensity/104 t | JT | −272.90 | −296.50 | −382.50 | −951.90 |
| J1 | −49.48 | −182.14 | −253.24 | −484.86 | |
| J2 | −219.29 | −98.73 | −88.23 | −406.25 | |
| J3 | −4.13 | −15.63 | −41.03 | −60.79 | |
| Spatial structure/104 t | JT | −13.25 | −59.96 | −322.98 | −396.18 |
| J1 | −22.58 | −63.06 | −330.15 | −415.79 | |
| J2 | 8.74 | 2.77 | 0.63 | 12.14 | |
| J3 | 0.59 | 0.33 | 6.55 | 7.47 | |
| Sectorial structure/104 t | JT | 2.04 | −84.06 | −17.60 | −99.62 |
| J1 | 6.13 | 34.76 | −59.07 | −18.18 | |
| J2 | −2.73 | −136.29 | −21.95 | −160.97 | |
| J3 | −1.35 | 17.47 | 63.42 | 79.53 | |
| Total/104 t | JT | 400.82 | 622.66 | 165.46 | 1188.94 |
| J1 | 439.90 | 645.33 | 104.36 | 1189.59 | |
| J2 | −48.75 | −52.92 | −13.92 | −115.59 | |
| J3 | 9.67 | 30.24 | 75.02 | 112.76 |
| Year | Sub-Region | Sector | Industry Size/104 t | Expenditure Size/104 t | Energy Intensity/104 t | Spatial Structure/104 t | Sectorial Structure/104 t |
|---|---|---|---|---|---|---|---|
| 2001–2005 | Jiangsu | J1 | 98.43 | 39.57 | −84.91 | 27.76 | −16.42 |
| J2 | 42.61 | 17.13 | −36.76 | 12.02 | 35.44 | ||
| J3 | 4.11 | 1.65 | −3.55 | 1.16 | 2.20 | ||
| Zhejiang | J1 | 94.39 | 37.95 | −73.84 | 20.49 | −3.05 | |
| J2 | 44.21 | 17.78 | −202.40 | 9.60 | 5.21 | ||
| J3 | 3.25 | 1.31 | −2.55 | 0.71 | 0.86 | ||
| Shanghai | J1 | 167.96 | 67.53 | 109.28 | −70.82 | 25.60 | |
| J2 | 30.53 | 12.28 | 19.87 | −12.87 | −43.37 | ||
| J3 | 3.02 | 1.21 | 1.96 | −1.27 | −4.41 | ||
| 2006–2010 | Jiangsu | J1 | 171.95 | 6.54 | −159.88 | 19.38 | 13.81 |
| J2 | 67.07 | 2.55 | −62.36 | 7.56 | −61.73 | ||
| J3 | 11.28 | 0.43 | −10.49 | 1.27 | 9.21 | ||
| Zhejiang | J1 | 192.16 | 7.31 | −14.09 | 5.96 | 13.25 | |
| J2 | 66.41 | 6.29 | −35.74 | 2.06 | −47.59 | ||
| J3 | 9.34 | 0.36 | −5.03 | 0.29 | 5.00 | ||
| Shanghai | J1 | 460.30 | 17.51 | −8.17 | −88.40 | 7.70 | |
| J2 | 35.65 | 1.36 | −0.63 | −6.85 | −26.96 | ||
| J3 | 6.42 | 0.24 | −0.11 | −1.23 | 3.26 | ||
| 2011–2015 | Jiangsu | J1 | 116.46 | 20.16 | −129.49 | 20.23 | −22.53 |
| J2 | 28.64 | 4.96 | −31.84 | 4.97 | −14.50 | ||
| J3 | 16.72 | 2.89 | −18.59 | 2.90 | 26.98 | ||
| Zhejiang | J1 | 121.28 | 20.99 | −207.40 | 45.78 | −28.43 | |
| J2 | 35.15 | 6.08 | −60.11 | 13.27 | −7.17 | ||
| J3 | 14.15 | 2.45 | −24.20 | 5.34 | 29.57 | ||
| Shanghai | J1 | 398.88 | 69.04 | 83.65 | −396.16 | −8.10 | |
| J2 | 17.74 | 3.07 | 3.72 | −17.62 | −0.29 | ||
| J3 | 8.41 | 1.46 | 1.76 | −1.70 | 6.87 |
© 2018 by the authors. Licensee MDPI, Basel, Switzerland. This article is an open access article distributed under the terms and conditions of the Creative Commons Attribution (CC BY) license (http://creativecommons.org/licenses/by/4.0/).
Share and Cite
Chen, L.; Thapa, B.; Yan, W. The Relationship between Tourism, Carbon Dioxide Emissions, and Economic Growth in the Yangtze River Delta, China. Sustainability 2018, 10, 2118. https://doi.org/10.3390/su10072118
Chen L, Thapa B, Yan W. The Relationship between Tourism, Carbon Dioxide Emissions, and Economic Growth in the Yangtze River Delta, China. Sustainability. 2018; 10(7):2118. https://doi.org/10.3390/su10072118
Chicago/Turabian StyleChen, Lingling, Brijesh Thapa, and Wei Yan. 2018. "The Relationship between Tourism, Carbon Dioxide Emissions, and Economic Growth in the Yangtze River Delta, China" Sustainability 10, no. 7: 2118. https://doi.org/10.3390/su10072118