Abstract
As China increases its pace of urbanization, urban areas achieve rapid development by snatching resources from small towns that suffer persistent outflow of resources and anemic growth. Consequently, this trend is likely to destroy the foundation of urbanization and structural equilibrium of sustainable development. Based on the theory of complex adaptive systems (CAS), this paper held that the changes above were results of the small towns’ making adaptive adjustments to their internal structures according to external environments. To assess the fitness values of the small towns around major cities in China, this study analyzed Wuhan city and its peripheral towns from the ‘fitness’ perspective using the NK model. Meanwhile, the “space-function” coupled mode was introduced to analyze the development features of these small towns at different fitness levels. On this basis, spatial autocorrelation was employed to reveal the spatial patterns of the small towns around Wuhan according to their fitness values. Besides, the locally optimal paths of eight different types of combinations to evolve fitness were identified based on the NK computation results. The findings indicate positive correlations between the fitness values of small towns around major cities and the number of dominant factors. Apart from this, there exists a hierarchical clustering structure in the region of the major city which is bounded by urban growth boundary based on the fitness values of small towns. Also, spatial restructuring, the path to closer interaction with peripheral adaptive agents and effective resource integration in a greater scope, should be given priority to improve the adaptability of small towns. Additionally, the small towns should shift toward the function-oriented pattern that emphasizes specialization from the conventional centralized clustering structure to go with the tide of regional specialization and transformation in urban areas and realize their regional value.
1. Introduction
“Fitness”, derived from population genetics, is a quantitative indicator that represents a population’s receptive ability in the process of evolution regarding natural selection. In essence, “fitness” can also be used to quantify and describe the adaptability of a population to a specific external environment [1]. In 1993, John H. Holland, a pioneer in genetic algorithms and echo models, put forward the “complex adaptive system” (CAS) [2] and introduced the notions of fitness and adaptability into the systems theory as the theoretical basis that explains the complex systems comprising numerous adaptive agents. CAS is a critical breakthrough in the history of epistemology of systematic kinetics and evolutionary law [3]. Different from the “old three” theories such as systems theory, cybernetics, and information theory and the “new three” theories such as dissipative structure, synergetic, and catastrophe theories CAS suggests that “elements” be replaced with “adaptive agents” and that it is the agents’ adaptation that builds complexity of systems [4]. Moreover, the fitness improvement of adaptive agent will also promote the adaptability of system, which is the fundamental reason for the evolution of system [5]. In hidden order, John H. Holland points out the characteristics of “adaptation”, i.e., universality, relativity, interactivity, complexity [6]. Hence, the theory has been widely used in studies on evolutionary economics [7,8], social engineering [9,10], and ecological adaptation [11,12]. On one hand, the theory is applied to explain interaction between the subjects in the above-mentioned complex system as well as internal mechanism of the system’s continuous evolution and adaptation. On the other hand, it is applied in computer simulations (mainly by SWARM) to simulate the evolution of the system. Urban and rural development system is a typical complex socio-economic system encompassing socio-economic entities including cities, towns, and villages. The explanation and application of CAS theory on this system has been increasing in recent years. For example, the framework of CAS theory is used to explain the formation and evolution of city structure [13,14], to explain the evolution of villages and study adaptive development strategy [15], and to explore paths of adaptive development of small towns in China [16]. CAS, at its core, relates to the theoretical feasibility and real necessity of the interpretation and analysis on urban–rural development. It acknowledges the intrinsic complexity of systems and addresses proactive behavior of adaptive agents, which agrees with the trending urban planning ideology that fuses “humanism” and “rational thinking”.
While using CAS theory in the explanation and calculation of system’s evolution, the common methods are genetic algorithm [6] and NK model [5]. Genetic algorithm is a kind of search algorithm in essence, which solves fitness function to get the optimal solution through iteration [17]. Compared with genetic algorithm, NK model focuses more on describing the impact of interaction among elements of complex system on overall fitness, and demonstrates the overall fitness landscape of system through calculation of the adaptive agent’s fitness level. It also searches for the development path towards optimal fitness level while identifying the adaptive agent with optimal fitness. At present, the NK model is widely applied in assessing fitness of agents with self-organizing behavior, as well as in exploring paths to elevate fitness of agents, especially in relevant research on regional economic development. The application of NK model in socio-economics has already been realized by many scholars, because the industrial development connection among economic entities is similar to that among members of biological population. The practical examples include Jovanovic’s study on strategy and organizational structure of regional industrial cluster [18], Levinthal’s study on businesses adaptive development strategy [19], and Jia Xioahui’s study on adaptive behavior of industrial cluster’s innovative subject [20].
As mentioned above, CAS theory has been widely applied in explaining the process and mechanism of development in urban and rural areas or in towns and villages. However, during application and calculation of the theory, the fitness evaluation has not yet been directly applied in urban and rural development. At present, application research on NK model in urban and rural development is relatively less, and mainly concentrates on fitness evaluation of socio-economic entities in major cities [21], such as high-tech zones and clusters of urban innovation industry [10]. Therefore, in order for CAS theory to play a greater role in both qualitative and quantitative research on urban–rural development, this thesis applies NK model in fitness evaluation of towns during urban–rural development. An emphasis is placed on the study differentiation (and even division) during the development of small towns around the major cities. Furthermore, based on the explanation of this by CAS theory, it employs NK model to assess the fitness level of small towns around the major city, and proposes and categorizes paths to improve the small towns’ fitness, so as to provide evidence for guiding plans and policies for the healthy development of small towns, and to prevent regional sustainable development with major cities at its core from being discontinued and collapsing in the development of small towns. Small towns are not only important economic and social entities in urban and rural development but also the important nodes in the structure of regional economic development.
According to the standard of towns, small towns refer to administrative units with a total population of more than 20,000 and an urban population of more than 10% or a total population of less than 20,000 and urban population of more than 2000 [22]. In China’s administrative framework with distinct hierarchical characteristics, small towns form the connecting link between urban and rural areas, offering service to the latter and undertaking the industrial spillover from the former. During the period between 1978 and 2015, when the reform and opening-up policy was in full swing, the proportion of urban residents to the national population rose by 38.2%. Compared to the 1978 level when there were 2173 small towns with the population of 2000 and above, the number of small towns in the same scale was increased to 20,515 in 2015 [23] (as seen in Figure 1), which accounted for 21.6% of the urban population in China, including 33.3% of migrant workers [24]. Particularly from 1978 to 1999, the urban population was increased by 210 million nationwide, among which 80 million chose to live in small towns, equating 57.1% of the total migrant population [25]. However, as the urbanization strategy shifted toward mega-regions and major cities, such factors of production as migrant workers, capital, and land rapidly passed through small towns and flowed into larger cities. Consequently, the small towns had to suffer economic downturn, inefficient public service, and sluggish spatial development. It is especially obvious that the small towns around the major cities were excluded from the flow of production factors.
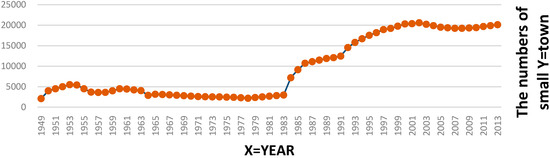
Figure 1.
The quantity changes of small towns with the population of 2000 and above since 1949 (the foundation of the state). Data source: Urban and Rural Construction Statistical Bulletin in China [23].
In China, most of the major cities are undergoing rapid development and high-level clustering. They are vigorously spurring urbanization and thus the factors of production in the peripheral towns and villages in smaller sizes are highly likely to be absorbed by these cities, leading to a wider gap and greater conflicts between urban and rural areas. Similar to many Euro-American countries, some small towns around the major cities in China have already been urbanized by multiple external factors and internal forces. However, it should be noted that a large number of small towns are still struggling on the way to urbanization because at the internal level, there is a lack of initiative, and at the external level, the excessive suppression and absorption of larger cities brings about inefficiency in development and functional operations in small towns, which therefore find it difficult to achieve development and integrate into the urban area. As a result, they fail to fully perform their strategically significant role to support urbanization and connect urban and rural areas. It follows that the small towns at the primary level in China were faced with a continuous decline in their soft power regarding social equality and cultural inheritance as urbanization proceeded and the major cities snatched resource factors from them. This phenomenon, if it continues, is likely to further impede the economic progress in these primary-level towns lacking support and initiative. Consequently, the small towns, failing the villages that they are supposed provide service and assistance for, are exposed to a considerable risk of destroying the foundation of the urbanization development system and the regional economic structure; apart from this, they adversely affect the overall efficiency of harmonious regional development in the urban area, the joint development of grass-roots society depending on the effective integration of resource factors and the urbanization of the entire country.
To a certain extent, these are rational and inevitable problems amidst rapid urbanization, because small towns must make adaptive adjustments to their internal structures according to the changes in external environments. According to Holland’s CAS theory, the underlying reason for the aforementioned problems lies in the adaptive capacity of the small towns. Small towns with high fitness can participate in regional economic division with the driving force of major cities and integrate themselves into the macro-development environment and realize their further development. On the contrary, due to the sustained resource outflows caused by polarization effect of major cities, small towns with low fitness are failure to achieve their own and regional sustainable development. Therefore, the main objective of this paper was to investigate how to evaluate the fitness value of small towns around the major city using NK model, so as to improve the adaptability to promote the sustainable development of small towns themselves and metropolitan area. The study was carried out in Wuhan City, a major city in the central of China.
2. Study Area and Data
2.1. Study Area
Wuhan, a city situated in Central China (Figure 2), is the subject and data source of this study. As of the end of 2016, Wuhan had a resident population of 10,766,200, making it one of the most populous cities and national center cities in China. The reason why Wuhan has been chosen is the obvious differentiation in the surrounding small towns. The population continues to grow at a fast pace in downtown which has a strong adsorption force to the economic factors of surrounding small towns. Moreover, the public policies and resource are concentrated in the downtown and surrounding satellite cities instead of small towns. According to the fifth (2000) and sixth (2010) population census datasets in China, there are 58 small towns in Wuhan, among which 47 see a continuing decline in population since 2000. [26] During this period, merely 4.12% of the 548 km2 construction land was in the small towns, with most construction projects in Wuhan springing up in the central urban area (Figure 3) [27]. In general, over two-thirds of the small towns are confronted with a series of problems, including outflow of population, sluggish economic growth, vacancy of space, and alienation of function. They fail to realize the regional functions which can be a disadvantageous factor in balanced and sustainable regional development.
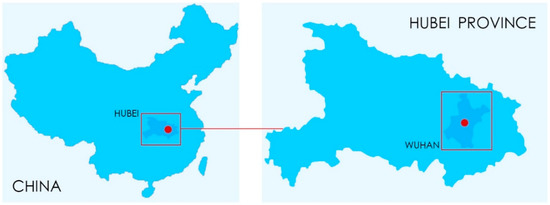
Figure 2.
The location of Wuhan in China. Source: drawn by authors.
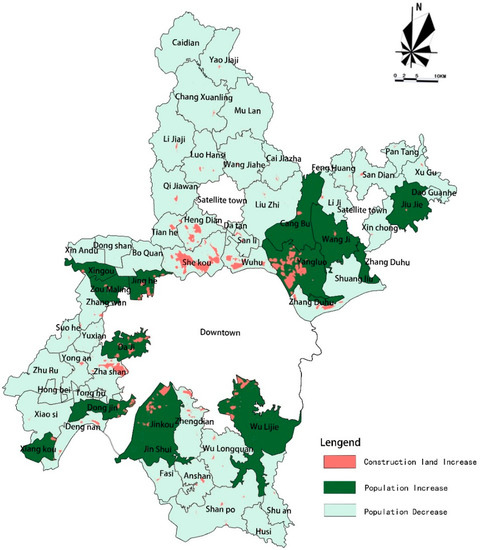
Figure 3.
The differential of small towns in Wuhan. Data source of population: National Bureau of Statistics of the People’s Republic of China [26], draw by authors uses ARCGIS. Data source of construction land increase: The Research on the Development of Small Towns Report [27].
2.2. Data
Data may affect the fitness of small towns will be collected according to CAS theory which is the theoretical basis of NK model in this paper. According to Holland’s echo model built on CAS theory and his interpretation on the adaptation mechanism of adaptive agents, the underlying reason for the differentiation lies in the adaptive capacity of the small towns. In other words, the lack of adaptive capacity makes the small towns fail to respond to their external environments, primarily the major cities’ snatches at their factors of production and the impact of rapid urbanization. In Holland’s view, an adaptive agent with high “fitness value” is able to maintain its capacity to draw on and process resources in their systems and to accelerate the evolution process in disregard of the changes or impacts of external environments [6]. Flow, one of CAS’ important characteristics, is essential to the adaptive capacity of small towns. It is used to identify whether the internal structure of an adaptive agent matches its function, and whether the fashion of matching allows the adaptive agent to persistently access to flowing factors. For small towns in an urban area, there are empirical studies that have proven the impact on the flow of production factors at diverse aspects, such as market, government, and geographic environment [28,29]. However, existing studies largely focus on empirical analysis and thus fail to quantitatively assess fitness about the small towns from an “adaptability” perspective [30,31,32].
The existing evaluation and research on small towns generally centers on individual development scale, economic level, or other aspects. Therefore, the scope of data collection basically focuses on the township where the economic factors are concentrated [33,34], and it is less considered from the overall administrative unit. From the explanation of the CAS theory on the adaptability process of small towns, the adaptability of small towns is seriously affected by the “flow”, which in turn influences whether its own structure is able to assume the due regional functions (the most important role of small towns is to promote rural development and ensure the stability of the grassroots structure for regional sustainable development) [35,36,37]. Thus, the meaning represented by the data and the spatial scope of data collection should be expanded with the change of the resource element flow.
In this paper, 58 town area units in Wuhan City are used as data collection scope. With the year of 2014 as the data collection time node, the data of the 58 town units were involved in the three dimensions of space, economy, and public services. As mentioned above, data must be reflecting the regional function of small towns which can be summarized from the perspective of space, economic and public service in general [38,39]. Based on the dimensions mentioned above, three types of data will be collected in this paper (Table 1). The first type is point data, which reflect the spatial scale, economic scale, and public service facility configuration data of small towns’ townships, including population size, economic scale, and facility configuration scale. This is also the data that other small towns must collect in the evaluation process, and is involved in many scholars’ research on the evaluation of small town development [30,31,32]. The development scale of township affects the ability of small town to acquire and attract the resources from other towns based on the scale effect. The second type is relational data (line data), which can reflect the structural functions of small towns in regional development and the role of promoting regional sustainable development (including economy and public services). This is often neglected in the evaluation of small towns, but it represents the connection between small towns and central urban areas and the ability of small towns’ townships to serve the surrounding villages. The collection of this indicator data draws on some scholars’ research on the evaluation of urban–rural relations [40]. Including the urbanization rate, proportion of patients to total population, and so on. The relational data reflect the ability of small towns to exchange and utilize resources with other adaptive agents. The third type is the plane data, which reflect the overall development level of the small towns, including the scale data in the whole administrative unit of the township and villages. With the development of agricultural modernization and the development of rural tourism, rural areas in the administrative units of small towns have also taken advantage of many resources and created a lot of value. Considering that the value of resources in rural areas mostly comes from agriculture and tourism, the selected data indicators include rural tourism income and land productivity and other indicators. Such indicators which reflect the amount of resources available are also easily overlooked in the evaluation of small towns. The data source comes from the statics about small towns of Wuhan Land Resources and Planning Bureau [41].

Table 1.
Type of basic data collection.
The collected data will be calculated by the NK model as the following framework (Figure 4). The methods will be elaborated in Section 3.
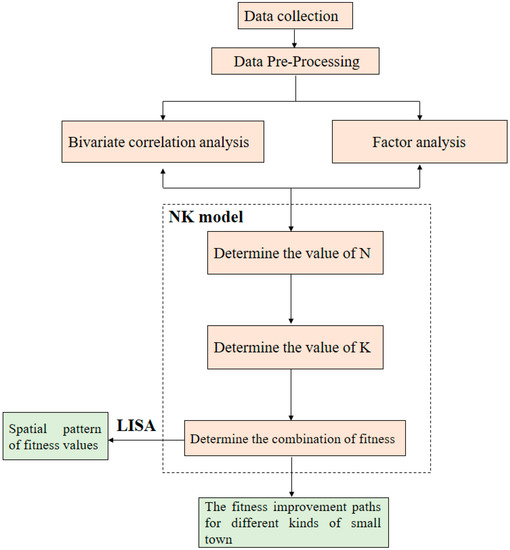
Figure 4.
The framework of small towns’ fitness value assessment. Figure source: drawn by authors.
3. Methods
3.1. The Method of Data Pre-Processing
In order to make the meaning of data more accurate, it is necessary to preprocess the original data. Part of the data are calculated by the statics, including proportion of township area to land area of town (%), urbanization rate (%), and proportion of patients to total population (%). Because the proportional data can indicate the structural characteristic of small towns [42]. Min. time between township and the third ring, min. time between township and the third ring by bus and proportion of population living in a distance within 30-min drive to hospitals in township are measured by Google Earth and Arc GIS. The former two indicators can reflect the spatial relationships between small towns and the downtown of a major city. The capability for providing basic public services of a small town can be shown by the latter indicator.
3.2. Fitness Value Assessment Based on NK Model
3.2.1. Brief of the NK Model
The NK model is a mathematical model introduced by the American theoretical biologist Stuart Kauffman in 1993 to build fitness landscapes. The NK model combines the fitness with the complexity science for the first time. It is characterized in that the overall ruggedness of the fitness landscape can be adjusted via changes to its two parameters, N and K, with the former representing the number of genes of a species (the number of factors that affect the fitness value of the agent) and the latter measuring the degree of interaction between genes (the number of relationships between factors that affect the fitness of the agent) [4]. The NK model comprises five parameters totally [18] (Table 2).
Table 2.
Basic parameters of NK model.
In the application of NK model, N and K are the most important parameters [20]. Therefore, the key to assessing the fitness value of small towns in this paper is to determine the values of N and K. N represents the number of factors that affect the adaptability of small towns while the value of K controls the degree of complexity of systems. A high value of K indicates that a given gene has relatively complex limiting factors. With K = 0, there is no interaction between genes. To simplify the calculation, we valued K as 0 in the assessment of fitness value about small towns. From Kauffman’s follow-up study, it can be seen that the value of A is highly insensitive to the conclusions concerning the analysis of the model as a whole. Hence, Kauffman considered only the two extreme values, i.e., A = 0 and A = 1. Therefore, there will be 2N kinds of small towns in the paper. In this case, only one hill is presented in the fitness landscape of the system, i.e., global optimum. The overall fitness of the adaptive agent is defined as the mean value of the fitness of all genes as
is the fitness value of each small town, is the contribution degree of factors to the of small town’s adaptability. When is less than the system average, the state of the factor will be 0 while 1 represents the former is greater than the latter. The prerequisite for this step is to standardize the data of the impact factor as
Each of the impact factors of each small town is empowered and the adaptability value of the small town is calculated. In this paper, the weights are determined based on weight of factor interpretation obtained from factor analysis by SPSS. Each small town not only has an adaptability value, but also a set of corresponding adaptability combinations.
NK model is a method in the application of CAS theory and a measurement for the adaptability of the agent in complex adaptive system. Therefore, the interpretation of the small towns’ fitness value calculated by NK model should refer to the explanation of adaptability in CAS theory. In terms of the CAS theory, adaptive capacity is described to be the ability of an adaptive agent to match its internal structure up with its function and sustain in a given environment with favorable support [5]. There will be three adaptive types of results which can be interpreted by CAS theory (Table 3). Moreover, each small town will have a combination of adaptability. The NK model can indicate the optimal paths for different type small towns to promote the fitness value.
Table 3.
Interpretation on classification of the small towns by different degrees of fitness.
3.2.2. Applicability of Using the NK Model to Assess the Fitness of Small Towns around a Major City
The fitness landscape theory and the NK model are both derived from the study of evolution in the field of biology; however, biological systems also are typically complex adaptive systems. Therefore, biological theories and models can favorably explain the adaptability of the internal structures of complex adaptive systems in external environments. Presently, the NK model is often employed to analyze the fitness (adaptive capacity) of industrial clusters from the perspectives of management and economics. In general, previous studies have demonstrated the feasibility of applying the NK model to research on self-organization, and natural and social selection. Likewise, the NK model can also be applied to the study of urban–rural development systems that combine social and economic dimensions [18] (Figure 5).
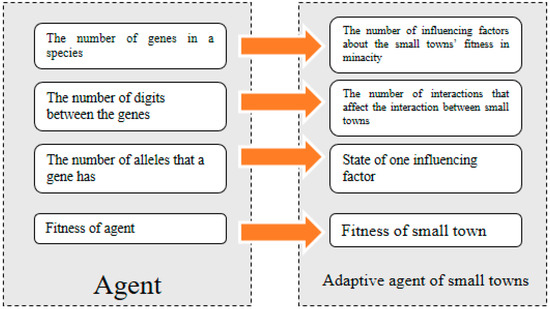
Figure 5.
The application of NK model in the assessment of the fitness value about the small towns. Figure source: draw by authors, referenced to Jia, X.H. 2016 [20].
Firstly, the NK model is a model that calculates the agent adaptability based on CAS’s complexity system theory. The urban–rural development system with the metropolises as the core and the small towns as the surrounding nodes has the characteristics of complex adaptive systems, and can use the key mechanism “flow” in CAS to interpret the process of change rationally (as mentioned Figure 5). So, starting from the theoretical basis, the NK model can be applied to the adaptability evaluation of small towns around the major cities.
Secondly, metropolitan areas have relatively high marketization and are relatively freely competitive compared to other regions. Therefore, the development and evolution of the urban–rural development system with the metropolises as its core has obvious self-organization behavior. The NK model has been used to study the adaptability of high-tech zones and industrial clusters in metropolitan areas [21]. As a socio-economic entity that integrates industries, society, services, and other factors, small towns have the self-organization behavior of participating in the regional division of labor and assuming regional functions under the urbanization process and market forces. For this reason, the NK model is also applicable to the assessment of adaptability in small towns in metropolitan areas. For small towns in non-metropolitan areas, the NK model may not be applicable, because the degree of marketization is relatively low, the development of small towns is mostly dominated by top-down government, and self-organization behavior is not obvious, which is why the metropolitan areas are chosen in this paper for research.
3.3. Methods to Determine the Parameter N in the NK Model
N is one of the important parameters in the NK model, which represents the number of factors that affect the adaptability of small towns. Indicators that may influence the fitness value for small towns have been collected preliminarily based on Table 1. However, if N is valued as the number of original indexes directly, the calculations will be extremely complicated. Correlation analysis and factor analysis were used to further screen for accurate NK model parameter determination.
3.3.1. Bivariate Correlation Analysis
Bivariate analysis is one of the simplest forms of quantitative (statistical) analysis. The objective of bivariate correlation analysis is to confirm the correlation between the two variables X and Y. It can help us to screen indicators that affect the adaptability of small towns more precisely. Some scholars screened indicators that influence the public service efficiency of small towns by using bivariate correlation analysis [43]. Pearson correlation coefficient will be used to measure the linear correlation between two variables and it can be calculated as
where r is the Pearson correlation coefficient. It has a value between +1 and −1, the higher the value is, the stronger the linear correlation the two variables have.
3.3.2. Factor Analysis
Since the parameters selected by the determination of the parameter N need to be further clarified to explain the role of fitness value, SPSS software is used to perform dimensionality reduction analysis using factor analysis methods after the correlation analysis. Factor analysis is a kind of methods to realize the data reduction. The theory of analytic methods is that the information gained about the interdependencies between observed variables can be used later to reduce the set of variables in a dataset. Multiple original variables will be reduced to several new divisors with new implications. Only the variables have close relationship can be reorganized into one new divisor. In addition, degree of variable’s interpretation to the divisor showed by factor analysis can be used to determine the weight of indicators. The weight of variables () can be computed as
where is the degree if variable’s interpretation to the divisor.
3.4. Method of Visualizing the Spatial Pattern of Fitness Values in Small Towns
The NK model can only calculate the fitness value of small towns, but cannot show the spatial pattern of fitness value from the perspective of region. Therefore, spatial statistics were used to describe the regional characteristics as an analytical basis for formulating regional development policies. The spatial patterns of small towns at different levels of fitness refer to the spatial correlation of fitness in the entire region. In spatial analysis, the global Moran’s I is generally used to measure spatial dispersion while the “local indicators of spatial association” (LISA) are exploited to evaluate the level of similarity and spatial segregation of local units. The global Moran’s I can be expressed by
where Xi and Xj respectively denote the observed values of i and j, and Wij represents the spatial weight. With Moran’s I > 0, the development fitness of the small towns shows an obvious level of spatial clustering; with Moran’s I < 0, the development fitness of the small towns presents evident signs of spatial segregation.
The LISA can be represented by
where and respectively express the observed and standard values. With LISA > 0, there is a low degree of segregation between the fitness of the small towns and their surrounding spatial units; with LISA < 0, a high degree of segregation can be observed.
4. Results and Discussion
4.1. Result of Data Pre-Process
Based on the data collection and pre-processing, 35 indicators were prepared to analyses and calculation (Table 4). Moreover, the indicators will be screened below.
Table 4.
Basic data collection.
4.2. Results of N Value
4.2.1. Result of Bivariate Correlation Analysis
Taking the 35 indicators mentioned above in Table 4 as independent variables and the changes of the permanent resident population in each small town in the five years from 2010 to 2014 as dependent variables, a bivariate correlation analysis by SPSS software was carried out one by one (Table 3). The population data in the period between 2010 and 2014 are defined as dependent variable because changes in populations can directly reflect the impact of rapid urbanization and the core effect of larger cities on small towns, as well as the internal structures of small towns altered by external factors. Besides, there is no need to carry out meta-analysis that involves such difficult and complex tasks as micro-data acquisition. Meanwhile, changes in the resident population of a small town somewhat represent its total demand for public services and infrastructure [44,45].
12 indicators were selected after bivariate correlation analysis (Table 5). However, because of the insufficient exploitation and utilization of water area in small town, the implication of indicator 7 in Table 3 to the adaptability of small towns would not be obvious. Therefore, water area in town would not be selected in next calculator step. Ultimately, 12 indicators were selected.
Table 5.
Bivariate correlation analysis.
4.2.2. Results of Factor Analysis
Specific indexes which have high degrees of factor’s interpretation and close to each other can be reorganized into a new component. Three impact factors affecting the development adaptability of small towns were obtained, and the overall level of interpretation of the three factors reached 77.566%, and namely N = 3 was determined (Table 6). These three impact factors affect the adaptability of small towns from different perspectives. Component 1 derived from the dimension reduction includes the permanent resident population of the township, local fiscal revenue, the size of the township, and the ratio of the township to the town area. The indicators included in this component are basically reflected in the supply configuration of the central node of the township. The agglomeration scale of the center is firstly related to whether it has the ability to obtain resources from different locations in the metropolitan area where it is located, and thus whether it has influence on the rural nodes and their influence and whether or not small cities and towns have local top-down organizational dynamics under the influence of major cities. Therefore, this component is defined as a central scale factor that affects the adaptability of small cities and towns. Component 2 is mainly an indicator of the overall spatial scale within the town area, representing the available resources within the overall spatial unit of small towns and the demand for how many resources are available within the unit. It is therefore defined as the regional demand factor. Component 3 is mainly an indicator that reflects the relationship between township and surrounding rural nodes. It also reflects the access of small towns to the outside world and the degree of connection between internal township and rural nodes. In addition, it reflects the regional position and internal structure of small towns, and affects the judgment of whether small towns can undertake regional functions. The component is therefore defined as a structural correlation factor. Two indicators—number of senior high schools in town and number of beds of hospitals in township—are discarded because of unapparent degree of factor’s interpretation. After the factor analysis, weight assignments are made based on the degree of interpretation of the factors in the rotation matrix (Table 7).
Table 6.
Factor analysis.
Table 7.
Rotated component matrix a.
On the bases of factor analysis, the weight is calculated by the Formula (4). The implication and contained specific indexes of each divisor is match to the type of data mentioned in Table 4 including point, line, and plane (Table 8). It proved that the data collection and pre-processing is effective for assessment of fitness value concerning small towns.
Table 8.
Divisors of NK model and the weight index.
4.3. Spatial Patterns of Small Towns with Different Degrees of Fitness
The following presents the divisors and fitness value of the 58 small towns in Wuhan according to the data processing procedures above (Table 9).
Table 9.
Value and state of the divisor of 58 small towns in Wuhan.
The spatial analyst extension supported by ArcGIS 10.2 was employed to obtain the global Moran’s I based on the fitness of the small towns in the 58 spatial units in Wuhan: Moran’s I = 0.119792 > 0. This indicates that the overall development fitness of the small towns in Wuhan has a distinct feature of spatial clustering. Furthermore, spatial computation of the LISA was performed. See the figure made by ARCGIS 10.2 software below (Figure 6).
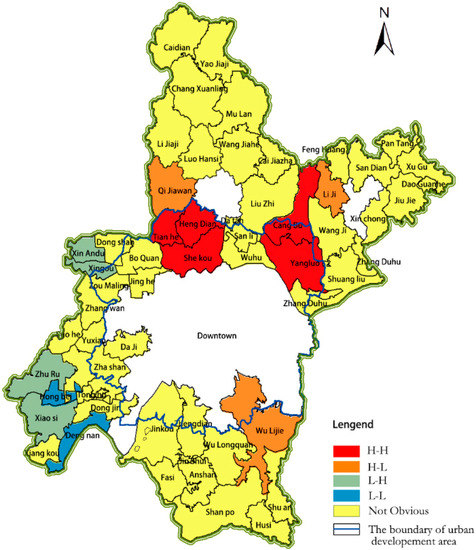
Figure 6.
The spatial pattern of small towns’ fitness value in Wuhan City. Figure source: drawn by authors.
As shown in the figure, the H-H cluster consists of Hengdian, Shekou, Yangluo, Cangbu and Tianhe; the L-L cluster includes Hongbei, Dengnan and Tonghu; the H-L cluster comprises Qijiawan, Liji, and Wulijie; the L-H encompasses Xin’andu, Xingou, Zhuru, and Xiaosi. It is noticed that the high-level clusters are situated in the development area of the city. This indicates a significant difference in the spatial clustering of fitness between the area in and out of the development area.
According to the spatial autocorrelation analysis on the fitness of small towns, the overall development fitness of the small towns shows an evident characteristic of spatial clustering, and on this basis, the concentric rings separated by the development bound of the main urban area show dimensional differences, which are specifically reflected by the locally spatial autocorrelation between high and low levels of fitness. This indicates that even though fitness combines the indicators in three dimensions (i.e., center size, regional demand, and structural correlation) to measure the development of small towns, it fails to withstand the impact of the concentric development pattern of major cities. It is thus perceived that the adsorption of flowing resources and factors of production in small towns is a universal manifestation of the core effect of main urban areas in larger cities, and the differentiation of fitness among the small towns is primarily driven by the differential forces of intervention generated by concentric rings. Besides, it is another important path toward sustainable development for urban areas.
4.4. Discussion of the Fitness Paths Results
As we mentioned in Section 3.2, there will be 2N = 8 kinds of combinatorial fitness states for small towns in Wuhan. The results about eight kinds of degrees’ fitness in Wuhan as follows from high to low by calculating the mean value of each kind based on Table 7. They can be classified by three adaptive types (Table 10).
Table 10.
Fitness values of different combinatorial fitness states in Wuhan.
Ultimately, according to the results produced by the NK model, 58 small towns in Wuhan can be divided into several groups with different degrees of fitness. The computation results produced by the NK model can be classified into non-factor (000), single (001, 100, and 010), two (101, 011, and 110) and three-factor contribution by the level of fitness from low to high. This implies that the adaptability of small towns surrounding major cities becomes stronger as the number of contributing factors increases. Moreover, obvious polarization can be seen in the fitness values of small towns in Wuhan. The highest and lowest fitness values are both have the largest number of small towns.
It can be seen from Table 8 that each small town corresponds to a fitness value and a combinatorial fitness state which are significant to arrive at the fitness improvement path. Especially for the small towns which belong to the type of locally adaptive and adaptive failure. In addition to fitness classification, the NK model can also be used to identify the paths from local to global optimum in different kinds of fitness landscapes. Without doubt, the NK computation results offer more than a solution to raise the level of fitness of each type of small towns. However, considering the intrinsic content and the corresponding degree of fitness of each combinatorial mode, the following are three optimal paths to improve the fitness of the small towns around the urban area in Wuhan (Figure 7).
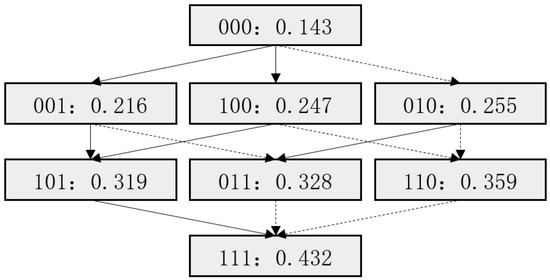
Figure 7.
Fitness landscape of small towns in Wuhan City (the dotted lines is optimal paths for different type small towns). Figure source: drawn by authors.
4.4.1. Optimal Path of Structural Correlation-Oriented Type (001)
For the small towns in category 001, there are two globally optimal paths: 001–101–111 and 001–011–111. According to the fitness combinations produced by the NK model, in Wuhan, category 011 has a higher degree of fitness than the category 101. On this basis, the NK paths suggest that the structural correlation-oriented small towns should raise their levels of fitness by increasing the overall regional demand. As for administrative framework, considering the area of jurisdiction, number of subordinate villages, construction land area and population, it is difficult for the small towns to implement a top-down reform in the administrative framework. Therefore, the priority should be given to how to increase spatial interaction between the small towns and other units and integrate more resource factors for these small towns to improve their levels of fitness.
4.4.2. Optimal Path of Center Size-Oriented Type (100)
As for the small towns in category 100, there are two globally optimal paths: 100–101–111 and 100–110–111. However, from the fitness combinations based on the NK model, it can be seen that category 110 outperforms category 101 in fitness. Hence, the NK paths also suggest the center size-oriented small towns to improve their fitness by increasing the overall regional demand. Similar to the structural correlation-oriented small towns, it is essential to expand their sphere of influence on the development of small towns, expand the range of spatial interaction, and integrate more resource factors with certain approaches or intervention.
4.4.3. Optimal Path of Regional Demand-Oriented Type (010)
For the small towns in category 010, there are two globally optimal paths: 010–110–111 and 010–011–111. The NK computation shows that, category 110 has a higher level of fitness than category 011. Therefore, the NK model provides the regional demand-oriented small towns with two solutions to reach the globally optima of fitness by improving technical efficiency and structural correlations between the core (i.e., centers of the small towns) and the nodes (i.e., surrounding villages) for centralized clustering.
4.4.4. Optimal Paths for Small Towns at the Lowest Level of Fitness (000)
Most small towns in Wuhan are categorized in 000, i.e., the category representing the lowest level of fitness. These small towns are provided with eight globally optimal paths, more than those in other categories. However, according to the computation of the fitness of each category using the NK model, category 000 should follow the globally optimal path 000–010–110–111. In other words, the integration of regional demand should take priority over other aspects to achieve the global optimum.
The findings based on the NK model imply that the regional-demand factors, no matter in the single or two-factor contribution categories, occupy the position representing the highest level of fitness. Besides, the optimal paths for the non-factor contribution category (000) at the lowest level of fitness and the center size (100) and structural correlation-oriented (001) small towns to the corresponding highest level of fitness require these small towns to broaden the scope of integration of internal factors and increase regional demand. To realize global optima, except category 111, four out of the other seven combinatorial fitness types suggest that small towns to improve their development fitness by enhancing the regional-demand factor, which drives the top-down centralized clustering in these small towns so that they can reach the peak of a hill in the fitness landscape.
5. Conclusions
As an important theory and method of complexity science, the CAS theory and NK model for small towns’ fitness value assessment proved to be feasible, especially in the region with high marketization degree and obvious self-organization behavior of the adaptive agent. To elaborate this approach, taking Wuhan City as an example, this paper used NK model to explore the fitness value and the improvement path of small towns in Wuhan. Some conclusions have been drawn.
The results show that it is an appropriate approach for small towns around Wuhan City to improve their fitness by increasing the dominant factors in the process of development and exploring possible measures to control the flow of factors within the small towns. This agrees with the trend of vertical specialization in urban area and guarantees the structural position of villages that play a supplementary role in regional development.
The results also indicate that small towns, under the influence of Wuhan, follow the trend of expanding the space of flow in the process of raising their fitness levels, and integrate factors through interaction with other adaptive agents in such a larger space. It is the most effective and the only path to greater adaptability when the small towns are faced with normal shrinkage in size caused by the universal outflow of resource factors. Therefore, Wuhan, as a major city with multi-center spatial structure, should be guided by urban planning respond to this trend. The spatial integration mode of interaction based on the functional correlations between townships and villages around Wuhan can be a feasible spatial guidance. Networking development will be an effective way for small towns to make full use of resources.
In the current fiscal framework, small towns mainly rely on top–down public input and other self-derived fiscal revenue. Hence, the public input can dramatically increase the center sizes of small towns and even lead to a temporary leap. However, since the input of public finance is limited and the return rates of resources put into small towns largely differ, public policies should accurately target at critical aspects in the future development of Wuhan City. In the new era of labor specialization, we should develop a comprehensive and accurate understanding of the connotation and value of the development of small towns in order to realize a rational specialization structure in China, heightened urban–rural economy, and security and sound development. In a fitness landscape, the path up the hill refers to the process of small towns improving their risk capacity and the overall value in regional specialization so that they can adapt themselves to the rapid urbanization in China, the external environment, and changes in urban areas—e.g., active flow of factors—in order to ultimately achieve sustainable regional development.
Author Contributions
Both of the authors involved in the research design and paper writing. Author H.G. completed the data collection and supervisor. Author J.Q. performed the research and analyzed the data. Both of authors read and approved the final manuscript.
Acknowledgments
This work was supported by the National Science Foundation of China (51178199). Data thanks to Wuhan Planning Design & Design Institute for providing us the report about the research on the development of small towns in Wuhan City.
Conflicts of Interest
The authors declare that there is no conflict of interest regarding the publication of this article.
References
- Wright, S.E. The roles of mutation, inbreeding, crossbreeding, and selection in evolution. In Proceedings of Sixth International Congress on Genetics; New York University Press: New York, NY, USA, 1932; pp. 356–366. [Google Scholar]
- Guo, B.F. On Holland’s Theory of Complicate Adaptable System and its Application. J. Huazhong Univ. Sci. Technol. Soc. Sci. Ed. 2004, 3, 70–71. [Google Scholar] [CrossRef]
- Murray, G. The Quark and the Jaguar: Adventures in the Simple and the Complex; Yang, J.Y., Ed.; Hunan Science and Technology Press: Changsha, China, 2001; pp. 5–7. [Google Scholar]
- Qiu, B.X. A Preliminary Research on the Neo-Rationality in Urban Planning: From the Perspective of Complex Adaptive System (CAS). Urban Dev. Stud. 2017, 24, 1–8. [Google Scholar] [CrossRef]
- Liu, J.; Tang, J.L.; Chi, R.Y. The application of complex adaptive system theory in regional economy research. Sci. Technol. Prog. Policy 2011, 28, 44–47. [Google Scholar]
- John, H.H. Hidden Order: How Adaptation Builds Complexity; Zhou, X.M., Mimnaugh, H., Eds.; Shanghai Century Publishing House: Shanghai, China, 2011; pp. 10–39. [Google Scholar]
- Peltoniemi, M. Preliminary Theoretical Framework for the Study of Business Ecosystems. Emergence Complex. Organ. 2006, 8, 10–19. [Google Scholar]
- Foxon, T.J. Bounded Rationality and Hierarchical Complexity: Two Paths from Simon to Ecological and Evolutionary Economics. Ecol. Complex. 2006, 3, 361–368. [Google Scholar] [CrossRef]
- Dianne, C.B. ASPEN-EE: An Agent-Based Model of Infrastructure Interdependency. Sandia Report 2000. Available online: https://www.osti.gov/biblio/774027/ (accessed on 20 June 2018).
- Zheng, S.Z. Study on the New Town and Evolution Mechanism of Cluster Innovation Network Based on Complex Adaptive System Theory. Master’s Thesis, Huaqiao University, Quanzhou, China, 2011. [Google Scholar]
- Yu, K.J.; Zhang, L. The Flood and Waterlog Adaptive Landscapes in Ancient Chinese Cities in the Yellow River Basin. Urban Plan. Forum 2007, 5, 85–91. [Google Scholar] [CrossRef]
- Yang, Z.Y.; Xu, J.G.; Wei, L. Spatial Evolution Progress of Tourism Destination Based on Theory of Complex Adaptive System: A Case of Southern Anhui. Acta Gergr. Sin. 2016, 6, 1059–1074. [Google Scholar] [CrossRef]
- Liu, C.C. The Hidden Order of City: Complex Adaptive System Theory in Urban Studies, 1st ed.; Social Sciences Academic Press: Beijing, China, 2017; pp. I–X. [Google Scholar]
- Gao, W.; Long, B. Organizing Urban Spatial Structure of Industry-Oriented New Town Under the Guidance of CAS Theory: Research and Application of Industry-Oriented Community Spatial Unit. Urban Plan. 2012, 36, 57–65. [Google Scholar]
- Chen, Z.; Ji, Y.; Zhou, H.T.; Chen, W. A Study on the Evolution and Adaptation of Traditional Chinese Villages Based on Complex Adaptive System (CAS). Arch. J. 2013, 11, 57–63. [Google Scholar]
- Qiu, B. Characteristic Towns Shall Have Scope and Depth in Their Characteristics. Mod. City 2017, 12, 1–5. [Google Scholar]
- Xi, Y.G.; Chai, T.Y.; Hui, W.M. Survey on Genetic Algorithm. Control Theory Appl. 1996, 13, 697–708. [Google Scholar]
- Jovanovic, B.; MacDonald, G. The Life Cycle of Competitive Industry. J. Political Econ. 1994, 102, 322–347. [Google Scholar] [CrossRef]
- Levinthal, D.A. Adaptation on Rugged Landscapes. Manag. Sci. 1997, 6, 934–941. [Google Scholar] [CrossRef]
- Jia, X.H. Research on Subject Behavior of Industrial Cluster Innovation Based on Complex Adaptive System Theory. Ph.D. Thesis, Harbin Institute of Technology, Harbin, China, 2016. [Google Scholar]
- Liu, Y. The Theoretical and Empirical Analysis of China’s High-tech Industrial Development Zone’s Spreading Effects. Master’s Thesis, Jinan University, Guangzhou, China, 2012. [Google Scholar]
- The State Council. The Chinese Government Network of the People’s Republic of China. Available online: http://www.gov.cn/zhengce/content/2016-10/20/content_5122304.htm (accessed on 4 June 2018).
- Urban and Rural Construction Statistical Bulletin in 2015. Available online: http://www.chinajsb.cn/bz/content/2016-07/14/content_193881_2.htm (accessed on 20 June 2018).
- The Migrant Workers Monitoring Survey Report in 2015. Available online: http://news.xinhuanet.com/politics/2016-04/28/c_128940738.htm (accessed on 20 June 2018).
- Guo, Z.M. The Questions of Countryside-land Assets Market in Building the Small Towns. Resour. Inhab. Environ. 2002, 4, 8–10. [Google Scholar] [CrossRef]
- National Bureau of Statistics of the People’s Republic of China. Available online: http://www.stats.gov.cn/tjsj/pcsj/ (accessed on 7 June 2018).
- Wuhan Planning Design & Design Institute. The Research on the Development of Small Towns in Wuhan City. Unpublished work. 2015. [Google Scholar]
- Gu, J.T.; Yin, Q. The Practice and Thinking of Small Town Planning Around Major Cities. Urban Plan. 2004, 28, 88–91. [Google Scholar]
- Gu, H.; Yang, X.Y.; Feng, B. Influence on Small Towns from the Fusion Area by Urban Expansion and Administrative Boundary Re-Organization: A Case Study of Huangji Street under the Background that Hongze Town being Turned into a District. Mod. City 2017, 12, 4–9. [Google Scholar]
- Kong, F.E.; Zhou, Q. Discussion on the Development Path of the Town in Metropolitan Fringe Areas. Shanxi Arch. 2016, 42, 24–25. [Google Scholar]
- Peng, Z.W. Evolution of the Function of Small Towns in Metropolitan Area and Their Development Prospect: Thoughts on Small Town Development in Shanghai. Urban Plan. Forum 1995, 96, 32–64. [Google Scholar]
- Lu, D.J.; Huang, J.C.; Wang, J.; Yang, X.F.; Song, X.L. Study on Typical Characteristics and Integrated Development Model of Small Towns in Metropolitan Areas. Constr. Small Towns 2009, 11, 13–25. [Google Scholar]
- Du, N.; Zhao, M. On the interactive development between rural industrial clusters and township in coastal provinces of China. Urban Plan. Int. 2011, 1, 28–36. [Google Scholar]
- Guo, X.X.; Xia, X.L.; Zhang, X.L.; Feng, C. Comprehensive Evaluation Analysis of Small Towns Development Level in China’s Different Regions. Areal Res. AND Dev. 2014, 33, 50–54. [Google Scholar]
- Wu, K.; Fang, C.L. The Development Process and Basic Pattern of China’s Small Towns Since 1949 and its Recent New Situation. Econ. Geogr. 2009, 29, 1605–1611. [Google Scholar] [CrossRef]
- Zhang, L. Small town but Grand Strategies: A Study on the Development of Small Towns in Provinces with Net Out-Migration. Urban Plan. Forum 2012, 1, 23–32. [Google Scholar]
- Li, B.D.; Guo, L.B.; Xu, S.J. Taking the path of New-Type urbanization, Offering Small Town a Fifteen-Tear Fostering Period. Urban Plan. 2014, 38, 9–13. [Google Scholar] [CrossRef]
- Zeng, Y.T. Research on Optimization for Function of Small Town based on the Changes of Relationship between Small Towns and Villages: A Case Study on Hubei Province. Master’s Thesis, Huazhong University of Science and Technology, Wuhan, China, 2015. [Google Scholar]
- Peng, Z.W. Small Towns Development and Implementation of Rural Revitalization Strategy. Urban Rural Plan. 2018, 1, 11–16. [Google Scholar]
- Zhang, J.; Li, C.G. The Evolution of Urban-Rural Relationship in Central Cities of China during Transformation Period. ACTA Geogr. Sin. 2012, 67, 1021–1030. [Google Scholar] [CrossRef]
- Statistical Information of Wuhan. Available online: http://www.whtj.gov.cn/downlist.aspx?id=2012111010461248&tn=2012111010454262 (accessed on 7 June 2018).
- Li, X.Z. The Structural Characteristics and Countermeasures of Floating Populating in Beijing. Soc. Sci. Beijing 2017, 11, 4–16. [Google Scholar] [CrossRef]
- Zhang, K. Construction of Network-level Space and Efficiency Optimization with Small Towns Public Services in Central Region—Case of Hubei Province. Ph.D. Thesis, Huazhong University of Science and Technology, Wuhan, China, 2015. [Google Scholar]
- Xu, X.L.; Luo, C.; Lei, D.M. A Study on the Difference of Regional Population Niche and Population Flow: Empirical Study Based on Partial Least Square Regression. Northeast Popul. 2013, 34, 1–11. [Google Scholar] [CrossRef]
- Liu, Y.T.; Tao, L.; Liu, H.F. A Comparative Study on Population Agglomeration and Analysis of Reasonable Size of Small Town. Mod. Urban Stud. 2013, 5, 14–35. [Google Scholar]
© 2018 by the authors. Licensee MDPI, Basel, Switzerland. This article is an open access article distributed under the terms and conditions of the Creative Commons Attribution (CC BY) license (http://creativecommons.org/licenses/by/4.0/).