Has Economic Competition Improved China’s Provincial Energy Ecological Efficiency under Fiscal Decentralization?

Abstract
1. Introduction
2. Literature Review and Research Hypothesis
2.1. The Definition of Energy Ecological Efficiency (EEE)
2.2. Fiscal Decentralization and EEE
2.3. Economic Competition and EEE
2.4. Fiscal Decentralization, Economic Competition and EEE
3. Energy Eco-Efficiency Measurement and Regional Difference Analysis
3.1. Measurement Method and Index Selection
3.1.1. Input Indicators
- (1)
- Energy. There are many kinds of energy consumption in China, including coal, oil, natural gas, nuclear energy, water energy, wind energy, solar energy and so on. Since every province has different resource endowments and different types of energy consumption account for different proportions of the energy system, it is not appropriate to use certain specific energy consumption to represent all of China’s regional energy inputs. We select total energy consumption as energy input, which is the total energy consumed by various industries and households in a certain area (country, region) in a certain period. The unit is 10,000 tons of standard coal. This part of the data comes from the 2001–2016 China Energy Statistical Yearbook. [60]
- (2)
- Labor. Employees mainly refer to those who have reached the age of 16 and could participate in social work for gaining remuneration or making income. The employment personnel can better reflect the actual use of labor resources in the current year. Therefore, this paper selects the number of employed persons as the measurement index for measuring labor input. Given the difference between annual statistical data and actual annual labor, we specifically take the average of the final number of employees in a year and the final number of employees in a previous year [61]. Data is offered by the China Statistical Yearbook (2001–2016) [62].
- (3)
- Capital. Unavailable in statistical yearbooks, capital stock is indirectly calculated by the perpetual inventory method proposed by Shan [63]. We also assume that the discount rate of total fixed assets varies from province to province [64]. All data are obtained from the China Statistical Yearbook (2001–2016) and are at constant prices for the year 2000 [62].
3.1.2. Output Indicators
- (1)
- Regional GDP (GDP). Strictly speaking, factor input can produce diverse desirable outputs, thus requiring the classification and aggregation of different outputs in practice. Hence, regional GDP, a variable for aggregate outputs in this paper, is taken as the proxy variable for desirable outputs [65]. All data on regional GDP are obtained from the China Statistical Yearbook (2001–2016) [62] and are at constant prices for the year 2000.
- (2)
- Social welfare index. At present, the measurement indicators of social welfare mainly include the human development index (HDI) of the United Nations Development Program and the life expectancy per capita [66]. However, due to lack of statistics, continuous data on life expectancy per capita in 30 provinces in China between 2000 and 2015 cannot be obtained. Hence, according to the 13th five-year plan on employment, education, culture, social security, medical care, housing and other social welfare systems, we respectively select the employment rate, the number of years of education per capita, the total number of books printed per capita, the rate of participation in social security, the rate of ownership of the number of health technical personnel, and the newly-increased construction area per capita, and calculate the six variables in the social welfare index by using the entropy method. All data come from the China Statistical Yearbook (2001–2016) [62].
- (3)
- Undesirable outputs. Since the 10th five-year plan, the Chinese government has viewed sulfur dioxide (SO2) and chemical oxygen demand (COD) as two main environmental pollutants and set a 10% reduction in the total discharge of major pollutants (SO2 and COD) as one of its energy efficiency goals in the 11th five-year plan. In addition, extensive attention has been paid to global climate change in recent years (mainly focusing on greenhouse gases such as CO2). The Chinese government has made a commitment to achieve a 40–45% reduction in carbon dioxide emissions per unit of GDP by 2020, as compared to the level in 2005. Thus, we choose SO2, COD, and CO2 as undesirable environmental outputs. Data on SO2 and COD are obtained from the China Statistical Yearbook on the Environment (2001–2016), and CO2 emissions are estimated using the conversion standard of the Intergovernmental Panel on Climate Change (IPCC) (2006) and based on energy fuel (mainly coal, coke, crude oil, gasoline, kerosene, diesel oil, fuel oil, and natural gas) consumption. Data on energy fuel consumption are obtained from the China Energy Statistical Yearbook (2001–2016) [60].
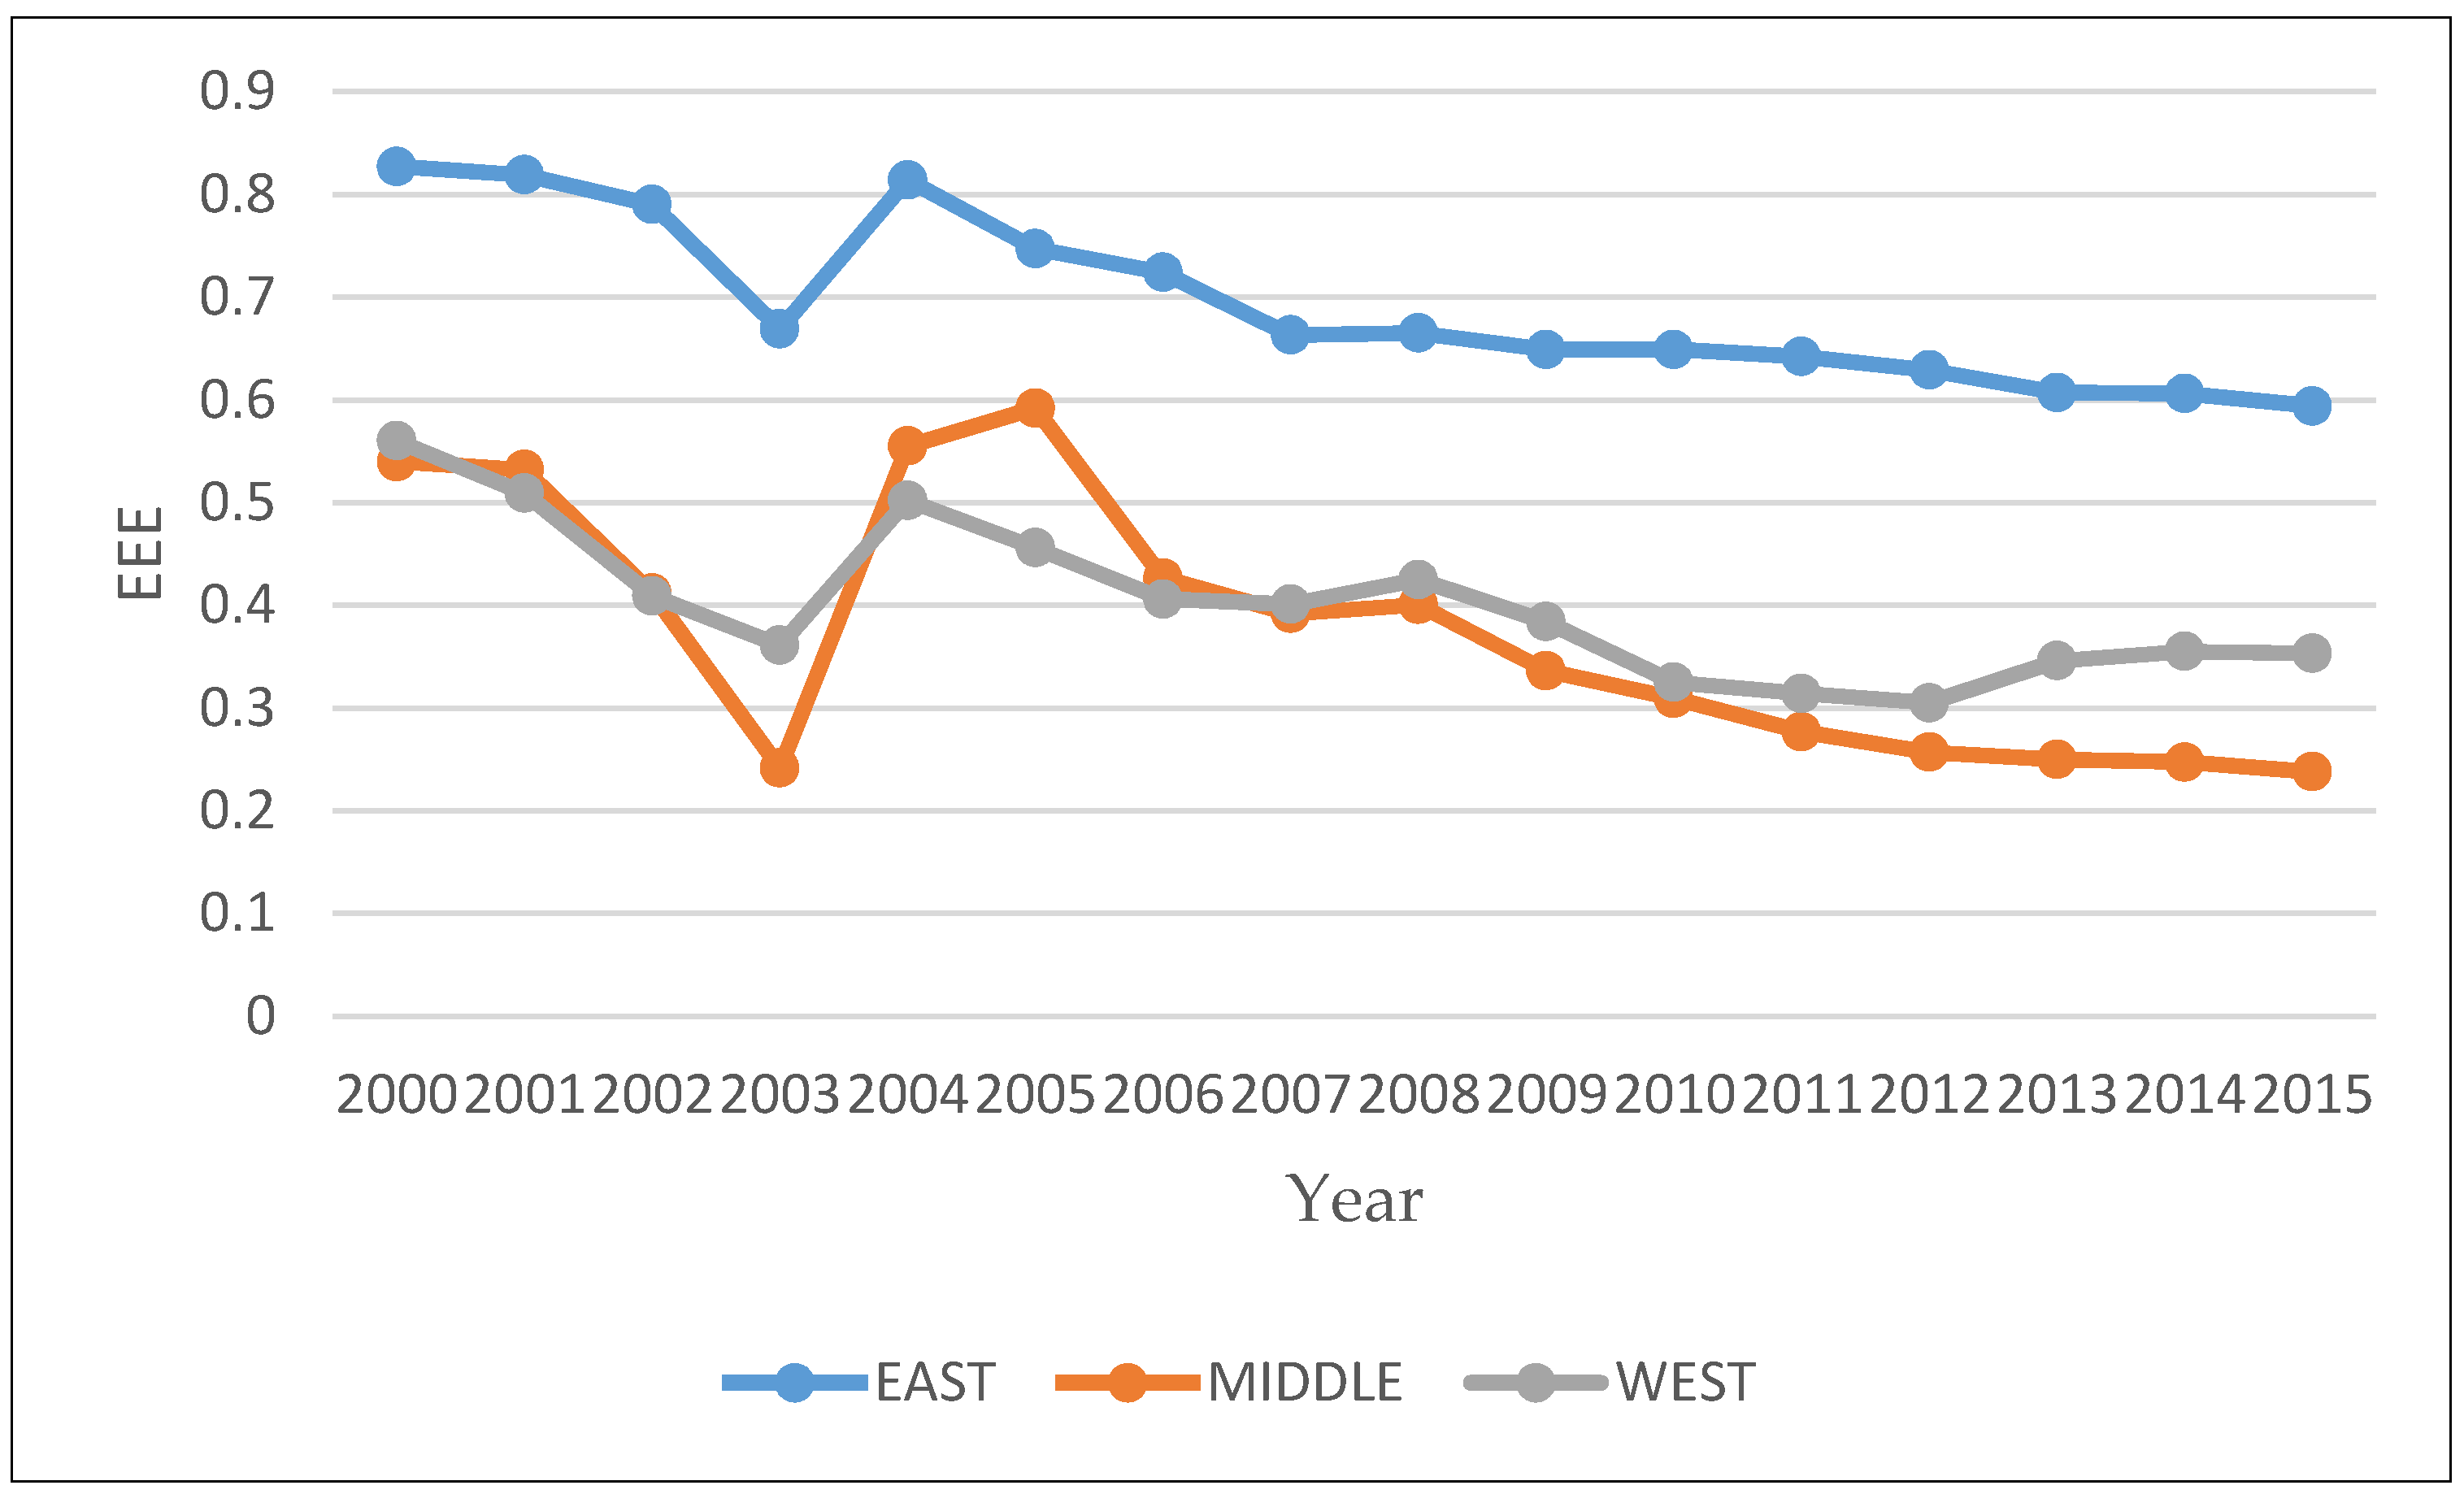
3.2. Regional Difference Analysis on Energy Eco-Efficiency
4. Empirical Analysis
4.1. Model Settings
4.2. Sample Selection and Variable Settings
4.3. Result Analysis
4.4. Robustness Analysis
5. Regional Economic Competition and EEE
6. Conclusions
Author Contributions
Acknowledgments
Conflicts of Interest
References
- BP. Statistical Review of World Energy. Available online: https://www.bp.com/en/global/corporate/energy-economics/statistical-review-of-world-energy.html (accessed on 12 July 2017).
- Wei, Y.M.; Liao, H. Seven Energy Efficiency Indicators and Their Measurement Approaches. China Soft Sci. 2010, 1, 128–137. [Google Scholar]
- Hu, J.L.; Wang, S.C. Total-factor Energy Efficiency of Regions in China. Energy Policy 2006, 34, 3206–3217. [Google Scholar] [CrossRef]
- Zhang, D.G.; Lu, Y.Q. Impact of market segmentation on energy efficiency. China Popul. Resour. Environ. 2017, 27, 65–72. [Google Scholar]
- Yuan, X.L.; Zhang, B.S.; Yang, W.P. The Total Factor Energy Efficiency Measurement of China Based on Environmental Pollution. China Ind. Econ. 2009, 2, 76–86. [Google Scholar] [CrossRef]
- Zhang, N.; Kong, F.; Yu, Y. Measuring ecological total-factor energy efficiency incorporating regional heterogeneities in China. Ecol. Indic. 2015, 51, 165–172. [Google Scholar] [CrossRef]
- Li, J.; Lin, B. Ecological total-factor energy efficiency of China’s heavy and light industries: Which performs better? Renew. Sustain. Energy Rev. 2017, 72, 83–94. [Google Scholar] [CrossRef]
- Zhang, W.; Wu, W.Y. Research on total-factor energy efficiency of metropolitan regions of Yangtze River Delta based on environment performance. Econ. Res. J. 2011, 10, 95–109. [Google Scholar]
- Guan, W.; Xu, S.T. Study on spatial pattern and spatial effect of energy eco-efficiency in China. Acta Geogr. Sin. 2015, 70, 980–992. [Google Scholar] [CrossRef]
- Wang, X.L.; Wu, C.Y. International Comparison on Energy Eco-efficiency under Perspective of Greenization: Empirical Study Based on Panel Data of G20. Technol. Econ. 2015, 34, 70–77. [Google Scholar]
- Zhao, X.; Sun, X.; Tao, R. Energy Eco-Efficiency Evaluation and Convergence Analysis of the Yangtze River Economic Belt from the Perspective of Capacity Reduction. J. Taiyuan Univ. Technol. 2016, 5, 45–50. [Google Scholar]
- Richard, G.; Adam, B. The Induced Innovation Hypothesis and Energy-saving Technological Change. Q. J. Econ. 1999, 114, 941–975. [Google Scholar] [CrossRef]
- Shi, D. The Improvement of Energy Consumption Efficiency in China’s Economic Growth. Econ. Res. J. 2002, 9, 36–43. [Google Scholar]
- Wu, Q.S.; Cheng, J.H. Changes and Factors Decomposition of Chinese Energy Consumption Intensity: 1980—2004. Econ. Theory Bus. Manag. 2006, 10, 34–40. [Google Scholar]
- Lv, M.Y.; Chen, W.X. The study on the impact of industrial structure upgrading on energy efficiency in China based on the data from 1978 to 2013. Resour. Sci. 2016, 38, 1350–1362. [Google Scholar]
- Jiang, X.; Duan, Y.; Green, C. Regional disparity in energy intensity of China and the role of industrial and export structure. Resour. Conserv. Recycl. 2017, 120, 209–218. [Google Scholar] [CrossRef]
- Fisher-Vanden, K.; Jefferson, G.H.; Jingkui, M.; Jianyi, X. Technology Development and Energy Productivity in China. Energy Econ. 2006, 28, 690–705. [Google Scholar] [CrossRef]
- Wang, B.B.; Qi, S.Z. Biased Technological Progress, Factor Substitution and China’s Industrial Energy Intensity. Econ. Res. J. 2014, 2, 115–127. [Google Scholar]
- Fan, R.G.; Luo, M.; Zhang, P.F. A study on evolution of energy intensity in China with heterogeneity and rebound effect. Energy 2016, 99, 159–169. [Google Scholar] [CrossRef]
- Li, J. Can Environmental Regulation Promote the Efficiency of Enterprise Technology Innovation? Econ. Issues China 2013, 4, 38–44. [Google Scholar] [CrossRef]
- Li, B.; Qi, Y.; Li, Q. Fiscal Decentralization, FDI and Green Total Factor Productivity—A Empirical Test Based on Panel Data Dynamic GMM Method. J. Int. Trade 2016, 7, 119–129. [Google Scholar] [CrossRef]
- Lin, B.Q.; Du, K.R. The Energy Effect of Factor Market Distortion in China. Econ. Res. J. 2013, 9, 125–136. [Google Scholar]
- Pan, X.F.; Peng, X.X.; Li, B. Market Distortion, Technical Progress and Energy Efficiency: Policy Choice Based on the provincial Heterogeneity. J. World Econ. 2017, 40, 91–115. [Google Scholar]
- Chen, K.; Hillman, A.L.; Gu, Q.Y. Fiscal Re-centralization and behavioral Change of Local Governments: From the Helping Hand to the Grabbing Hand. China Econ. Q. 2002, 2, 111–130. [Google Scholar] [CrossRef]
- Yang, H.L.; Shi, D. Energy-Efficiency Methods and Comparing the Energy Efficiencies of Different Areas in China. Econ. Theory Bus. Manag. 2008, 3, 12–20. [Google Scholar]
- Lin, B.Q.; Yang, L.S. The potential estimation and factor analysis of China’s energy conservation on thermal power industry. Energy Policy 2013, 62, 354–362. [Google Scholar] [CrossRef]
- Lin, B.Q. The theoretical exploration of scientific outlook on development from the perspective of energy economics. Econ. Res. J. 2012, 3, 154–159. [Google Scholar]
- Hu, B.D. Measuring plant level energy efficiency in China’s energy sector in the presence of allocates inefficiency. China Econ. Rev. 2014, 31, 130–144. [Google Scholar] [CrossRef]
- Lu, W.; Su, M.; Zhang, Y.; Yang, Z.; Chen, B.; Liu, G. Assessment of energy security in China based on ecological network analysis: A perspective from the security of crude oil supply. Energy Policy 2014, 74, 406–413. [Google Scholar] [CrossRef]
- Schaltegger, S.; Sturm, A. Ökologische Rationalität: Ansatzpunkte zur Ausgestaltung von ökologieorientierten Managementinstrumenten. Die Unternehmung 1990, 4, 273–290. [Google Scholar]
- World Business Council for Sustainable Development. Eco-Efficient Leadership for Improved Economic and Environmental Performance; World Business Council for Sustainable Development: Geneva, Switzerland, 1995. [Google Scholar]
- OECD. Eco-Efficiency; Organization for Economic Cooperation and Development: Paris, France, 1998. [Google Scholar]
- Müller, K.; Sturm, A. Standardized Eco-Efficiency Indicators—Report 1: Concept Paper; Ellipson: Basel, Switzerland, 2001; Volume 1, p. 72. [Google Scholar]
- Scholz, R.W.; Wiek, A. Operational Eco-efficiency: Comparing Firms’ Environmental Investments in Different Domains of Operation. J. Ind. Ecol. 2005, 4, 155–170. [Google Scholar] [CrossRef]
- Oates, W.E. An Essay on Fiscal Federalism. J. Econ. Lit. 1999, 3, 1120–1149. [Google Scholar] [CrossRef]
- Oates, W.E. The Arsenic Rule: A Case for Decentralized Standard Setting? Resources 2002, 147, 16–18. [Google Scholar]
- Oates, W.E.; Portney, P.R. The Political Economy of Environmental Policy. Handb. Environ. Econ. 2003, 1, 325–354. [Google Scholar] [CrossRef]
- Gray, W.; Shadbegian, R.J. Optimal Pollution Abatement-Whose Benefits Matter and How much? J. Environ. Econ. Manag. 2004, 3, 510–534. [Google Scholar] [CrossRef]
- Helland, E.; Whitford, A.B. Pollution Incidence and Political Jurisdiction: Evidence from the TRI. J. Environ. Econ. Manag. 2003, 3, 403–424. [Google Scholar] [CrossRef]
- Blanchard, O.; Shleifer, A. Federalism with and without Political Centralization: China Versus Russia. IMF Staff Pap. 2001, 48, 171–179. [Google Scholar] [CrossRef]
- Zhang, K.Z.; Wang, J.; Cui, X.Y. Fiscal Decentralization and Environmental Pollution: From the Perspective of Carbon Emission. China Ind. Econ. 2011, 10, 65–75. [Google Scholar] [CrossRef]
- Xue, G.; Pang, X.Z. An Empirical Analysis on the Impact of Fiscal Decentralization on Environmental Pollution in China. China Popul. Resour. Environ. 2012, 1, 83–89. [Google Scholar]
- Ma, X.Y.; Li, Q.Y.; Guo, Y.Y. Theoretical and Empirical Analysis of China’s Fiscal Decentralization and Environmental Pollution—Based on Provincial Static and Dynamic Panel Data Model. Econ. Surv. 2013, 5, 122–127. [Google Scholar] [CrossRef]
- Oates, W.E. Fiscal and regulatory competition: Theory and evidence. Perspekt. Wirtsch. 2002, 4, 377–390. [Google Scholar] [CrossRef]
- Sigman, H. Decentralization and environmental quality: An international analysis of water pollution levels and variation. Land Econ. 2014, 90, 114–130. [Google Scholar] [CrossRef]
- Zhou, L.A. Governing China’s Local Officials: Analysis of Promotion Tournament Model. Econ. Res. J. 2007, 7, 36–50. [Google Scholar]
- Tosun, J. Political parties and marine pollution policy: Exploring the case of Germany. Mar. Policy 2011, 35, 536–541. [Google Scholar] [CrossRef]
- Wang, A.L. The search for sustainable legitimacy: Environmental, law and bureaucracy in China. Harv. Environ. Law Rev. 2013, 36, 367–382. [Google Scholar] [CrossRef]
- Qiao, K.Y. The re-examination of promotion mechanism of Chinese officials: Evidence from provincial and municipal governments. J. Financ. Econ. 2013, 4, 123–133. [Google Scholar]
- Lopez, R.; Mitra, S. Corruption, pollution and the Kuznets environment curve. J. Environ. Econ. Manag. 2000, 40, 137–150. [Google Scholar] [CrossRef]
- Zhang, Y.; Gong, L.T. The Fenshuizhi Reform, Fiscal Decentralization, and Economics Growth in China. China Econ. Q. 2005, 5, 75–108. [Google Scholar] [CrossRef]
- Breton, A. Competitive governments: An economic theory of politics and public finance. Public Choice 1996, 2, 223–227. [Google Scholar]
- Li, X.J.; Zhao, N. How Tax Competition Influences Environmental Pollution—An Analysis from the Pollutant Properties of Spillover. Financ. Trade Econ. 2017, 11, 131–146. [Google Scholar]
- Cumberland, J.H. Efficiency and Equity in Interregional Environment Management. Int. Reg. Sci. Rev. 1981, 2, 325–358. [Google Scholar]
- Wilson, J.D. Theories of Tax Competition. Natl. Tax J. 1999, 52, 269–304. [Google Scholar]
- Rauscher, M. Economic Growth and Tax Competition Leviathans. Int. Tax Public Financ. 2005, 12, 457–474. [Google Scholar] [CrossRef]
- He, J.; Liu, L.L.; Zhang, Y.J. Tax Competition, Revenue Decentralization and China’s Environmental Pollution. China Popul. Resour. Environ. 2016, 26, 1–7. [Google Scholar]
- Yan, W.J. Fiscal Decentralization, Government Competition and Environmental Pollution Disposal Investment. Financ. Trade Res. 2012, 23, 91–97. [Google Scholar] [CrossRef]
- Cooper, W.W.; Seiford, L.M.; Tone, K. Data Envelopment Analysis: A Comprehensive Text with Models, Applications, References and DEA-Solver Software, 2nd ed.; Springer: New York, NY, USA, 2007; p. 368. [Google Scholar]
- National Bureau of Statistics of China China Energy Statistical Yearbook Available online:. Available online: http://tongji.cnki.net/kns55/Navi/HomePage.aspx?id=N2016120537&name=YCXME&floor=1 (accessed on 17 June 2017).
- Wang, Z.; Feng, C. A performance evaluation of the energy, environmental, and economic efficiency and productivity in China: An application of global data envelopment analysis. Appl. Energy 2015, 147, 617–626. [Google Scholar] [CrossRef]
- National Bureau of Statistics of China. China Statistical Yearbook. Available online: http://www.stats.gov.cn/english/statisticaldata/annualdata/ (accessed on 20 June 2017).
- Shan, H.J. Reestimating the capital stock of China: 1952–2006. J. Quant. Tech. Econ. 2008, 10, 17–31. [Google Scholar] [CrossRef]
- Wu, Y.R. The Role of Productivity in China’s Growth: New Estimates. China Econ. Q. 2008, 7, 827–842. [Google Scholar] [CrossRef]
- Kuosmanen, T.; Kortelainen, M. Stochastic non-smooth envelopment of data: Semi-parametric frontier estimation subject to shape constraints. J. Prod. Anal. 2012, 38, 11–28. [Google Scholar] [CrossRef]
- Liu, G.P.; Zhu, Y. Total Factor Wellbeing Performance of Chinese Provincial Region within the Limitation of Carbon Emission. Soft Sci. 2014, 28, 88–93. [Google Scholar] [CrossRef]
- Deng, Y.P.; Xu, H.L. Foreign Direct Investment, Local Government Competition and Environmental Pollution: Empirical Analysis on Fiscal Decentralization. China Popul. Resour. Environ. 2013, 23, 155–163. [Google Scholar]
- National Bureau of Statistics of China. China Environmental Statistics Yearbook. Available online: http://tongji.cnki.net/kns55/Navi/HomePage.aspx?id=N2011010074&name=YHJSD&floor=1 (accessed on 30 June 2017).
- National Bureau of Statistics of China. China Tax Yearbook. Available online: http://tongji.cnki.net/kns55/navi/HomePage.aspx?id=N2011040004&name=YZGRE&floor=1 (accessed on 26 June 2017).
- CEIC. China Economic Database. Available online: https://www.ceicdata.com/zh-hans/products/china-economic-database (accessed on 13 June 2017).
- EPS. EPS China Data. Available online: http://www.epschinadata.com/ (accessed on 15 June 2017).
- Wang, J.J.; Tong, J.Z.; Li, X. Tax Competition, Fiscal Pressure and the Non-Tax Revenue Expansion of Local Governments. Financ. Trade Econ. 2014, 35, 27–38. [Google Scholar]
- Shen, K.R.; Fu, W.L. Tax Competition, Region Game and Their Efficiency of Growth. Econ. Res. J. 2006, 6, 16–26. [Google Scholar]
- Wang, F.R.; Miao, M. Tax Competition, Regional Environment and Inter-regional Capital Flow: An Empirical Research Based on the perspective of Inter-Province M&A. Econ. Res. J. 2015, 2, 16–30. [Google Scholar]
- Cui, Y.F.; Liu, X.C. Provincial Tax Competition and Environmental Pollution: Based on Panel Data from 1998 to 2006 in China. J. Financ. Econ. 2010, 4, 47–56. [Google Scholar] [CrossRef]
- Fang, H.S.; Zhang, J. Chinese Local Government, Soft Budget Constraint and Expansion-biased Fiscal Behavior. Econ. Res. J. 2009, 12, 4–16. [Google Scholar]
- Wang, B.; Cui, Z.W. Effective Tax Rates, Investment and Economic Growth: An Empirical Investigation in China. Manag. Rev. 2012, 24, 3–12. [Google Scholar] [CrossRef]
- He, J.; Wu, Z.Y. Fiscal Decentralization, Economic Growth and Urban-Rural Income Gap: An Analysis Based on Inter-Provincial Panel Date. Contemp. Financ. Econ. 2013, 5, 27–38. [Google Scholar] [CrossRef]
- Zeng, K.; Eastin, J. Do developing countries invest up? The environmental effects of foreign direct investment from less-developed countries. World Dev. 2012, 40, 2221–2233. [Google Scholar] [CrossRef]
- Wang, C.F.; Wang, T. RMB Exchange Rate, Foreign Demands and Profit Margin of China’s Industry Sectors. J. Quant. Tech. Econ. 2013, 3, 53–65. [Google Scholar] [CrossRef]
- Zhou, L.A.; Tao, J. Government Size, Market Development and Corruption. Econ. Res. J. 2009, 1, 57–69. [Google Scholar]
- Yang, Z.H. An Investigation on the Nonlinear Relationship between Government Size, Expenditure Growth and Economic Growth. J. Quant. Tech. Econ. 2011, 6, 77–92. [Google Scholar] [CrossRef]


| Variable | Mean | Std. Dev. | Min | Max | Observations |
|---|---|---|---|---|---|
| EEE | 0.501 | 0.290 | 0.012 | 1 | 480 |
| fd | 0.506 | 0.177 | 0.148 | 0.906 | 480 |
| com | −0.013 | 0.069 | −0.243 | 0.095 | 480 |
| open | 0.345 | 0.800 | 0.006 | 14.722 | 480 |
| market | 0.417 | 0.217 | 0.030 | 1.968 | 480 |
| ave_gdp | 17,664.32 | 12,304.36 | 2759 | 79,132.93 | 480 |
| tec | 0.092 | 0.016 | 0.048 | 0.131 | 480 |
| invest | 0.572 | 0.220 | 0.252 | 1.328 | 480 |
| ir | 0.060 | 0.034 | −0.007 | 0.223 | 480 |
| gs | 0.192 | 0.085 | 0.077 | 0.628 | 480 |
| Variables | Model 1 | Model 2 | Model 3 | Model 4 | Model 5 |
|---|---|---|---|---|---|
| fd | 0.482 *** (3.21) | 0.475 *** (3.18) | 0.435 ** (2.59) | 0.308 ** (2.28) | |
| com | −0.606 *** (−2.69) | −0.607 *** (−2.79) | −0.794 *** (−5.12) | −0.607 *** (−7.78) | |
| fd*com | −1.570 * (−1.66) | −1.735 * (−1.89) | −1.458 * (−2.09) | ||
| open | 0.028 ** (2.14) | 0.030 ** (2.39) | 0.033 * (1.89) | 0.033 (1.78) | 0.031 * (1.82) |
| market | −0.283 *** (−4.26) | −0.310 *** (−4.64) | −0.333 *** (-4.62) | −0.394 *** (−6.50) | −0.380 *** (−4.50) |
| tec | 0.073 *** (6.35) | 0.067 *** (5.44) | 0.049 *** (7.16) | 0.032 ** (2.77) | 0.044 *** (5.06) |
| ave_gdp | 7.15 × 10⁻⁶ *** (3.35) | 7.62 × 10⁻⁶ *** (3.39) | 1.41 × 10⁻⁵ *** (5.87) | 1.58 × 10⁻⁵ *** (10.01) | 1.19 × 10⁻⁵ *** (4.92) |
| invest | −0.568 *** (−6.96) | −0.543 *** (−6.32) | −0.435 *** (−4.00) | −0.401 ** (−3.45) | −0.388 *** (−3.48) |
| ir | 0.036 (0.10) | 0.417 (1.01) | 0.293 (1.03) | 0.719 ** (2.38) | 0.794 ** (2.97) |
| gs | 0.887 *** (3.60) | 1.059 *** (4.10) | 1.708 *** (11.25) | 1.178 *** (11.22) | 1.369 *** (9.28) |
| R-squared | 0.570 | 0.571 | 0.579 | 0.585 | |
| F | 0.0000 | 0.0000 | 0.0000 | 0.0000 | 0.0000 |
| Hausman | 0.0000 | 0.0000 | 0.0000 | ||
| Observations | 480 | 480 | 480 | 480 | 480 |
| 2000–2007 | 2008–2015 | |||||
|---|---|---|---|---|---|---|
| Variables | Model 6 | Model 7 | Model 8 | Model 9 | Model 10 | Model 11 |
| fd | 0.517 * (2.42) | 0.431 ** (2.26) | 0.598 *** (4.74) | 0.521 *** (6.20) | ||
| com | −0.675 *** (−3.86) | −0.543 ** (−2.89) | −0. 833 *** (−5.72) | −0.494 *** (−5.62) | ||
| fd*com | −1.073 ** (−2.39) | −1.717 *** (−4.15) | ||||
| open | 0.398 ** (5.65) | 0.439 *** (11.53) | 0.475 *** (11.73) | 0.014 (1.24) | 0.014 (1.01) | 0.013 (1.24) |
| market | −0.224 (−2.23) | −0.065 (−1.03) | −0.147 (−1.80) | −0. 414 *** (−6.50) | −0. 474 *** (−9.88) | −0.453 *** (−7.77) |
| tec | 0.108 *** (6.14) | 0.067 ** (5.44) | 0.123 *** (8.51) | 0. 045 *** (7.70) | 0.020 * (2.10) | 0.040 *** (5.97) |
| ave_gdp | 1.79 × 10−5 * (2.57) | 1.82 × 10⁻⁵ *** (6.12) | 2 × 10⁻⁵ *** (6.25) | 6.67 × 10⁻⁶ *** (6.38) | 9.83 × 10⁻⁶ *** (31.43) | 5.01 × 10⁻⁶ *** (7.37) |
| invest | −0.451 ** (−3.21) | −0.456 *** (−6.06) | −0.438 *** (−7.94) | −0. 425 ** (−4.22) | −0.369 ** (−3.21) | −0.364 *** (−3.21) |
| ir | 0.127 (0.34) | 0.415 (0.92) | 0.367 (0.84) | 1.023 (1.89) | 0.680 (1.21) | 0.594 (1.13) |
| gs | 0.449 (1.06) | 0.021 (0.56) | 0.442 (1.51) | 1.660 *** (11.86) | 1.078 *** (30.20) | 1.435 *** (13.95) |
| R-squared | 0.461 | 0.454 | 0.517 | 0.521 | 0.522 | 0.537 |
| F | 0.0000 | 0.0000 | 0.0000 | 0.0000 | 0.0000 | 0.0000 |
| Hausman | 0.0000 | 0.0000 | 0.0003 | 0.0000 | 0.0000 | 0.0001 |
| Observations | 240 | 240 | 240 | 240 | 240 | 240 |
| Variables | Model 12 | Model 13 | Model 14 | Model 15 |
|---|---|---|---|---|
| DumE*com | −0.892 ** (−2.66) | −0.869*** (−3.63) | −1.276*** (−9.10) | −1.310 *** (−9.35) |
| DumM*com | −0.782 (−1.40) | −0.835 ** (−2.32) | −0.698 *** (−3.88) | −0.697 *** (−3.75) |
| DumW*com | 1.437 (1.86) | 1.501996 *** (4.87) | 0.8472537 *** (4.07) | 0.846 *** (4.04) |
| fd | 0.572 ** (2.26) | 0.521 *** (3.74) | 0.253 * (2.15) | 0.279 ** (2.35) |
| market | −0.207 * (−1.99) | −0.234 *** (−3.96) | −0.360 *** (−5.80) | −0.360 *** (−5.70) |
| tec | 0.084 ** (2.53) | 0.076 ** (6.62) | 0.030 ** (2.27) | 0.028 * (2.13) |
| ave_gdp | 8.78 × 10⁻⁶ ** (2.17) | 9.41 × 10⁻⁶ *** (4.53) | 1.06 × 10⁻⁵ *** (5.13) | 1.06 × 10⁻⁵ *** (5.06) |
| invest | −0.565 ** (−2.48) | −0.5652029 *** (−6.92) | −0.399 *** (−3.30) | −0.417 *** (−3.38) |
| ir | −0.384 (−0.57) | −0.153 (−0.44) | 0.789 ** (2.82) | 0.742 ** (2.57) |
| gs | 1.218 ** (2.57) | 1.384 *** (5.76) | 1.616 *** (9.40) | 1.651 *** (9.56) |
| open | 0.035 (1.24) | 0.038 *** (2.85) | 0.029 (1.70) | |
| R-squared | 0.5404 | 0.6183 | 0.6118 | |
| F | 0.0000 | 0.0000 | 0.0000 | 0.0000 |
| Hausman | 0.0000 | 0.0000 | ||
| Observations | 480 | 480 | 480 | 480 |
© 2018 by the authors. Licensee MDPI, Basel, Switzerland. This article is an open access article distributed under the terms and conditions of the Creative Commons Attribution (CC BY) license (http://creativecommons.org/licenses/by/4.0/).
Share and Cite
Zhou, M.; Wang, T.; Yan, L.; Xie, X.-B. Has Economic Competition Improved China’s Provincial Energy Ecological Efficiency under Fiscal Decentralization? Sustainability 2018, 10, 2483. https://doi.org/10.3390/su10072483
Zhou M, Wang T, Yan L, Xie X-B. Has Economic Competition Improved China’s Provincial Energy Ecological Efficiency under Fiscal Decentralization? Sustainability. 2018; 10(7):2483. https://doi.org/10.3390/su10072483
Chicago/Turabian StyleZhou, Min, Teng Wang, Liang Yan, and Xiong-Biao Xie. 2018. "Has Economic Competition Improved China’s Provincial Energy Ecological Efficiency under Fiscal Decentralization?" Sustainability 10, no. 7: 2483. https://doi.org/10.3390/su10072483
APA StyleZhou, M., Wang, T., Yan, L., & Xie, X.-B. (2018). Has Economic Competition Improved China’s Provincial Energy Ecological Efficiency under Fiscal Decentralization? Sustainability, 10(7), 2483. https://doi.org/10.3390/su10072483