Corporate Social Responsibility, Ownership Structure, and Firm Value: Evidence from Korea


Abstract
1. Introduction
2. Literature Review
3. Hypothesis Development
3.1. The Relationship between CSR and Firm Value
3.2. The Effect of Large Shareholder Ownership on the Relationship between CSR on Firm Value
3.3. The Effect of Foreign Ownership on the Relationship between CSR on Firm Value
4. Materials and Methods
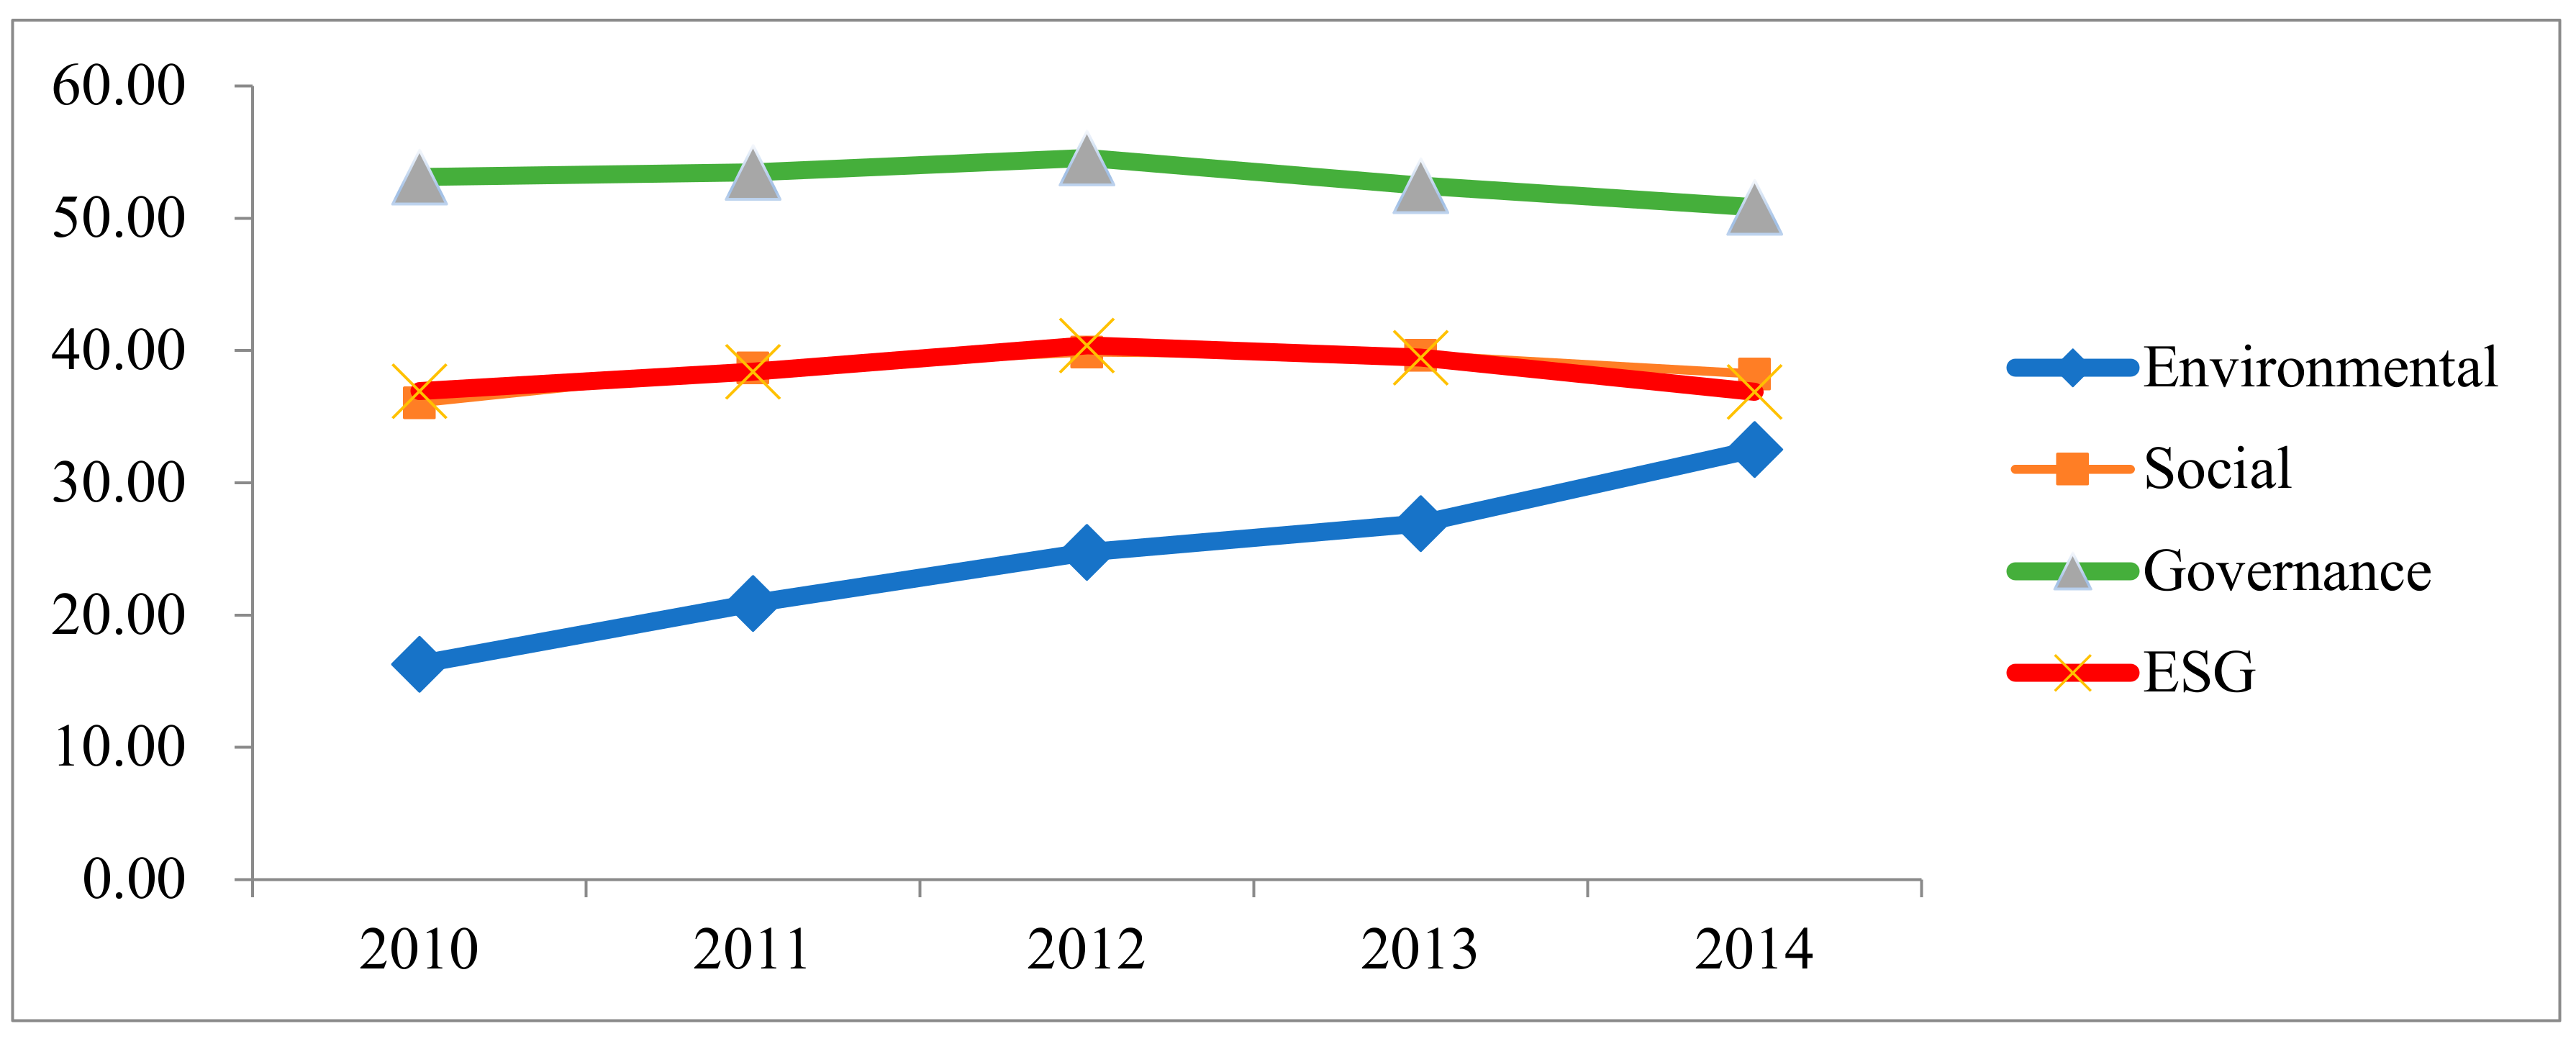
4.1. Sample Selection
4.2. Research Methodology
5. Results and Discussion
5.1. Descriptive Statistics
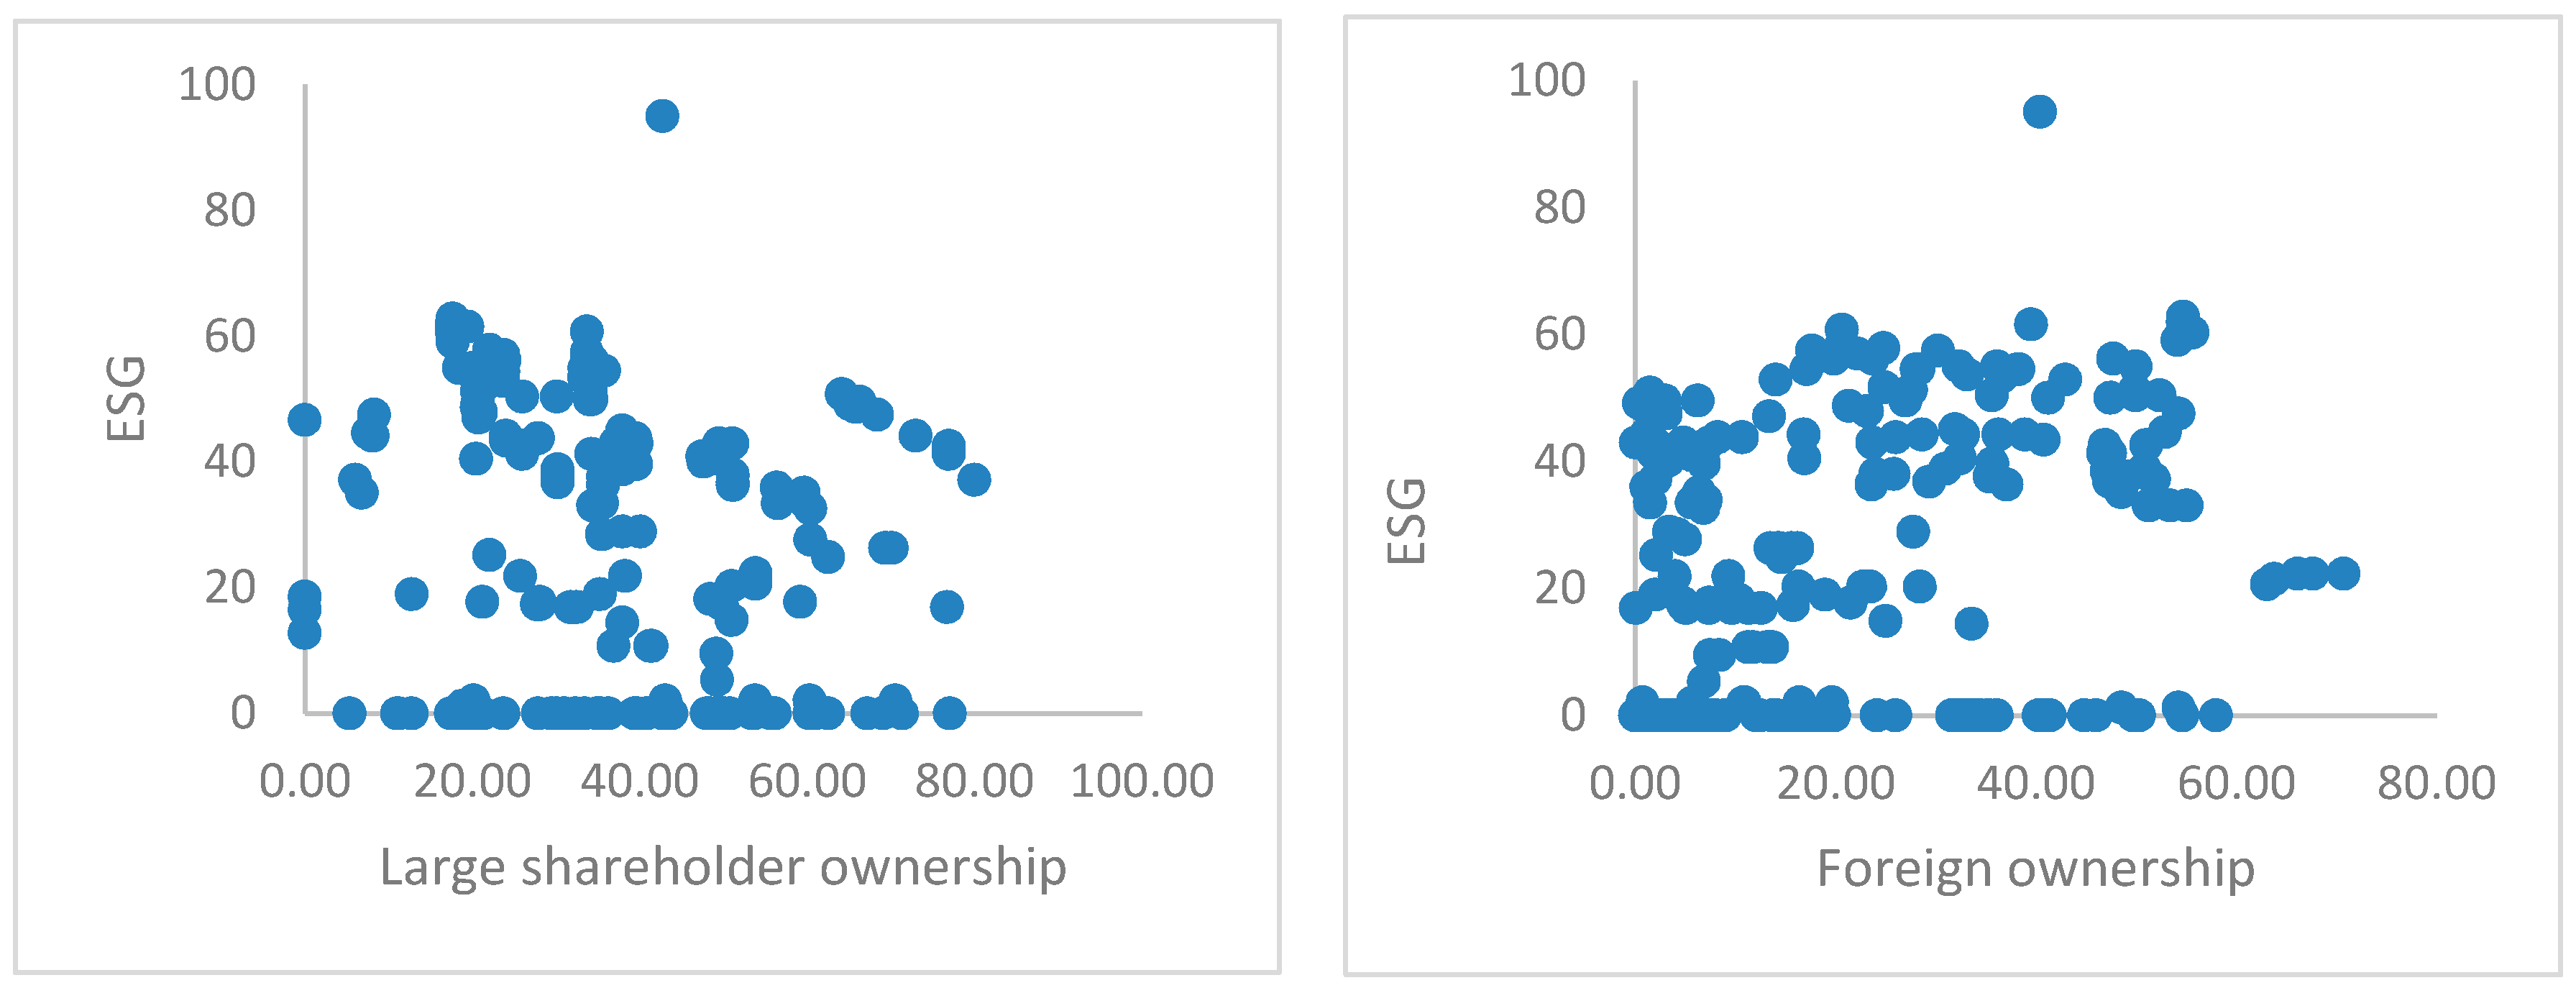
5.2. Preliminary Analysis
5.3. Univariate Analysis
5.4. The Relationship between CSR and Firm Value
5.5. The Effect of Large Shareholder Ownership on the Relationship between CSR and Firm Value
5.6. The Effect of Foreign Ownership on the Relationship between CSR and Firm Value
5.7. Additional Analysis
6. Conclusions
Author Contributions
Funding
Acknowledgments
Conflicts of Interest
References
- McWilliams, A.; Siegel, D.S.; Wright, P.M. Corporate social responsibility: Strategic implications. J. Manag. Stud. 2006, 43, 1–18. [Google Scholar] [CrossRef]
- McGuire, J.B.; Sundgren, A.; Schneeweis, T. Corporate social responsibility and firm financial performance. Acad. Manag. J. 1988, 31, 854–872. [Google Scholar] [CrossRef]
- McWilliams, A.; Siegel, D. Corporate social responsibility and financial performance: Correlation or misspecification? Strateg. Manag. J. 2000, 21, 603–609. [Google Scholar] [CrossRef]
- Orlitzky, M.; Schmidt, F.L.; Rynes, S.L. Corporate social and financial performance: A meta-analysis. Organ. Stud. 2003, 24, 403–441. [Google Scholar] [CrossRef]
- Flammer, C. Corporate social responsibility and shareholder reaction: The environmental awareness of investors. Acad. Manag. J. 2013, 56, 758–781. [Google Scholar] [CrossRef]
- Servaes, H.; Tamayo, A. The impact of corporate social responsibility on firm value. Manag. Sci. 2013, 59, 1045–1061. [Google Scholar] [CrossRef]
- Orlitzky, M. Does firm size confound the relationship between corporate social performance and financial performance? J. Bus. Ethics 2001, 33, 167–180. [Google Scholar] [CrossRef]
- Margolis, J.D.; Walsh, J.P. Misery loves companies: Rethinking social initiatives by business. Adm. Sci. Q. 2003, 48, 268–305. [Google Scholar] [CrossRef]
- Fisman, R.; Heal, G.; Nair, V.B. Corporate Social Responsibility: Doing Well by Doing Good? Working Paper; Columbia University: New York, NY, USA, 2005; Available online: apps.olin.wustl.edu/jfi/pdf/corporate.social.responsibility.pdf (accessed on 4 July 2018).
- Lin, C.-H.; Yang, H.-L.; Liou, D.-Y. The impact of corporate social responsibility on financial performance: Evidence from business in Taiwan. Technol. Soc. 2009, 31, 56–63. [Google Scholar] [CrossRef]
- Mishra, S.; Suar, D. Does corporate social responsibility influence firm performance of Indian companies? J. Bus. Ethics 2010, 95, 571–601. [Google Scholar] [CrossRef]
- Oeyono, J.; Samy, M.; Bampton, R. An examination of corporate social responsibility and financial performance: A study of the top 50 Indonesian listed corporations. J. Glob. Responsib. 2011, 2, 100–112. [Google Scholar] [CrossRef]
- Saeidi, S.P.; Sofian, S.; Saeidi, P.; Saeidi, S.P.; Saeaeidi, S.A. How does corporate social responsibility contribute to firm financial performance? The mediating role of competitive advantage, reputation, and customer satisfaction. J. Bus. Res. 2015, 68, 341–350. [Google Scholar] [CrossRef]
- Hategan, C.-D.; Curea-Pitorac, R.-I. Testing the Correlations between Corporate Giving, Performance and Company Value. Sustainability 2017, 9, 1210. [Google Scholar] [CrossRef]
- Lenz, I.; Wetzel, H.A.; Hammerschmidt, M. Can doing good lead to doing poorly? Firm value implications of CSR in the face of CSI. J. Acad. Market. Sci. 2017, 45, 677–697. [Google Scholar] [CrossRef]
- Singh, P.J.; Sethuraman, K.; Lam, J.Y. Impact of Corporate Social Responsibility Dimensions on Firm Value: Some Evidence from Hong Kong and China. Sustainability 2017, 9, 1532. [Google Scholar] [CrossRef]
- Hategan, C.-D.; Sirghi, N.; Curea-Pitorac, R.-I.; Hategan, V.-P. Doing Well or Doing Good: The Relationship between Corporate Social Responsibility and Profit in Romanian Companies. Sustainability 2018, 10, 1041. [Google Scholar] [CrossRef]
- Lau, A.K.W.; Lee, S.H.N.; Jung, S. The Role of the Institutional Environment in the Relationship between CSR and Operational Performance: An Empirical Study in Korean Manufacturing Industries. Sustainability 2018, 10, 834. [Google Scholar] [CrossRef]
- Miralles-Quirós, M.M.; Miralles-Quirós, J.L.; Valente Gonçalves, L.M. The Value Relevance of Environmental, Social, and Governance Performance: The Brazilian Case. Sustainability 2018, 10, 574. [Google Scholar] [CrossRef]
- Marcus, A. The deterrent to dubious corporate behavior: Profitability, probability, and safety recalls. Strateg. Manag. J. 1989, 10, 233–250. [Google Scholar] [CrossRef]
- Wright, P.; Ferris, S. Agency conflict and corporate strategy: The effect of divestment on corporate value. Strateg. Manag. J. 1997, 18, 77–83. [Google Scholar] [CrossRef]
- Griffin, J.J.; Mahon, J.F. The corporate social performance and corporate financial performance debate: Twenty-five years of incomparable research. Bus. Soc. 1997, 36, 5–31. [Google Scholar] [CrossRef]
- Waddock, S.A.; Graves, S.B. The corporate social performance-financial performance link. Strateg. Manag. J. 1997, 18, 303–319. [Google Scholar] [CrossRef]
- Stanwick, P.A.; Stanwick, S.D. The relationship between corporate social performance, and organizational size, financial performance, and environmental performance: An empirical examination. J. Bus. Ethics 1998, 17, 195–204. [Google Scholar] [CrossRef]
- Margolis, J.D.; Walsh, J.P. People and Profits: The Search for a Link between a Company’s Social and Financial Performance, 1st ed.; Psychology Press: New York, NY, USA, 2001; ISBN 10-0805840117. [Google Scholar]
- Nam, Y.-S. The changing landscape of corporate social responsibility in Korea. Rev. Educ. COGEIME 2011, 20, 145–158. [Google Scholar] [CrossRef]
- Conglomerates Pushing Reform After Graft Scandal. Available online: http://koreabizwire.com/conglomerates-pushing-reform-after-graft-scandal/76130 (accessed on 24 March 2018).
- Choi, H.M.; Sul, W.; Min, S.K. Foreign board membership and firm value in Korea. Manag. Decis. 2012, 50, 207–233. [Google Scholar] [CrossRef]
- Lee, J.; Kim, S.-J.; Kwon, I. Corporate Social Responsibility as a Strategic Means to Attract Foreign Investment: Evidence from Korea. Sustainability 2017, 9, 2121. [Google Scholar] [CrossRef]
- Chapple, W.; Moon, J. Corporate social responsibility in Asia: A seven country study of CSR website reporting. Bus. Soc. 2005, 44, 415–441. [Google Scholar] [CrossRef]
- Oh, W.Y.; Chang, Y.K.; Martynov, A. The effect of ownership structure on corporate social responsibility: Empirical evidence from Korea. J. Bus. Ethics 2011, 104, 283–297. [Google Scholar] [CrossRef]
- Freeman, R.E. Strategic Management: A Stakeholder Approach, 1st ed.; Pitman: Boston, MA, USA, 1984. [Google Scholar]
- Donaldson, T.; Preston, L.E. The stakeholder theory of the corporation: Concepts, evidence, and implications. Acad. Manag. Rev. 1995, 20, 65–91. [Google Scholar] [CrossRef]
- Jones, T.M. Instrumental stakeholder theory: A synthesis of ethics and economics. Acad. Manag. Rev. 1995, 20, 404–437. [Google Scholar] [CrossRef]
- Jones, R.; Murrell, A.J. Signaling positive corporate social performance: An event study of family-friendly firms. Bus. Soc. 2001, 42, 59–78. [Google Scholar] [CrossRef]
- Hill, C.W.L.; Jones, T.M. Stakeholder-agency theory. J. Manag. Stud. 1992, 29, 131–154. [Google Scholar] [CrossRef]
- Aupperle, K.E.; Carroll, A.B.; Hatfield, J.D. An empirical examination of the relationship between corporate social responsibility and profitability. Acad. Manag. Rev. 1985, 28, 446–463. [Google Scholar] [CrossRef]
- Okamoto, D. Social relationship of a firm and the CSP–CFP relationship in Japan: Using artificial neural networks. J. Bus. Ethics 2009, 87, 117–132. [Google Scholar] [CrossRef]
- Eom, K.; Nam, G. Effect of Entry into Socially Responsible Investment Index on Cost of Equity and Firm Value. Sustainability 2017, 9, 717. [Google Scholar] [CrossRef]
- Loh, L.; Thomas, T.; Wang, Y. Sustainability Reporting and Firm Value: Evidence from Singapore-Listed Companies. Sustainability 2017, 9, 2112. [Google Scholar] [CrossRef]
- Li, W.; Zhang, R. Corporate social responsibility, ownership structure, and political interference: Evidence from China. J. Bus. Ethics 2010, 96, 631–645. [Google Scholar] [CrossRef]
- Li, A.; Xia, X. Are controlling shareholders influencing the relationship between corporate social responsibility and earnings quality? Evidence from Chinese listed companies. Emerg. Mark. Financ. Trade 2018, 54, 1047–1062. [Google Scholar] [CrossRef]
- Zhu, Y.; Sun, L.-Y.; Leung, A.S.M. Corporate social responsibility, firm reputation, and firm performance: The role of ethical leadership. Asia Pac. J. Manag. 2014, 31, 925–947. [Google Scholar] [CrossRef]
- Cockburn, I.A.; Henderson, R.M.; Stern, S. Untangling the origins of competitive advantage. Strateg. Manag. J. 2000, 21, 1123–1145. [Google Scholar] [CrossRef]
- Keim, G.D. Managerial behavior and the social responsibilities debate: Goals versus constraints. Acad. Manag. J. 1978, 21, 57–68. [Google Scholar] [CrossRef]
- Ullmann, A.A. Data in search of a theory: A critical examination of the relationships among social performance, social disclosure, and economic performance of U.S. firms. Acad. Manag. Rev. 1985, 10, 540–577. [Google Scholar] [CrossRef]
- Barnea, A.; Rubin, A. Corporate social responsibility as a conflict between shareholders. J. Bus. Ethics 2010, 97, 71–86. [Google Scholar] [CrossRef]
- Chang, S.J. Ownership structure, expropriation, and performance of group-affiliated companies in Korea. Acad. Manag. J. 2003, 46, 238–253. [Google Scholar] [CrossRef]
- Cho, D.-S.; Kim, J. Outside directors, ownership structure and firm profitability in Korea. Corp. Gov. 2007, 15, 239–250. [Google Scholar] [CrossRef]
- Claessens, S.; Djankov, S.; Lang, L.H.P. The separation of ownership and control in East Asian corporations. J. Financ. Econ. 2000, 58, 81–112. [Google Scholar] [CrossRef]
- Johnson, S.; La Porta, R.; Lopez-De-Silanes, F.; Shleifer, A. Tunneling. Am. Econ. Rev. 2000, 90, 22–27. [Google Scholar] [CrossRef]
- Bae, K.-H.; Kang, J.-K.; Kim, J.-M. Tunneling or value added? Evidence from mergers by Korean business groups. J. Financ. 2002, 57, 2695–2740. [Google Scholar] [CrossRef]
- Kim, B.; Lee, I. Agency problems and performance of Korean companies during the Asian financial crisis: Chaebol vs. non-chaebol firms. Pac. Basin Financ. J. 2003, 11, 327–348. [Google Scholar] [CrossRef]
- Joh, S.W. Corporate governance and firm profitability: Evidence from Korea before the economic crisis. J. Financ. Econ. 2003, 68, 287–322. [Google Scholar] [CrossRef]
- Kim, H.; Kim, H.; Lee, P.M. Ownership structure and the relationship between financial slack and R&D investments: Evidence from Korean firms. Organ. Sci. 2008, 19, 404–418. [Google Scholar] [CrossRef]
- StataCorp. Stata Statistical Software: Release 13; StataCorp LP: College Station, TX, USA, 2013. [Google Scholar]
- Chung, K.H.; Pruitt, S.W. A simple approximation of Tobin’s q. Financ. Manag. 1994, 23, 70–74. [Google Scholar] [CrossRef]
- McConnell, J.J.; Servaes, H. Additional evidence on equity ownership and corporate value. J. Financ. Econ. 1990, 27, 595–612. [Google Scholar] [CrossRef]
- Berger, P.G.; Ofek, E. Diversification’s effect on firm value. J. Financ. Econ. 1995, 37, 39–65. [Google Scholar] [CrossRef]
- Nollet, J.; Filis, G.; Mitrokostas, E. Corporate social responsibility and financial performance: A non-linear and disaggregated approach. Econ. Model. 2016, 52, 400–407. [Google Scholar] [CrossRef]
- Lacy, P.; Cooper, T.; Hayward, R.; Neuberger, L. A New Era of Sustainability: UN Global Compact–Accenture CEO Study; United Nations Global Compact and Accenture: New York, NY, USA, 2010; Available online: https://www.unglobalcompact.org/docs/news_events/8.1/UNGC_Accenture_CEO_Study_2010.pdf (accessed on 2 April 2018).
- White, H. A heteroskedasticity-consistent covariance matrix estimator and a direct test for heteroskedasticity. Econometrica 1980, 48, 817–838. [Google Scholar] [CrossRef]


| Proxy Variables for CSR | Predicted Sign | Definition |
|---|---|---|
| ESG | + | Environmental, social, and governance (ESG) disclosure scores. |
| Environmental | + | Environmental disclosure scores. |
| Social | + | Social disclosure scores. |
| Governance | + | Governance disclosure scores. |
| Each CSR disclosure score × Largesharedummy | − | An interaction term between each CSR disclosure score and a dummy variable for large shareholder ownership. |
| Each CSR disclosure score × Foreigndummy | + | An interaction term between each CSR disclosure score and a dummy variable for foreign ownership. |
| Variables | N | Mean | Std. Dev. | Min. | 25% | Median | 75% | Max. |
|---|---|---|---|---|---|---|---|---|
| Tobin’s Q | 240 | 1.409 | 1.086 | 0.000 | 0.828 | 1.078 | 1.570 | 6.171 |
| ESG | 240 | 23.908 | 21.802 | 0.000 | 0.000 | 20.500 | 43.750 | 95.000 |
| Environmental | 240 | 20.521 | 21.433 | 0.000 | 0.000 | 9.000 | 38.000 | 90.000 |
| Social | 153 | 38.346 | 16.809 | 9.000 | 26.000 | 39.000 | 47.000 | 88.000 |
| Governance | 151 | 50.556 | 15.357 | 9.000 | 43.000 | 54.000 | 61.000 | 114.000 |
| Leverage | 235 | 0.388 | 0.188 | 0.008 | 0.258 | 0.378 | 0.521 | 1.480 |
| Assetgr | 213 | 7.262 | 18.635 | −76.100 | −0.105 | 5.960 | 14.375 | 110.210 |
| Profitability | 235 | 0.061 | 0.225 | −1.515 | 0.012 | 0.046 | 0.098 | 2.842 |
| Lnasset | 235 | 9.350 | 0.899 | 7.619 | 8.616 | 9.198 | 10.182 | 11.215 |
| Lnage | 232 | 2.684 | 0.879 | 0.000 | 2.197 | 2.970 | 3.258 | 3.714 |
| Large shareholder ownership | 230 | 38.833 | 18.241 | 0.000 | 24.000 | 35.620 | 51.018 | 80.000 |
| Foreign ownership | 226 | 22.629 | 18.385 | 0.000 | 6.355 | 17.495 | 36.145 | 70.710 |
| Variables | Firms with High CSR | Firms with Low CSR | Mean Difference | t-Value | ||
|---|---|---|---|---|---|---|
| N | Mean | N | Mean | |||
| Tobin’s Q | 115 | 1.569 | 125 | 1.262 | 0.307 ** | 2.206 |
| ESG | 115 | 37.826 | 125 | 11.104 | 26.722 *** | 11.988 |
| Environmental | 115 | 34.078 | 125 | 8.048 | 26.030 *** | 11.814 |
| Social | 91 | 47.286 | 62 | 25.226 | 22.060 *** | 10.411 |
| Governance | 91 | 59.352 | 60 | 37.217 | 22.135 *** | 12.226 |
| Leverage | 110 | 0.409 | 125 | 0.371 | 0.038 | 1.550 |
| Assetgr | 103 | 8.771 | 110 | 5.850 | 2.922 *** | 1.144 |
| Profitability | 110 | 0.052 | 125 | 0.068 | −0.017 | −0.570 |
| Lnasset | 110 | 9.896 | 125 | 8.869 | 1.027 *** | 10.625 |
| Lnage | 108 | 2.797 | 124 | 2.586 | 0.211 * | 1.831 |
| Large shareholder ownership | 105 | 34.405 | 125 | 42.553 | −8.147 *** | −3.454 |
| Foreign ownership | 106 | 29.346 | 120 | 16.696 | 12.650 *** | 5.486 |
| Variables | Firms with a High Large Shareholder Ownership | Firms with a Low Large Shareholder Ownership | Mean Difference | t-Value | ||
|---|---|---|---|---|---|---|
| N | Mean | N | Mean | |||
| Tobin’s Q | 95 | 1.526 | 145 | 1.333 | 0.194 | 1.353 |
| ESG | 95 | 17.347 | 145 | 28.207 | −10.860 *** | −3.883 |
| Environmental | 95 | 12.968 | 145 | 25.469 | −12.501 *** | −4.601 |
| Social | 54 | 37.685 | 99 | 38.707 | −1.022 | −0.336 |
| Governance | 51 | 44.255 | 100 | 53.770 | −9.515 *** | −3.755 |
| Leverage | 95 | 0.372 | 140 | 0.399 | −0.027 | −1.098 |
| Assetgr | 89 | 7.202 | 124 | 7.306 | −0.104 | −0.040 |
| Profitability | 95 | 0.062 | 140 | 0.060 | 0.003 | 0.104 |
| Lnasset | 95 | 8.926 | 140 | 9.638 | −0.712 *** | −6.450 |
| Lnage | 94 | 2.308 | 138 | 2.940 | −0.632 *** | −5.744 |
| Large shareholder ownership | 95 | 56.954 | 135 | 26.081 | 30.873 *** | 22.931 |
| Foreign ownership | 95 | 14.812 | 131 | 28.299 | −13.487 *** | −5.829 |
| Variables | Firms with a High Foreign Ownership | Firms with a Low Foreign Ownership | Mean Difference | t-Value | ||
|---|---|---|---|---|---|---|
| N | Mean | N | Mean | |||
| Tobin’s Q | 99 | 1.881 | 141 | 1.078 | 0.803 *** | 6.045 |
| ESG | 99 | 32.556 | 141 | 17.837 | 14.719 *** | 5.449 |
| Environmental | 99 | 28.576 | 141 | 14.865 | 13.711 *** | 5.130 |
| Social | 74 | 43.135 | 79 | 33.861 | 9.274 *** | 3.537 |
| Governance | 74 | 56.500 | 77 | 44.844 | 11.656 *** | 5.025 |
| Leverage | 99 | 0.388 | 136 | 0.388 | 0.000 | −0.003 |
| Assetgr | 98 | 10.423 | 115 | 4.569 | 5.853 *** | 2.308 |
| Profitability | 99 | 0.082 | 136 | 0.045 | 0.037 | 1.245 |
| Lnasset | 99 | 9.920 | 136 | 8.935 | 0.986 *** | 9.854 |
| Lnage | 97 | 2.704 | 135 | 2.670 | 0.034 | 0.288 |
| Large shareholder ownership | 99 | 31.833 | 131 | 44.123 | −12.290 *** | −5.357 |
| Foreign ownership | 99 | 40.649 | 127 | 8.582 | 32.067 *** | 26.078 |
| (1) | (2) | (3) | (4) | (5) | (6) | (7) | (8) | (9) | (10) | (11) | (12) | |
|---|---|---|---|---|---|---|---|---|---|---|---|---|
| (1) Tobin’s Q | 1.000 | 0.210 *** | 0.138 ** | 0.304 *** | 0.109 | 0.097 | 0.356 *** | 0.571 *** | −0.173 ** | −0.124 | −0.059 | 0.380 *** |
| (2) ESG | 0.173 *** | 1.000 | 0.965 *** | 0.822 *** | 0.833 *** | 0.124 | −0.003 | −0.001 | 0.115 | 0.175 ** | −0.209 *** | 0.288 *** |
| (3) Environmental | 0.079 | 0.953 *** | 1.000 | 0.619 *** | 0.747 *** | 0.120 | −0.003 | −0.035 | 0.133 * | 0.188 ** | −0.243 *** | 0.308 *** |
| (4) Social | 0.256 *** | 0.803 *** | 0.609 *** | 1.000 | 0.588 *** | 0.197 ** | 0.123 | 0.086 | −0.128 | −0.128 | −0.019 | 0.146 |
| (5) Governance | 0.025 | 0.839 *** | 0.708 *** | 0.582 *** | 1.000 | 0.011 | 0.271 *** | 0.058 | 0.075 | 0.075 | −0.372 *** | 0.392 *** |
| (6) Leverage | 0.059 | 0.156 ** | 0.146 ** | 0.191 ** | −0.010 | 1.000 | −0.005 | −0.337 *** | −0.180 ** | −0.178 ** | 0.098 | −0.109 |
| (7) Assetgr | 0.211 *** | −0.007 | −0.007 | 0.047 | 0.132 | −0.059 | 1.000 | 0.465 *** | −0.045 | −0.058 | −0.043 | 0.233 *** |
| (8) Profitability | 0.179 *** | −0.077 | −0.088 | 0.026 | 0.053 | −0.356 *** | −0.003 | 1.000 | 0.004 | 0.005 | −0.067 | 0.375 *** |
| (9) Lnasset | −0.119 | 0.500 *** | 0.575 *** | 0.111 | 0.411 *** | 0.121 | 0.112 | −0.068 | 1.000 | 0.201 | −0.371 *** | 0.578 *** |
| (10) Lnage | −0.294 ** | 0.073 | 0.119 | −0.122 | 0.003 | −0.106 | −0.035 | 0.041 | 0.165 ** | 1.000 | −0.471 *** | 0.133 ** |
| (11) Large shareholder ownership | 0.126 | −0.195 *** | −0.237 *** | 0.127 | −0.253 *** | 0.067 | 0.006 | −0.043 | −0.407 ** | −0.460 ** | 1.000 | −0.490 *** |
| (12) Foreign ownership | 0.373 *** | 0.281 *** | 0.298 *** | 0.129 | 0.286 *** | −0.109 | 0.140 ** | 0.155 ** | 0.542 ** | 0.129 | −0.461 *** | 1.000 |
| Independent Variables | Dependent Variable: Tobin’s Q | |||
|---|---|---|---|---|
| (1) | (2) | (3) | (4) | |
| Intercept | 4.223 (5.234) *** | 4.315 (5.118) *** | 4.832 (4.693) *** | 4.519 (4.129) *** |
| ESG | 0.011 (4.368) *** | |||
| Environmental | 0.010 (3.681) *** | |||
| Social | 0.009 (2.140) ** | |||
| Governance | 0.003 (0.580) | |||
| Leverage | 0.983 (3.819) *** | 1.032 (3.970) *** | 1.111 (3.199) *** | 1.083 (3.079) *** |
| Assetgr | 0.001 (0.380) | 0.001 (0.283) | 0.004 (0.772) | 0.004 (0.779) |
| Profitability | 6.166 (8.251) *** | 6.356 (8.425) *** | 5.569 (5.443) *** | 5.581 (5.460) *** |
| Lnasset | −0.397 (−4.796) *** | −0.401 (−4.618) *** | −0.445 (−4.371) *** | −0.400 (−3.611) *** |
| Lnage | −0.291 (−4.166) *** | −0.296 (−4.181) *** | −0.337 (−3.478) *** | −0.337 (−3.440) *** |
| Large shareholder ownership | 0.005 (1.440) | 0.005 (1.395) | 0.003 (0.613) | 0.007 (1.267) |
| Foreign ownership | 0.021 (5.184) *** | 0.021 (5.096) *** | 0.025 (4.471) *** | 0.025 (4.348) *** |
| Adjusted R2 | 0.603 | 0.593 | 0.617 | 0.597 |
| # of obs. | 213 | 213 | 144 | 142 |
| Independent Variables | Dependent Variable: Tobin’s Q | |||
|---|---|---|---|---|
| (1) | (2) | (3) | (4) | |
| Intercept | 4.237 (5.275) *** | 4.256 (5.072) *** | 4.397 (4.269) *** | 4.046 (3.704) *** |
| ESG | 0.014 (4.648) *** | |||
| Environmental | 0.013 (4.113) *** | |||
| Social | 0.015 (3.099) *** | |||
| Governance | 0.009 (1.669) * | |||
| ESG × Largesharedummy | −0.008 (−1.710) * | |||
| Environmental × Largesharedummy | −0.009 (−1.794) * | |||
| Social × Largesharedummy | −0.014 (−2.342) ** | |||
| Governance × Largesharedummy | −0.012 (−2.434) ** | |||
| Leverage | 0.934 (3.623) *** | 0.967 (3.706) *** | 0.941 (2.695) ** | 0.905 (2.562) ** |
| Assetgr | 0.000 (0.150) | 0.000 (0.088) | 0.003 (0.739) | 0.002 (0.516) |
| Profitability | 6.373 (8.457) *** | 6.474 (8.595) *** | 5.866 (5.782) *** | 5.950 (5.861) *** |
| Lnasset | −0.408 (−4.938) *** | −0.400 (−4.625) *** | −0.462 (−4.607) *** | −0.414 (−3.803) *** |
| Lnage | −0.303 (−4.345) *** | −0.312 (−4.402) *** | −0.300 (−3.099) *** | −0.327 (−3.39) *** |
| Large shareholder ownership | 0.009 (2.128) ** | 0.008 (2.091) ** | 0.018 (2.194) ** | 0.021 (2.666) *** |
| Foreign ownership | 0.020 (5.003) *** | 0.020 (4.803) *** | 0.023 (4.145) *** | 0.024 (4.261) *** |
| Adjusted R2 | 0.607 | 0.597 | 0.629 | 0.612 |
| # of obs. | 213 | 213 | 144 | 142 |
| Independent Variables | Dependent Variable: Tobin’s Q | |||
|---|---|---|---|---|
| (1) | (2) | (3) | (4) | |
| Intercept | 4.180 (5.020) *** | 4.306 (5.014) *** | 4.838 (4.615) *** | 4.331 (3.558) *** |
| ESG | 0.012 (3.508) *** | |||
| Environmental | 0.010 (2.903) *** | |||
| Social | 0.009 (1.767) * | |||
| Governance | 0.004 (0.680) | |||
| ESG × Foreigndummy | −0.001 (−0.215) | |||
| Environmental × Foreigndummy | 0.000 (−0.059) | |||
| Social × Foreigndummy | 0.000 (0.033) | |||
| Governance × Foreigndummy | −0.002 (−0.359) | |||
| Leverage | 0.980 (3.794) *** | 1.031 (3.951) *** | 1.111 (3.186) ** | 1.091 (3.085) *** |
| Assetgr | 0.001 (0.391) | 0.001 (0.286) | 0.004 (0.766) | 0.004 (0.791) |
| Profitability | 6.163 (8.226) *** | 6.354 (8.398) *** | 5.573 (5.397) *** | 5.549 (5.390) *** |
| Lnasset | −0.394 (−4.681) *** | −0.401 (−4.562) *** | −0.445 (−4.309) *** | −0.385 (−3.253) *** |
| Lnage | −0.289 (−4.100) *** | −0.295 (−4.143) *** | −0.336 (−3.400) *** | −0.341 (−3.447) *** |
| Large shareholder ownership | 0.005 (1.443) | 0.005 (1.390) | 0.003 (0.609) | 0.007 (1.307) |
| Foreign ownership | 0.021 (4.703) *** | 0.021 (4.680) *** | 0.025 (3.430) *** | 0.027 (3.452) *** |
| Adjusted R2 | 0.601 | 0.591 | 0.614 | 0.594 |
| # of obs. | 213 | 213 | 144 | 142 |
| Independent Variables | Dependent Variable: Tobin’s Q | |||||||
|---|---|---|---|---|---|---|---|---|
| High Large Shareholder Ownership | Low Large Shareholder Ownership | |||||||
| (1) | (2) | (3) | (4) | (5) | (6) | (7) | (8) | |
| Intercept | 0.385 (0.253) | 0.141 (0.091) | 0.529 (0.248) | −2.276 (−1.038) | 6.628 (6.708) *** | 6.658 (6.499) *** | 8.395 (7.760) *** | 8.497 (7.796) *** |
| ESG | 0.004 (0.956) | 0.015 (4.881) *** | ||||||
| Environmental | 0.001 (0.127) | 0.015 (4.471) *** | ||||||
| Social | 0.002 (0.288) | 0.020 (4.103) ** | ||||||
| Governance | −0.007 (−1.027) | 0.017 (2.902) *** | ||||||
| Leverage | 0.943 (1.963) * | 0.965 (1.994) ** | 0.835 (0.985) | 0.331 (0.415) | 0.760 (2.697) *** | 0.766 (2.679) *** | 0.804 (2.482) ** | 1.078 (3.364) *** |
| Assetgr | 0.005 (0.754) | 0.004 (0.528) | 0.009 (0.664) | 0.012 (1.009) | 0.002 (0.604) | 0.002 (0.710) | 0.005 (1.279) | 0.003 (0.712) |
| Profitability | 9.371 (6.421) *** | 9.640 (6.683) *** | 10.010 (4.777) *** | 9.474 (5.065) *** | 4.623 (5.387) *** | 4.563 (5.246) *** | 2.536 (2.515) ** | 2.943 (2.816) *** |
| Lnasset | −0.038 (−0.256) | −0.010 (−0.063) | −0.031 (−0.147) | 0.203 (0.984) | −0.761 (−7.057) *** | −0.752 (−6.812) *** | −1.053 (−8.935) *** | −1.093 (−8.429) *** |
| Lnage | −0.278 (−2.270) ** | −0.284 (−2.302) ** | −0.347 (−1.894) * | −0.374 (−2.145) ** | −0.121 (−1.370) | −0.127 (−1.418) | 0.042 (0.427) | 0.004 (0.037) |
| Large shareholder ownership | 0.014 (1.551) | 0.016 (1.651) | 0.015 (0.986) | 0.040 (3.046) *** | 0.019 (2.619) *** | 0.019 (2.643) *** | 0.021 (2.604) ** | 0.023 (2.593) ** |
| Foreign ownership | 0.010 (1.326) | 0.009 (1.248) | 0.007 (0.660) | 0.012 (1.184) | 0.032 (6.673) *** | 0.031 (6.399) *** | 0.047 (7.961) *** | 0.051 (8.251) *** |
| Adjusted R2 | 0.691 | 0.687 | 0.706 | 0.739 | 0.586 | 0.575 | 0.695 | 0.666 |
| # of obs. | 89 | 89 | 53 | 50 | 124 | 124 | 91 | 92 |
| Independent Variables | Dependent Variable: Tobin’s Q | |||||||
|---|---|---|---|---|---|---|---|---|
| High Foreign Ownership | Low Foreign Ownership | |||||||
| (1) | (2) | (3) | (4) | (5) | (6) | (7) | (8) | |
| Intercept | 3.995 (2.464) ** | 4.018 (2.455) ** | 5.249 (2.082) ** | 6.302 (2.550) ** | 2.102 (1.763) * | 2.329 (1.810) * | 2.835 (1.677) * | 1.267 (0.656) |
| ESG | 0.012 (3.119) *** | 0.010 (2.889) *** | ||||||
| Environmental | 0.012 (2.972) *** | 0.008 (1.972) * | ||||||
| Social | 0.011 (1.538) | 0.010 (1.751) * | ||||||
| Governance | 0.003 (0.340) | 0.003 (0.522) | ||||||
| Leverage | 1.029 (2.031) ** | 1.054 (2.073) ** | 1.085 (1.548) | 1.170 (1.632) | 0.673 (2.087) ** | 0.722 (2.201) ** | 0.542 (1.115) | 0.483 (0.977) |
| Assetgr | 0.007 (1.567) | 0.007 (1.454) | 0.019 (2.338) ** | 0.019 (2.277) ** | −0.002 (−0.663) | −0.002 (−0.669) | −0.006 (−1.018) | −0.006 (−0.985) |
| Profitability | 6.356 (4.930) *** | 6.527 (5.049) *** | 4.432 (2.472) *** | 3.999 (2.201) ** | 5.762 (6.185) *** | 5.906 (6.231) *** | 6.813 (4.836) *** | 6.487 (4.706) *** |
| Lnasset | −0.415 (−2.873) *** | −0.422 (−2.879) *** | −0.536 (−2.594) ** | −0.586 (−2.796) *** | −0.124 (−0.915) | −0.126 (−0.855) | −0.129 (−0.616) | −0.023 (−0.105) |
| Lnage | −0.301 (−2.627) ** | −0.283 (−2.480) ** | −0.358 (−2.158) ** | −0.398 (−2.378) ** | −0.214 (−2.186) ** | −0.246 (−2.491) ** | −0.370 (−2.701) *** | −0.284 (−2.115) ** |
| Large shareholder ownership | 0.015 (2.081) ** | 0.017 (2.351) ** | 0.012 (1.251) | 0.008 (0.868) | 0.001 (0.264) | 0.000 (−0.010) | −0.006 (−0.746) | 0.008 (0.925) |
| Foreign ownership | 0.021 (2.840) * | 0.021 (2.713) * | 0.029 (2.687) *** | 0.029 (2.679) *** | 0.001 (0.046) | −0.002 (−0.147) | 0.003 (0.121) | 0.016 (0.653) |
| Adjusted R2 | 0.674 | 0.671 | 0.687 | 0.677 | 0.379 | 0.354 | 0.426 | 0.397 |
| # of obs. | 98 | 98 | 74 | 74 | 115 | 115 | 70 | 68 |
© 2018 by the authors. Licensee MDPI, Basel, Switzerland. This article is an open access article distributed under the terms and conditions of the Creative Commons Attribution (CC BY) license (http://creativecommons.org/licenses/by/4.0/).
Share and Cite
Kim, W.S.; Park, K.; Lee, S.H. Corporate Social Responsibility, Ownership Structure, and Firm Value: Evidence from Korea. Sustainability 2018, 10, 2497. https://doi.org/10.3390/su10072497
Kim WS, Park K, Lee SH. Corporate Social Responsibility, Ownership Structure, and Firm Value: Evidence from Korea. Sustainability. 2018; 10(7):2497. https://doi.org/10.3390/su10072497
Chicago/Turabian StyleKim, Woo Sung, Kunsu Park, and Sang Hoon Lee. 2018. "Corporate Social Responsibility, Ownership Structure, and Firm Value: Evidence from Korea" Sustainability 10, no. 7: 2497. https://doi.org/10.3390/su10072497
APA StyleKim, W. S., Park, K., & Lee, S. H. (2018). Corporate Social Responsibility, Ownership Structure, and Firm Value: Evidence from Korea. Sustainability, 10(7), 2497. https://doi.org/10.3390/su10072497