A Global Expected Risk Analysis of Fatalities, Injuries, and Damages by Natural Disasters


Abstract
:1. Introduction
2. Literature Review
2.1. Hazards, Disasters, and Risks
2.2. Risk and Risk Assessment Models
3. Methods and Materials
3.1. Expected Risk Model
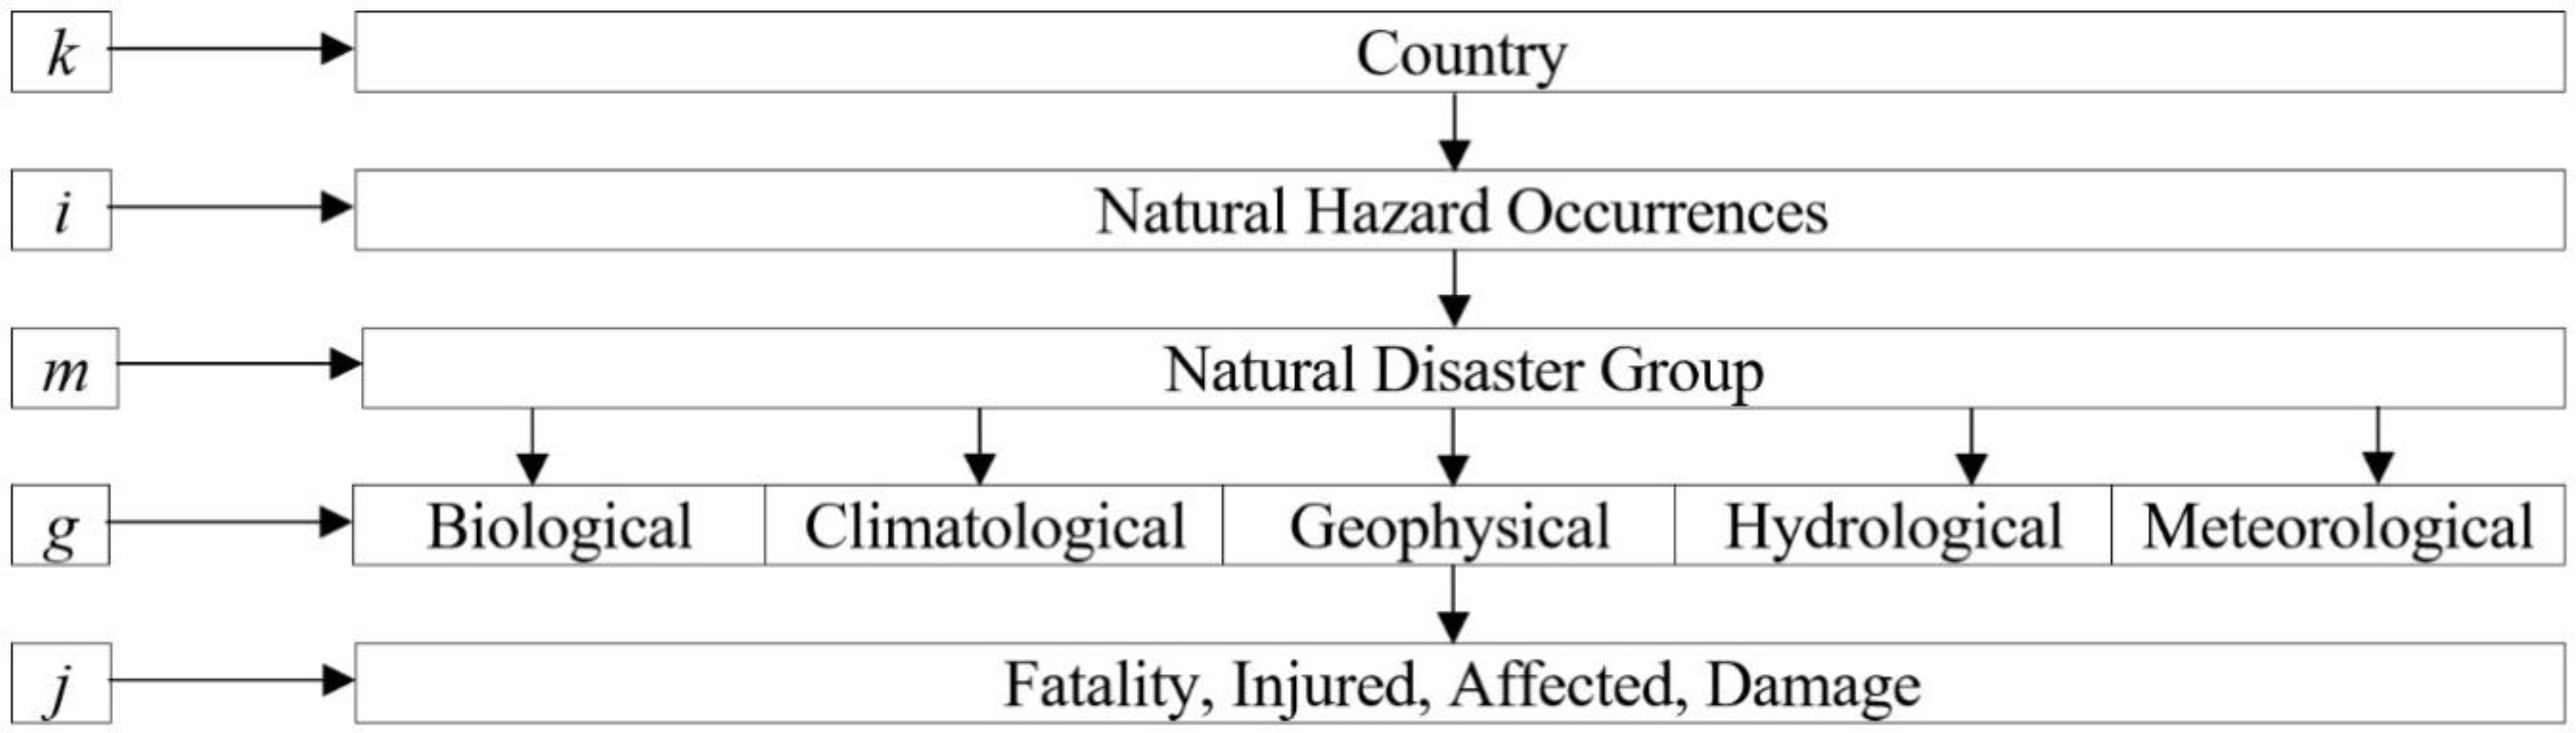
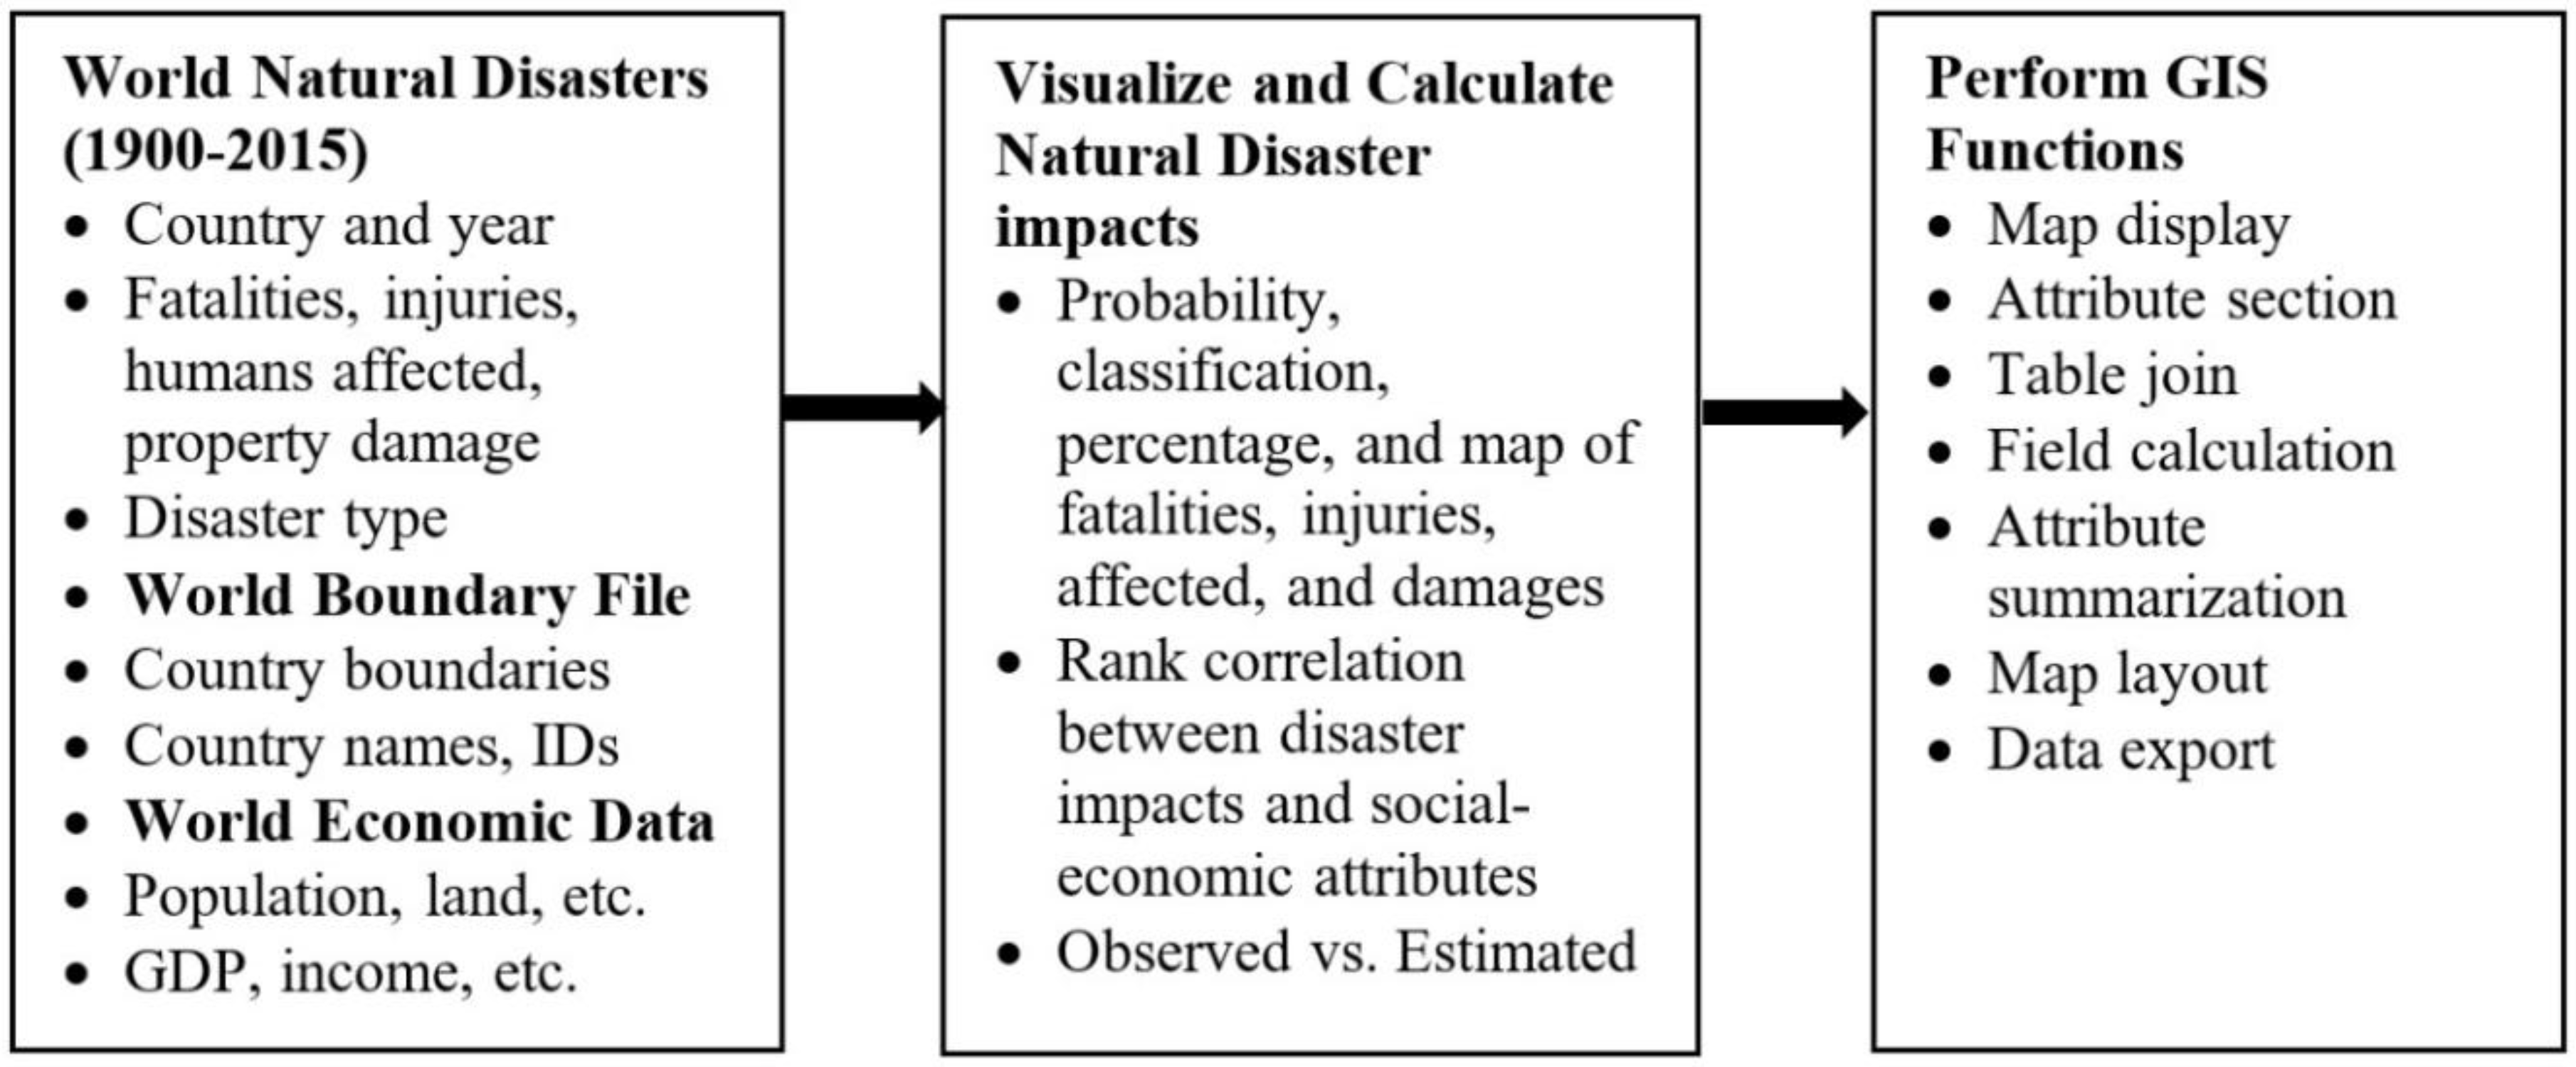
3.2. Data Preparation
4. Results and Discussion
4.1. Fatality
4.2. Injured
4.3. Affected
4.4. Damage
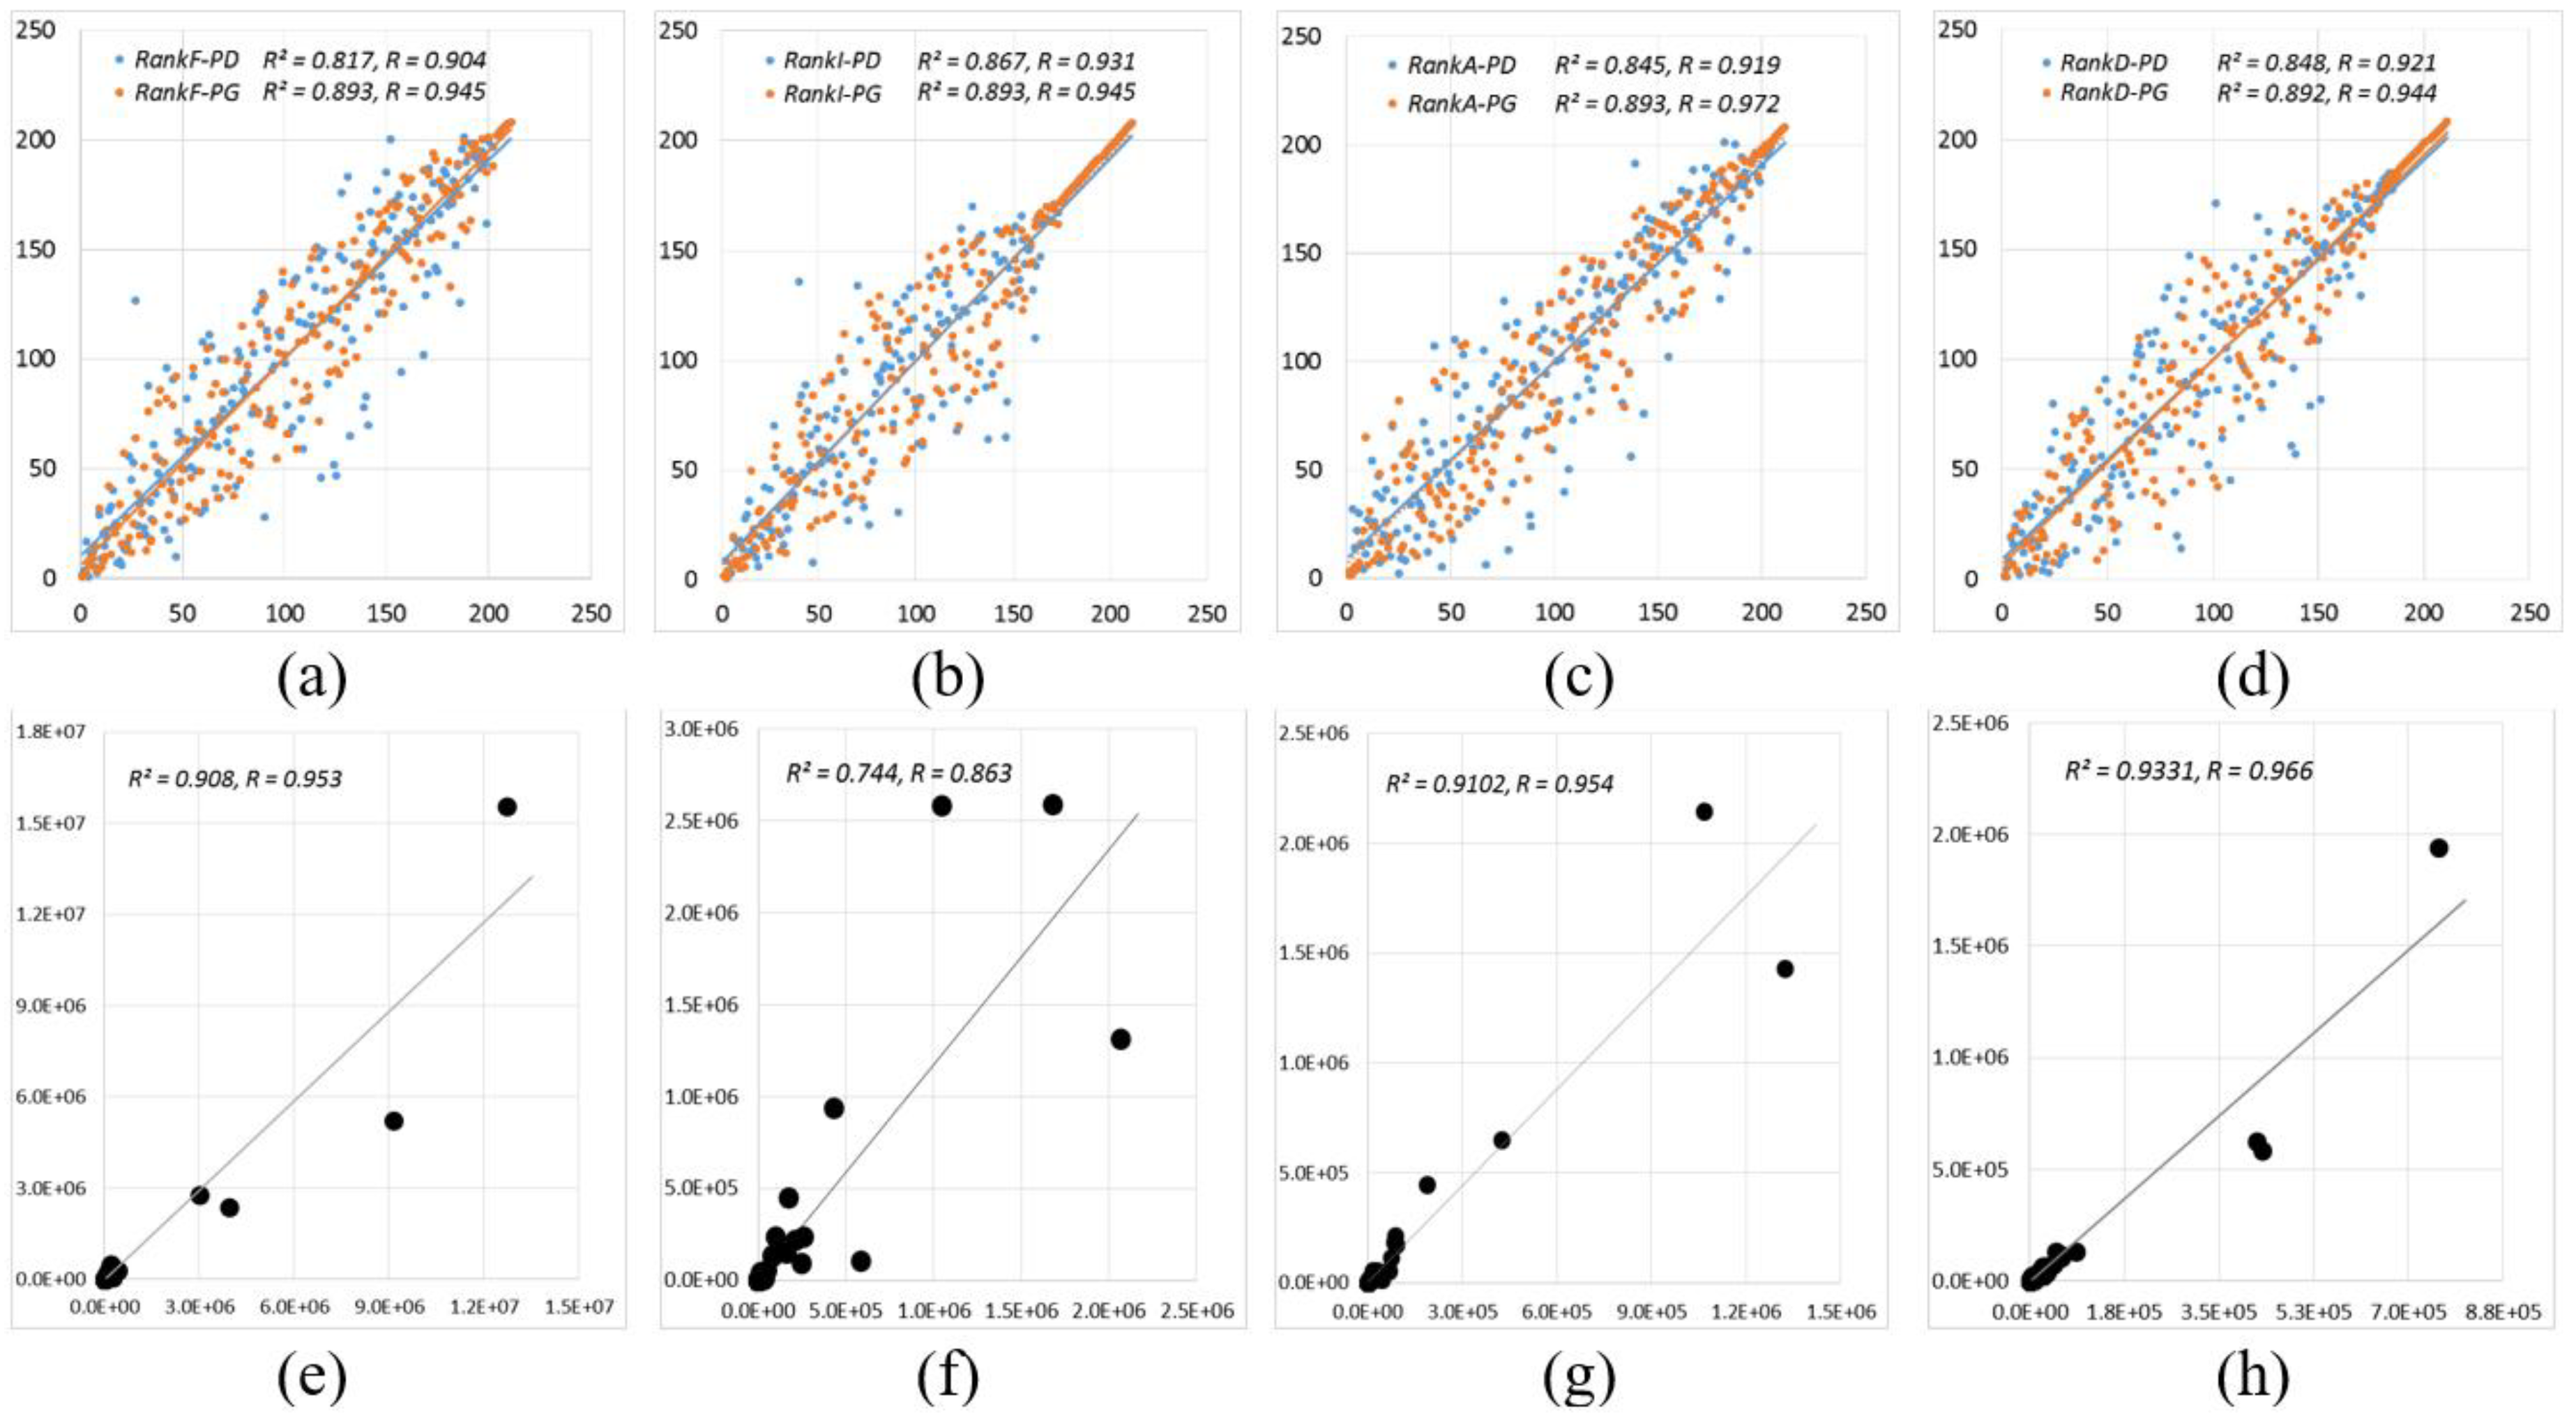
4.5. Model Performance
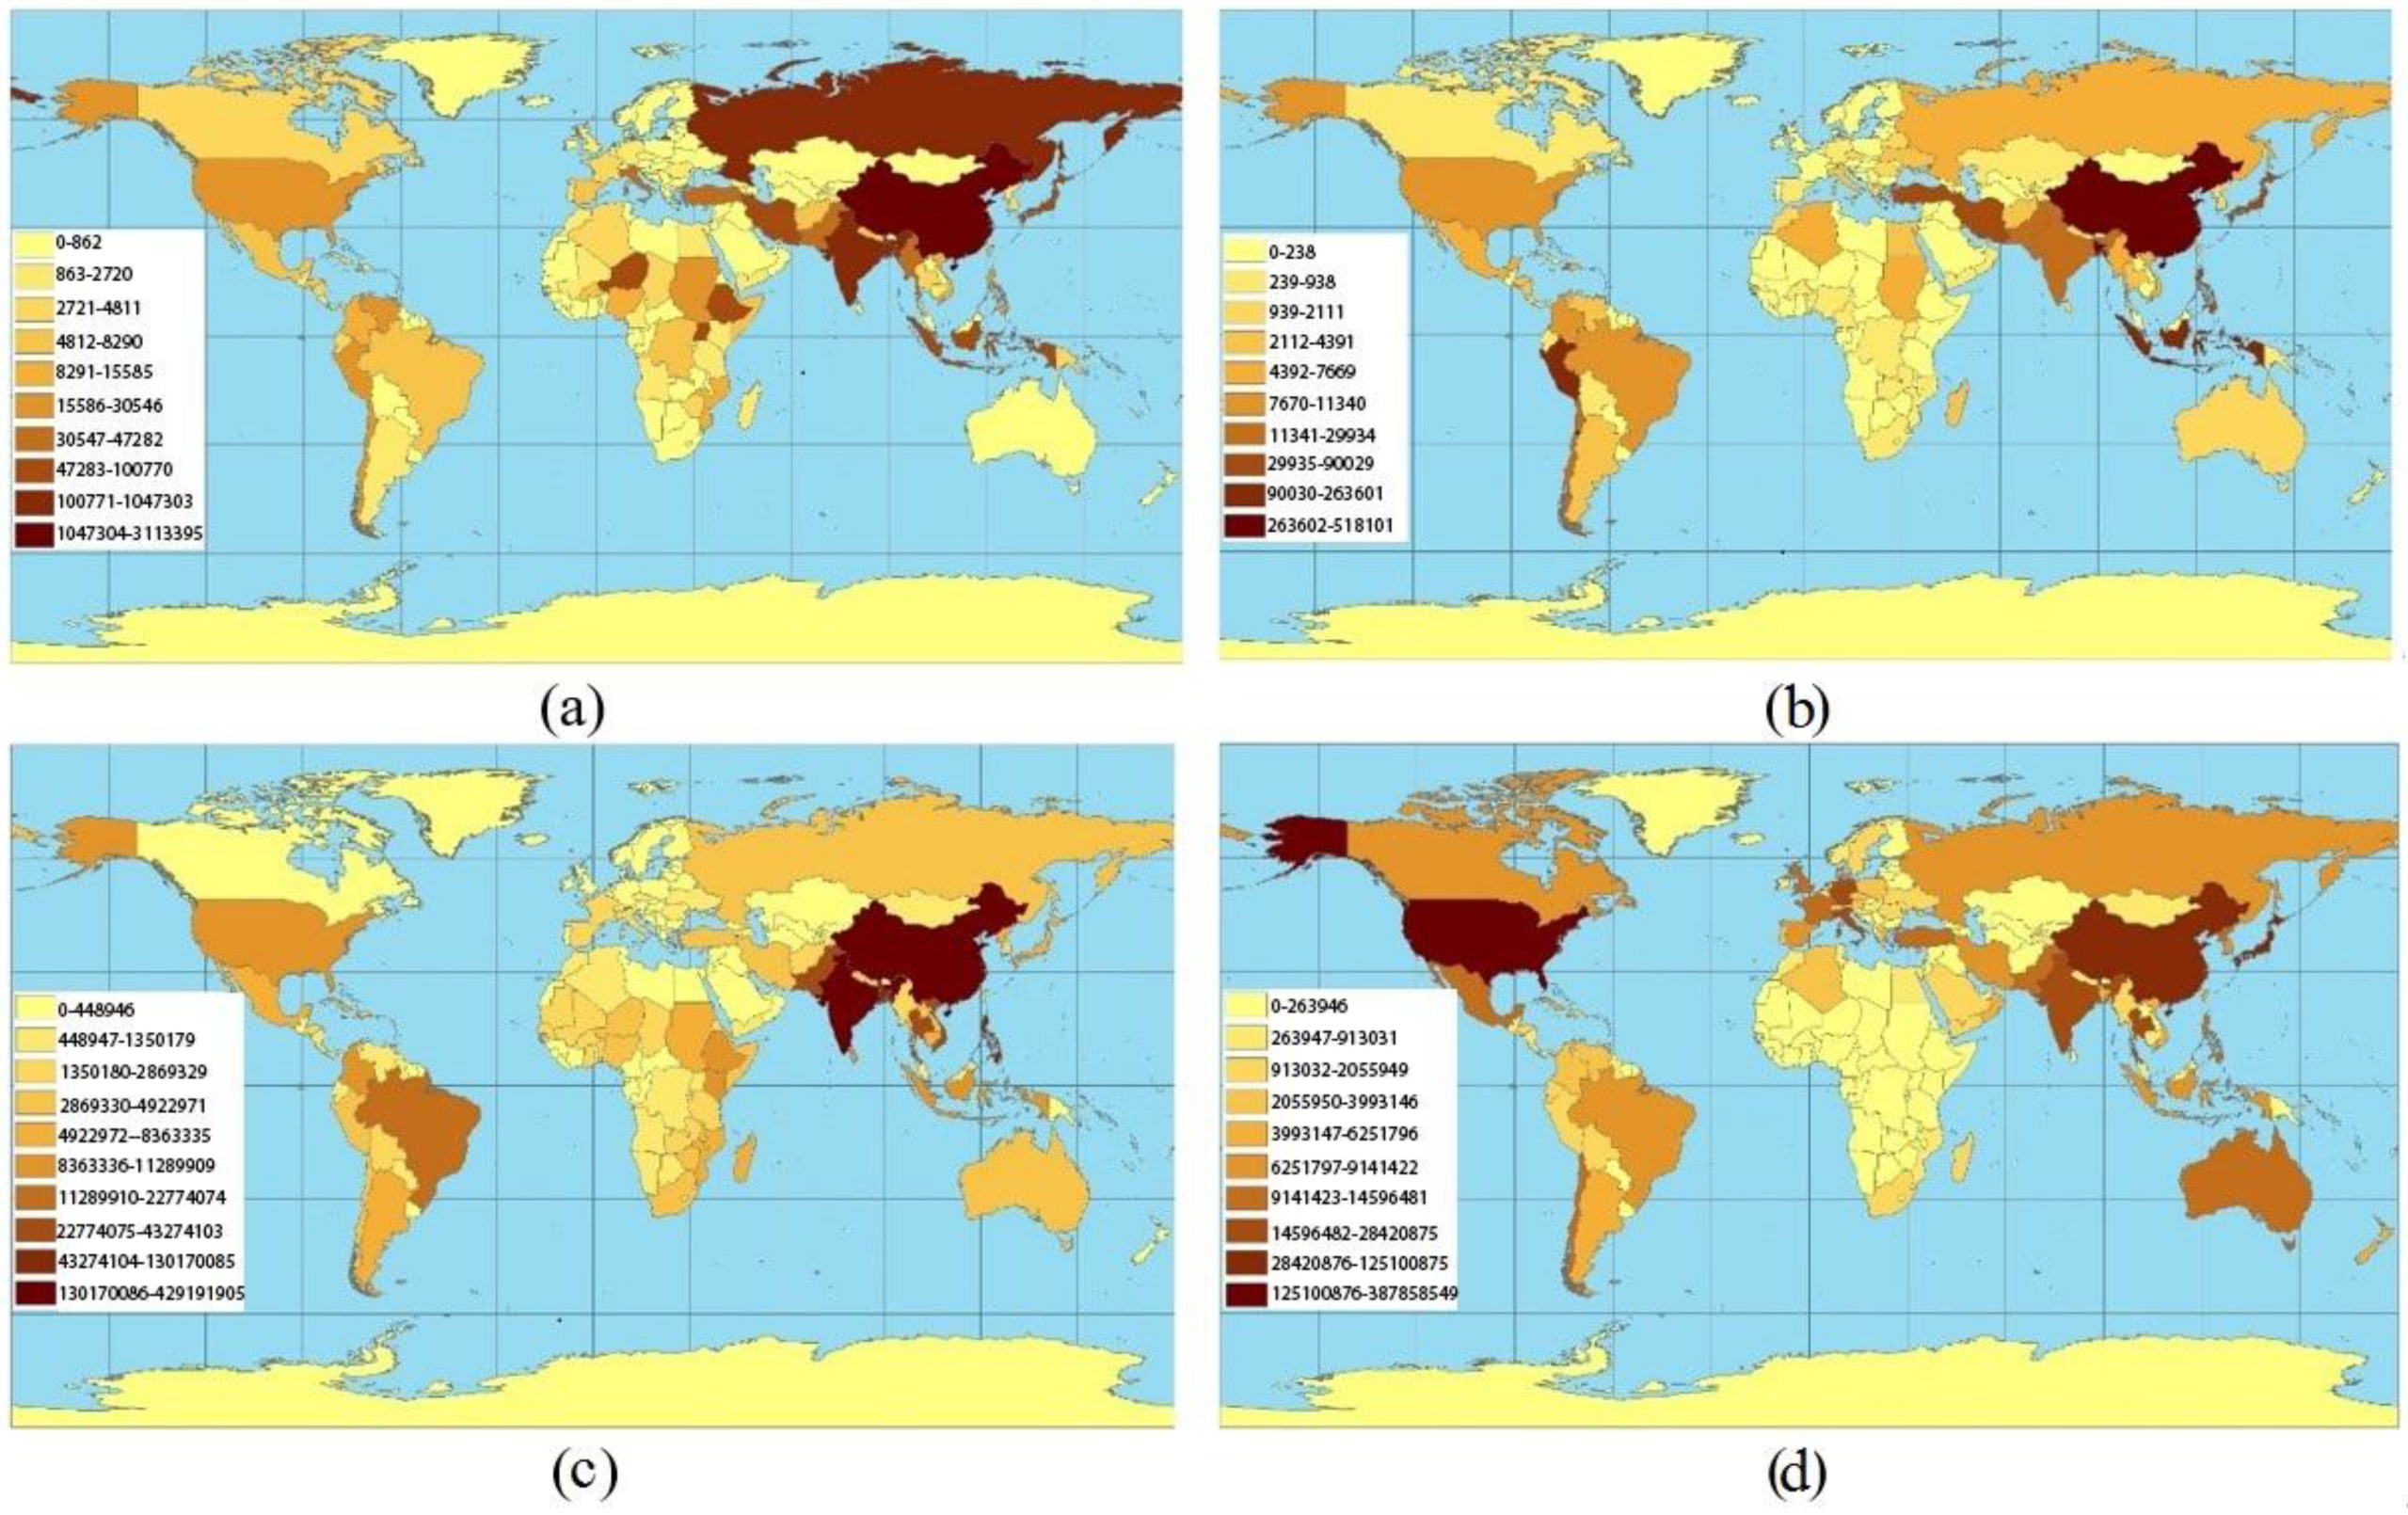
4.6. Natural Disaster Hot-Spots
5. Conclusions and Remarks
Author Contributions
Funding
Conflicts of Interest
References
- Lindell, M.K. Disaster studies. Curr. Sociol. 2013, 61, 797–825. [Google Scholar] [CrossRef]
- Centre for Research on the Epidemiology of Disaster Explanatory. Available online: https://www.emdat.be/Glossary (accessed on 7 March 2018).
- Dewan, A.M. Floods in a Megacity: Geospatial Techniques in Assessing Hazards, Risk and Vulnerability; Springer: Dordrecht, The Netherlands, 2013; pp. 35–62. ISBN 978-94-007-6734-8. [Google Scholar]
- Mayhorn, C.B.; McLaughlin, A.C. Warning the World of Extreme Events: A Global Perspective on Risk Communication for Natural and Technological Disaster. Saf. Sci. 2014, 61, 43–50. [Google Scholar] [CrossRef]
- Centre for Research on the Epidemiology of Disaster Classification. Available online: https://www.emdat.be/classification (accessed on 7 March 2018).
- Cai, Y.; Li, L.; Elahi, E.; Qiu, Y. Selection of Policies on Typhoon and Rainstorm Disasters in China: A Content Analysis Perspective. Sustainability 2018, 10, 387. [Google Scholar] [CrossRef]
- Lee, T.L.; Chen, C.H.; Pai, T.Y.; Wu, R.S. Development of a Meteorological Risk Map for Disaster Mitigation and Management in the Chishan Basin, Taiwan. Sustainability 2015, 7, 962–987. [Google Scholar] [CrossRef] [Green Version]
- Centre for Research on the Epidemiology of Disaster Database. Available online: http://www.emdat.be/database (accessed on 9 March 2018).
- Cutter, S.L.; Barnes, L.; Berry, M.; Burton, C.; Evans, E.; Tate, E.; Webb, J. A place based model for understanding community resilience to natural disasters. Glob. Environ. Chang. 2008, 18, 598–606. [Google Scholar] [CrossRef]
- Deyle, R.E.; French, S.P.; Olshanky, R.B.; Paterson, R.G. Hazard assessment: A factual basis for planning and mitigation. In Cooperating with Nature: Confronting Natural Hazards with Land-Use Planning for Sustainable Communities; Burby, R.J., Ed.; Joseph Henry Press: Washington, DC, USA, 1998; pp. 119–166. ISBN 978-0309063623. [Google Scholar]
- Smith, K. Environmental Hazards—Assessing Risk and Reducing Disaster; Routledge: London, UK, 2013; pp. 71–74. ISBN 978-0415681063. [Google Scholar]
- Cooney, C.M. Managing the Risks of Extreme Weather: IPCC Special Report. Environ. Health Perspect. 2012, 120, a58. [Google Scholar] [CrossRef] [PubMed]
- Murphy, C.; Gardoni, P. The role of society in engineering risk analysis: A capabilities-based approach. Risk Anal. 2006, 26, 1073–1083. [Google Scholar] [CrossRef] [PubMed]
- Greenberg, M.R.; Cox, L.A.; Lowrie, K.; McComas, K.; North, W. Ten most important accomplishments in risk analysis, 1980–2010. Risk Anal. 2012, 32, 771–781. [Google Scholar] [CrossRef] [PubMed]
- White, G.F.; Haas, J.E. Assessment of Research on Natural Hazards; MIT Press: Cambridge, MA, USA, 1975; pp. 16–26. ISBN 978-0262080835. [Google Scholar]
- O’Keefe, P.K.; Westgate, K.; Wisner, B. Taking the naturalness out of natural disasters. Nature 1976, 260, 566–567. [Google Scholar] [CrossRef]
- Wisner, B.; Blaikie, P.; Cannon, T.; Davis, I. At Risk: Natural Hazards, People’s Vulnerability, and Disasters; Routledge: London, UK, 2003; pp. 49–66. ISBN 978-0415252164. [Google Scholar]
- Cutter, S.L. Vulnerability to environmental hazards. Prog. Hum. Geogr. 1996, 20, 529–539. [Google Scholar] [CrossRef]
- Turner, B.L., II; Kasperson, R.E.; Matson, P.A.; McCarthy, J.J.; Corell, R.W.; Christensen, L.; Eckley, N.; Kasperson, J.X.; Luers, A.; Martello, M.L.; et al. A framework for vulnerability analysis in sustainability science. Proc. Natl. Acad. Sci. USA 2003, 100, 8074–8079. [Google Scholar] [CrossRef] [PubMed] [Green Version]
- Shen, G.; Hwang, S.N. Revealing global hot spots of technological disasters: 1900–2013. J. Risk Res. 2016, 21, 361–393. [Google Scholar] [CrossRef]
- Bono, A.D.; Mora, M.G. A global exposure model for disaster risk assessment. Int. J. Disaster Risk Reduct. 2014, 10, 442–451. [Google Scholar] [CrossRef]
- Joseph, J. Measuring vulnerability to natural hazards: A macro framework. Disasters 2013, 37, 185–200. [Google Scholar] [CrossRef] [PubMed]
- Giuliani, G.; Peduzzi, P. The preview global risk data platform: A geoportal to serve and share global data on risk and natural hazards. Nat. Hazards Earth Syst. Sci. 2011, 11, 53–66. [Google Scholar] [CrossRef] [Green Version]
- Peduzzi, P.; Dao, H.; Herold, C.; Mouton, F. Assessing global exposure and vulnerability towards natural hazards: The Disaster risk index. Nat. Hazards Earth Syst. Sci. 2009, 9, 1149–1159. [Google Scholar] [CrossRef]
- Dilley, M.; Chen, R.S.; Deichmann, U.; Lerner-Lam, A.L.; Arnold, M.; Agwe, J.; Buys, P.; Kjevstad, O.; Lyon, B.; Yetman, G. Natural Disaster Hotspots: A Global Risk Analysis; World Bank: Washington, DC, USA, 2005; pp. 19–22. ISBN 978-0-8213-5930-3. [Google Scholar]
- Peduzzi, P.; Herold, C. Mapping disastrous natural hazards using global datasets. Nat. Hazards 2005, 35, 265–289. [Google Scholar] [CrossRef]
- Berke, P.R. Natural-hazard reduction and sustainable development: A global assessment. J. Plan. Lit. 1995, 9, 370–382. [Google Scholar] [CrossRef]
- Liu, B.; Siu, Y.L.; Mitchell, G.; Xu, W. The Danger of Mapping Risk from Multiple Natural Hazards. Sustainability Research Institute (SRI) Papers. Available online: http://www.see.leeds.ac.uk/fileadmin/Documents/research/sri/workingpapers/SRIPs-61.pdf (accessed on 19 March 2018).
- Cox, L.A. Risk Analysis Foundations, Models, and Methods; Springer: New York, NY, USA, 2001; pp. 184–216. ISBN 978-0792376156. [Google Scholar]
- Schmidt, J.; Matcham, I.; Reese, S.; King, A.; Bell, R.; Henderson, R.; Smart, G.; Cousins, J.; Smith, W.; Heron, D. Quantitative Multi-Risk Analysis for Natural Hazards: A Framework for Multi-Risk Modeling. Nat. Hazards 2011, 58, 1169–1192. [Google Scholar] [CrossRef]
- Greenberg, M.R.; Cox, L.A. Risk Analysis Special Virtual Issue: Economics of Risk Analysis. Available online: http://www.sra.org/sites/default/files/journal-images/RISK%20VI%20Economics%20of%20Risk%20Flyer%2064131%20Print%20Ready%20no%20crop%20marks.pdf (accessed on 26 March 2018).
- Masuya, A.; Dewan, A.; Corner, R.J. Population evacuation: Evaluating spatial distribution f flood shelters and vulnerable residential units in Dhaka with geographic information systems. Nat. Hazards 2014, 78, 1859–1882. [Google Scholar] [CrossRef]
- Sohn, J.; Kim, T.J.; Hewings, J.D.; Lee, S.J. Retrofit priority of transportation network links under an earthquake. J. Urban Plan. Dev. 2003, 129, 195–210. [Google Scholar] [CrossRef]
- Shen, G.; Aydin, S.G. Highway freight transportation disruptions under an extreme environmental event: The case of Hurricane Katrina. Int. J. Environ. Sci. Technol. 2014, 11, 2387–2402. [Google Scholar] [CrossRef]
- FAO-UN. Global Administrative Unit Layers, the United Nations. Available online: http://www.fao.org/geonetwork/srv/en/metadata.show?id=12691 (accessed on 9 March 2018).
- World Bank. World Development Indicators. Available online: https://datacatalog.worldbank.org/dataset/world-development-indicators (accessed on 16 March 2018).[Green Version]
- Donner, W.; Rodriguez, H. Population Composition, Migration, and Inequality: The Influence of Demographic Changes on Disaster Risk and Vulnerability. Soc. Forces 2008, 87, 1089–1114. [Google Scholar] [CrossRef]
- Neumayer, E.; Barthel, F. Normalizing Economic Loss from Natural Disasters: A Global Analysis. Available online: http://citeseerx.ist.psu.edu/viewdoc/download?doi=10.1.1.826.675&rep=rep1&type=pdf (accessed on 1 March 2018).
- Munich, R.E. Natural Catastrophe Statistics Online—The New NatCatSERVICE Analysis Tool. Available online: https://www.munichre.com/en/reinsurance/business/non-life/natcatservice/index.html (accessed on 2 March 2018).
- Gregorowski, R.; MacDonald, D.; Flatters, G.; Spaven, P.; Pulgar, D.; Vogel, I.; Barr, J. Evaluation of PreventionWeb and Related UNISDR Information Services for Disaster Risk Reduction, Final Report. Available online: https://www.unisdr.org/who-we-are/evaluations/pweval2012 (accessed on 3 March 2018).


| Hazard | Classification | Definition | Disaster Type |
| Natural Hazard Types | Geophysical | A hazard originating from solid earth. This term is used interchangeably with the term geological hazard. | Earthquake, mass movement, volcanic activity |
| Meteorological | A hazard caused by short-lived, micro- to meso-scale extreme weather and atmospheric conditions that last from minutes to days. | Extreme temperature, fog, storm | |
| Hydrological | A hazard caused by the occurrence, movement, and distribution of surface and subsurface freshwater and saltwater. | Flood, landslide, wave action | |
| Climatological | A hazard caused by long-lived, meso- to macro-scale atmospheric processes ranging from intra-seasonal to multi-decadal climate variability. | Drought, extreme temperature, glacial lake outburst, wildfire | |
| Biological | A hazard caused by the exposure to living organisms and their toxic substances (e.g., venom, mold), or vector-borne diseases that they may carry. Examples are venomous wildlife and insects, poisonous plants, and mosquitoes carrying disease-causing agents such as parasites, bacteria, or viruses (e.g., malaria). | Epidemic, insect infestation, animal accident | |
| Term | Definition | ||
| Fatality | Number of people who lost their life because of natural hazards | ||
| Injured | People suffering from physical injuries, trauma or an illness requiring medical treatment as a direct consequence of a disaster. | ||
| Affected | Sum of injured, homeless (number of people whose house is destroyed or heavily damaged and therefore need shelter after an event), and affected (people requiring immediate assistance during a period of emergency). | ||
| Damage | The amount of damage to property, crops, and livestock. In the Emergency Disaster Database (EM-DAT) estimated damages are given in US$ (‘000). For individual disaster, the registered figure corresponds to the damage value at the moment of the event. | ||
| Country/Region | RankkF | RkF | σkF | EkF | Low-RkF | High-RkF | CVkF | RkF-PD | RankkF-PD | RkF-PG | RankkF-PG | Observed | Estimated |
|---|---|---|---|---|---|---|---|---|---|---|---|---|---|
| China | 1 | 3,113,395 | 2,680,811 | 49.49% | 0 | 8,475,017 | 0.86 | 22,740 | 2 | 622.7 | 1 | 12,720,326 | 15,566,976 |
| India | 2 | 1,047,303 | 1,838,984 | 16.65% | 0 | 4,725,272 | 1.76 | 3143 | 4 | 361.1 | 2 | 9,124,242 | 5,236,517 |
| Bangladesh | 3 | 554,033 | 575,905 | 8.81% | 0 | 1,705,843 | 1.04 | 541 | 17 | 291.6 | 3 | 2,992,580 | 2,770,164 |
| Russia | 4 | 476,958 | 741,707 | 7.58% | 0 | 1,960,373 | 1.56 | 56,995 | 1 | 53.6 | 7 | 3,930,026 | 2,384,792 |
| Uganda | 5 | 100,770 | 72,455 | 1.60% | 0 | 245,680 | 0.72 | 844 | 11 | 72.0 | 6 | 204,697 | 503,848 |
| Indonesia | 6 | 87,188 | 83,017 | 1.39% | 0 | 253,223 | 0.95 | 682 | 12 | 27.2 | 9 | 241,331 | 435,941 |
| Iran | 7 | 79,754 | 51,134 | 1.27% | 0 | 182,023 | 0.64 | 1913 | 5 | 11.4 | 15 | 156,242 | 398,769 |
| Niger | 8 | 75,676 | 46,397 | 1.20% | 0 | 168,470 | 0.61 | 7655 | 3 | 94.6 | 4 | 194,964 | 378,378 |
| Japan | 9 | 66,685 | 73,507 | 1.06% | 0 | 213,699 | 1.10 | 198 | 29 | 2.4 | 32 | 244,348 | 333,425 |
| Ethiopia | 10 | 63,167 | 131,607 | 1.00% | 0 | 326,381 | 2.08 | 952 | 9 | 90.2 | 5 | 416,201 | 315,835 |
| Cape Verde Is | 11 | 47,282 | 28,158 | 0.75% | 0 | 103,598 | 0.60 | 453 | 21 | 33.8 | 8 | 85,286 | 236,409 |
| Burma | 12 | 45,134 | 55,569 | 0.72% | 0 | 156,271 | 1.23 | 646 | 15 | 25.1 | 10 | 146,128 | 225,669 |
| Turkey | 13 | 44,518 | 31,945 | 0.71% | 0 | 108,407 | 0.72 | 494 | 19 | 6.6 | 22 | 92,106 | 222,589 |
| Italy | 14 | 37,511 | 44,907 | 0.60% | 0 | 127,325 | 1.20 | 194 | 31 | 1.4 | 42 | 140,517 | 187,554 |
| Pakistan | 15 | 34,597 | 49,036 | 0.55% | 0 | 132,669 | 1.42 | 168 | 33 | 16.5 | 11 | 174,187 | 172,983 |
| Philippines | 16 | 30,546 | 16,858 | 0.49% | 0 | 64,262 | 0.55 | 102 | 40 | 6.6 | 23 | 69,809 | 152,729 |
| Guatemala | 17 | 27,382 | 22,067 | 0.44% | 0 | 71,517 | 0.81 | 243 | 25 | 6.7 | 21 | 84,048 | 136,910 |
| Peru | 18 | 26,659 | 28,105 | 0.42% | 0 | 82,869 | 1.05 | 1211 | 7 | 5.2 | 24 | 96,019 | 133,293 |
| Chile | 19 | 22,212 | 22,884 | 0.35% | 0 | 67,980 | 1.03 | 1042 | 8 | 2.2 | 34 | 61,219 | 111,059 |
| Sudan | 20 | 21,440 | 43,768 | 0.34% | 0 | 108,975 | 2.04 | 1303 | 6 | 11.3 | 16 | 162,688 | 107,198 |
| United States | 21 | 20,748 | 9276 | 0.33% | 2195 | 39,300 | 0.45 | 670 | 14 | 0.5 | 57 | 43,625 | 103,738 |
| Venezuela | 22 | 19,125 | 9101 | 0.30% | 923 | 37,327 | 0.48 | 678 | 13 | 4.0 | 28 | 31,284 | 95,624 |
| Mozambique | 23 | 15,585 | 32,115 | 0.25% | 0 | 79,816 | 2.06 | 635 | 16 | 13.0 | 14 | 105,985 | 77,926 |
| Haiti | 24 | 12,428 | 30,907 | 0.20% | 0 | 74,242 | 2.49 | 42 | 56 | 7.8 | 19 | 249,111 | 62,142 |
| Nigeria | 25 | 12,147 | 7951 | 0.19% | 0 | 28,050 | 0.65 | 85 | 45 | 13.5 | 12 | 24,388 | 60,737 |
| Vietnam | 26 | 11,921 | 7140 | 0.19% | 0 | 26,202 | 0.60 | 47 | 53 | 4.8 | 25 | 26,153 | 59,605 |
| Hong Kong (China) | 27 | 11,112 | 8680 | 0.18% | 0 | 28,471 | 0.78 | 2 | 127 | 0.4 | 64 | 24,575 | 55,558 |
| Colombia | 28 | 10,435 | 9997 | 0.17% | 0 | 30,428 | 0.96 | 273 | 24 | 1.7 | 39 | 33,564 | 52,173 |
| Burkina Faso | 29 | 8290 | 6149 | 0.13% | 0 | 20,589 | 0.74 | 163 | 34 | 7.5 | 20 | 17,248 | 41,449 |
| Honduras | 30 | 8125 | 9442 | 0.13% | 0 | 27,009 | 1.16 | 124 | 36 | 3.1 | 30 | 28,486 | 40,623 |
| Country/Region | RankkI | RkI | σkI | EkI | Low-RkI | High-RkI | CVkI | RkI-PD | RankkI-PD | RkI-PG | RankkF-PG | Observed | Estimated |
|---|---|---|---|---|---|---|---|---|---|---|---|---|---|
| China | 1 | 518,101 | 400,317 | 25.80% | 0 | 1,318,735 | 0.77 | 3784 | 2 | 103.6 | 2 | 1,677,310 | 2,590,505 |
| Bangladesh | 2 | 516,754 | 327,202 | 25.73% | 0 | 1,171,159 | 0.63 | 505 | 9 | 272.0 | 1 | 1,044,207 | 2,583,772 |
| Peru | 3 | 263,601 | 552,615 | 13.13% | 0 | 1,368,832 | 2.10 | 11,970 | 1 | 51.7 | 4 | 2,064,125 | 1,318,006 |
| Indonesia | 4 | 188,347 | 114,107 | 9.38% | 0 | 416,561 | 0.61 | 1473 | 4 | 58.9 | 3 | 431,603 | 941,737 |
| Iran | 5 | 90,029 | 59,743 | 4.48% | 0 | 209,515 | 0.66 | 2160 | 3 | 12.9 | 7 | 173,400 | 450,147 |
| Japan | 6 | 48,083 | 59,790 | 2.39% | 0 | 167,664 | 1.24 | 143 | 19 | 1.7 | 20 | 255,298 | 240,417 |
| Turkey | 7 | 47,923 | 34,743 | 2.39% | 0 | 117,408 | 0.72 | 531 | 7 | 7.2 | 9 | 98,352 | 239,614 |
| Philippines | 8 | 44,435 | 32,195 | 2.21% | 0 | 108,825 | 0.72 | 149 | 17 | 9.7 | 8 | 209,289 | 222,176 |
| Pakistan | 9 | 29,934 | 50,336 | 1.49% | 0 | 130,606 | 1.68 | 145 | 18 | 14.3 | 5 | 159,919 | 149,670 |
| Chile | 10 | 28,152 | 29,362 | 1.40% | 0 | 86,877 | 1.04 | 1321 | 5 | 2.8 | 16 | 77,400 | 140,761 |
| Guatemala | 11 | 26,052 | 29,807 | 1.30% | 0 | 85,665 | 1.14 | 231 | 14 | 6.4 | 10 | 78,486 | 130,259 |
| Haiti | 12 | 21,177 | 70,858 | 1.05% | 0 | 162,893 | 3.35 | 71 | 28 | 13.2 | 6 | 582,590 | 105,884 |
| India | 13 | 18,322 | 46,370 | 0.91% | 0 | 111,062 | 2.53 | 55 | 30 | 6.3 | 11 | 244,895 | 91,612 |
| El Salvador | 14 | 11,340 | 12,605 | 0.56% | 0 | 36,550 | 1.11 | 35 | 36 | 2.4 | 18 | 47,304 | 56,701 |
| United States | 15 | 9436 | 4869 | 0.47% | 0 | 19,174 | 0.52 | 305 | 13 | 0.2 | 50 | 27,847 | 47,181 |
| Brazil | 16 | 9010 | 3350 | 0.45% | 2309 | 15,711 | 0.37 | 408 | 12 | 1.2 | 23 | 15,100 | 45,050 |
| Colombia | 17 | 8384 | 6653 | 0.42% | 0 | 21,690 | 0.79 | 219 | 15 | 1.3 | 21 | 24,118 | 41,921 |
| Sudan | 18 | 7669 | 7275 | 0.38% | 0 | 22,219 | 0.95 | 466 | 10 | 4.0 | 14 | 19,216 | 38,347 |
| Russia | 19 | 6969 | 6929 | 0.35% | 0 | 20,828 | 0.99 | 833 | 6 | 0.8 | 31 | 29,437 | 34,846 |
| Mexico | 20 | 6818 | 11,707 | 0.34% | 0 | 30,232 | 1.72 | 125 | 20 | 0.8 | 32 | 36,684 | 34,088 |
| Macedonia FRY | 21 | 6812 | 6075 | 0.34% | 0 | 18,962 | 0.89 | 84 | 26 | 1.0 | 25 | 20,062 | 34,058 |
| Vietnam | 22 | 6627 | 4356 | 0.33% | 0 | 15,339 | 0.66 | 26 | 42 | 2.7 | 17 | 13,702 | 33,134 |
| Burma | 23 | 6377 | 7791 | 0.32% | 0 | 21,959 | 1.22 | 91 | 24 | 3.5 | 15 | 20,762 | 31,887 |
| Algeria | 24 | 5711 | 7608 | 0.28% | 0 | 20,928 | 1.33 | 413 | 11 | 1.0 | 26 | 21,615 | 28,557 |
| Dominican Rep | 25 | 4988 | 4094 | 0.25% | 0 | 13,176 | 0.82 | 26 | 41 | 0.8 | 29 | 11,316 | 24,940 |
| Nicaragua | 26 | 4391 | 7496 | 0.22% | 0 | 19,384 | 1.71 | 102 | 22 | 1.9 | 19 | 21,467 | 21,957 |
| Taiwan (China) | 27 | 4022 | 4176 | 0.20% | 0 | 12,373 | 1.04 | 6 | 70 | 0.2 | 56 | 20,404 | 20,109 |
| Italy | 28 | 3858 | 4916 | 0.19% | 0 | 13,689 | 1.27 | 20 | 51 | 0.1 | 61 | 13,428 | 19,288 |
| Honduras | 29 | 3263 | 4565 | 0.16% | 0 | 12,393 | 1.40 | 50 | 32 | 1.3 | 22 | 12,217 | 16,313 |
| Madagascar | 30 | 3237 | 1042 | 0.16% | 1153 | 5322 | 0.32 | 102 | 21 | 4.0 | 13 | 5050 | 16,186 |
| Country/Region | RankkA | RkA | σkA | EkA | Low-RkA | High-RkA | CVkA | RkA-PD | RankkA-PD | RkA-PG | RankkA-PG | Observed | Estimated |
|---|---|---|---|---|---|---|---|---|---|---|---|---|---|
| India | 1 | 429,191,905 | 303,911,868 | 32.11% | 0 | 1,037,015,641 | 0.71 | 1,288,177 | 3 | 147,997 | 1 | 1,066,532 | 2,145,960 |
| China | 2 | 286,388,736 | 245,383,239 | 21.43% | 0 | 777,155,213 | 0.86 | 2,091,717 | 1 | 57,278 | 3 | 1,321,453 | 1,431,944 |
| Bangladesh | 3 | 130,170,085 | 123,868,560 | 9.74% | 0 | 377,907,205 | 0.95 | 127,197 | 32 | 68,511 | 2 | 423,956 | 650,850 |
| Philippines | 4 | 89,426,690 | 48,834,676 | 6.69% | 0 | 187,096,043 | 0.55 | 299,859 | 14 | 19,441 | 5 | 186,737 | 447,133 |
| Pakistan | 5 | 43,274,103 | 25,104,141 | 3.24% | 0 | 93,482,385 | 0.58 | 209,825 | 22 | 20,607 | 4 | 86,670 | 216,371 |
| Vietnam | 6 | 36,607,540 | 20,594,716 | 2.74% | 0 | 77,796,971 | 0.56 | 142,938 | 30 | 14,643 | 7 | 84,807 | 183,038 |
| Thailand | 7 | 35,345,770 | 19,738,520 | 2.64% | 0 | 74,822,810 | 0.56 | 281,097 | 15 | 4776 | 16 | 90,770 | 176,729 |
| Brazil | 8 | 22,774,074 | 16,452,819 | 1.70% | 0 | 55,679,712 | 0.72 | 1,030,699 | 4 | 2997 | 22 | 73,371 | 113,870 |
| United States | 9 | 11,289,909 | 5,981,071 | 0.84% | 0 | 23,252,052 | 0.53 | 364,349 | 11 | 299 | 65 | 27,612 | 56,450 |
| Ethiopia | 10 | 11,065,843 | 21,900,304 | 0.83% | 0 | 54,866,452 | 1.98 | 166,795 | 27 | 15,808 | 6 | 69,587 | 55,329 |
| Colombia | 11 | 10,592,747 | 4,124,418 | 0.83% | 2,343,911 | 18,841,584 | 0.39 | 276,746 | 16 | 1681 | 31 | 16,970 | 52,964 |
| Sri Lanka | 12 | 10,381,781 | 4,355,256 | 0.83% | 1,671,270 | 19,092,292 | 0.42 | 33,683 | 54 | 2806 | 24 | 25,199 | 51,909 |
| Kenya | 13 | 10,056,923 | 15,231,044 | 0.83% | 0 | 40,519,011 | 1.51 | 168,828 | 26 | 10,057 | 8 | 57,054 | 50,285 |
| Indonesia | 14 | 9,015,883 | 5,540,515 | 0.83% | 0 | 20,096,914 | 0.61 | 70,504 | 39 | 2817 | 23 | 28,803 | 45,079 |
| Korea (North) | 15 | 8,363,335 | 3,476,049 | 0.83% | 1,411,237 | 15,315,432 | 0.42 | 43,617 | 47 | 6433 | 11 | 16,074 | 41,817 |
| Argentina | 16 | 7,656,822 | 4,802,257 | 0.83% | 0 | 17,261,337 | 0.63 | 530,677 | 7 | 684 | 48 | 14,745 | 38,284 |
| Cambodia | 17 | 7,462,102 | 4,992,182 | 0.83% | 0 | 17,446,467 | 0.67 | 97,320 | 37 | 3927 | 17 | 19,891 | 37,311 |
| Madagascar | 18 | 7,244,752 | 2,430,940 | 0.83% | 2,382,872 | 12,106,632 | 0.34 | 228,709 | 20 | 9056 | 9 | 13,271 | 36,224 |
| Cuba | 19 | 6,709,627 | 4,048,723 | 0.83% | 0 | 14,807,073 | 0.60 | 65,347 | 41 | 2314 | 26 | 13,745 | 33,548 |
| Mozambique | 20 | 6,486,178 | 6,858,975 | 0.83% | 0 | 20,204,128 | 1.06 | 264,103 | 17 | 5405 | 14 | 31,100 | 32,431 |
| Sudan | 21 | 6,360,185 | 9,367,367 | 0.83% | 0 | 25,094,919 | 1.47 | 386,489 | 10 | 3347 | 19 | 38,508 | 31,801 |
| Japan | 22 | 6,056,199 | 3,977,189 | 0.83% | 0 | 14,010,577 | 0.66 | 17,952 | 70 | 215 | 71 | 18,864 | 30,281 |
| Mexico | 23 | 5,554,300 | 3,915,270 | 0.83% | 0 | 13,384,840 | 0.70 | 101,965 | 36 | 617 | 51 | 18,766 | 27,771 |
| Peru | 24 | 4,922,971 | 3,551,513 | 0.83% | 0 | 12,025,997 | 0.72 | 223,552 | 21 | 965 | 45 | 18,743 | 24,615 |
| Australia | 25 | 4,558,311 | 4,563,992 | 0.83% | 0 | 13,686,296 | 1.00 | 1,729,121 | 2 | 157 | 82 | 16,137 | 22,792 |
| Niger | 26 | 4,519,191 | 8,097,829 | 0.83% | 0 | 20,714,848 | 1.79 | 457,147 | 9 | 5649 | 13 | 25,377 | 22,596 |
| Nigeria | 27 | 4,474,124 | 3,906,089 | 0.83% | 0 | 12,286,302 | 0.87 | 31,344 | 57 | 4971 | 15 | 13,534 | 22,371 |
| Russia | 28 | 4,105,732 | 5,043,289 | 0.83% | 0 | 14,192,310 | 1.23 | 490,618 | 8 | 461 | 57 | 30,087 | 20,529 |
| Chile | 29 | 3,963,895 | 3,622,404 | 0.83% | 0 | 11,208,703 | 0.91 | 185,969 | 23 | 400 | 59 | 11,561 | 19,819 |
| Turkey | 30 | 3,942,522 | 2,532,515 | 0.83% | 0 | 9,007,552 | 0.64 | 43,705 | 46 | 588 | 52 | 8847 | 19,713 |
| Country/Region | RankkD | RkD | σkD | EkD | Low-RkD | High-RkD | CVkD | RkD-PD | RankkD-PD | RkD-PG | RankkD-PG | Observed | Estimated |
|---|---|---|---|---|---|---|---|---|---|---|---|---|---|
| United States | 1 | 387,858,549 | 174,002,830 | 37.63% | 39,852,888 | 735,864,210 | 0.45 | 12,517,008 | 1 | 10,261 | 2 | 755,581 | 1,939,293 |
| China | 2 | 125,100,675 | 90,084,817 | 12.14% | 0 | 305,270,310 | 0.72 | 913,706 | 5 | 25,020 | 1 | 419,431 | 625,503 |
| Japan | 3 | 116,493,701 | 135,054,963 | 11.30% | 0 | 386,603,626 | 1.16 | 345,317 | 9 | 4131 | 6 | 429,770 | 582,469 |
| Italy | 4 | 26,420,875 | 21,295,576 | 2.56% | 0 | 69,012,028 | 0.81 | 136,905 | 19 | 990 | 20 | 86,385 | 132,104 |
| Thailand | 5 | 26,285,526 | 14,682,585 | 2.55% | 0 | 55,650,696 | 0.56 | 209,043 | 16 | 3552 | 7 | 47,716 | 131,428 |
| Germany | 6 | 23,262,180 | 13,908,240 | 2.26% | 0 | 51,078,660 | 0.60 | 100,763 | 24 | 843 | 22 | 58,091 | 116,311 |
| India | 7 | 21,437,918 | 14,447,192 | 2.08% | 0 | 50,332,303 | 0.67 | 64,344 | 30 | 7392 | 4 | 57,994 | 107,190 |
| Australia | 8 | 14,596,461 | 9,458,874 | 1.42% | 0 | 33,514,209 | 0.65 | 5,536,930 | 2 | 503 | 30 | 45,064 | 72,982 |
| France | 9 | 13,993,522 | 10,414,923 | 1.36% | 0 | 34,823,367 | 0.74 | 125,745 | 21 | 507 | 28 | 39,637 | 69,968 |
| Mexico | 10 | 13,574,913 | 11,048,321 | 1.32% | 0 | 35,671,555 | 0.81 | 249,207 | 12 | 1508 | 16 | 41,090 | 67,875 |
| United Kingdom | 11 | 13,457,758 | 8,857,592 | 1.31% | 0 | 31,172,942 | 0.66 | 54,360 | 34 | 486 | 31 | 32,816 | 67,289 |
| Chile | 12 | 13,341,040 | 13,347,342 | 1.29% | 0 | 40,035,723 | 1.00 | 625,906 | 6 | 1348 | 17 | 37,627 | 66,705 |
| Korea (North) | 13 | 12,924,814 | 5,371,395 | 1.25% | 2,182,023 | 23,667,604 | 0.42 | 67,406 | 29 | 9942 | 3 | 23,653 | 64,624 |
| Turkey | 14 | 12,828,689 | 8,850,369 | 1.24% | 0 | 30,529,427 | 0.69 | 142,214 | 18 | 1915 | 14 | 26,910 | 64,143 |
| Pakistan | 15 | 11,630,543 | 6,580,797 | 1.13% | 0 | 24,792,138 | 0.57 | 56,394 | 33 | 5538 | 5 | 26,278 | 58,153 |
| Philippines | 16 | 11,387,888 | 6,219,309 | 1.10% | 0 | 23,826,507 | 0.55 | 38,185 | 39 | 2476 | 10 | 22,984 | 56,939 |
| Iran | 17 | 9,141,422 | 5,037,113 | 0.89% | 0 | 19,215,648 | 0.55 | 219,325 | 15 | 1306 | 18 | 22,765 | 45,707 |
| Spain | 18 | 8,964,725 | 6,924,680 | 0.87% | 0 | 22,814,085 | 0.77 | 112,017 | 22 | 407 | 37 | 28,395 | 44,824 |
| Russia | 19 | 8,066,475 | 7,311,598 | 0.78% | 0 | 22,689,670 | 0.91 | 963,911 | 4 | 906 | 21 | 31,860 | 40,332 |
| Brazil | 20 | 7,856,861 | 4,389,833 | 0.76% | 0 | 16,636,527 | 0.56 | 355,582 | 8 | 1034 | 19 | 21,178 | 39,284 |
| Indonesia | 21 | 7,856,128 | 5,443,985 | 0.76% | 0 | 18,744,098 | 0.69 | 61,435 | 31 | 2455 | 11 | 27,663 | 39,281 |
| Canada | 22 | 7,679,467 | 6,341,308 | 0.75% | 0 | 20,362,084 | 0.83 | 2,316,599 | 3 | 258 | 48 | 27,712 | 38,397 |
| Korea (South) | 23 | 7,598,414 | 4,762,590 | 0.74% | 0 | 17,123,595 | 0.63 | 15,319 | 59 | 427 | 36 | 16,067 | 37,992 |
| Bangladesh | 24 | 6,251,796 | 4,976,261 | 0.61% | 0 | 16,204,318 | 0.80 | 6109 | 80 | 3290 | 8 | 18,191 | 31,259 |
| Taiwan (China) | 25 | 6,186,056 | 4,957,850 | 0.60% | 0 | 16,101,757 | 0.80 | 9662 | 67 | 264 | 47 | 20,884 | 30,930 |
| Cuba | 26 | 6,084,845 | 3,837,252 | 0.59% | 0 | 13,759,350 | 0.63 | 59,262 | 32 | 2098 | 12 | 11,642 | 30,424 |
| Argentina | 27 | 5,426,051 | 3,402,172 | 0.53% | 0 | 12,230,394 | 0.63 | 376,067 | 7 | 484 | 32 | 10,398 | 27,130 |
| Oman | 28 | 4,951,000 | 0 | 0.48% | 4,951,000 | 4,951,000 | 0.00 | 339,075 | 10 | 378 | 41 | 4951 | 24,755 |
| Vietnam | 29 | 4,649,464 | 2,627,027 | 0.45% | 0 | 9,903,517 | 0.57 | 18,154 | 55 | 1860 | 15 | 10,615 | 23,247 |
| New Zealand | 30 | 4,588,068 | 8,515,566 | 0.45% | 0 | 21,619,201 | 1.86 | 302,424 | 11 | 212 | 53 | 26,443 | 22,940 |
| Subgroup | Country | Rkj | σkj | Rkj-PD | Rkj-PG | Observed | Estimated |
|---|---|---|---|---|---|---|---|
| Fatality | Top 10 | 90.06% | 91.01% | 86.87% | 86.45% | 92.92% | 90.06% |
| Top 20 | 95.42% | 95.97% | 92.19% | 92.58% | 96.34% | 95.42% | |
| Top 30 | 97.48% | 97.86% | 94.66% | 95.57% | 98.13% | 97.48% | |
| Remaining 178 | 2.52% | 2.14% | 5.34% | 4.43% | 1.87% | 2.52% | |
| Injured | Top 10 | 88.40% | 83.82% | 80.09% | 88.04% | 80.12% | 88.40% |
| Top 20 | 94.63% | 93.94% | 90.00% | 94.06% | 94.43% | 94.63% | |
| Top 30 | 97.08% | 96.57% | 93.33% | 96.78% | 96.50% | 97.08% | |
| Remaining 178 | 2.92% | 3.43% | 6.67% | 3.22% | 3.50% | 2.92% | |
| Affected | Top 10 | 81.96% | 79.22% | 36.56% | 73.50% | 79.51% | 81.96% |
| Top 20 | 88.24% | 84.54% | 47.40% | 82.92% | 85.00% | 88.24% | |
| Top 30 | 91.87% | 89.17% | 69.74% | 86.55% | 89.64% | 91.87% | |
| Remaining 178 | 8.13% | 10.83% | 30.26% | 13.45% | 10.36% | 8.13% | |
| Damage | Top 10 | 74.61% | 74.29% | 70.80% | 49.48% | 74.77% | 74.61% |
| Top 20 | 85.24% | 85.24% | 80.04% | 72.41% | 85.13% | 85.24% | |
| Top 30 | 91.18% | 91.99% | 92.32% | 83.02% | 91.72% | 91.18% | |
| Remaining 178 | 8.82% | 8.01% | 7.68% | 16.98% | 8.28% | 8.82% |
© 2018 by the authors. Licensee MDPI, Basel, Switzerland. This article is an open access article distributed under the terms and conditions of the Creative Commons Attribution (CC BY) license (http://creativecommons.org/licenses/by/4.0/).
Share and Cite
Shen, G.; Zhou, L.; Wu, Y.; Cai, Z. A Global Expected Risk Analysis of Fatalities, Injuries, and Damages by Natural Disasters. Sustainability 2018, 10, 2573. https://doi.org/10.3390/su10072573
Shen G, Zhou L, Wu Y, Cai Z. A Global Expected Risk Analysis of Fatalities, Injuries, and Damages by Natural Disasters. Sustainability. 2018; 10(7):2573. https://doi.org/10.3390/su10072573
Chicago/Turabian StyleShen, Guoqiang, Long Zhou, Yao Wu, and Zhiming Cai. 2018. "A Global Expected Risk Analysis of Fatalities, Injuries, and Damages by Natural Disasters" Sustainability 10, no. 7: 2573. https://doi.org/10.3390/su10072573
APA StyleShen, G., Zhou, L., Wu, Y., & Cai, Z. (2018). A Global Expected Risk Analysis of Fatalities, Injuries, and Damages by Natural Disasters. Sustainability, 10(7), 2573. https://doi.org/10.3390/su10072573