A Review of Green Roof Applications for Managing Urban Stormwater in Different Climatic Zones

Abstract
:1. Introduction
2. Materials and Methods
3. Distribution of Green Roof Studies
4. Hydrologic Performance of Green Roofs in Different Climatic Groups
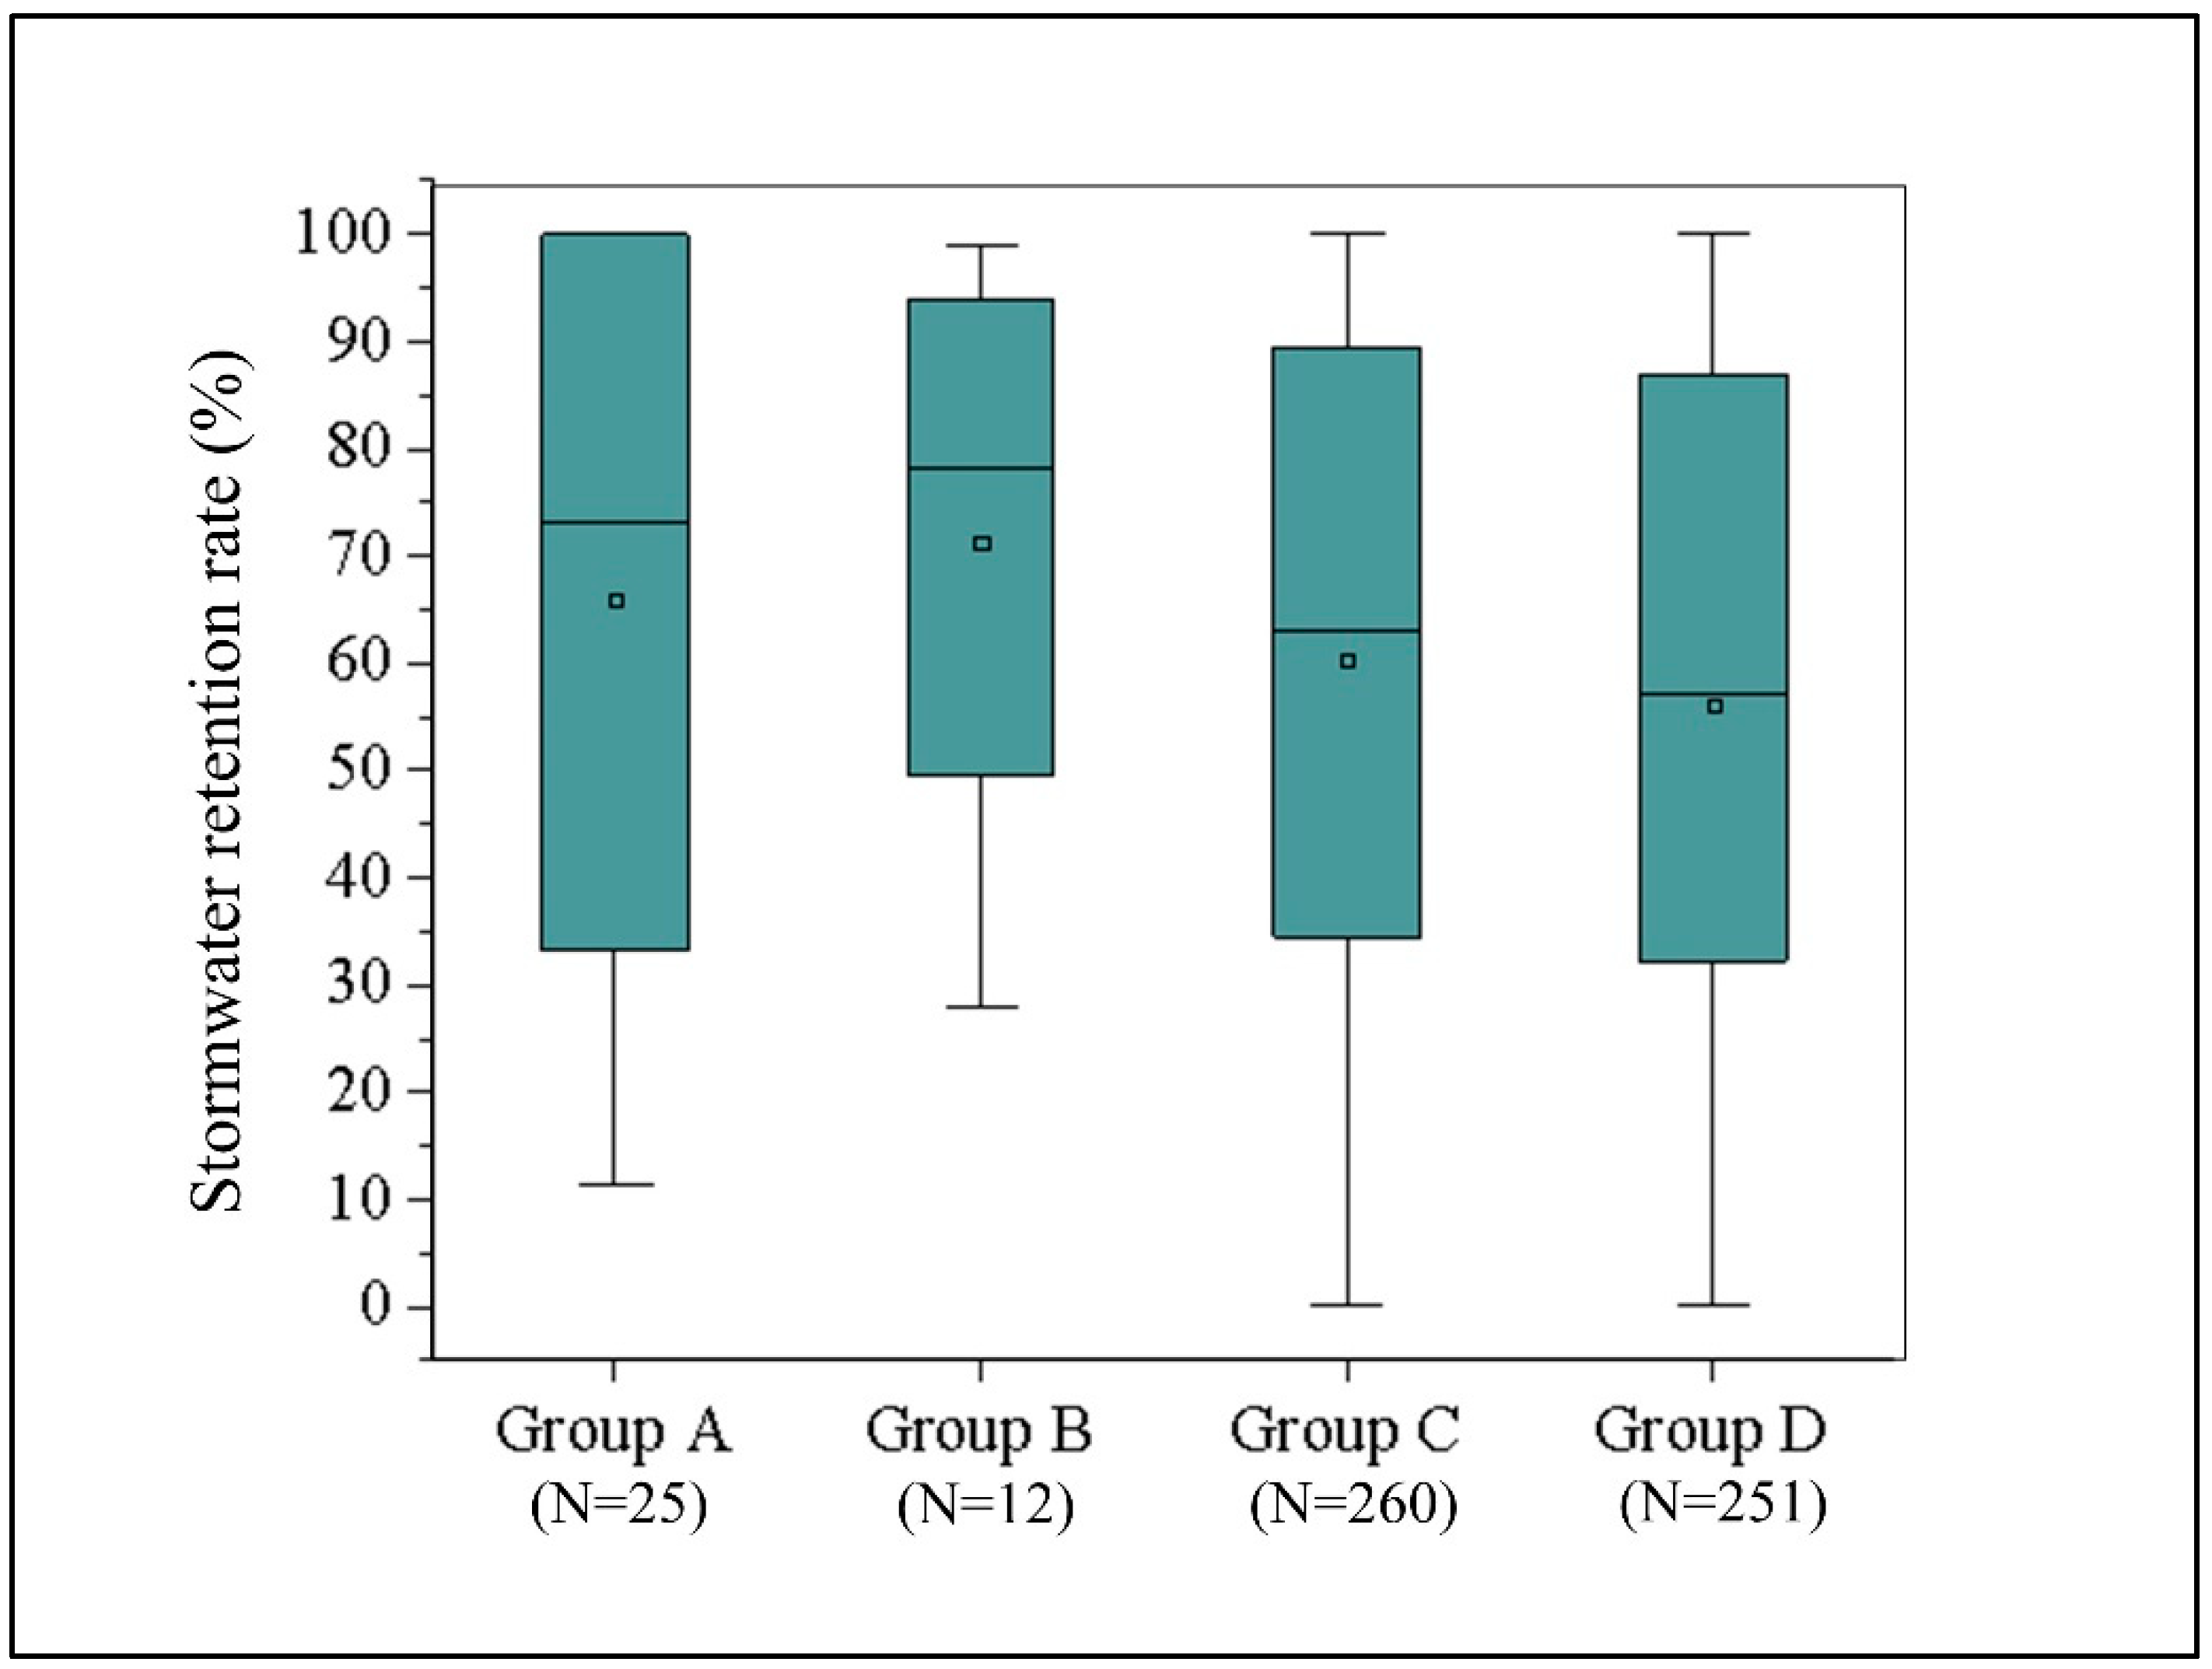
4.1. Stormwater Retention Rate
4.2. Influence of Design Variables on Hydrologic Performance
4.2.1. Growing Media Composition
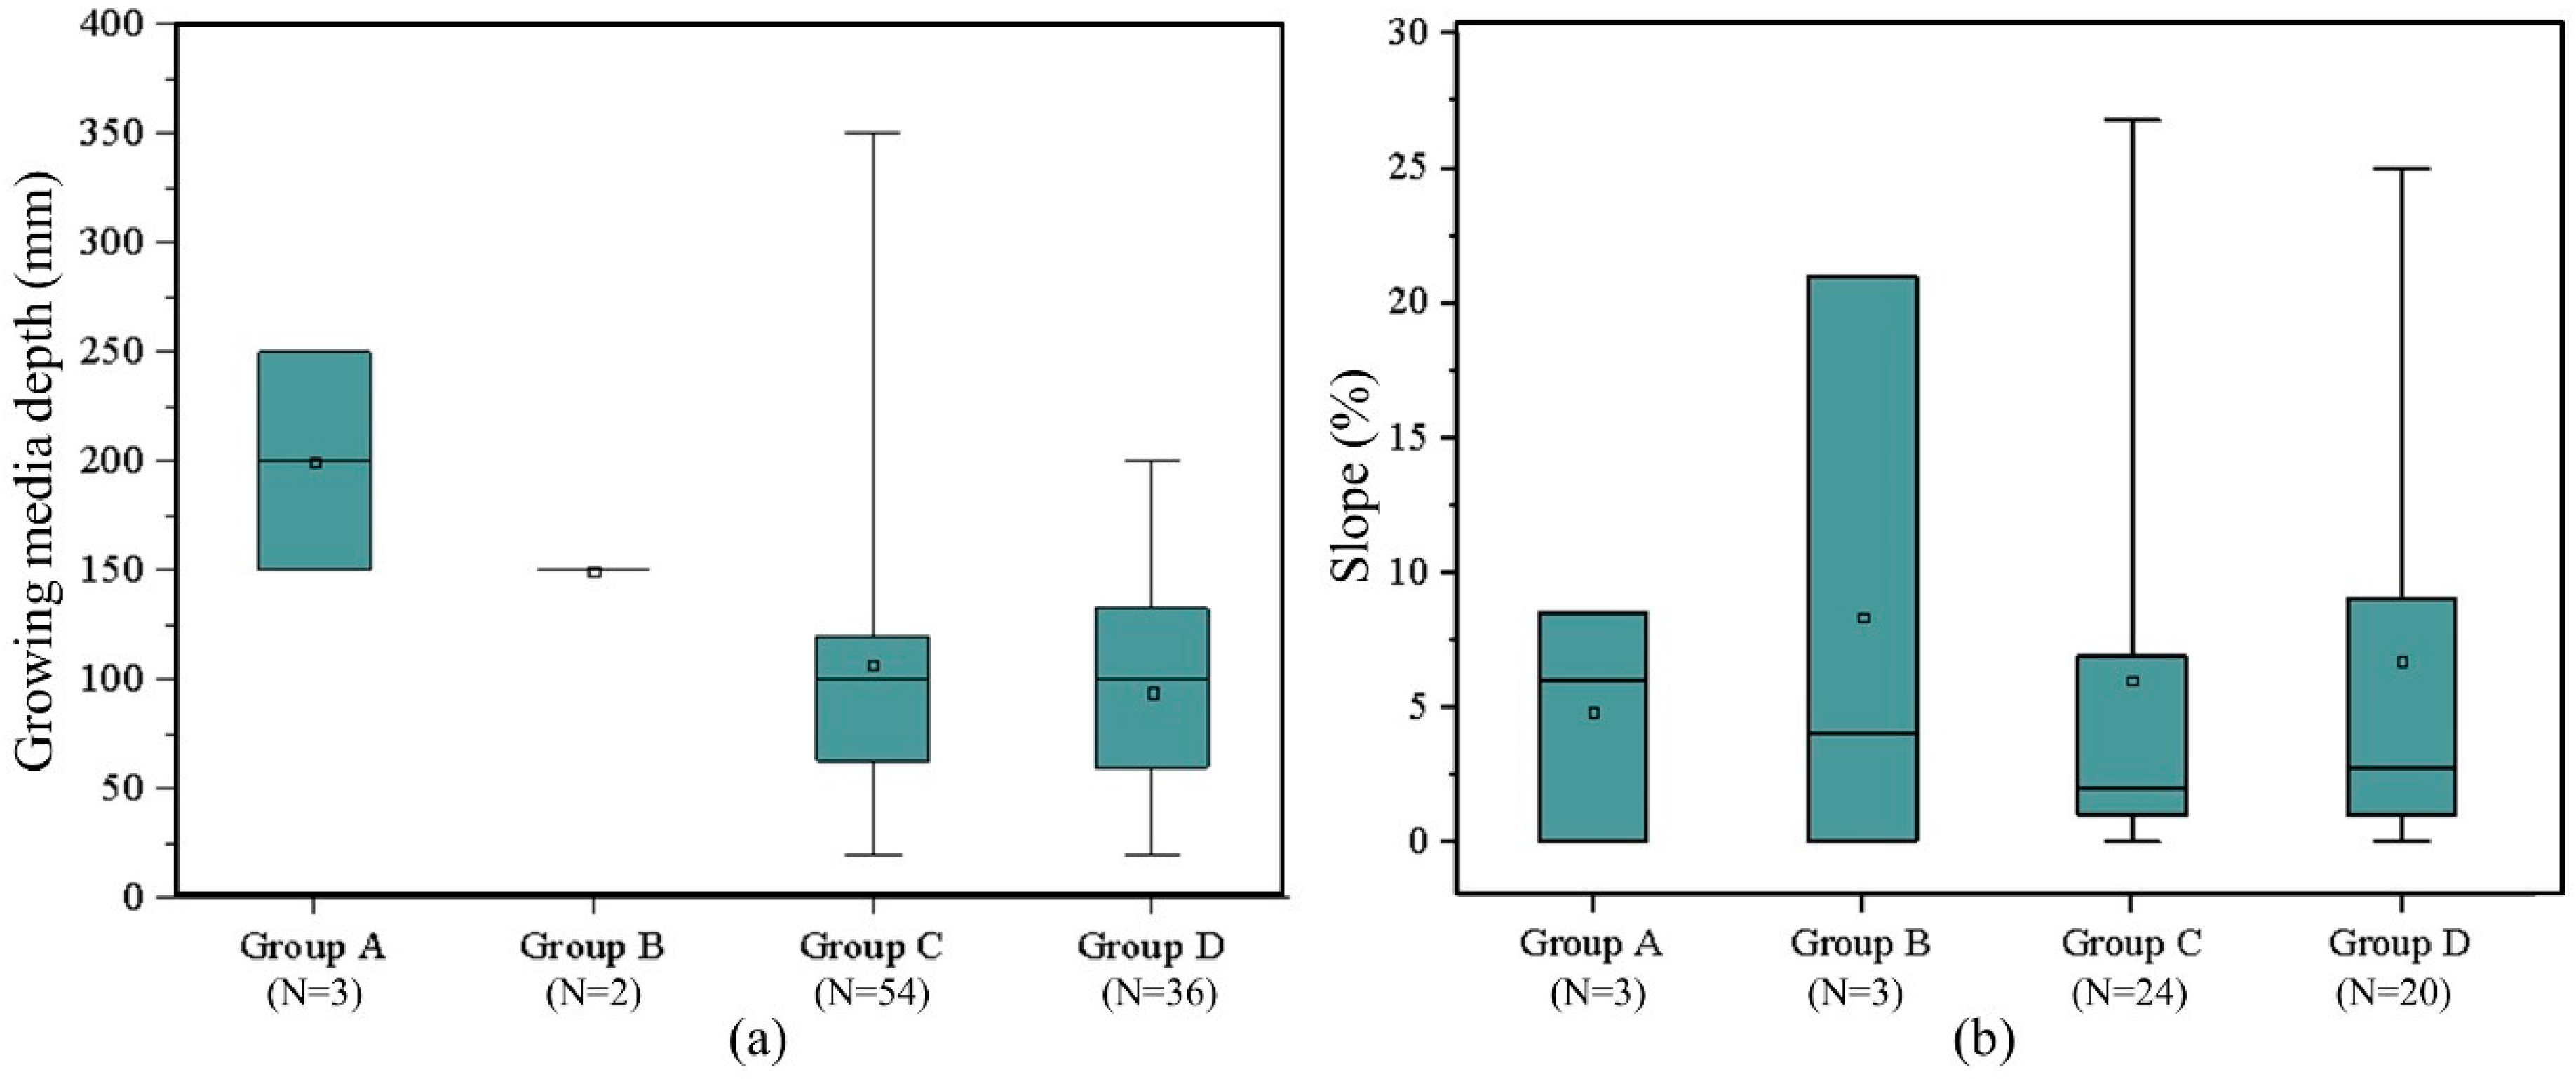
4.2.2. Growing Media Depth
4.2.3. Roof Slope
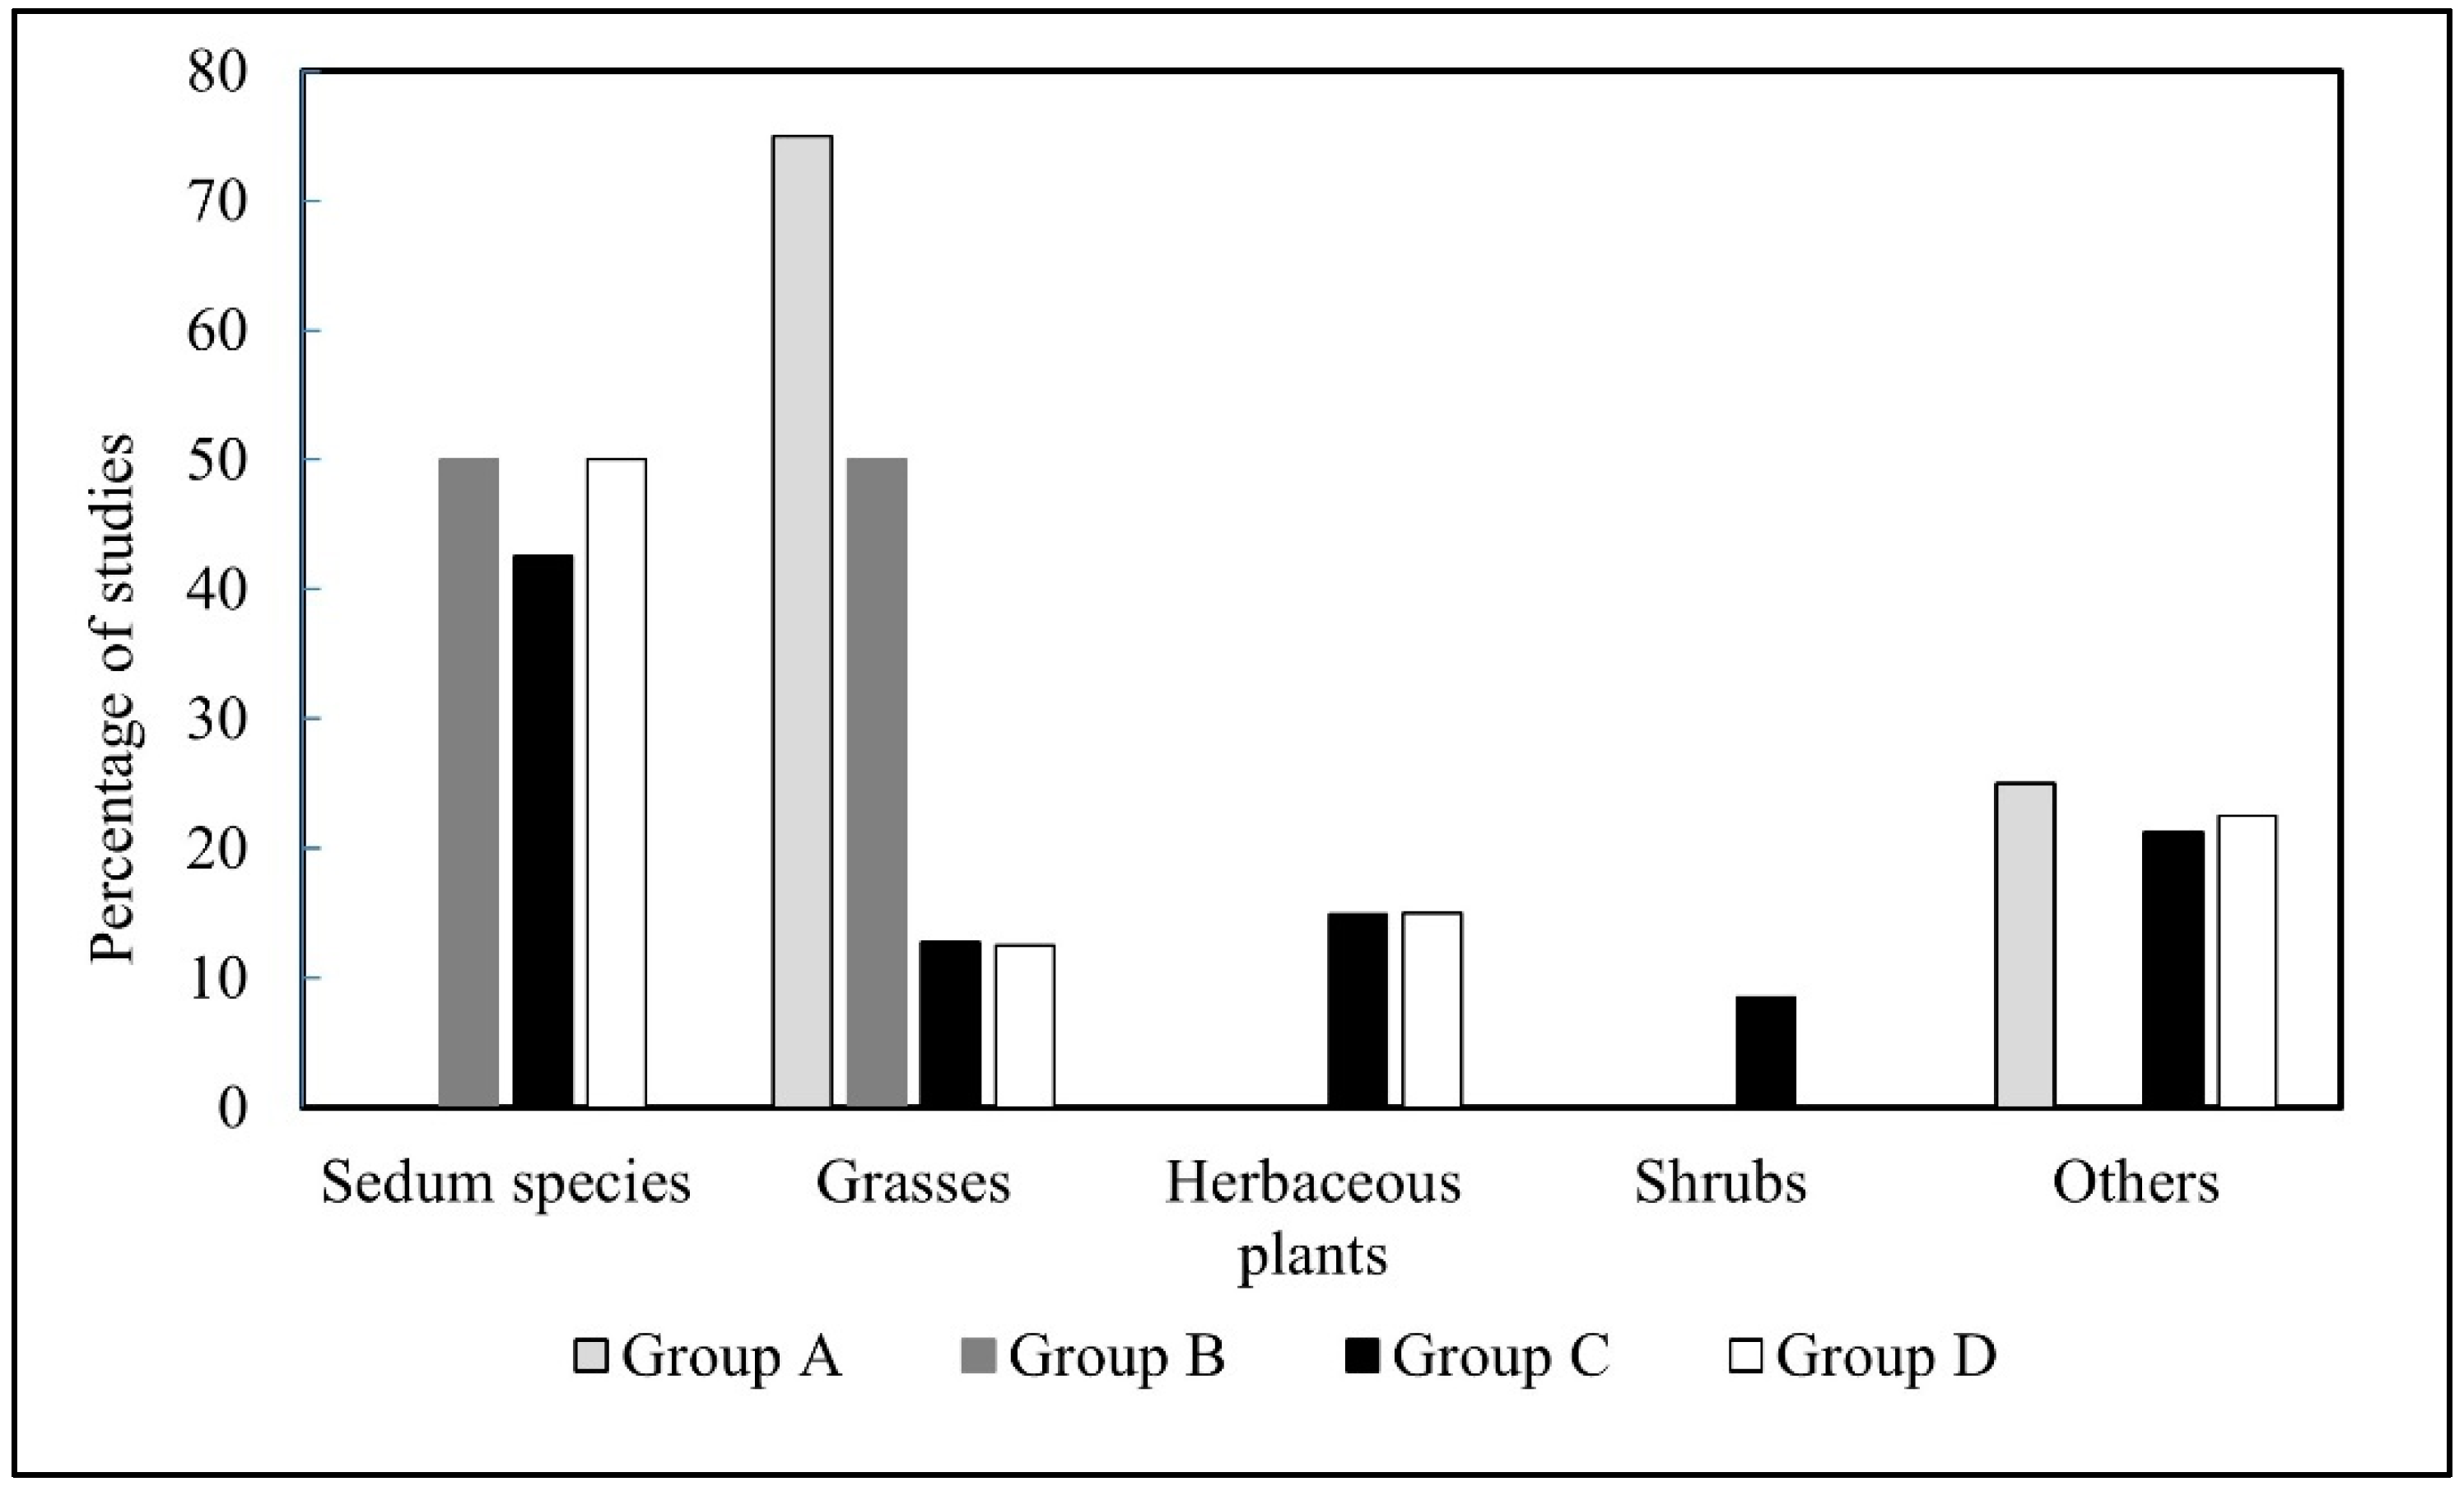
4.2.4. Vegetation
4.3. Influence of Hydrologic Variables on Hydrologic Performance
4.3.1. Antecedent Dry Weather Period (ADWP)
4.3.2. Rainfall Characteristics
5. Water Quality Performance of Green Roofs in Different Climatic Groups
5.1. Pollutant Concentrations in Green Roof Outflow
5.2. Influence of Design Variables on Water Quality
5.2.1. Growing Media Composition
5.2.2. Growing Media Depth
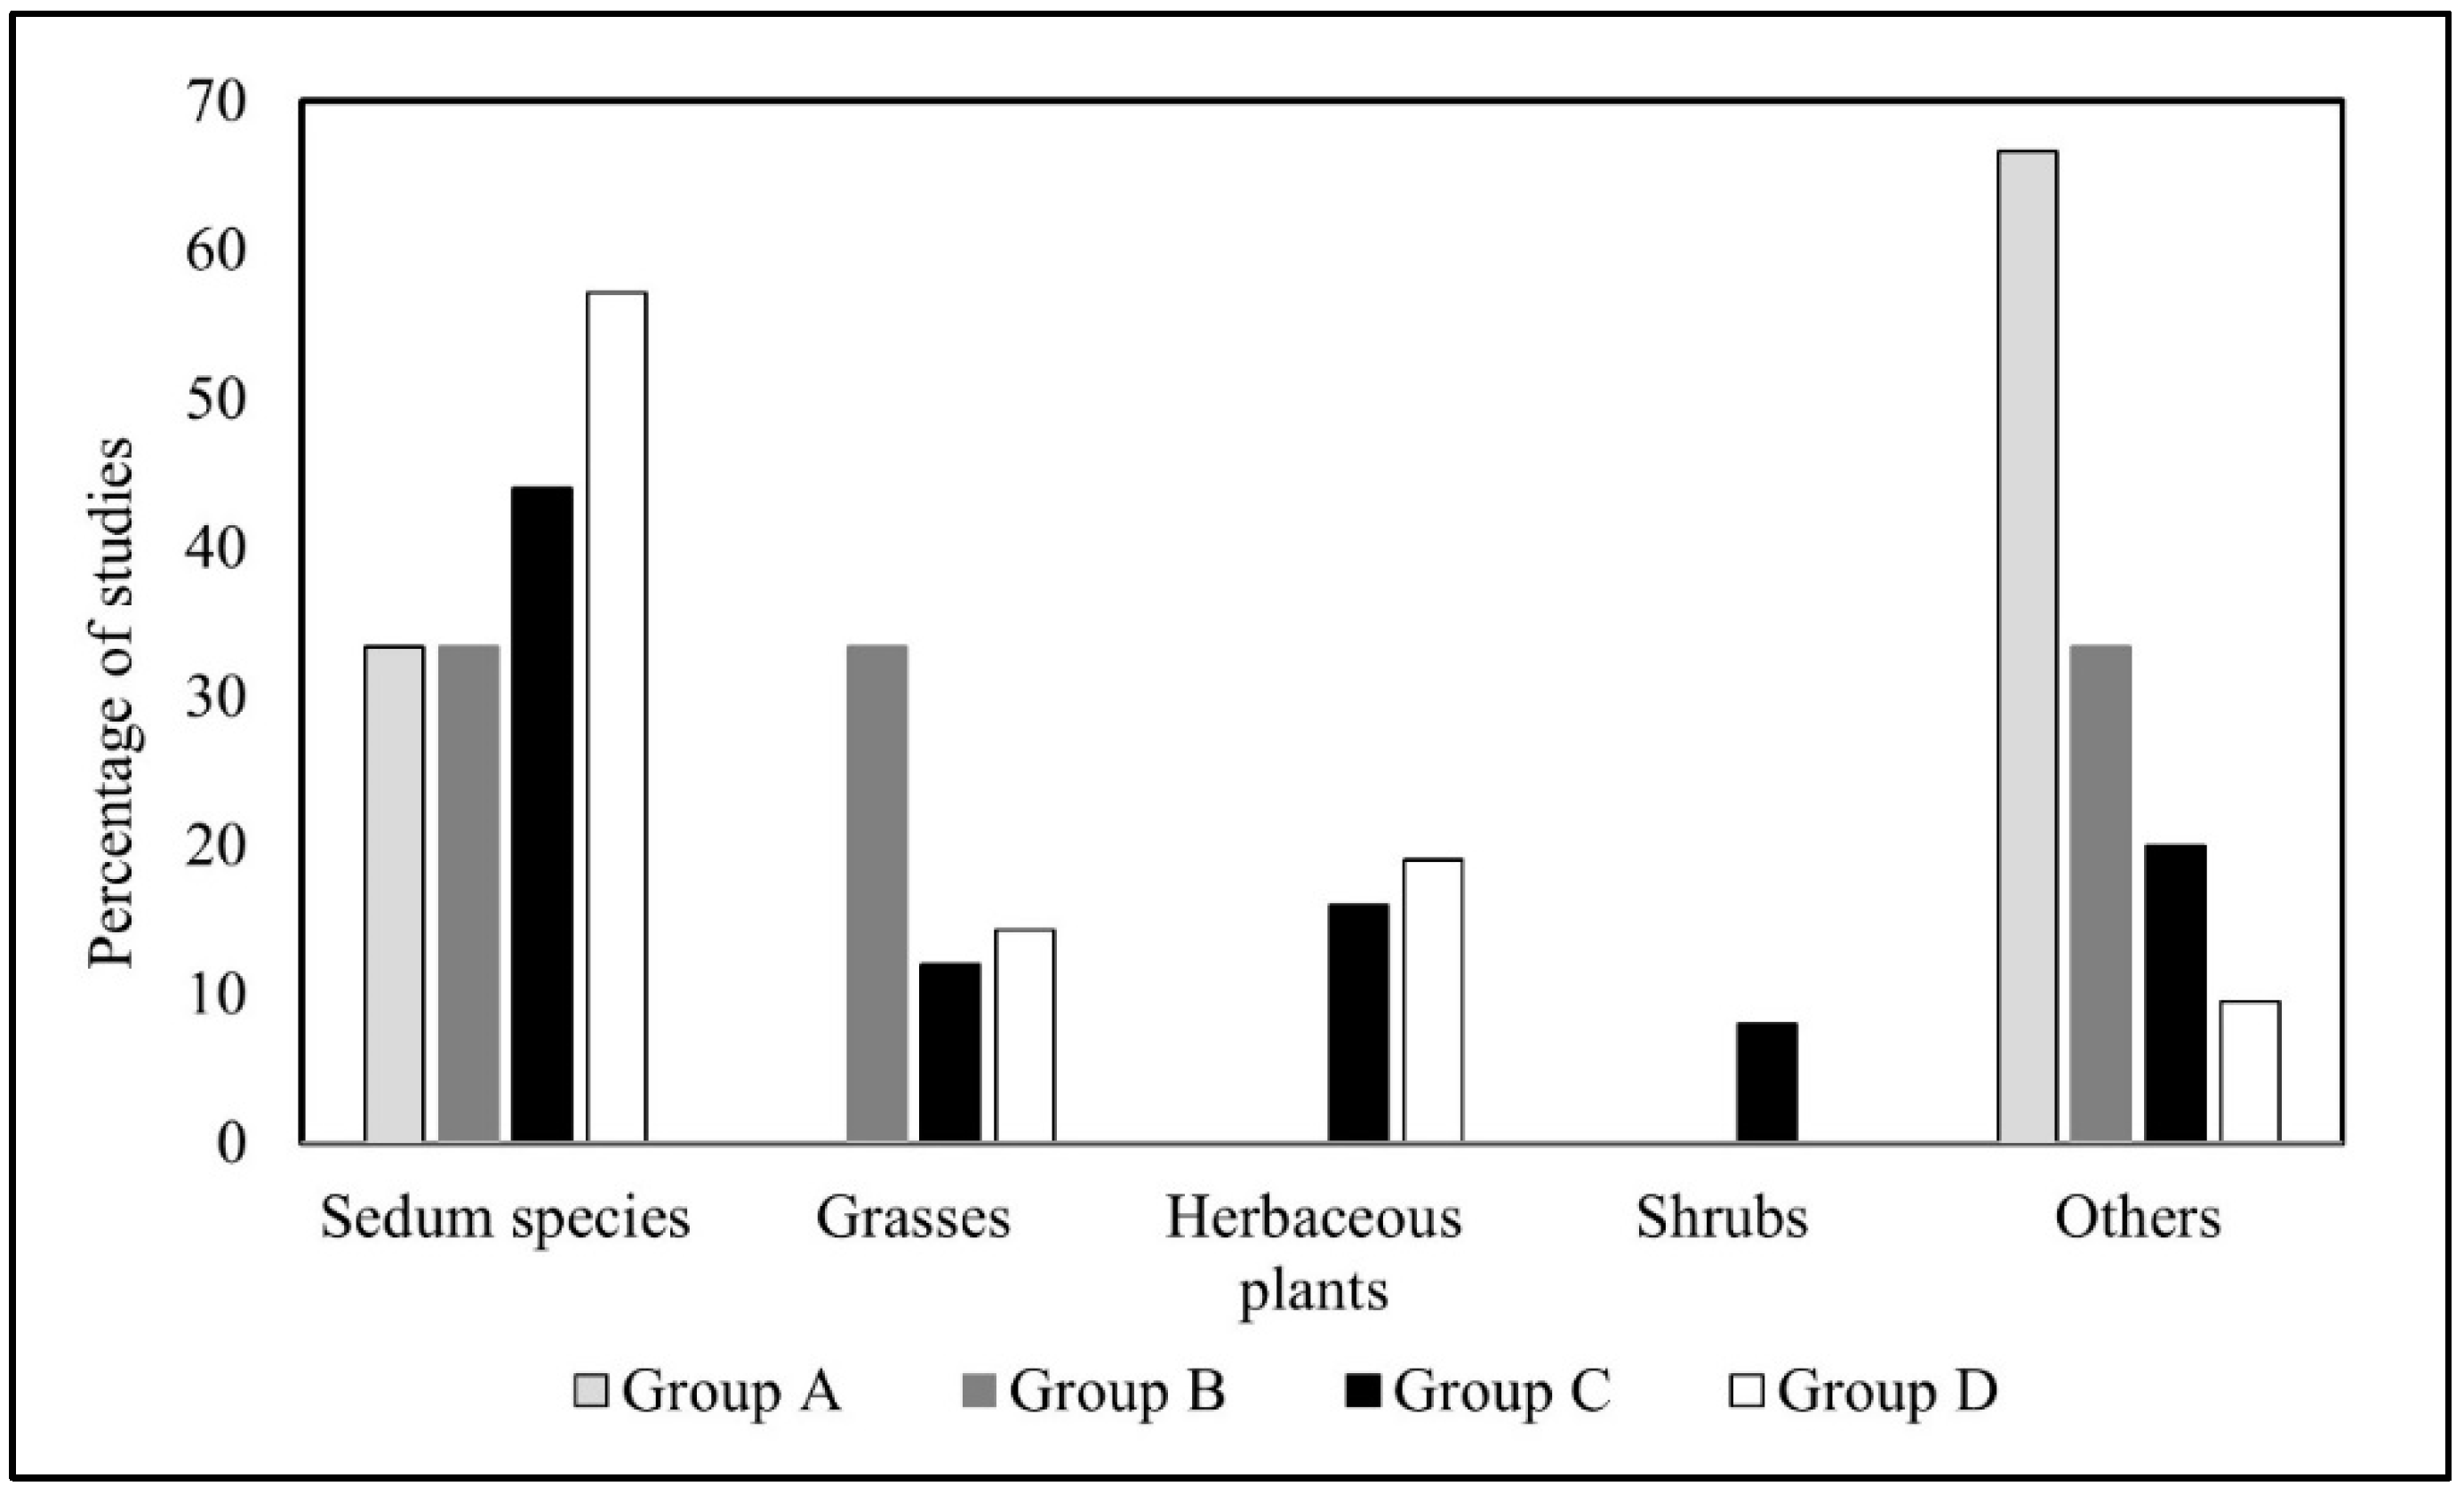
5.2.3. Vegetation
5.3. Influence of Hydrologic Variables on Water Quality
6. Conclusions
Author Contributions
Funding
Acknowledgments
Conflicts of Interest
Appendix A

| Reference | Sub-Climatic Group (b) | Study Location | Roof Slope (%) | Media Depth (mm) | Vegetation Type | Growing Media Composition | Stormwater Retention Rate (%) (c) | TN (mg/L) (c) | Nitrate (mg/L) (c) | Ammonia (mg/L) (c) | TP (mg/L) (c) | Phosphate (mg/L) (c) | Cu (mg/L) (c) | Zn (mg/L) (c) | Pb (mg/L) (c) |
|---|---|---|---|---|---|---|---|---|---|---|---|---|---|---|---|
| Group A: Tropical (megathermal) climate | |||||||||||||||
| [16] Qin et al. (2012) | -- | NTU, Singapore | 8.50 | 250 | Flowering plants (cuphea) and grasses | n/a | 11.40 | n/a (d) | n/a | n/a | n/a | n/a | n/a | n/a | n/a |
| [17] Musa et al. (2008) | -- | Parit Raja, Johor, Malaysia | 6.00 | 200 | Pearl grass | n/a | 16.70–47.90 | n/a | n/a | n/a | n/a | n/a | n/a | n/a | n/a |
| [18] Kasmin and Musa (2012) | -- | Parit Raja, Johor, Malaysia | 0.00 | 150 | Pearl Grass | 1: 3: 5 of sand: burn soil: and red soil | 33.00–100.00 | n/a | n/a | n/a | n/a | n/a | n/a | n/a | n/a |
| [19] Kasmin et al. (2014) | -- | Kuala Lumpur, Malaysia | n/a | n/a | n/a | n/a | 51.00 | n/a | n/a | n/a | n/a | n/a | n/a | n/a | n/a |
| [20] Kok et al. (2016) | -- | Kuala Lumpur, Malaysia | 35.00 | n/a | n/a | n/a | n/a | n/a | n/a | n/a | n/a | 2.40 | n/a | n/a | n/a |
| [21] Vijayaraghavan et al. (2012) | -- | NTU, Singapore. | 6.99 | 150 | Sedum species | White peat, black peat and clay; natural inorganic volcanic material, compost, organic and inorganic fertilizers | n/a | n/a | 0.34–0.86 | n/a | n/a | 19.80,40.00 | 0.037, 0.056 | n/a | 0.00 |
| [22] Vijayaraghavan and Raja (2015) | -- | IIT Madras, India | 6.99 | 250 | Flowering plant (P. grandiflora) | Perlite, vermiculite, sand, crushed brick, coco-peat and Sargassum biomass | n/a | n/a | n/a | n/a | n/a | n/a | 0.00–0.01 | 0.006–0.041 | 0.00 |
| [23] Vijayaraghavan and Joshi (2014) | -- | IIT Madras, India | 6.99 | 250 | Flowering plant (P. grandiflora) | Red soil, clay, sand and cow manure; vermiculite, perlite, sand, crushed brick and coco-peat. | n/a | n/a | n/a | n/a | n/a | n/a | .004–0.61 | 0.02–0.56 | 0.00–0.09 |
| Group B: Dry (arid and semiarid) climate | |||||||||||||||
| [24] Alberta Ingenuity 2008 | -- | Calgary, AB, Canada (a) | 4.00 | 150 | Grasses (sheep fescue, blue grama, and june grasses) | Recycled content 68% and 74% by weight. | 59.00, 66.00 | n/a | 1.12,4.00 | 0.82,1.45 | n/a | 2.94,4.20 | n/a | n/a | n/a |
| [25] Dabbaghian (2014) | -- | Kelowna, BC, Canada (a) | 5.24 | n/a | Sedum species and succulents (delosperma) | lightweight, mineral based materials | n/a | n/a | 0.69–11.59 | 0.016–0.20 | n/a | n/a | n/a | n/a | n/a |
| [26] Sims et al. (2016) | -- | Calgary, AB, Canada (a) | 0, 21.00 | 150 | Sedum species | Fine and coarse haydite, crushed dolostone, bark, peat moss, and some fertilizer. | 61.10–75.20 | n/a | n/a | n/a | n/a | n/a | n/a | n/a | n/a |
| Group C: Temperate climate | |||||||||||||||
| [7] Moran et al. (2003) | Cfa | Kinston, NC, USA | 5.00 | 102 | Sedum species and succulents (delosperma) | n/a | 63.00 | n/a | n/a | n/a | n/a | n/a | n/a | n/a | n/a |
| Cfa | Goldsboro, NC, USA | minimal | 102, 51 | Sedum species and succulents (delosperma) | n/a | 62.00 | n/a | n/a | n/a | n/a | n/a | n/a | n/a | n/a | |
| [27] Moran et al. (2005) | Cfa | Goldsboro, NC, USA | n/a | 75 | n/a | n/a | 63.00 | 0.80-6.80 | n/a | n/a | 0.60–1.50 | n/a | n/a | n/a | n/a |
| Cfa | Raleigh, NC, USA | n/a | 100 | n/a | n/a | 55.00 | n/a | n/a | n/a | n/a | n/a | n/a | n/a | n/a | |
| [8] Hathaway et al. (2008) | Cfa | Goldsboro, NC, USA | 0.00 | 75, 100 | Sedum species and succulents (delosperma) | Perma till (Stalite 3/8 in. expanded slate), sand, composted cow manure | 64.00,64.00 | 0.70–6.90 | n/a | n/a | 0.60–1.40 | n/a | n/a | n/a | n/a |
| [28] Palla et al. (2011) | Cfa | Genoa, Italy | n/a | 200 | n/a | n/a | 68.00 | n/a | n/a | n/a | n/a | n/a | n/a | n/a | n/a |
| [29] Fioretti et al. (2010) | Cfa | Northwest and Central Italy | n/a | 350 | Shrubs (broom) and herbaceous plants (lavender and rosemary) | Lapillus, pumice, zeolite, and 200 l/m3 of peat | 68.00 | n/a | n/a | n/a | n/a | n/a | n/a | n/a | n/a |
| [30] Gnecco et al. (2013) | Cfa | Genoa, Italy | n/a | 200 | Grass | lapillus, pumice, zeolite, peat | n/a | n/a | n/a | n/a | n/a | n/a | n/a | 0.032 | n/a |
| [31] Toland et al. (2012) | Cfa | Fayetteville, Arkansas, USA | n/a | n/a | Sedum species | Straw, cow manure, and chicken litter | n/a | 0.72–1.88 | 0.17–0.41 | 0.13–0.18 | 0.17, 2.03 | 0.14–1.82 | n/a | n/a | n/a |
| [32] Malcolm et al. (2014) | Cfa | Norfolk, VA, USA | 4.00 | 100 | Sedum species | Expanded slate and compost | n/a | 1.37–3.33 | n/a | n/a | 0.33–0.70 | n/a | 0.024 | 0.037 | n/a |
| [33] Buffam et al. (2016) | Cfa | Cincinnati, OH, USA | 36.40 | 100 | Sedum species | Tremco’s standard aggregate-based extensive green roof substrate, | n/a | n/a | 0.00–10.20 | 0.00–0.70 | n/a | 1.00–3.40 | n/a | 0.56 | n/a |
| [34] Hsiao and Chen (2012) | Cfa | Taipei City, Taiwan | n/a | n/a | Herbaceous and Sedum species | sandy loam/expanded clay/vermiculite/waste cotton/peat soil | n/a | n/a | 9.01 | 0.22 | 0.01 | n/a | n/a | n/a | n/a |
| [35] Chen and Kang (2016) | Cfa | Taipei City, Taiwan | n/a | 100 | Creeper forb, sedum, flowering plant (Sansevieria trifasciata) and shrubs (aloe) | Recycled fiber and pottery stone | n/a | 1.22, 10.37 | n/a | n/a | 1.96-3.00 | n/a | n/a | n/a | n/a |
| [36] Carson et al. (2013) | Cfa | NY, USA | n/a | 32, 100 | Sedum species and native | n/a | 36.00–61.00 | n/a | n/a | n/a | n/a | n/a | n/a | n/a | n/a |
| [37] Carpenter et al. (2016) | Cfa | Syracuse, NY, USA | 1.00, 15.00 | 102 | Sedum species | Lightweight growth media. | 96.80 | n/a | n/a | n/a | n/a | n/a | n/a | n/a | n/a |
| [9] Hakimdavar et al. (2014) | Cfa | NY, USA | n/a | 32 | n/a | n/a | 32.00–85.00 | n/a | n/a | n/a | n/a | n/a | n/a | n/a | n/a |
| [38] Mendez et al. (2011) | Cfa | Austin, TX, USA | 2.00 | n/a | n/a | n/a | n/a | n/a | 0.00–4.70 | n/a | n/a | n/a | n/a | 0.018–0.362 | 0.0003–0.0058 |
| [39] Harper et al. (2015) | Cfa | Rolla, MO, USA | n/a | 102 | Sedum species | Arkalyte mix | 40.00, 60.00 | >60.00, 10.00 | n/a | n/a | >30.00, 5.00 | n/a | n/a | n/a | n/a |
| [40] Simmons et al. (2008) | Cfa | Austin, TX, USA | n/a | 100 | Native perennial plants | Expanded shale/clay, vermiculite, sand, organic matter | 8.00-88.00 | n/a | n/a | n/a | n/a | n/a | n/a | n/a | n/a |
| [41] Carter and Rasmussen (2006) | Cfa | Athens, GA, USA | 2.00 | 76 | Sedum species and succulents (delosperma) | Stalite expanded slate, sand, and composted organic matter | 78.00 | n/a | n/a | n/a | n/a | n/a | n/a | n/a | n/a |
| [42] Nardini et al. (2012) | Cfa | Basovizza, Trieste, Italy | n/a | 120, 200 | Herbaceous plants and shrubs | Lapillus, pomix, zeolite, and peat | 63.00–90.00. | n/a | n/a | n/a | n/a | n/a | n/a | n/a | n/a |
| [11] Berndtsson et al. (2009) | Cfa | Fukuoka, Japan | n/a | 400 | 70 differentplant species. Leaves, trees, and bushes | Perlite, siliceous rock; aqua soil | n/a | 0.59 | 0.11 | 0.15 | 0.01 | 0.00 | n/a | n/a | 0.001, 0.003 |
| Cfb | Malmö, Sweden | n/a | 30 | sedum-moss | Crushed lava, natural calcareous soil, clay, and shredded peat, organic content | n/a | 2.31 | 0.07 | 0.08 | 0.31 | 0.27 | 0.149–0.032 | n/a | n/a | |
| [43] Gromaire et al. (2013) | Cfb | Trappes, Paris, France | n/a | 30, 150 | Sedum species and grasses | Natural pumice, lava, bark compost and green compost, organic matter | n/a | 0.80–1.80 | n/a | n/a | 0.38–0.78 | n/a | n/a | n/a | n/a |
| [44] Seidl et al. (2013) | Cfb | Paris, France | n/a | 60, 160 | Sedum species | volcanic rock (pozzolan), bark and peat, organic matter | n/a | n/a | 1.10; 1.10 | n/a | n/a | 3.80; 6.00 | 0.011,0.010 | 0.017, 0.017 | n/a |
| [4] Fassman-Beck et al. (2013) | Cfb | Auckland, New Zealand | n/a | 50–150 | Sedum species | Volcanic pumice, composted pine bark fines; pumice, expanded clay and compost-based. | 45.00–92.00 | n/a | n/a | n/a | n/a | n/a | n/a | n/a | n/a |
| [45] Voyde et al. (2010) | Cfb | Auckland, New Zealand | n/a | 50, 70 | Sedum species | Pumice, zeolite, and expanded clay, all pumice based. | 72.00 | n/a | n/a | n/a | n/a | n/a | n/a | n/a | n/a |
| [3] Stovin et al. (2012) | Cfb | Sheffield, UK | 2.75 | 80 | Sedum species | Crushed brick and fines. | 42.74 | n/a | n/a | n/a | n/a | n/a | n/a | n/a | n/a |
| [46] Stovin (2010) | Cfb | Sheffield, UK | 2.75 | n/a | Sedum species | Crushed bricks and fine | 34.00 | n/a | n/a | n/a | n/a | n/a | n/a | n/a | n/a |
| [47] Speak et al. (2013) | Cfb | Manchester, UK | n/a | 170 | n/a | n/a | 65.70 | n/a | n/a | n/a | n/a | n/a | n/a | n/a | n/a |
| [1] Nawaz et al. (2015) | Cfb | Leeds, UK | 2.00 | Extensive | Sedum species | n/a | 66.21 | n/a | n/a | n/a | n/a | n/a | n/a | n/a | n/a |
| [48] Liesecke (1998) | Cfb | Hannover-Herrenhausen, Germany | 2.00 | 20–120 | n/a | n/a | 40.00–60.00 | n/a | n/a | n/a | n/a | n/a | n/a | n/a | n/a |
| [49] Dürr (1995) | Cfb | Germany | minimal | 25–101 | Mosses, sedum, grasses, and herbaceous plants | n/a | 58.00–71.00 | n/a | n/a | n/a | n/a | n/a | n/a | n/a | n/a |
| [50] Franzaring et al. (2016) | Cfb | Hohenheim, Germany | 0.00 | 120 | Sedum species, grasses, herbaceous plant, and shrub. | Crushed bricks, clayey slate, compost and peat | 40.00 | n/a | n/a | n/a | n/a | n/a | n/a | n/a | n/a |
| [51] Bengtsson et al. (2005) | Cfb | Malmo, Sweden | 2.60 | 30 | Sedum species and mosses | Clay, crushed limestone, crushed roof tiles, sand, and organic material. | 46.00 | n/a | n/a | n/a | n/a | n/a | n/a | n/a | n/a |
| [52] Villarreal and Bengtsson (2005) | Cfb | Lund, Sweden | 3.50–25.00 | 40 | Sedum species | Crushed limestone, crushed brick, sand, clay, and organic material. | 10.00–62.00 | n/a | n/a | n/a | n/a | n/a | n/a | n/a | n/a |
| [53] Arias et al. (2016) | Cfb | Mions, France | 0.00 | 60 | Sedum species | n/a | 38.00–72.00 | n/a | n/a | n/a | n/a | n/a | n/a | n/a | n/a |
| [54] Perez et al. (2016) | Cfb | Bogotá, Colombia | 1.00 | n/a | Sedum species, native vegetables (radish, lettuce), grass, flowering plant bergenia, herbaceous plant lavender | n/a | 63.50–89.90 | n/a | n/a | n/a | n/a | n/a | n/a | n/a | n/a |
| [55] Johnston et al. (2004) | Cfb | Vancouver, BC, Canada | n/a | 350, 200 | Grasses (Elijiah Blue, Blue Fescue, Green Fescue) and shrubs (Kinnikinnick) | n/a | 48.00 | n/a | n/a | n/a | n/a | n/a | n/a | n/a | n/a |
| [56] Connelly et al. (2006) | Cfb | Vancouver, BC, Canada | 2.00 | 75, 150 | Sedum species and grasses (Festuca scoparia, Bouteloua gracilis, and Carex glauca) | White pumice, sand and organic compost | 6.00–100.00 | n/a | n/a | n/a | n/a | n/a | n/a | n/a | n/a |
| [57] Berkompas et al. (2008) | Csb | Seattle, WA, USA | n/a | 150 | n/a | n/a | 30.50 | n/a | n/a | n/a | n/a | n/a | n/a | n/a | n/a |
| n/a | 100–125 | n/a | n/a | 33.00 | n/a | n/a | n/a | n/a | n/a | n/a | n/a | n/a | |||
| n/a | 150 | n/a | n/a | 17.10 | n/a | n/a | n/a | n/a | n/a | n/a | n/a | n/a | |||
| [58] Razzaghmanesh et al. (2014a) | Csb | Adelaide, SouthAustralia | n/a | n/a | Succulent (Carpobrotus rossii), grasses (Lomandra longifolia Tanika), herb (Dianella caerulea Breeze), and shrub (yoporum parvifofium) | Crushed brick, scoria, coir fiber, and composted organics; scoria, composted pine bark, and hydro-cell flakes | n/a | n/a | 6.11–21.27 | n/a | n/a | 0.36–1.54 | 0.004–0.0064 | 0.0168–0.0231 | 0.0005–0.0012 |
| [59] Beecham and Razzaghmanesh (2015) | Csb | Adelaide, South Australia | 1.00, 25.00 | 100, 300 | Herbaceous plants | Red crushed brick, scoria, coir fiber, and composted organics; comprised scoria, composted pine bark, and hydro-cell flakes | 51.00,96.00 | n/a | 1.00–100.00 | 1.00–20.00 | n/a | 0.03–7.50 | n/a | n/a | n/a |
| Group D: Continental climates | |||||||||||||||
| [5] Bliss et al. (2009) | -- | Pittsburg, PA, USA | n/a | 140 | Sedum species | Expanded shale, perlite, and coconut husk. | 70.00 | 0.00 | n/a | n/a | 2.00–3.00 | n/a | n/a | 0.02 | 0.20 |
| [60] Morgan et al. (2012) | -- | IL, USA | n/a | 50–200 | Sedum species | Arkalyte and composted pine bark. | 50.00 | n/a | 3.00–70.30 | n/a | n/a | n/a | n/a | n/a | n/a |
| [61] Berghage et al. (2010) | -- | Chicago, IL, USA | n/a | 76 | n/a | n/a | 74.00 | n/a | n/a | n/a | n/a | n/a | n/a | n/a | n/a |
| [62] Hutchinson et al. (2003) | -- | Portland, OR, USA | minimal | 110 | Succulents, grasses and herbaceous species | n/a | 69.00 | n/a | n/a | n/a | n/a | n/a | n/a | n/a | n/a |
| [63] Kurtz (2008) | -- | Portland, OR, USA | n/a | 125 | n/a | n/a | 56.00 | n/a | n/a | n/a | n/a | n/a | n/a | n/a | n/a |
| -- | Portland, OR, USA | n/a | 75 | n/a | n/a | 64.00 | n/a | n/a | n/a | n/a | n/a | n/a | n/a | n/a | |
| [64] Spolek (2008) | -- | Portland, OR, USA | n/a | 100–150 | Flowering plants | n/a | 12.00 | n/a | n/a | n/a | n/a | n/a | n/a | n/a | n/a |
| n/a | 150 | Sedum, Bunchgrass | n/a | 25.00 | n/a | n/a | n/a | n/a | n/a | n/a | n/a | n/a | |||
| n/a | 100–150 | Grasses | n/a | 17.00 | n/a | n/a | n/a | n/a | n/a | n/a | n/a | n/a | |||
| [65] Rowe et al. (2003) | -- | East Lansing, MI, USA | 6.50 | 40,60 | Sedum species | n/a | 69.00, 72.00 | n/a | n/a | n/a | n/a | n/a | n/a | n/a | n/a |
| [66] Whittinghill et al. (2015) | -- | East Lansing, MI, USA | 2.00 | 105 | Sedum species, native vegetable and herbaceous species | Extremely coarse sand, very coarse sand, coarse sand, medium sand, fine sand, very find sand, extremely fine sand, silt, clay | 58.00–98.00 | n/a | 0.04–0.30 | n/a | 0.02, 0.44 | n/a | n/a | n/a | n/a |
| [67] Russell and Schickedantz, (2003) | -- | Dearborn, MI, USA | 2.00 | 20,100 | Sedum species and native | n/a | 39.00, 58.00 | n/a | n/a | n/a | n/a | n/a | n/a | n/a | n/a |
| [68] VanWoert et al. (2005) | -- | MI, USA | 2.00, 6.50 | 25, 40, 60 | Sedum species | Heat-expanded slate, peat, dolomite, composted yard waste and composted poultry litter by volume | 60.60–70.70 | n/a | n/a | n/a | n/a | n/a | n/a | n/a | n/a |
| [69] Monterusso et al. (2004) | -- | MI, USA | 2.00 | 20, 60 | Sedum species | Heat-expanded slate, grade sand, aged compost, peat | 38.60–58.10 | n/a | n/a | n/a | 0.00046–0.00439 | n/a | n/a | n/a | n/a |
| [3] Carpenter and Kaluvakolanu (2011) | -- | MI, USA | n/a | 101.6 | sedum species | Lightweight expanded shale blend, organic matter | 84.46 | n/a | 0.69 | n/a | 0.63 | n/a | n/a | n/a | n/a |
| [70] Getter et al. (2007) | -- | MI, USA | 2.00, 7.00, 15.00,25.00 | 60 | Flowering plant and sedum species | Sand 91.18% Silt 5.60% and Clay 3.22%. | 80.80 | n/a | n/a | n/a | n/a | n/a | n/a | n/a | n/a |
| [71] DeNardo et al. (2005) | -- | Philadelphia, PA, USA | 0.00 | 89 | Sedum species | n/a | 19.00–98.00 | n/a | n/a | n/a | n/a | n/a | n/a | n/a | n/a |
| [72] Gregoire and Clausen (2011) | -- | Storrs, CT, USA | n/a | 102 | Sedum species. | Lightweight expanded shale, composted biosolids, and perlite. | 51.40 | 0.49 | nitrate+nitrite:0.369 | 0.023 | 0.043 | 0.025 | 0.006 | 0.011 | n/a |
| [73] Liu and Minor (2005) | -- | Toronto, ON, Canada | minimal | 75, 100 | Sedum species | Lightweight, granules. | 57.00 | n/a | n/a | n/a | n/a | n/a | n/a | n/a | n/a |
| [6] TRCA (2006) | -- | Toronto, ON, Canada | 10.00 | 140 | Non-native grasses and herbaceous flowering plants (forbs) | n/a | 65.30 | n/a | 0.033-0.710 | 0.001–0.089 | 0.062–0.936 | 0.0459–0.8091 | 0.0095, 0.119 | 0.0021–0.0137 | 0.0025–0.0115 |
| [74] Van Seters et al. (2009) | -- | Toronto, ON, Canada | 10.00 | 140 | Non-native grasses and herbaceous flowering plants (forbs) | Crushed volcanic rock, compost, blonde peat, cooked clay, and washed sand. | 39.00–85.00 | n/a | 0.11, 0.23 | 0.00-0.02, | 0.23–0.45 | 0.16–0.36 | 0.0335–0.0595 | 0.0054–0.0088 | 0.00 |
| [26] Sims et al. (2016) | -- | London, ON, Canada | 21.25. | 150 | Sedum species | Fine and coarse haydite, crushed dolostone, bark, peat moss, and some fertilizer. | 76.50 | n/a | n/a | n/a | n/a | n/a | n/a | n/a | n/a |
| [26] Sims et al. (2016) | -- | Halifax, NS, Canada | 21.25 | 150 | Sedum species | Fine and coarse haydite, crushed dolostone, bark, peat moss, and some fertilizer. | 59.60 | n/a | n/a | n/a | n/a | n/a | n/a | n/a | n/a |
| [75] Berghage et al. (2009) | -- | PA, USA | n/a | 90–100 | Sedum species | Expanded clay with some compost amendment | 52.60 | n/a | n/a | n/a | 0.41 | n/a | n/a | n/a | n/a |
| [76] Teemusk and Mander (2011) | -- | Tartu, Estonia | 70–200 | Sedum acre, grass (Gramineae species), flowering plant (Thlaspi arvense) | Lightweight aggregate, humus and clay | n/a | 0.40–4.90 | 0.005–0.85 | 0.01–0.30 | 0.008–0.69 | 0.004–0.64 | n/a | n/a | n/a | |
| [12] Teemusk and Mander (2007) | -- | Tartu, Estonia | 0.00 | 100 | Sedum species, herbaceous flowering plants (forbs) | LWA, humus and clay | 85.70 | 1.20–2.10 | 0.42–0.8 | 0.12–0.33 | 0.026–0.09 | 0.006–0.066 | n/a | n/a | n/a |
| [77] Krebs et al. (2016) | -- | Lahti, southern Finland | 8.00 | 60–70 | Mosses, sedum species, herbs, and grasses | Crushed brick, compost, peat and crushed bark. | 50.52 | n/a | n/a | n/a | n/a | n/a | n/a | n/a | n/a |
| [78] Lee et al. (2015) | -- | Seoul, Korea | 0.00 | 100–150 | Sedum species | Volcanic materials and soil with peat moss (50 mm), perlite | 13.80–60.80 | n/a | n/a | n/a | n/a | n/a | n/a | n/a | n/a |
| [79] Alsup et al. (2011) | -- | IL, USA | n/a | 50–200 | Sedum species | Fine Arkalyte and composted pine bark | n/a | n/a | n/a | n/a | n/a | n/a | n/a | 0.0235–1.0536 | 00102–0.1354 |
| [80] Yang et al. (2015) | -- | Beijing, China | n/a | 150 | Sedum species | n/a | 78.27 | n/a | n/a | n/a | n/a | n/a | n/a | n/a | n/a |
| [81] Wang et al. (2013) | -- | Tianjin, China | 5.24 | 100–350 | Sedum species | Perlite and vermiculite mixed (1:1) | n/a | 1.64–1.98 | n/a | 0.46–0.59 | 0.35–0.49 | n/a | n/a | n/a | n/a |
| [82] Wang et al. (2017) | -- | Tianjin, China | 3.50 | 100 | Sedum species | Pumice, activated charcoal, zeolite, Lava, Perlite, vermiculite | 33.80–65.90 | 1.01–1.94 | 0.11–0.53 | 0.32–0.94 | 0.02–0.25 | 0.01–0.24 | 0.00066–0.00271 | 0.00097–0.00324 | 0.00137–0.00376 |
References
- Nawaz, R.; McDonald, A.; Postoyko, S. Hydrological performance of a full-scale extensive green roof located in a temperate climate. Ecol. Eng. 2015, 82, 66–80. [Google Scholar] [CrossRef] [Green Version]
- Stovin, V.; Vesuviano, G.; Kasmin, H. The hydrological performance of a green roof test bed under UK climatic conditions. J. Hydrol. 2012, 414, 148–161. [Google Scholar] [CrossRef]
- Carpenter, D.D.; Kaluvakolanu, P. Effect of roof surface type on storm-water runoff from full-scale roofs in a temperate climate. J. Irrig. Drain. Eng. 2011, 137, 161–169. [Google Scholar] [CrossRef]
- Fassman-Beck, E.; Voyde, E.; Simcock, R.; Hong, Y.S. 4 Living roofs in 3 locations: Does configuration affect runoff mitigation? J. Hydrol. 2013, 490, 11–20. [Google Scholar] [CrossRef]
- Bliss, D.J.; Neufeld, R.D.; Ries, R.J. Storm water runoff mitigation using a green roof. Environ. Eng. Sci. 2009, 26, 407–418. [Google Scholar] [CrossRef]
- Evaluation of an Extensive Green Roof; York University: Toronto, ON, Canada, 2006; Available online: http://www.sustainabletechnologies.ca/wp/wp-content/uploads/2013/03/GR_york_fullreport.pdf (accessed on 27 June 2018).
- Moran, A.; Hunt, B.; Jennings, G.A. North Carolina field study to evaluate green roof runoff quantity, runoff quality, and plant growth. In Proceedings of the World Water & Environmental Resources Congress 2003, Philadelphia, PA, USA, 23–26 June 2003. [Google Scholar]
- Hathaway, A.M.; Hunt, W.F.; Jennings, G.D. A field study of green roof hydrologic and water quality performance. Trans. ASABE 2008, 51, 37–44. [Google Scholar] [CrossRef]
- Hakimdavar, R.; Culligan, P.J.; Finazzi, M.; Barontini, S.; Ranzi, R. Scale dynamics of extensive green roofs: Quantifying the effect of drainage area and rainfall characteristics on observed and modeled green roof hydrologic performance. Ecol. Eng. 2014, 73, 494–508. [Google Scholar] [CrossRef]
- Berndtsson, J.C.; Bengtsson, L.; Jinno, K. Runoff water quality from intensive and extensive vegetated roofs. Ecol. Eng. 2009, 35, 369–380. [Google Scholar] [CrossRef]
- Berndtsson, J.C.; Emilsson, T.; Bengtsson, L. The influence of extensive vegetated roofs on runoff water quality. Sci. Total Environ. 2006, 355, 48–63. [Google Scholar] [CrossRef] [PubMed]
- Teemusk, A.; Mander, Ü. Rainwater runoff quantity and quality performance from a green roof: The effects of short-term events. Ecol. Eng. 2007, 30, 271–277. [Google Scholar] [CrossRef]
- Berndtsson, J.C. Green roof performance towards management of runoff water quantity and quality: A review. Ecol. Eng. 2010, 36, 351–360. [Google Scholar] [CrossRef]
- Sheskin, D.J. Handbook of Parametric and Nonparametric Statistical Procedures, 5th ed.; Chapman & Hall /CRC: Boca Raton, FL, USA, 2011. [Google Scholar]
- Kottek, M.; Grieser, J.; Beck, C.; Rudolf, B.; Rubel, F. World map of the Köppen-Geiger climate classification updated. Meteorol. Z. 2006, 15, 259–263. [Google Scholar] [CrossRef]
- Qin, X.; Wu, X.; Chiew, Y.M.; Li, Y. A green roof test bed for stormwater management and reduction of urban heat island effect in Singapore. Br. J. Environ. Clim. Chang. 2012, 2, 410–420. [Google Scholar] [CrossRef] [PubMed]
- Musa, S.; Arish, M.; Arshad, N.A.; Jalil, M.R.; Kasmin, H.; Ali, Z.; Mansor, M.S. Potential of storm water capacity using vegetated roofs in malaysia. In Proceedings of the International Conference on Civil Engineering Practice (ICCE08), Kuantan, Pahang, Malaysia, 12–14 May 2008. [Google Scholar]
- Kasmin, H.; Musa, S. Green roof as a potential sustainable structure for runoff reduction. In Proceedings of the 2012 IEEE Symposium in Business, Engineering and Industrial Applications (ISBEIA), Bandung, Indonesia, 23–26 September 2012. [Google Scholar]
- Kasmin, H.; Stovin, V.; De-Ville, S. Evaluation of green roof hydrological performance in a Malaysian context. In Proceedings of the 14th International Conference on Urban Drainage, Kuching, Sarawak, Malaysia, 7–12 September 2014. [Google Scholar]
- Kok, K.H.; Mohd Sidek, L.; Chow, M.F.; Zainal Abidin, M.R.; Basri, H.; Hayder, G. Evaluation of green roof performances for urban stormwater quantity and quality controls. Int. J. River Basin Manag. 2016, 14, 1–7. [Google Scholar] [CrossRef]
- Vijayaraghavan, K.; Joshi, U.M.; Balasubramanian, R. A field study to evaluate runoff quality from green roofs. Water Res. 2012, 46, 1337–1345. [Google Scholar] [CrossRef] [PubMed]
- Vijayaraghavan, K.; Raja, F.D. Pilot-scale evaluation of green roofs with Sargassum biomass as an additive to improve runoff quality. Ecol. Eng. 2015, 75, 70–78. [Google Scholar] [CrossRef]
- Vijayaraghavan, K.; Joshi, U.M. Can green roof act as a sink for contaminants? A methodological study to evaluate runoff quality from green roofs. Environ. Pollut. 2014, 194, 121–129. [Google Scholar] [CrossRef] [PubMed]
- Alberta Ecoroof Initiative. Alberta Ingenuity Report; Prepared by Westhoff Engineering Resources Inc.; Land & Water Resources Management Consultants: Calgary, AB, Canada, 2008. [Google Scholar]
- Dabbaghian, M. Water Quality and Lifecycle Assessment of Green Roof Systems in Semi-Arid Climate. Master’s Thesis, University of British Columbia, Vancouver, BC, Canada, April 2014. [Google Scholar]
- Sims, A.W.; Robinson, C.E.; Smart, C.C.; Voogt, J.A.; Hay, G.J.; Lundholm, J.T.; Powers, B.; O’Carroll, D.M. Retention performance of green roofs in three different climate regions. J. Hydrol. 2016, 542, 115–124. [Google Scholar] [CrossRef]
- Moran, A.; Hunt, B.; Smith, J. Hydrologic and water quality performance from green roofs in Goldsboro and Raleigh, North Carolina. In Proceedings of the Third Annual Greening Rooftops for Sustainable Communities Conference, Awards and Trade Show, Washington, DC, USA, 4–6 May 2005. [Google Scholar]
- Palla, A.; Sansalone, J.J.; Gnecco, I.; Lanza, L.G. Storm water infiltration in a monitored green roof for hydrologic restoration. Water Sci. Technol. 2011, 64, 766–773. [Google Scholar] [CrossRef] [PubMed]
- Fioretti, R.; Palla, A.; Lanza, L.G.; Principi, P. Green roof energy and water related performance in the Mediterranean climate. Build. Environ. 2010, 45, 1890–1904. [Google Scholar] [CrossRef]
- Gnecco, I.; Palla, A.; Lanza, L.G.; La Barbera, P. The role of green roofs as a source/sink of pollutants in storm water outflows. Water Resour. Manag. 2013, 27, 4715–4730. [Google Scholar] [CrossRef]
- Toland, D.C.; Haggard, B.E.; Boyer, M.E. Evaluation of nutrient concentrations in runoff water from green roofs, conventional roofs, and urban streams. Trans. ASABE 2012, 55, 99–106. [Google Scholar] [CrossRef]
- Malcolm, E.G.; Reese, M.L.; Schaus, M.H.; Ozmon, I.M.; Tran, L.M. Measurements of nutrients and mercury in green roof and gravel roof runoff. Ecol. Eng. 2014, 73, 705–712. [Google Scholar] [CrossRef]
- Buffam, I.; Mitchell, M.E.; Durtsche, R.D. Environmental drivers of seasonal variation in green roof runoff water quality. Ecol. Eng. 2016, 91, 506–514. [Google Scholar] [CrossRef]
- Hsiao, Y.L.; Chen, C.F. Water quality analysis of extensive green roof runoff. Hwa Kang J. Agric. 2012, 29, 15–34. [Google Scholar]
- Chen, C.F.; Kang, S.F. Effects of substrates and plant species on water quality of extensive green roofs. Appl. Ecol. Environ. Res. 2016, 14, 77–91. [Google Scholar] [CrossRef]
- Carson, T.B.; Marasco, D.E.; Culligan, P.J.; McGillis, W.R. Hydrological performance of extensive green roofs in New York City: Observations and multi-year modeling of three full-scale systems. Environ. Res. Lett. 2013, 8, 024036. [Google Scholar] [CrossRef]
- Carpenter, C.M.; Todorov, D.; Driscoll, C.T.; Montesdeoca, M. Water quantity and quality response of a green roof to storm events: Experimental and monitoring observations. Environ. Pollut. 2016, 218, 664–672. [Google Scholar] [CrossRef] [PubMed]
- Mendez, C.B.; Klenzendorf, J.B.; Afshar, B.R.; Simmons, M.T.; Barrett, M.E.; Kinney, K.A.; Kirisits, M.J. The effect of roofing material on the quality of harvested rainwater. Water Res. 2011, 45, 2049–2059. [Google Scholar] [CrossRef] [PubMed]
- Harper, G.E.; Limmer, M.A.; Showalter, W.E.; Burken, J.G. Nine-month evaluation of runoff quality and quantity from an experiential green roof in Missouri, USA. Ecol. Eng. 2015, 78, 127–133. [Google Scholar] [CrossRef]
- Simmons, M.T.; Gardiner, B.; Windhager, S.; Tinsley, J. Green roofs are not created equal: The hydrologic and thermal performance of six different extensive green roofs and reflective and non-reflective roofs in a sub-tropical climate. Urban Ecosyst. 2008, 11, 339–348. [Google Scholar] [CrossRef]
- Carter, T.L.; Rasmussen, T.C. Hydrologic behavior of vegetated roofs. J. Am. Water Resour. Assoc. 2006, 42, 1261–1274. [Google Scholar] [CrossRef]
- Nardini, A.; Andri, S.; Crasso, M. Influence of substrate depth and vegetation type on temperature and water runoff mitigation by extensive green roofs: Shrubs versus herbaceous plants. Urban Ecosyst. 2012, 15, 697–708. [Google Scholar] [CrossRef]
- Gromaire, M.C.; Ramier, D.; Seidl, M.; Berthier, E.; Saad, M.; De Gouvello, B. Impact of extensive green roofs on the quantity and the quality of runoff–first results of a test bench in the Paris region. In Proceedings of the 8th International Conference on Planning and Technologies for Sustainable Management of Water in the City, Lyon, France, 23–27 June 2013. [Google Scholar]
- Seidl, M.; Gromaire, M.C.; Saad, M.; De Gouvello, B. Effect of substrate depth and rain-event history on the pollutant abatement of green roofs. Environ. Pollut. 2013, 183, 195–203. [Google Scholar] [CrossRef] [PubMed]
- Voyde, E.; Fassman, E.; Simcock, R. Hydrology of an extensive living roof under sub-tropical climate conditions in Auckland, New Zealand. J. Hydrol. 2010, 394, 384–395. [Google Scholar] [CrossRef]
- Stovin, V. The potential of green roofs to manage urban stormwater. Water Environ. J. 2010, 24, 192–199. [Google Scholar] [CrossRef]
- Speak, A.F.; Rothwell, J.J.; Lindley, S.J.; Smith, C.L. Rainwater runoff retention on an aged intensive green roof. Sci. Total Environ. 2013, 461, 28–38. [Google Scholar] [CrossRef] [PubMed]
- Liesecke, H.J. Das Retentionsvermögen von Dachbegrünungen. (English title: The Retention of Green Roofs). Stadt Und Grün 1998, 47, 46–53. [Google Scholar]
- Dürr, A. Dachbegrünung: Ein Ökologischer Ausgleich; (English Title: Green Roofs: An Ecological Balance); Bauverlag, GmbH: Wiesbaden/Berlin, Germany, 1995. [Google Scholar]
- Franzaring, J.; Steffan, L.; Ansel, W.; Walker, R.; Fangmeier, A. Water retention, wash-out, substrate and surface temperatures of extensive green roof mesocosms—Results from a two-year study in SW-Germany. Ecol. Eng. 2016, 94, 503–515. [Google Scholar] [CrossRef]
- Bengtsson, L.; Grahn, L.; Olsson, J. Hydrological function of a thin extensive green roof in southern Sweden. Hydrol. Res. 2005, 36, 259–268. [Google Scholar] [CrossRef]
- Villarreal, E.L.; Bengtsson, L. Response of a Sedum green-roof to individual rain events. Ecol. Eng. 2005, 25, 1–7. [Google Scholar] [CrossRef]
- Arias, L.; Grimard, J.C.; Bertrand-Krajewski, J.L. First results of hydrological performances of three different green roofs. In Proceedings of the Novatech 2016, Source control, Lyon, France, 28 June–1 July 2016. [Google Scholar]
- Perez, M.G.; Ferrans, R.P.; Rey, G.C.; Diaz-Granados Ortiz, M.; Rodríguez Sánchez, J.; Correal Núñez, M. Assessment of runoff quantity and quality for extensive green roof modular systems. In Proceedings of the Novatech 2016, Source control, Lyon, France, 28 June–1 July 2016. [Google Scholar]
- Johnston, C.; McCreary, K.; Nelms, C. Vancouver Public Library Green Roof Monitoring Project; Public Works and Government Services Canada: Vancouver, BC, Canada, 2004. Available online: https://www.kwl.ca/sites/default/files/news/2259/resources/GreenRoofPaper04-0430FINAL.PDF (accessed on 26 June 2018).
- Connelly, M. BCIT Green Roof Research Program, Phase 1 Summary of Data Analysis: Observation Period-Jan. 1, 2005 to Dec. 31, 2005. Canada Mortgage and Housing Corporation. 2006. Available online: https://commons.bcit.ca/greenroof/files/2012/01/cmhc_erp_2006.pdf (accessed on 26 June 2018).
- Berkompas, B.; Marx, K.W.; Wachter, H.M.; Beyerlein, D.; Spencer, B. A study of green roof hydrologic performance in the Cascadia region. In Proceedings of the 2008 International Low Impact Development Conference, Seattle, WA, USA, 16–19 November 2008. [Google Scholar]
- Razzaghmanesh, M.; Beecham, S.; Kazemi, F. Impact of green roofs on stormwater quality in a South Australian urban environment. Sci. Total Environ. 2014, 470, 651–659. [Google Scholar] [CrossRef] [PubMed]
- Beecham, S.; Razzaghmanesh, M. Water quality and quantity investigation of green roofs in a dry climate. Water Res. 2015, 70, 370–384. [Google Scholar] [CrossRef] [PubMed]
- Morgan, S.; Celik, S.; Retzlaff, W. Green roof storm-water runoff quantity and quality. J. Environ. Eng. 2012, 139, 471–478. [Google Scholar] [CrossRef]
- Berghage, R.; Miller, C.; Bass, B.; Moseley, D.; Weeks, K. Stormwater runoff from a large commercial roof in chicago. In Proceedings of the In CitiesAlive!: Eighth Annual Green Roof and Wall Conference, Vancouver, BC, Canada, 30 November–3 December 2010. [Google Scholar]
- Hutchinson, D.; Abrams, P.; Retzlaff, R.; Liptan, T. Stormwater monitoring of two ecoroofs in Portland, Oregon, USA. In Proceedings of the Greening Rooftops for Sustainable Communities, Chicago, IL, USA, 29–30 May 2003. [Google Scholar]
- Kurtz, T. Flow monitoring of three ecoroofs in Portland, Oregon. In Proceedings of the International Low Impact Development Conference 2008, Seattle, WA, USA, 16–19 November 2008. [Google Scholar]
- Spolek, G. Performance monitoring of three ecoroofs in Portland, Oregon. Urban Ecosyst. 2008, 11, 349–359. [Google Scholar] [CrossRef]
- Rowe, D.B.; Rugh, C.L.; VanWoert, N.; Monterusso, M.A.; Russell, D.K. Green roof slope, substrate depth, and vegetation influence runoff. In Proceedings of the 1st North American Green Roof Conference: Greening Rooftops for Sustainable Communities, The Cardinal Group, Chicago, IL, USA, 20–30 May 2003. [Google Scholar]
- Whittinghill, L.J.; Rowe, D.B.; Andresen, J.A.; Cregg, B.M. Comparison of stormwater runoff from sedum, native prairie, and vegetable producing green roofs. Urban Ecosyst. 2015, 18, 13–29. [Google Scholar] [CrossRef]
- Russell, D.K.; Schickedantz, R. Ford Rouge Centre Green Roof Project. In Proceedings of the Greening Rooftops for Sustainable Communities, Chicago, IL, USA, 29–30 May 2003. [Google Scholar]
- VanWoert, N.D.; Rowe, D.B.; Andresen, J.A.; Rugh, C.L.; Fernandez, R.T.; Xiao, L. Green roof stormwater retention. J. Environ. Qual. 2005, 34, 1036–1044. [Google Scholar] [CrossRef] [PubMed]
- Monterusso, M.A.; Rowe, D.B.; Rugh, C.L.; Russell, D.K. Runoff water quantity and quality from green roof systems. Acta Hortic. 2004, 639, 369–376. [Google Scholar] [CrossRef]
- Getter, K.L.; Rowe, D.B.; Andresen, J.A. Quantifying the effect of slope on extensive green roof stormwater retention. Ecol. Eng. 2007, 31, 225–231. [Google Scholar] [CrossRef]
- DeNardo, J.C.; Jarrett, A.R.; Manbeck, H.B.; Beattie, D.J.; Berghage, R.D. Stormwater mitigation and surface temperature reduction by green roofs. Trans. ASAE 2005, 48, 1491–1496. [Google Scholar] [CrossRef]
- Gregoire, B.G.; Clausen, J.C. Effect of a modular extensive green roof on stormwater runoff and water quality. Ecol. Eng. 2011, 37, 963–969. [Google Scholar] [CrossRef]
- Liu, K.; Minor, J. Performance evaluation of an extensive green roof. In Proceedings of the Green Rooftops for Sustainable Communities, Washington, DC, USA, 5–6 May 2005; Available online: http://seedengr.com/Performance%20evaluation%20of%20an%20extensive%20green%20roof.pdf (accessed on 26 June 2018).
- Van Seters, T.; Rocha, L.; Smith, D.; MacMillan, G. Evaluation of green roofs for runoff retention, runoff quality, and leachability. Water Qual. Res. J. Can. 2009, 44, 33–47. [Google Scholar] [CrossRef]
- Berghage, R.; Beattie, D.; Jarrett, A.; Thuring, C.; Razaei, F.; O’Connor, T. Green Roofs for Stormwater Runoff Control EPA/600/R-09/026; National Risk Management Research Laboratory, Office of Research and Development, US Environmental Protection Agency: Cincinnati, OH, USA, 2009. Available online: https://cfpub.epa.gov/si/si_public_record_report.cfm?dirEntryId=205444 (accessed on 6 June 2018).
- Teemusk, A.; Mander, Ü. The influence of green roofs on runoff water quality: A case study from Estonia. Water Resour. Manag. 2011, 25, 3699. [Google Scholar] [CrossRef]
- Krebs, G.; Kuoppamäki, K.; Kokkonen, T.; Koivusalo, H. Simulation of green roof test bed runoff. Hydrol. Process. 2016, 30, 250–262. [Google Scholar] [CrossRef]
- Lee, J.Y.; Lee, M.J.; Han, M. A pilot study to evaluate runoff quantity from green roofs. J. Environ. Manag. 2015, 152, 171–176. [Google Scholar] [CrossRef] [PubMed]
- Alsup, S.E.; Ebbs, S.D.; Battaglia, L.L.; Retzlaff, W.A. Heavy metals in leachate from simulated green roof systems. Ecol. Eng. 2011, 37, 1709–1717. [Google Scholar] [CrossRef]
- Yang, W.Y.; Li, D.; Sun, T.; Ni, G.H. Saturation-excess and infiltration-excess runoff on green roofs. Ecol. Eng. 2015, 74, 327–336. [Google Scholar] [CrossRef]
- Wang, X.; Zhao, X.; Peng, C.; Zhang, X.; Wang, J. A field study to evaluate the impact of different factors on the nutrient pollutant concentrations in green roof runoff. Water Sci. Technol. 2013, 68, 2691–2697. [Google Scholar] [CrossRef] [PubMed]
- Wang, X.; Tian, Y.; Zhao, X. The influence of dual-substrate-layer extensive green roofs on rainwater runoff quantity and quality. Sci. Total Environ. 2017, 592, 465–476. [Google Scholar] [CrossRef] [PubMed]
- Getter, K.L.; Rowe, D.B. The role of extensive green roofs in sustainable development. HortScience 2006, 41, 1276–1285. [Google Scholar]
- Fassman, E.; Simcock, R. Moisture measurements as performance criteria for extensive living roof substrates. J. Environ. Eng. 2011, 138, 841–851. [Google Scholar] [CrossRef]
- Perelli, G.A. Characterization of the Green Roof Growth Media. Master’s Thesis, University of Western Ontario, London, ON, Canada, August 2014. [Google Scholar]
- Hilten, R.N.; Lawrence, T.M.; Tollner, E.W. Modeling stormwater runoff from green roofs with HYDRUS-1D. J. Hydrol. 2008, 358, 288–293. [Google Scholar] [CrossRef]
- Sailor, D.J.; Hagos, M. An updated and expanded set of thermal property data for green roof growing media. Energy Build. 2011, 43, 2298–2303. [Google Scholar] [CrossRef]
- Ampim, P.A.; Sloan, J.J.; Cabrera, R.I.; Harp, D.A.; Jaber, F.H. Green roof growing substrates: Types, ingredients, composition and properties. J. Environ. Hortic. 2010, 28, 244–252. [Google Scholar]
- The American Society for Testing and Materials (ASTM). ASTM E2777-14 Standard Guide for Vegetative (Green) Roof Systems; ASTM International: West Conshohocken, PA, USA, 2014. [Google Scholar]
- Sailor, D.J.; Hutchinson, D.; Bokovoy, L. Thermal property measurements for ecoroof soils common in the western US. Energy Build. 2008, 40, 1246–1251. [Google Scholar] [CrossRef]
- Razzaghmanesh, M.; Beecham, S.; Kazemi, F. The growth and survival of plants in urban green roofs in a dry climate. Sci. Total Environ. 2014, 476, 288–297. [Google Scholar] [CrossRef] [PubMed]
- Graceson, A.; Monaghan, J.; Hall, N.; Hare, M. Plant growth responses to different growing media for green roofs. Ecol. Eng. 2014, 69, 196–200. [Google Scholar] [CrossRef]
- Graceson, A.; Hare, M.; Hall, N.; Monaghan, J. Use of inorganic substrates and composted green waste in growing media for green roofs. Biosyst. Eng. 2014, 124, 1–7. [Google Scholar] [CrossRef]
- Bates, A.J.; Sadler, J.P.; Greswell, R.B.; Mackay, R. Effects of varying organic matter content on the development of green roof vegetation: A six year experiment. Ecol. Eng. 2015, 82, 301–310. [Google Scholar] [CrossRef] [Green Version]
- Emilsson, T. Vegetation development on extensive vegetated green roofs: Influence of substrate composition, establishment method and species mix. Ecol. Eng. 2008, 33, 265–277. [Google Scholar] [CrossRef] [Green Version]
- Nagase, A.; Dunnett, N. The relationship between percentage of organic matter in substrate and plant growth in extensive green roofs. Landsc. Urban Plan. 2011, 103, 230–236. [Google Scholar] [CrossRef]
- The City of Calgary. Module 3-Green Roofs, 2014: Low Impact Development Guidelines; The City of Calgary: Calgary, AB, Canada, 2014; Available online: http://www.calgary.ca/UEP/Water/Documents/Water-Documents/Module-3-Green-Roof.pdf (accessed on 20 June 2018).
- Cao, C.T.; Farrell, C.; Kristiansen, P.E.; Rayner, J.P. Biochar makes green roof substrates lighter and improves water supply to plants. Ecol. Eng. 2014, 71, 368–374. [Google Scholar] [CrossRef]
- Cool and Green Roofing Manual. Prepared for New York City Department of Design & Construction Office of Sustainable Design, by Gruzen Samton Architects LLP with Amis Inc. Flack & Kurtz Inc. Mathews Nielsen Landscape Architects P.C., and SHADE Consulting, LLC. New York, United States. 2007. Available online: http://www.nyc.gov/html/ddc/downloads/pdf/cool_green_roof_man.pdf (accessed on 6 June 2018).
- Eksi, M.; Rowe, D.B.; Fernández-Cañero, R.; Cregg, B.M. Effect of substrate compost percentage on green roof vegetable production. Urban For. Urban Green. 2015, 14, 315–322. [Google Scholar] [CrossRef]
- Farrell, C.; Ang, X.Q.; Rayner, J.P. Water-retention additives increase plant available water in green roof substrates. Ecol. Eng. 2013, 52, 112–118. [Google Scholar] [CrossRef]
- Olszewski, M.W.; Holmes, M.H.; Young, C.A. Assessment of physical properties and stonecrop growth in green roof substrates amended with compost and hydrogel. HortTechnology 2010, 20, 438–444. [Google Scholar]
- Savi, T.; Marin, M.; Boldrin, D.; Incerti, G.; Andri, S.; Nardini, A. Green roofs for a drier world: Effects of hydrogel amendment on substrate and plant water status. Sci. Total Environ. 2014, 490, 467–476. [Google Scholar] [CrossRef] [PubMed]
- Nektarios, P.A.; Amountzias, I.; Kokkinou, I.; Ntoulas, N. Green roof substrate type and depth affect the growth of the native species Dianthus fruticosus under reduced irrigation regimens. HortScience 2011, 46, 1208–1216. [Google Scholar]
- Dunnett, N.; Nagase, A.; Booth, R.; Grime, P. Influence of vegetation composition on runoff in two simulated green roof experiments. Urban Ecosyst. 2008, 11, 385–398. [Google Scholar] [CrossRef]
- Thuring, C.E.; Berghage, R.D.; Beattie, D.J. Green roof plant responses to different substrate types and depths under various drought conditions. HortTechnology 2010, 20, 395–401. [Google Scholar]
- Crockford, R.H.; Richardson, D.P. Partitioning of rainfall into throughfall, stemflow and interception: Effect of forest type, ground cover and climate. Hydrol. Process. 2000, 14, 2903–2920. [Google Scholar] [CrossRef]
- Steusloff, S. Input and output of airborne aggressive substances on green roofs in Karlsruhe. Urban Ecol. 1998, 144–148. [Google Scholar]
- Razzaghmanesh, M.; Beecham, S. The hydrological behaviour of extensive and intensive green roofs in a dry climate. Sci. Total Environ. 2014, 499, 284–296. [Google Scholar] [CrossRef] [PubMed]
- Chowdhury, R.K.; Beecham, S. Characterization of rainfall spells for urban water management. Int. J. Climatol. 2013, 33, 959–967. [Google Scholar] [CrossRef]
- Li, Y.; Babcock, R.W. Green roofs against pollution and climate change. A review. Agron. Sustain. Dev. 2014, 34, 695–705. [Google Scholar] [CrossRef]
- Braithwaite, R.L. Geological and mineralogical characterization of zeolites in lacustrine tuffs, Ngakuru, Taupo Volcanic Zone, New Zealand. Clays Clay Miner. 2009, 51, 589–598. [Google Scholar] [CrossRef]
- Beck, D.A.; Johnson, G.R.; Spolek, G.A. Amending green roof soil with biochar to affect runoff water quantity and quality. Environ. Pollut. 2011, 159, 2111–2118. [Google Scholar] [CrossRef] [PubMed]
- Kuoppamäki, K.; Hagner, M.; Lehvävirta, S.; Setälä, H. Biochar amendment in the green roof substrate affects runoff quality and quantity. Ecol. Eng. 2016, 88, 1–9. [Google Scholar] [CrossRef]
- Aitkenhead-Peterson, J.A.; Dvorak, B.D.; Volder, A.; Stanley, N.C. Chemistry of growth medium and leachate from green roof systems in south-central Texas. Urban Ecosyst. 2011, 14, 17–33. [Google Scholar] [CrossRef]
- Cook-Patton, S.C.; Bauerle, T.L. Potential benefits of plant diversity on vegetated roofs: A literature review. J. Environ. Manag. 2012, 106, 85–92. [Google Scholar] [CrossRef] [PubMed]
- Oberndorfer, E.; Lundholm, J.; Bass, B.; Coffman, R.R.; Doshi, H.; Dunnett, N.; Gaffin, S.; Köhler, M.; Liu, K.K.Y.; Rowe, B. Green roofs as urban ecosystems: Ecological structures, functions, and services. BioScience 2007, 57, 823–833. [Google Scholar] [CrossRef]


| Climate Group | Description | Characteristics | Number of Papers on Hydrologic Performance | Number of Papers on Water Quality Performance |
|---|---|---|---|---|
| Group A | Equatorial climates (Tropical) | Tmin ≥ +18 °C | 4 | 4 |
| Af | Equatorial rainforest, fully humid | Pmin ≥ 60 mm | 4 | 2 |
| Aw | Equatorial savannah with dry winter | Pmin < 60 mm in winter | 0 | 2 |
| Group B | Arid climates | Pann < 10 Pth | 2 | 2 |
| BSk | Cold steppe climate (cold semi-arid climate) | Pann > 5 Pth; Tann < +18 °C | 2 | 2 |
| Group C | Warm temperate climates | −3 °C < Tmin < +18 °C | 29 | 15 |
| Cfa | Warm temperate climate, fully humid (hot summer) | Psmin = Pwmin; Pwmax ≤ 3 Psmin; Psmin ≥ 40 mm; Psmax ≤ 10 Pwmin; Tmax ≥ +22 °C | 13 | 10 |
| Cfb | Warm temperate climate, fully humid (warm summer) | Psmin = Pwmin; Pwmax ≤ 3Psmin; Psmin ≥ 40 mm; Psmax ≤ 10 Pwmin; Tmax ≤ +22 °C; at least 4 Tmon ≥ +10 °C | 15 | 3 |
| Csb | Warm temperate climate with dry summer (warm summer) | Psmin < Pwmin; Pwmax >3 Psmin; Psmin < 40 mm; Tmax ≤ +22 °C; at least 4 Tmon ≥ +10 °C | 1 | 2 |
| Group D | Snow climates (Continental) | Tmin ≤ −3 °C | 25 | 14 |
| Dfa | Snow climate, fully humid (hot summer) | Psmin = Pwmin; Tmax ≥ +22 °C | 3 | 3 |
| Dfb | Snow climate, fully humid (warm summer) | Psmin = Pwmin; Tmax < +22 °C; at least 4 Tmon ≥ +10 °C | 19 | 9 |
| Dwa | Snow climate with dry winter (monsoon-influenced hot-summer) | Pwmin < Psmin Psmax > 10 Pwmin | 3 | 2 |
| Group E | Polar climates | Tmax < +10 °C | 0 | 0 |
© 2018 by the authors. Licensee MDPI, Basel, Switzerland. This article is an open access article distributed under the terms and conditions of the Creative Commons Attribution (CC BY) license (http://creativecommons.org/licenses/by/4.0/).
Share and Cite
Akther, M.; He, J.; Chu, A.; Huang, J.; Van Duin, B. A Review of Green Roof Applications for Managing Urban Stormwater in Different Climatic Zones. Sustainability 2018, 10, 2864. https://doi.org/10.3390/su10082864
Akther M, He J, Chu A, Huang J, Van Duin B. A Review of Green Roof Applications for Managing Urban Stormwater in Different Climatic Zones. Sustainability. 2018; 10(8):2864. https://doi.org/10.3390/su10082864
Chicago/Turabian StyleAkther, Musa, Jianxun He, Angus Chu, Jian Huang, and Bert Van Duin. 2018. "A Review of Green Roof Applications for Managing Urban Stormwater in Different Climatic Zones" Sustainability 10, no. 8: 2864. https://doi.org/10.3390/su10082864