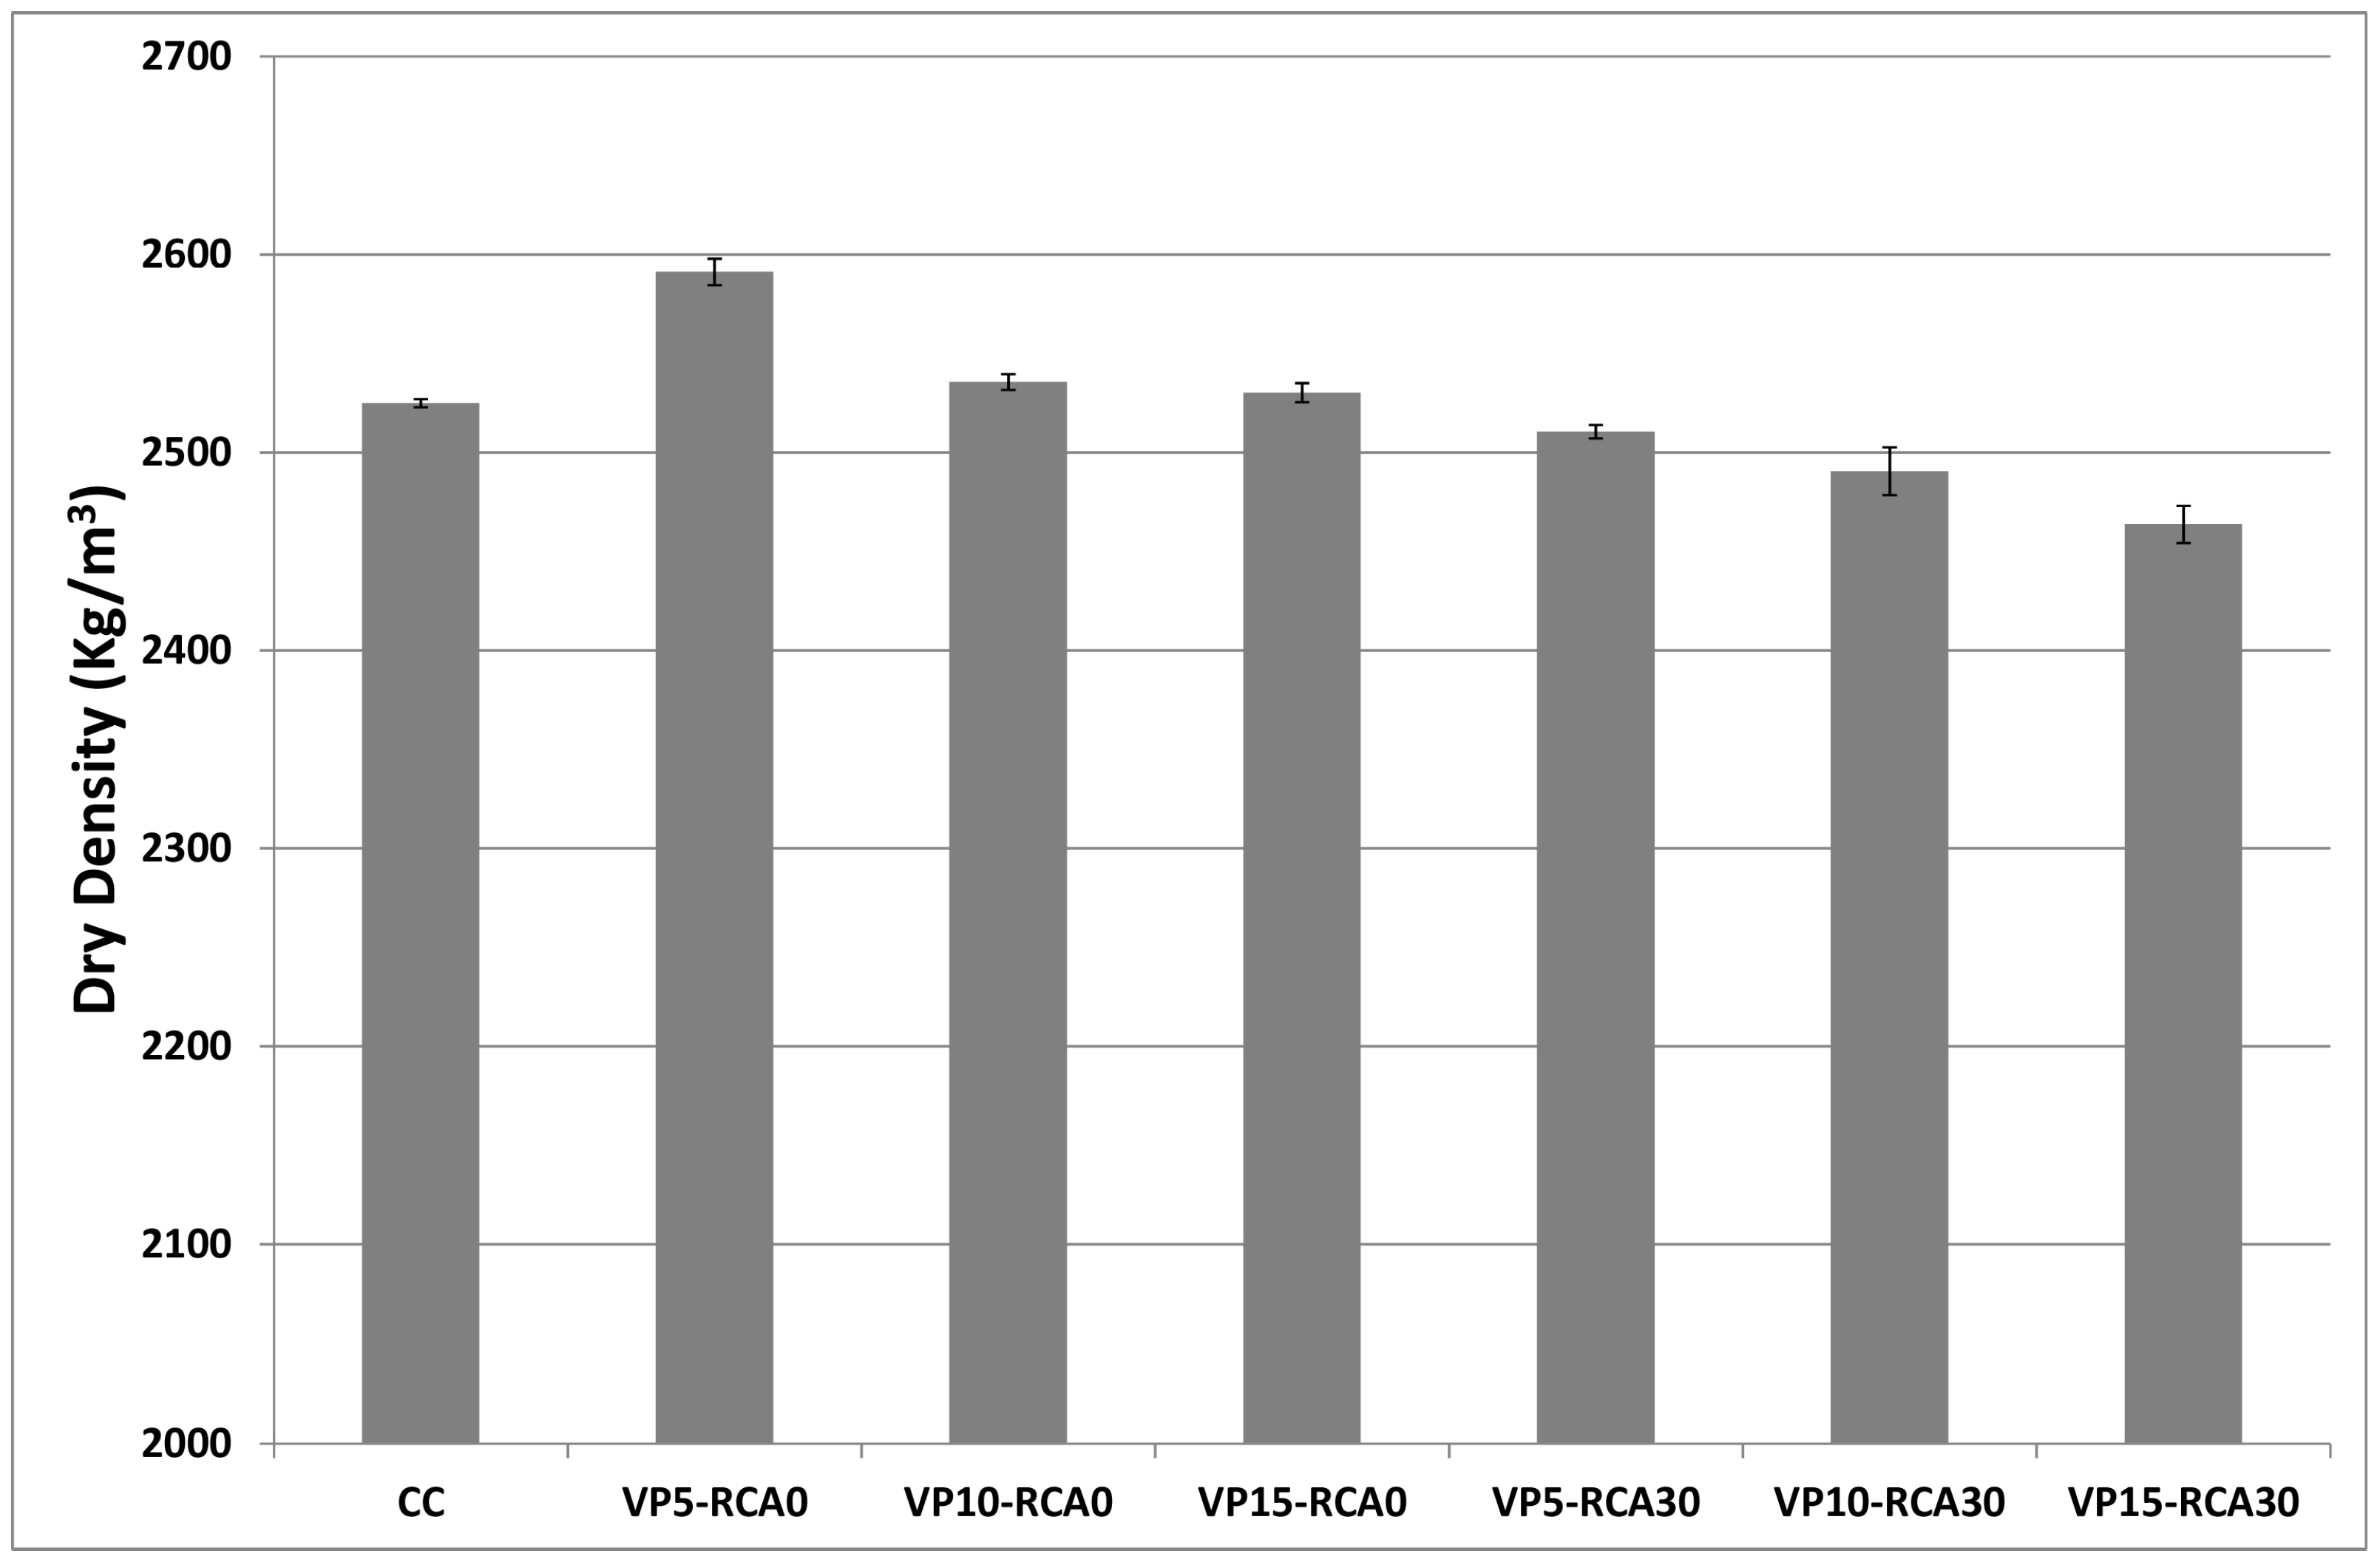
3.1. Density
The dry density of the different concrete series tested after 28 curing days is shown in
Figure 6.
All the series containing VP in the absence of RCA showed slightly higher densities than the CC. Due to the filler effect of the VP, its particles fill the pores of the material, releasing the water trapped in them and increasing the density and compactness of the concrete [
38]. According to Silva et al. [
38], the materials used as cement replacement have a limited filler capacity. Once this limit is reached, the exceeding particles start to occupy the volume of the replaced material (cement in this case), rendering the density dependent only on the relative densities of the cement and the new material. The density of the VP is lower than that noted for the cement, so once the filler limit is reached, the density of the material starts to decrease again, explaining the values obtained in
Figure 6.
The series that contain VP and RCA presented lower densities than the CC, with values that decreased with the rise in the VP content. The RCA have lower densities than the NCA they are replacing and the same occurs with the VP and the cement.
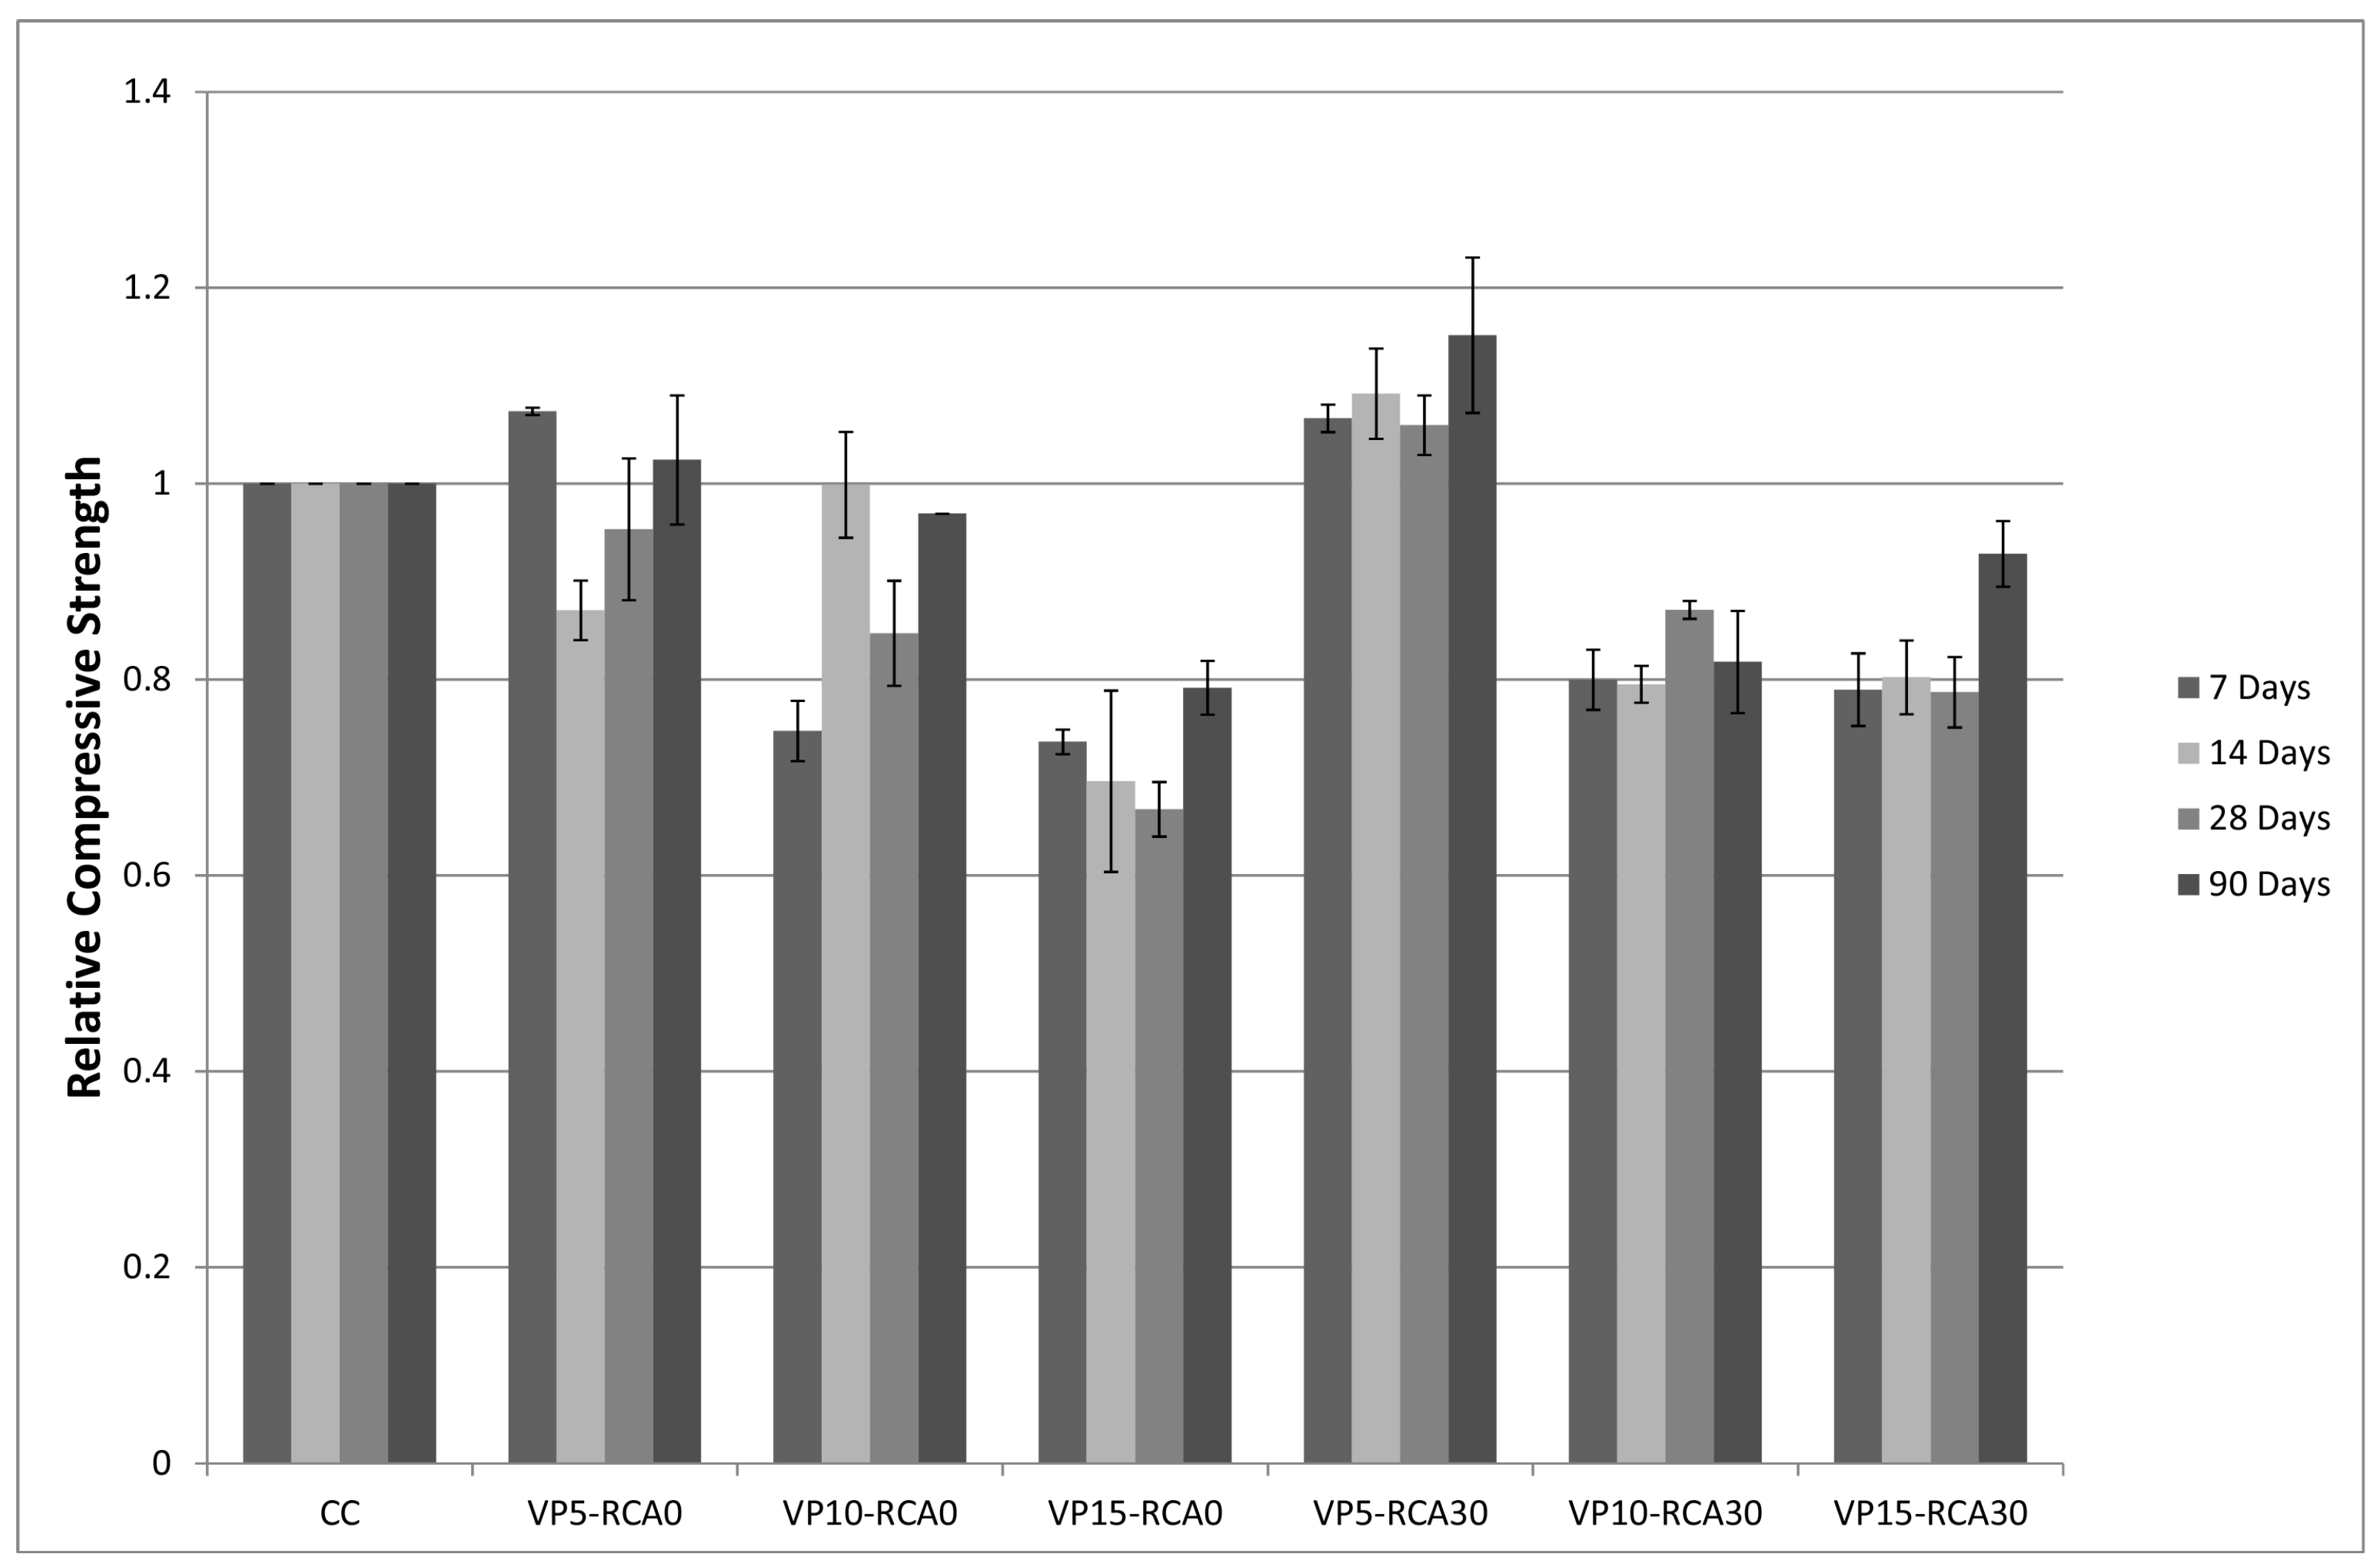
3.2. Compressive Strength
When VP is used in the absence of RCA (series VP5-RCA0, VP10-RCA0, VP15-RCA0), the compressive strength decreased when the replacement percentage increased, especially when the percentage is over 10%. After 28 curing days, the concretes with 5%, 10% and 15% replacements presented compressive strength losses of 5%, 15% and 33% compared to the CC value. These results agree with those from previous studies [
12,
14]. However, after 90 curing days, a decrease was noted in the strength losses (
Figure 7) and the specimens with 5%, 10% and 15% VP replacements presented differences of +2%, −3% and −21%, respectively.
A similar behavior has been observed when both residues were used simultaneously (series VP5-RCA30, VP10-RCA30, VP15-RCA30). The most important losses in the compressive strength were observed when over 10% of cement was is replaced for VP. After 28 curing days, the concretes with 5%, 10% and 15% VP replacements showed strength differences of +6%, −13% and −21% respectively compared to the CC values. However, after 90 curing days, a significant reduction was observed in these differences (
Figure 7), since the concretes with 5%, 10% and 15% VP replacements showed differences of +15%, −18% and −7 compared to CC values.
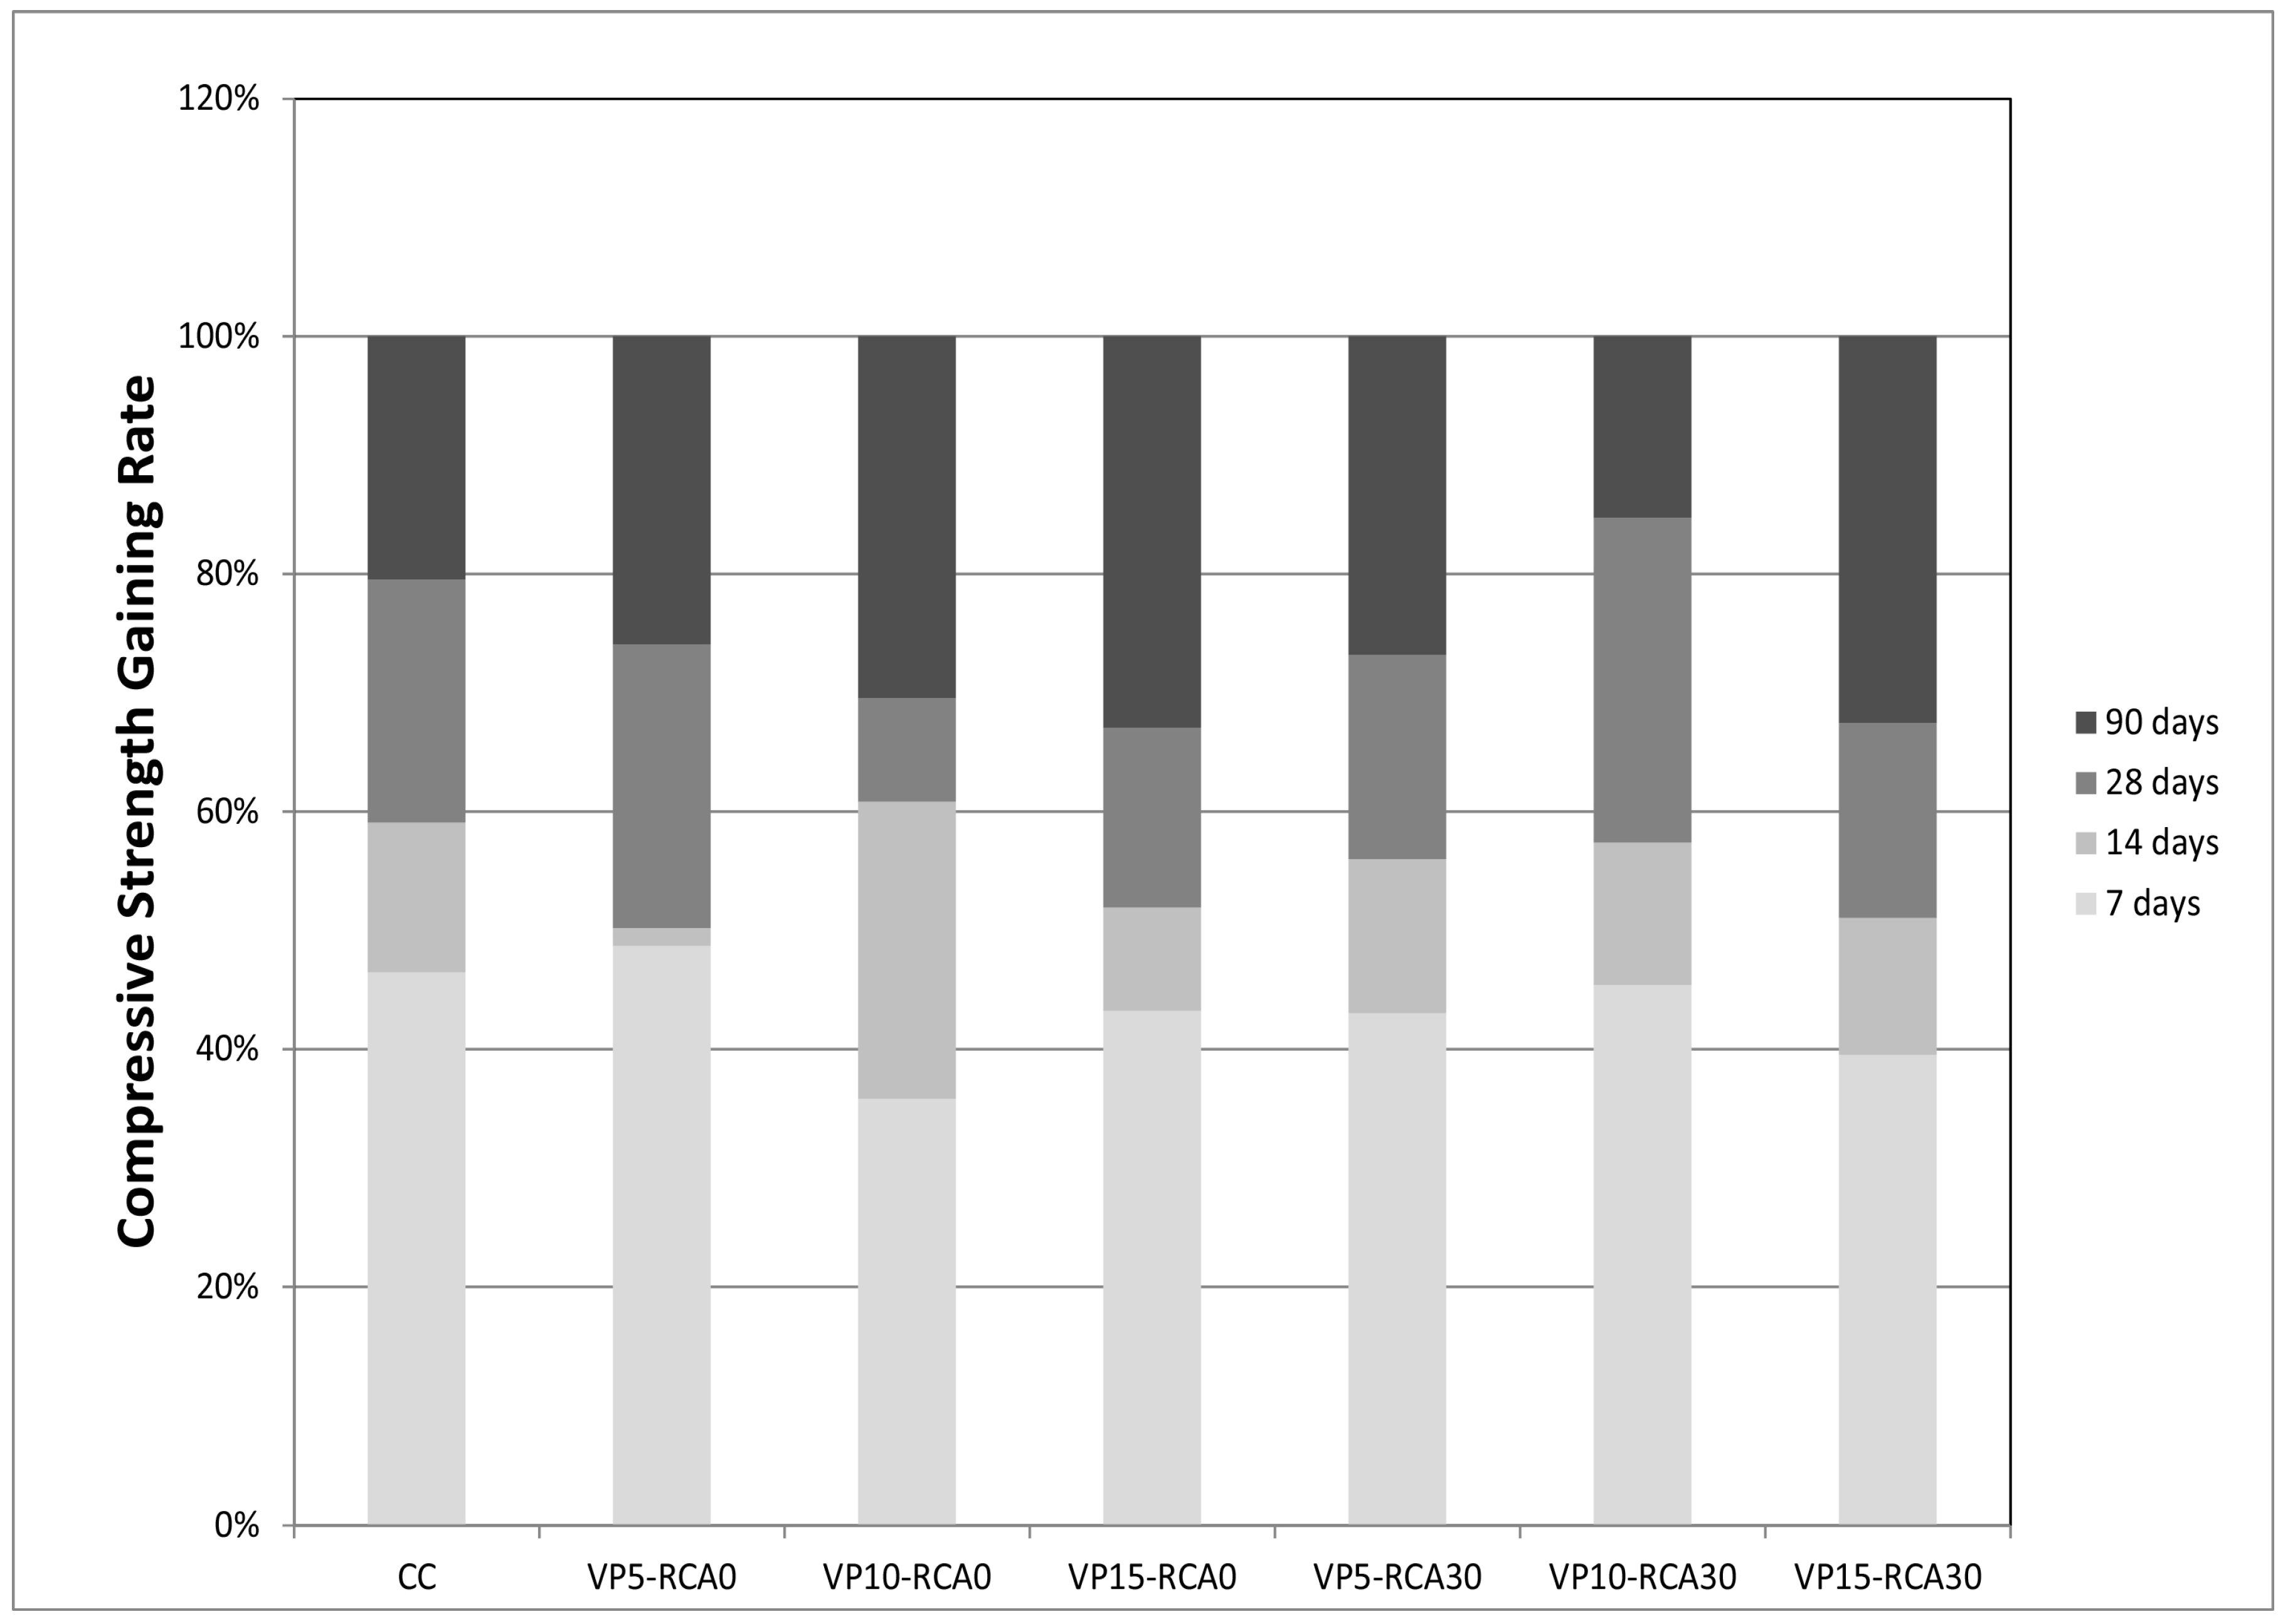
Figure 8 analyses the development of the strength with the curing days.
Compared to CC, recycled concretes presented a higher gaining rate after 28 curing days. CC shows a 20% strength increase after 28 curing days, whereas concretes without RCA but with VP replacement showed strength gaining rates after 28 days, which increased with the amount of VP, with values of 26%, 31% and 33% for the series VP5-RCA0, VP10-RCA0 and VP15-RCA0, respectively. After 28 curing days, concretes with both recycled materials presented gaining rates of 27%, 15% and 33% for the series VP5-RCA30, VP10-RCA30 and VP15-RCA30, respectively. The strength increase after a relatively long curing time (90 days) for concretes with both recycled materials could be attributed to the pozzolanic reaction between the reactive silica in the VP and free Ca(OH)
2 at late ages. Labbaci et al. [
2] reported equivalent results, concluding that VP improves compressive strength because it produces a secondary calcium silicate hydrate(C-S-H) reaction. During the hydration process of cement, the reaction between free Ca(OH)
2 and VP leads to a more impermeable matrix because of the refinement of the pore structure [
12,
14,
39]. Consequently, the compressive strengths of concretes containing VP are comparable to those of the control concrete for long-term curing.
Furthermore, a remarkable effect occurs when studying the combination of 5% VP replacement and 30% RCA (samples VP5-RCA30). Results showed how (see
Figure 7) this combination seems not only to avoid strength losses but strengthens the concrete. Hossain and Lachemi [
39] considered that the pozzolanic reactivity of VP consumes the calcium hydroxide that results from the cement hydration. The silica content of the supplementary cementitious materials reacts with the calcium hydroxide present, not only in the cement but also in the mortar that remains adhered to the RCA [
40,
41], increasing this effect and making the VP capable of compensating for the weaknesses produced by the RCA. Following this hypothesis and in view of the results obtained, there is an optimal percentage of VP replacement, after which the microstructure enhancement is no longer possible and the strengthening of the material ceases. From the results found here, this optimal content may vary depending on the nature of the aggregates used.
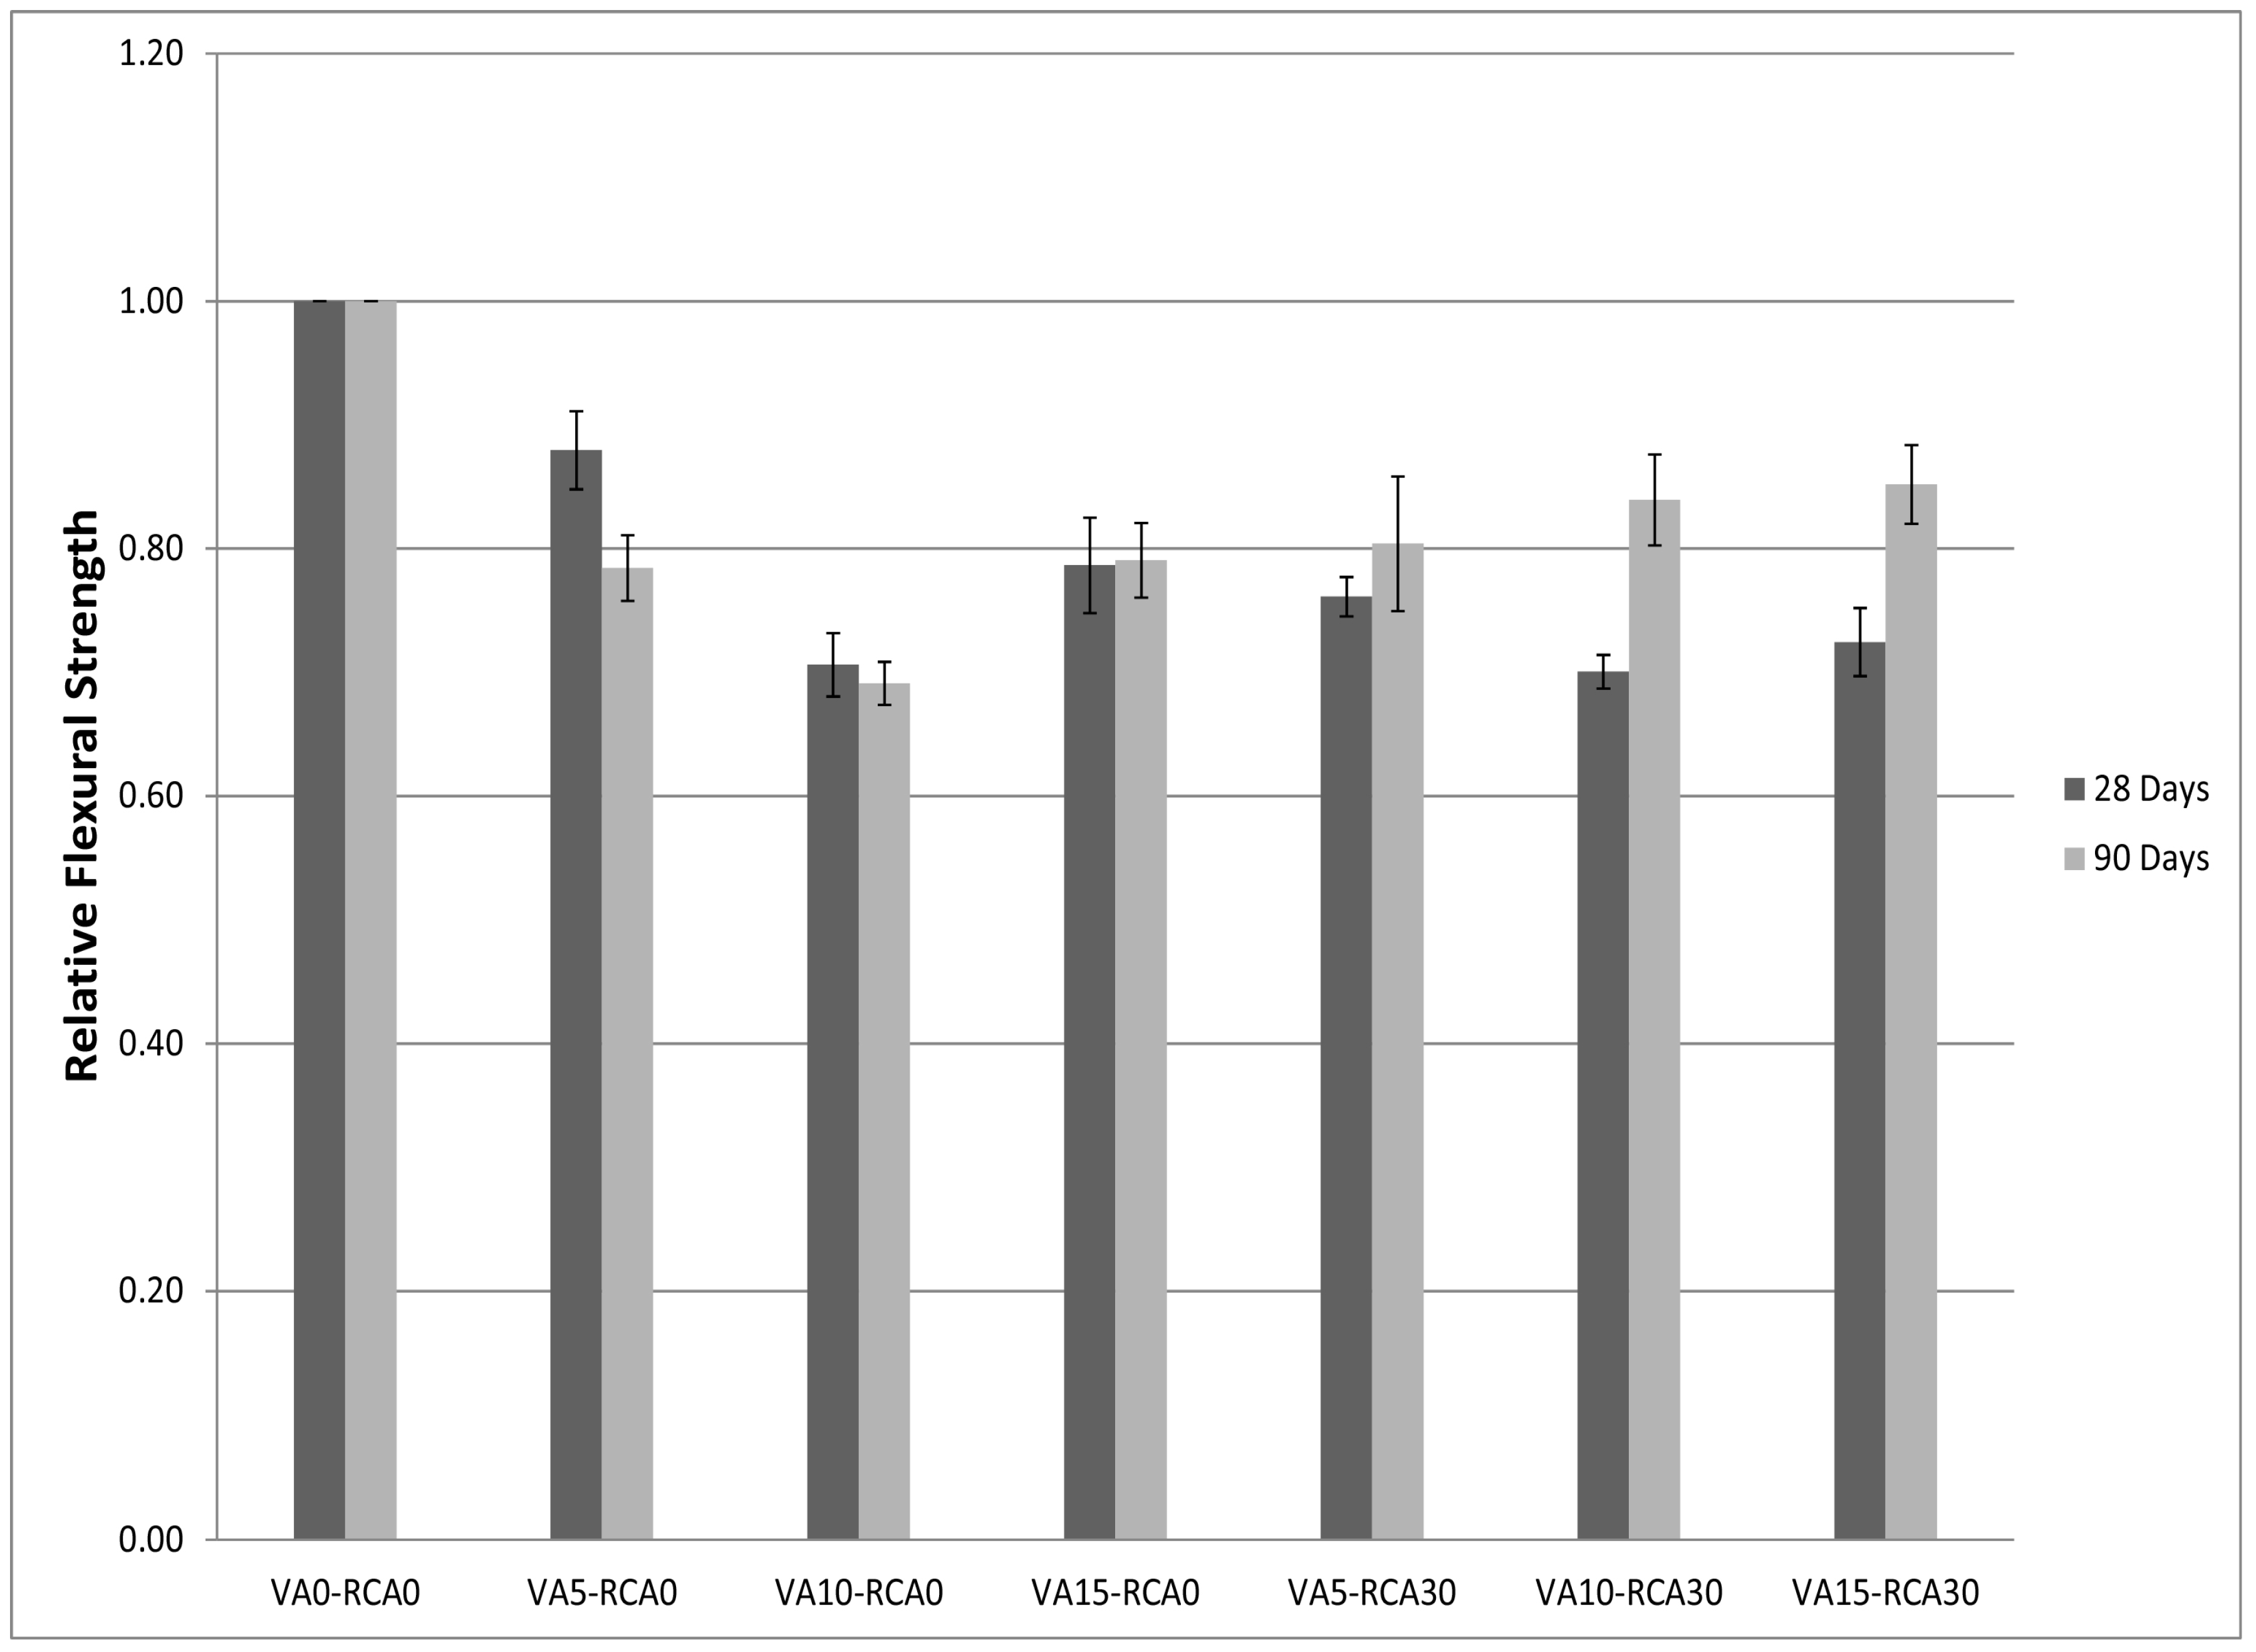
3.3. Flexural Strength
When VP was used with no RCA, the flexural strength after 28 curing days presented losses compared to CC values of 12%, 29% and 21% for the series VP5-RCA0, VP10-RCA0, VP15-RCA0, respectively (
Figure 9). After 90 curing days, the losses for those series increased up to 22%, 31% and 21% respectively.
When both VP and RCA are used together, the flexural strength tested after 28 curing days presented higher losses than the CC, the values of which were 24%, 30% and 28% for the series VP5-RCA30, VP10-RCA30 and VP15-RCA30, respectively. These decreases can be attributed to the use of RCA. According to Puthussery et al. [
42], this effect may be due to the water absorption capacity and the porous nature of RCA and the mortar adhered to their surfaces. Other studies agree with these hypotheses on the use of RCA [
19,
43], concluding that a loss of around 10% seems unavoidable when the flexural strength is analysed, even though the compressive strength values may present no losses.
Increasing the curing time up to 90 days, these losses were reduced to 20%, 16% and 15% for the series VP5-RCA30, VP10-RCA30 and VP15-RCA30, respectively. With long-term curing, the amorphous silica present in the VP and the calcium hydroxide (Ca(OH)
2) present in the pores of the RCA mortar and the cement matrix, would react and form C-S-H, which enhances the strength of the mixture and improves the interface between the cement paste and the aggregates [
44].
3.5. Comparison with Technical Regulations
To compare the experimental behaviour of concrete made using recycled materials with the values estimated by technical regulations, the equations proposed by ACI 318 and Eurocode 2 (EC2) for evaluating the flexural strength and the static elastic modulus, calculated using the 28-day compressive strength, were used.
ACI 318 proposes the following equations:
EC2 proposes the following equations:
where
fr is the flexural strength;
Ec is the static elastic modulus;
f′c is the compressive strength after 28 curing days;
fctm,fl is the flexural strength following EC2;
h is the height of the specimen; and
fctm is the mean flexural strength obtained using
fctm=0.3
(fck)2/3, where
fck are the experimental values obtained for the compressive strength minus 8 MPa.
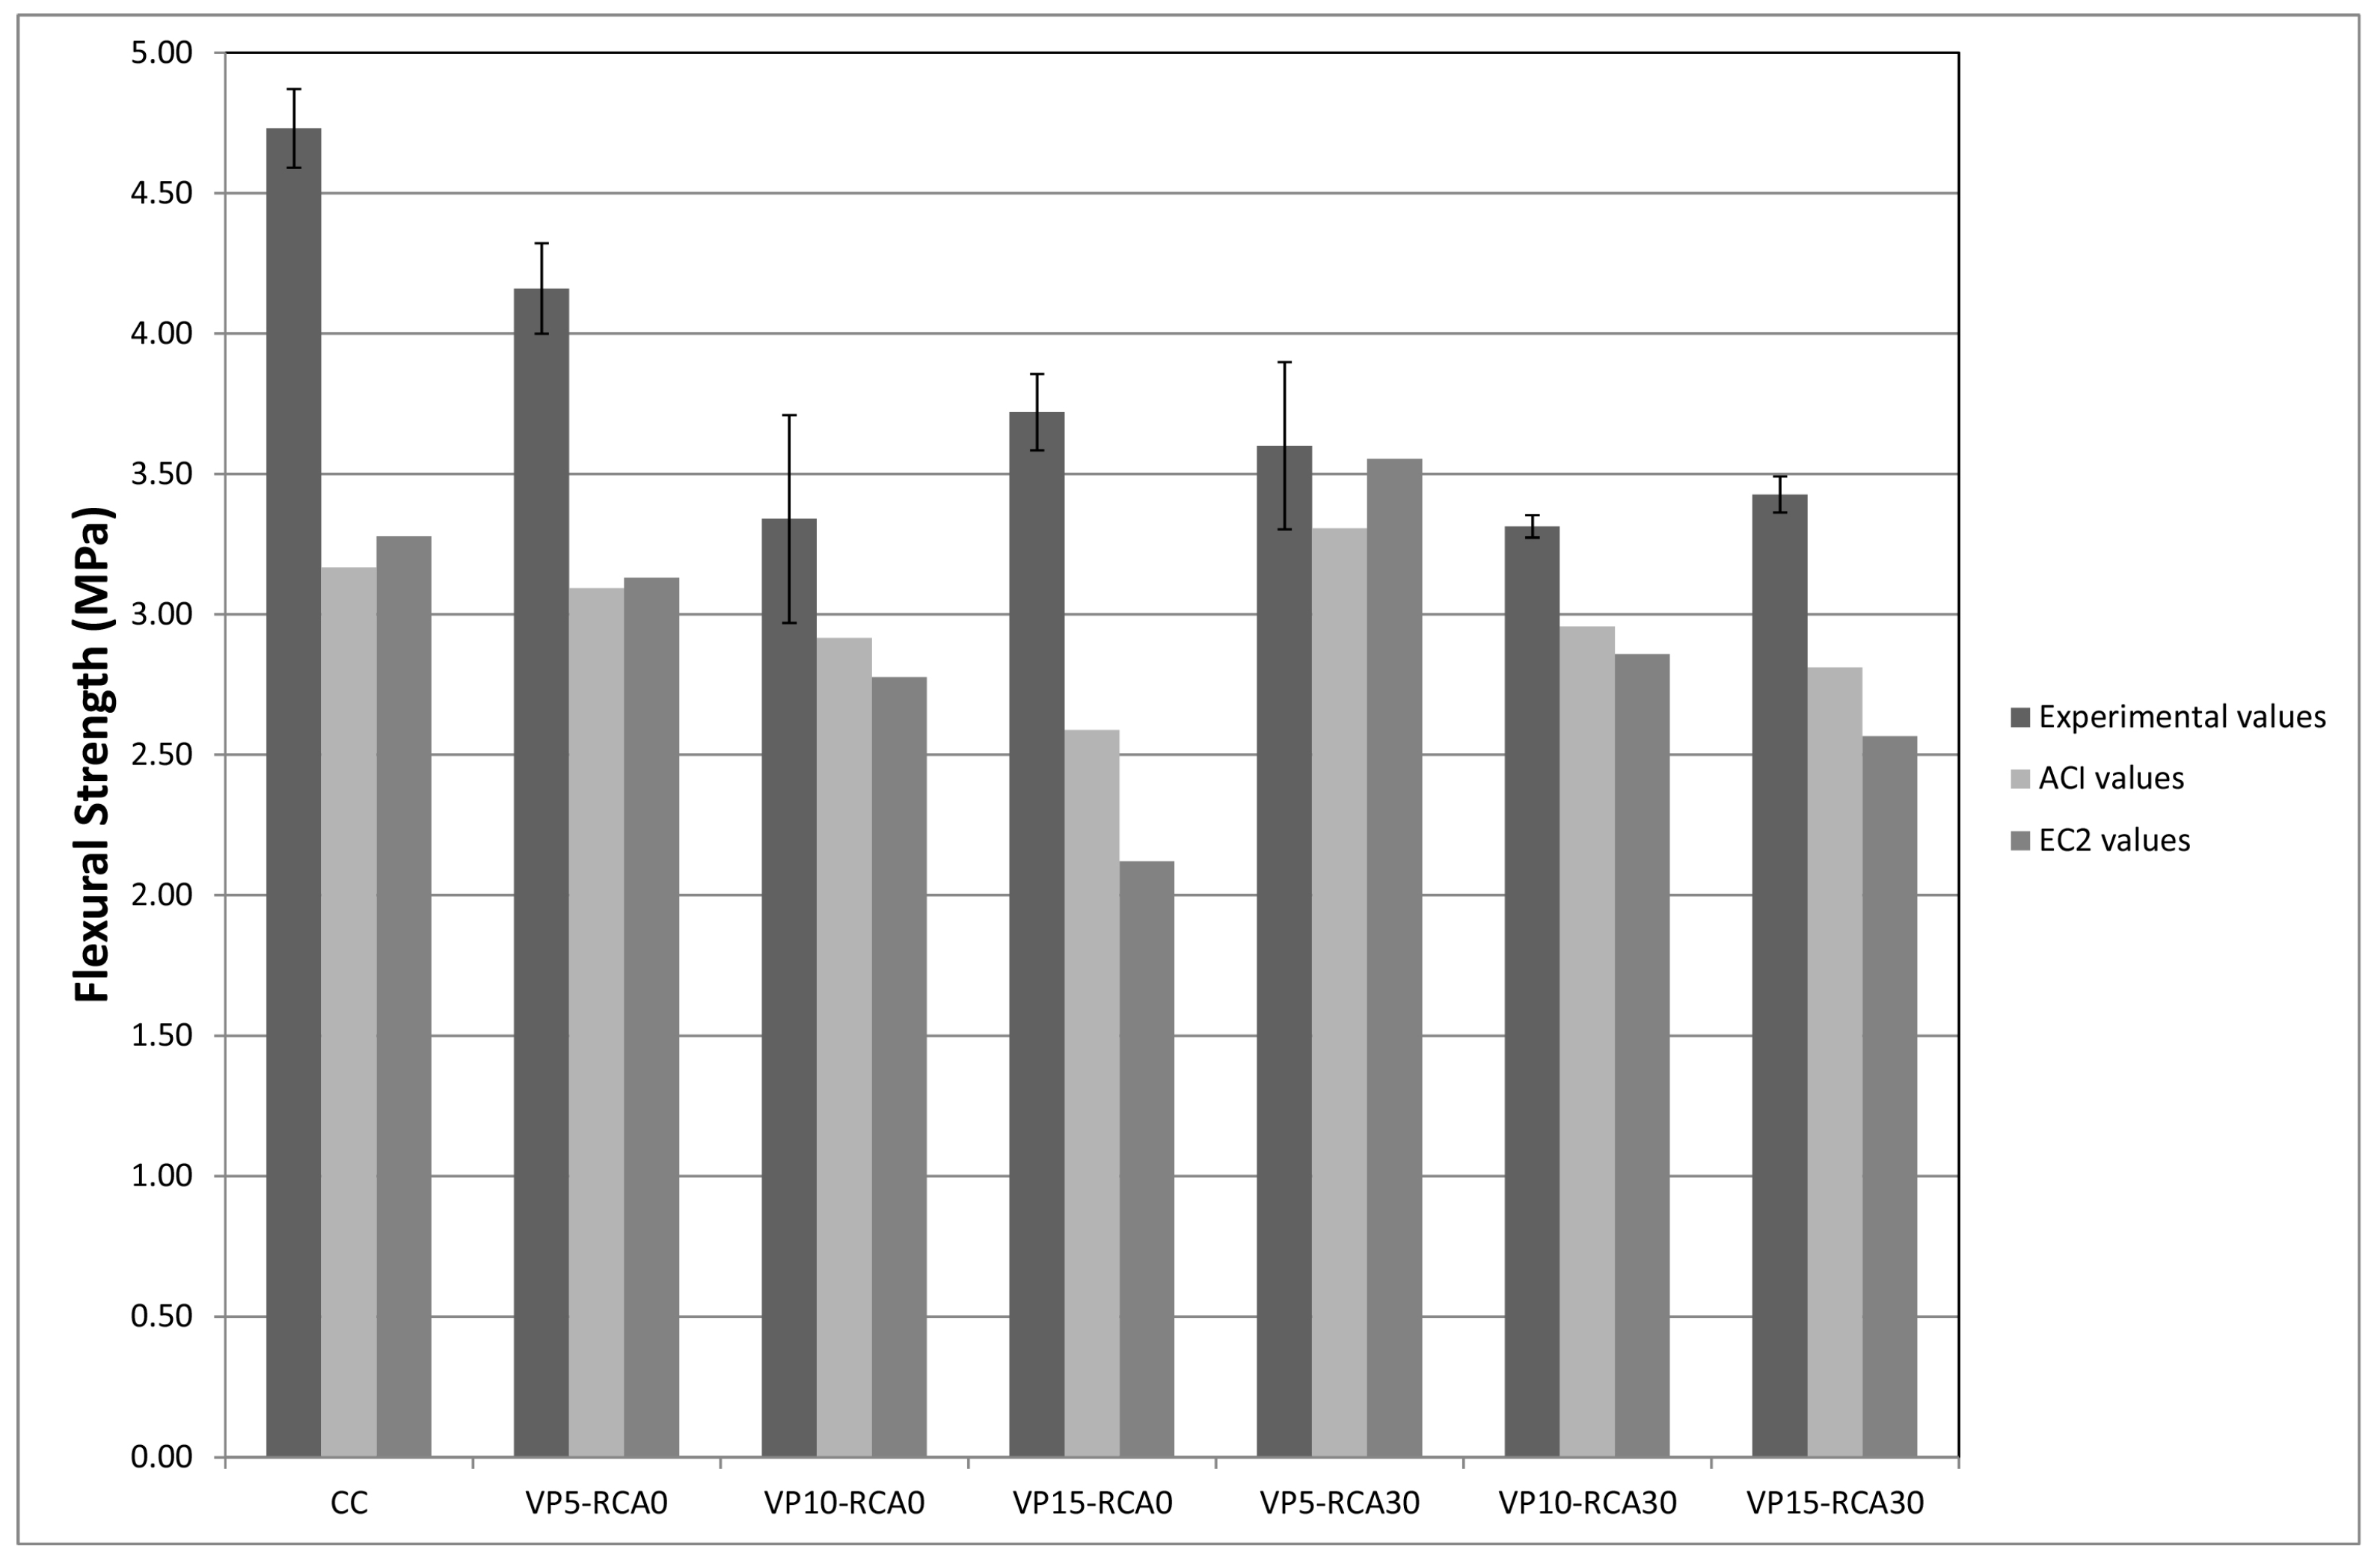
Figure 11 shows the results obtained for the flexural strength applying Equations (2) and (4).
Experimental values for CC were 49% higher than those estimated using ACI (Equation (2)). When VP was used without RCA, the experimental values exceeded the theoretical ACI ones in the range of 15% to 44%, whereas these values decreased when RCA was added to the mixture, limiting the increase in the flexural strength in the range of 9% to 22%. Comparable results have been obtained for CC considering EC2 (Equation (4)); in this case, the increase was 44%. When VP is used without RCA experimental values exceeded theoretical ACI ones in the range of 20% to 75%, whereas these values decreased when RCA was added to the mixture, limiting the increase in the flexural strength the range of 1% to 34%.
It has been demonstrated that many factors have an influence on the flexural strength, such as the size of the sample, the curing conditions, the type of binder and the strength level of the concrete [
45]. Many researchers have studied the effects of each of these factors. Raphael [
46] concluded that one of the reasons for the variations between the measured and estimated flexural strength values is that the equations used come from the elastic theory, which assumes an elastic behaviour of concrete until failure.
In this study, all the flexural strengths estimated by technical regulations were always lower than the values obtained experimentally, which would not produce an overvaluation of this parameter from a design point of view.
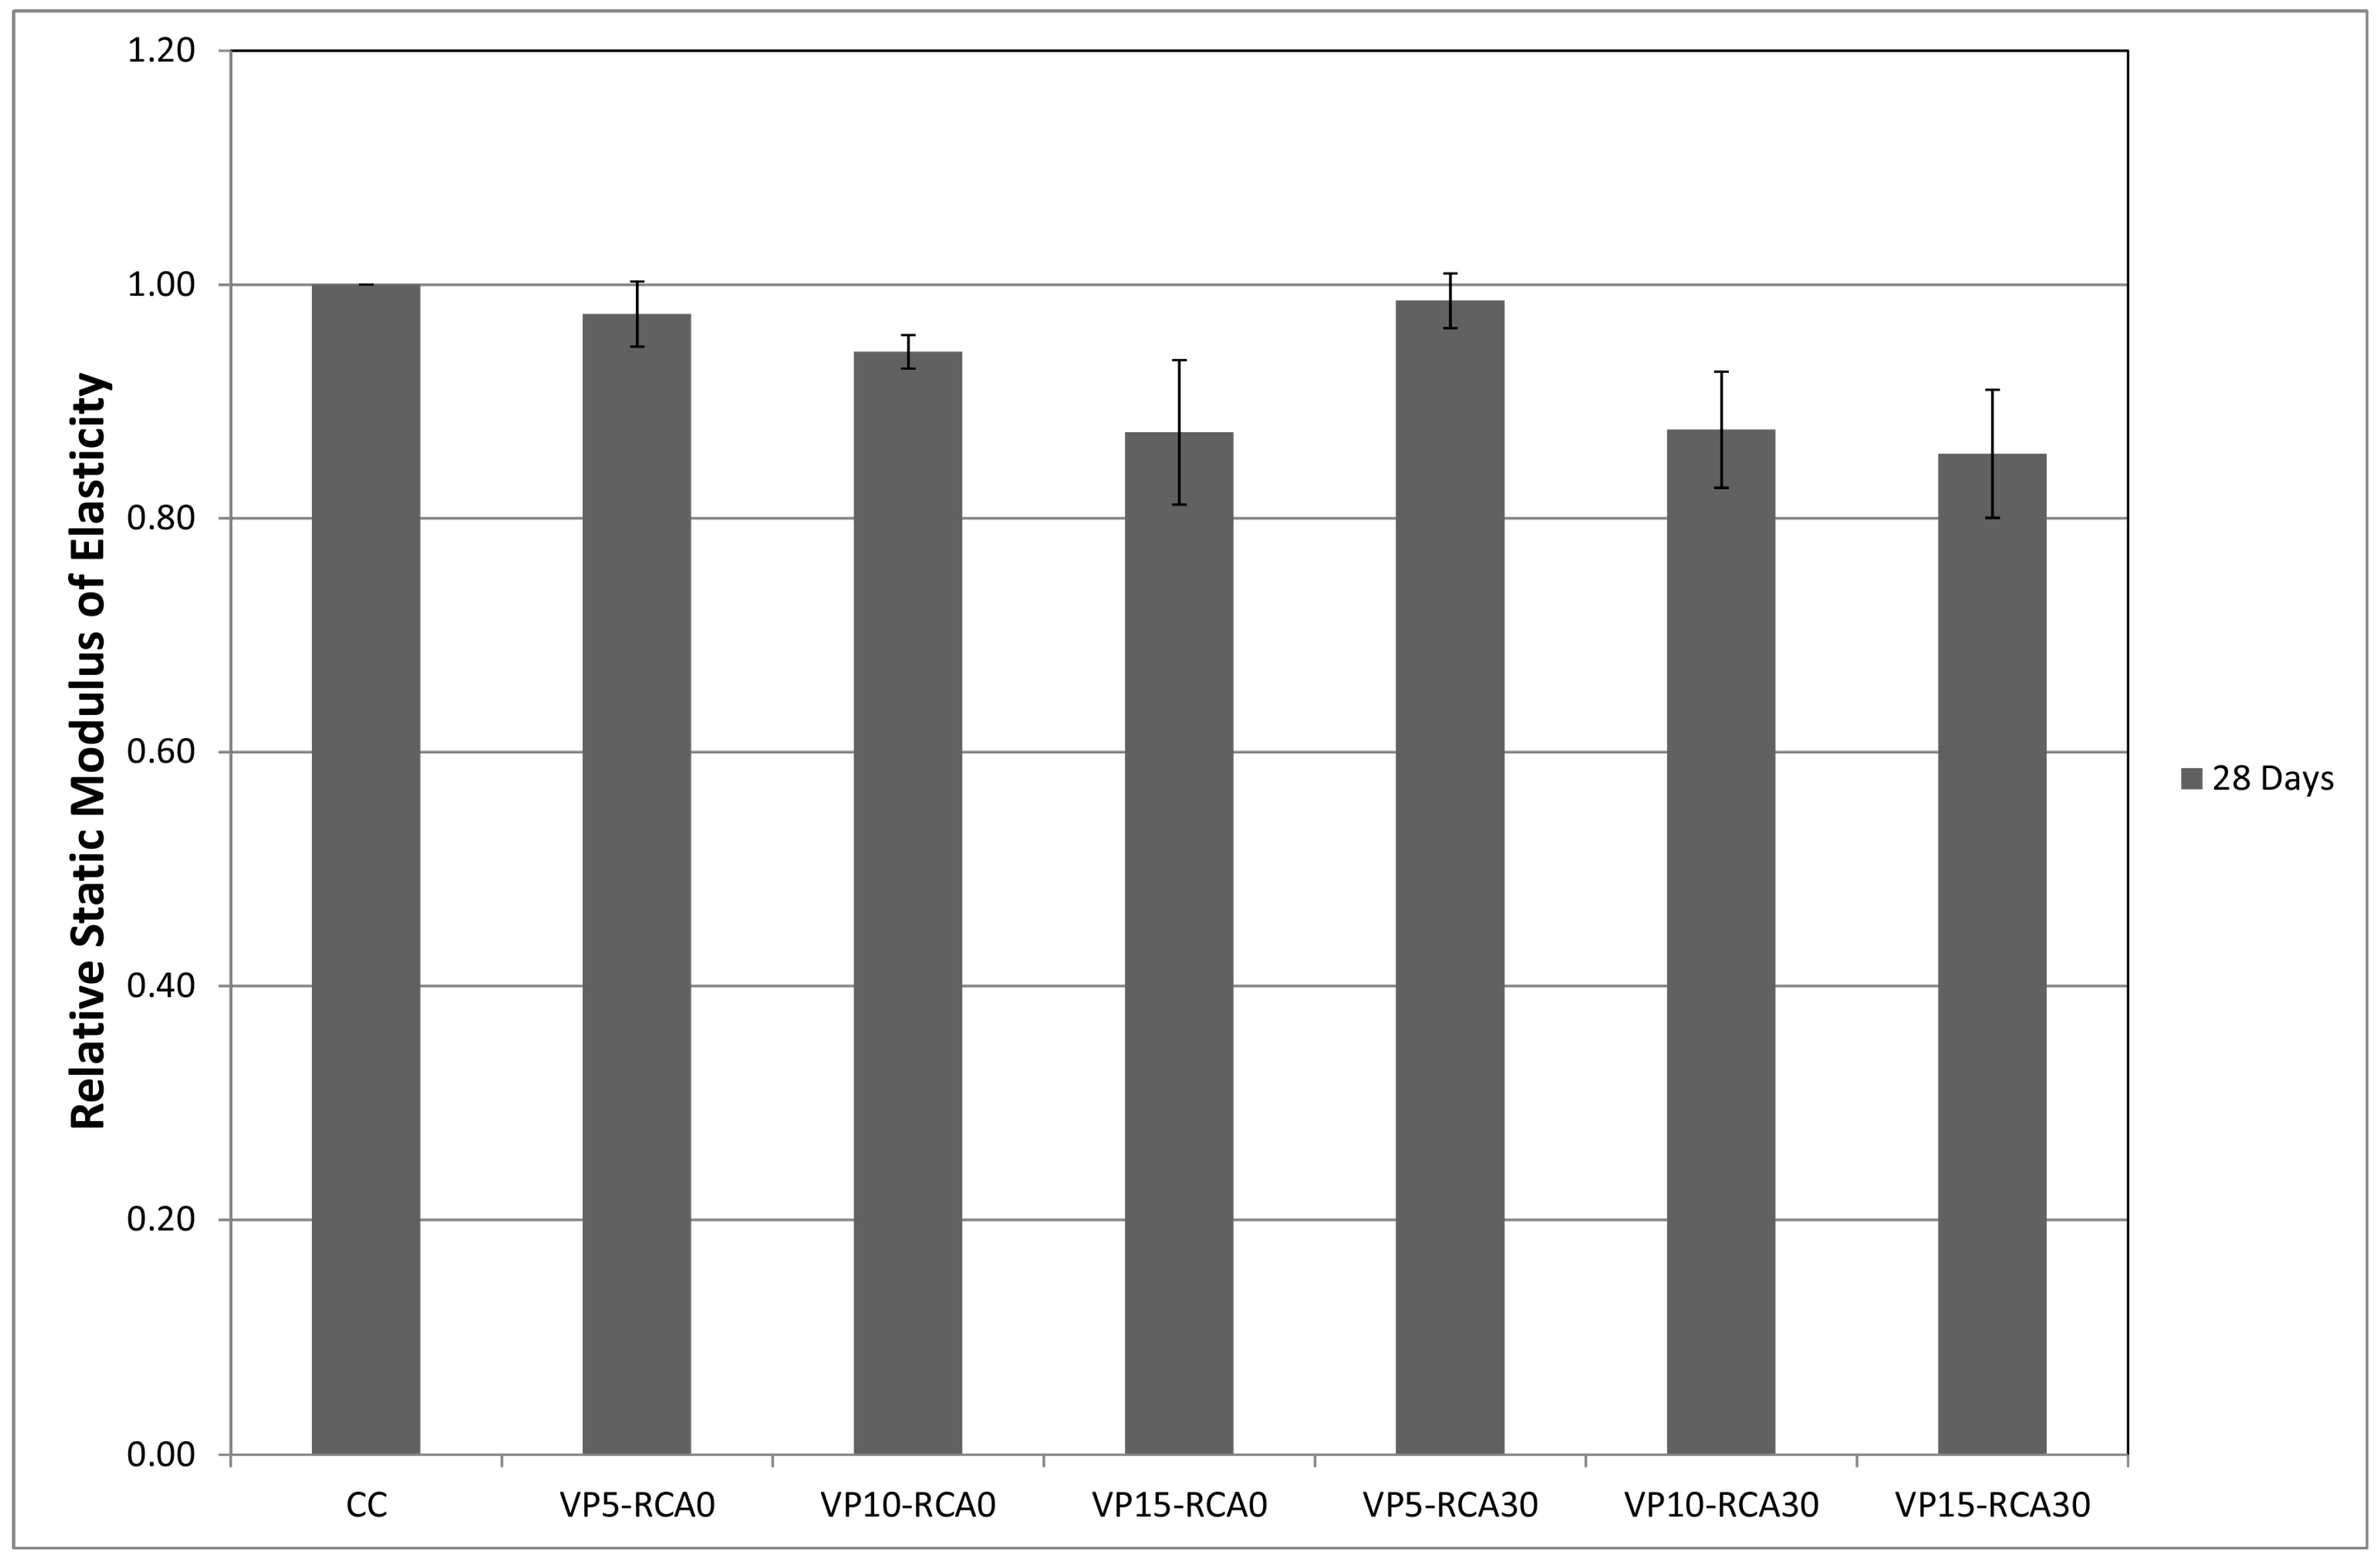
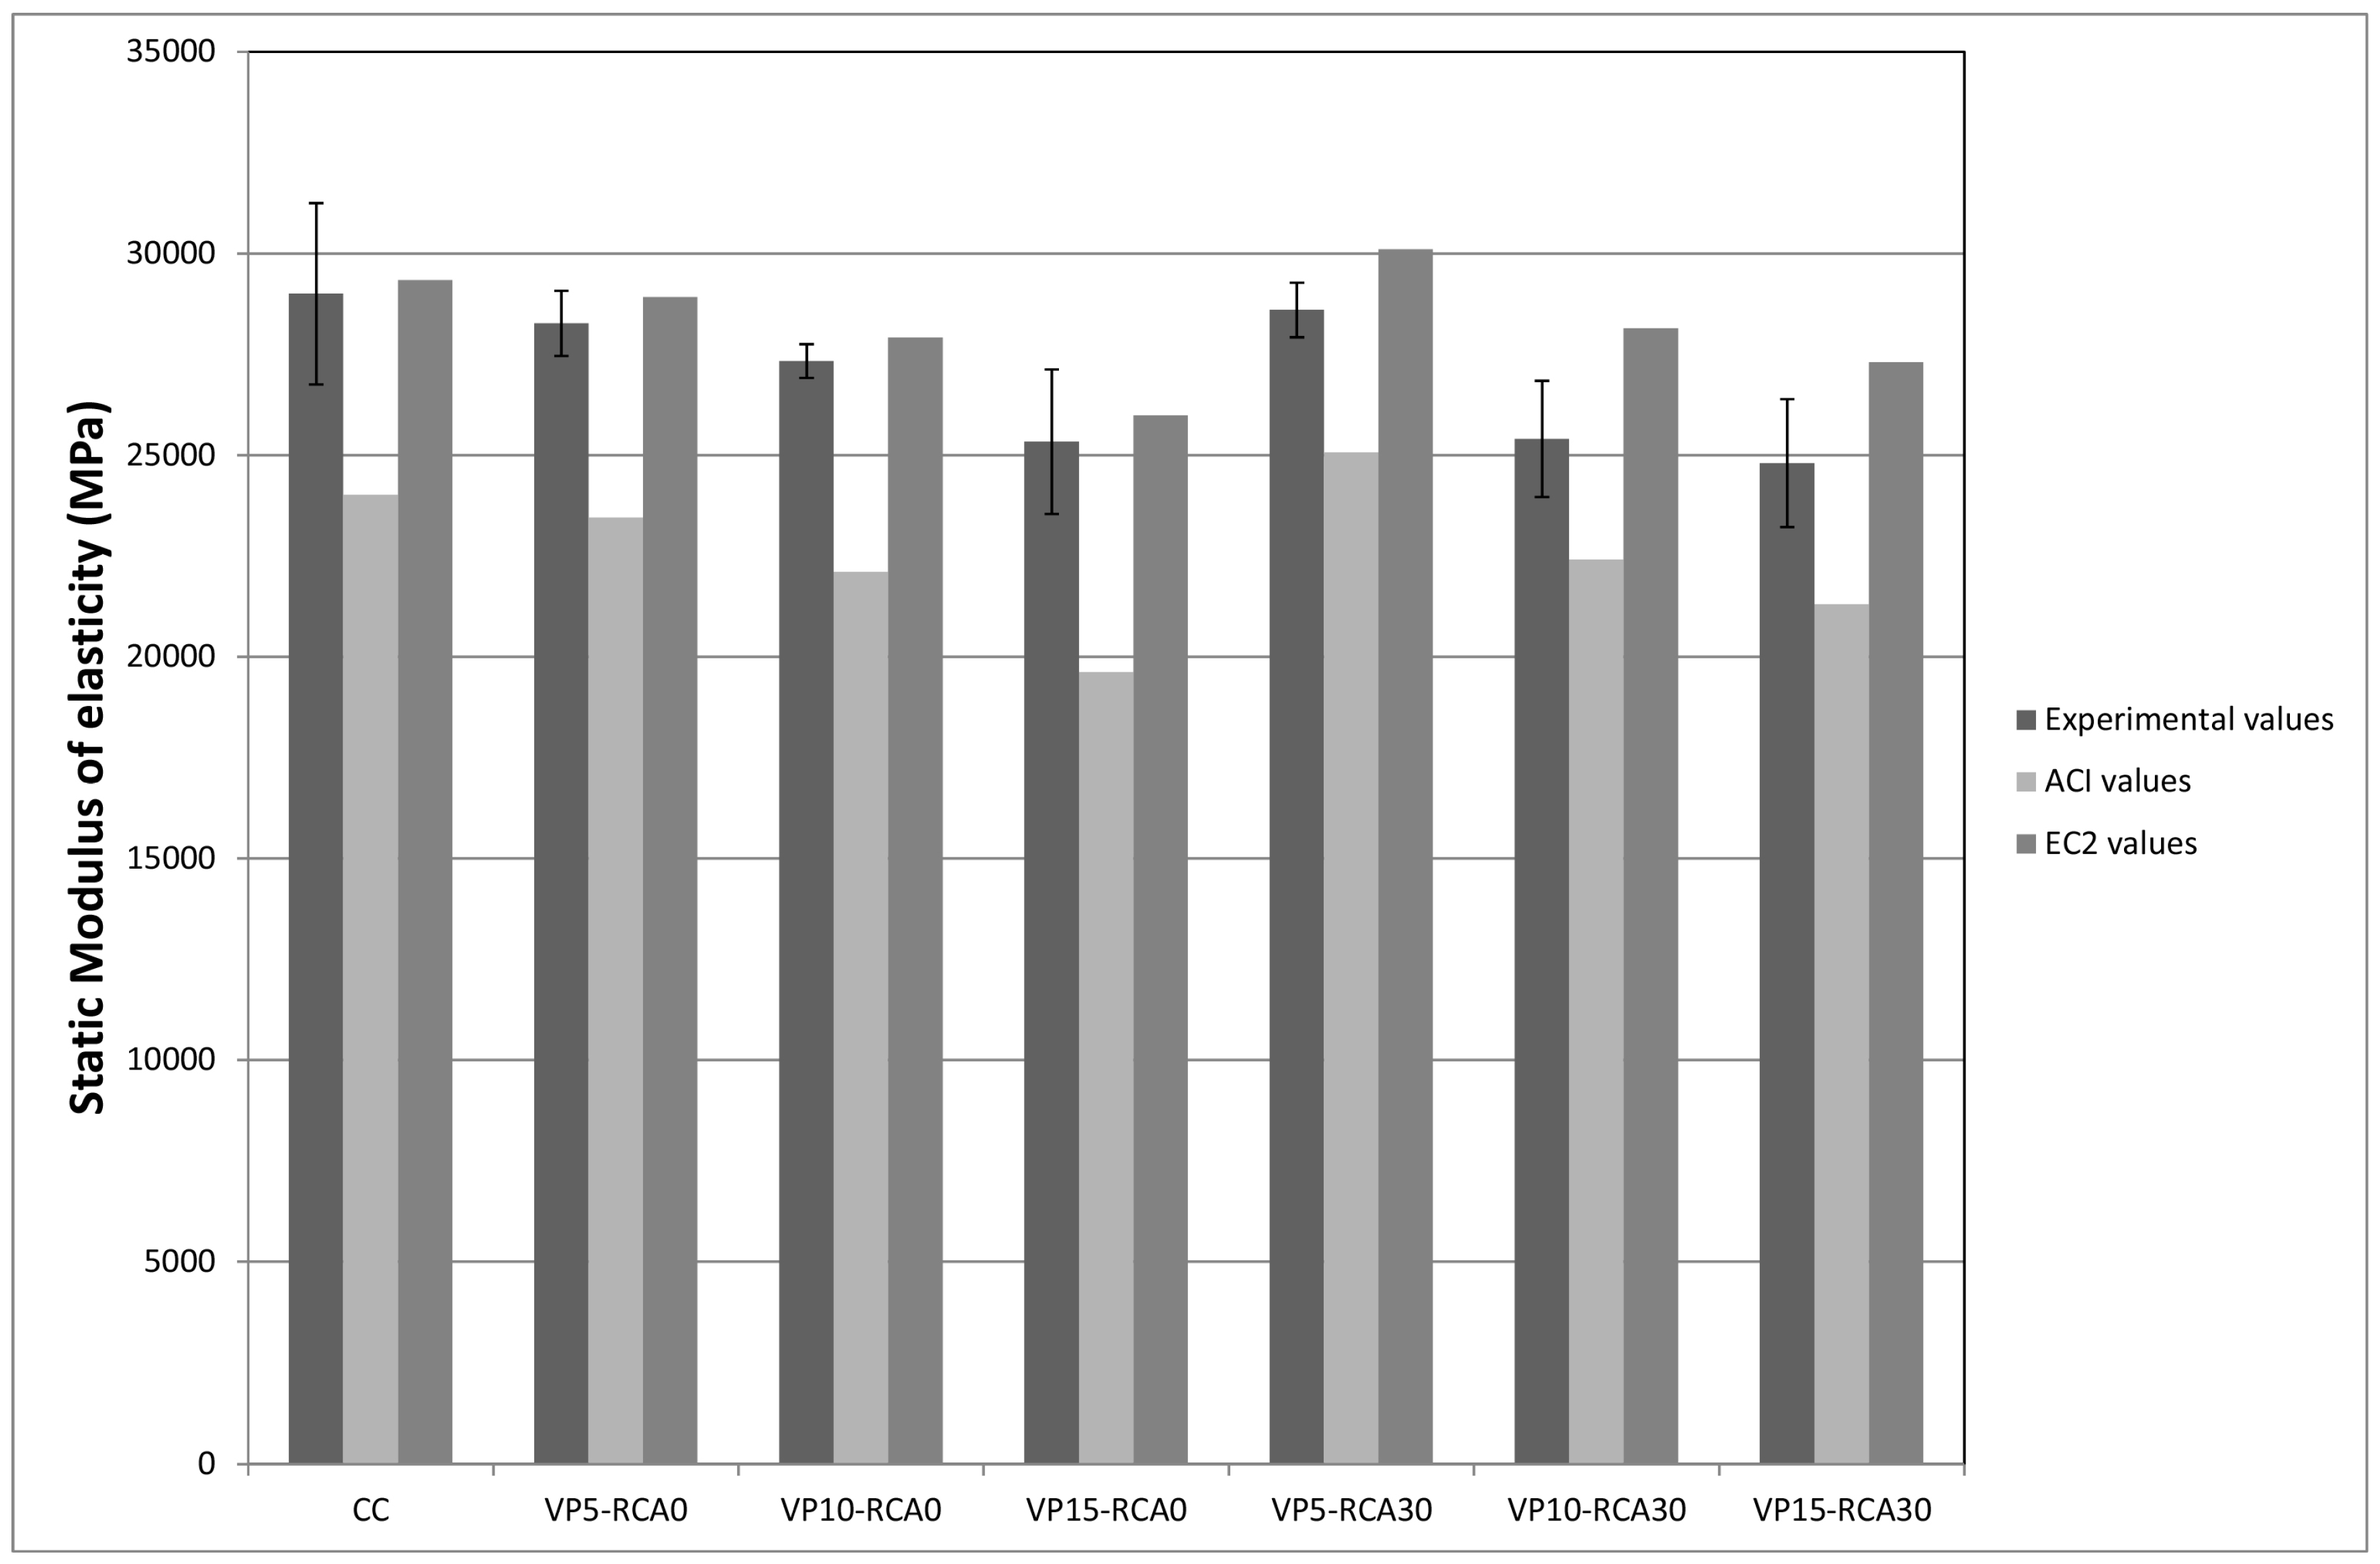
Figure 12 shows the results obtained for the static elastic modulus.
When the ACI (Equation (3)) was applied, experimental CC values were 21% higher than the theoretical ones. When VP was used without RCA, experimental values were between 21% and 29% higher than theoretical ones. Again, these values decreased when RCA was added, being between 13% and 16%. On the other hand, when applying EC2 (Equation (5)), experimental CC values were 1% lower than theoretical ones. When VP was used without RCA, experimental values were between 2% and 3% lower than theoretical ones. This decrease became more significant (5% and 10%) when RCA were added.
According to Vakhshouri and Nejadi [
47], the elastic modulus depends on several parameters, such as the load conditions, the cement matrix characteristics, the properties of the interfacial transition zone, the elastic modulus of the aggregates and their volumetric fraction, among others. Therefore, the differences observed between the values of the elastic modulus estimated by the different codes or technical regulations could be due mainly to the fact that each code uses equations established according to the local characteristics of the concretes. In addition to this, when recycled materials are used, the codes are not always capable of predicting the behaviour of these concretes conservatively, making it necessary to consider special equations for designing structures with recycled concretes. In this work, the results reveal that the use of EC2 equations to estimate the static elastic modulus is not as conservative as desirable when recycled materials are incorporated into the concrete.
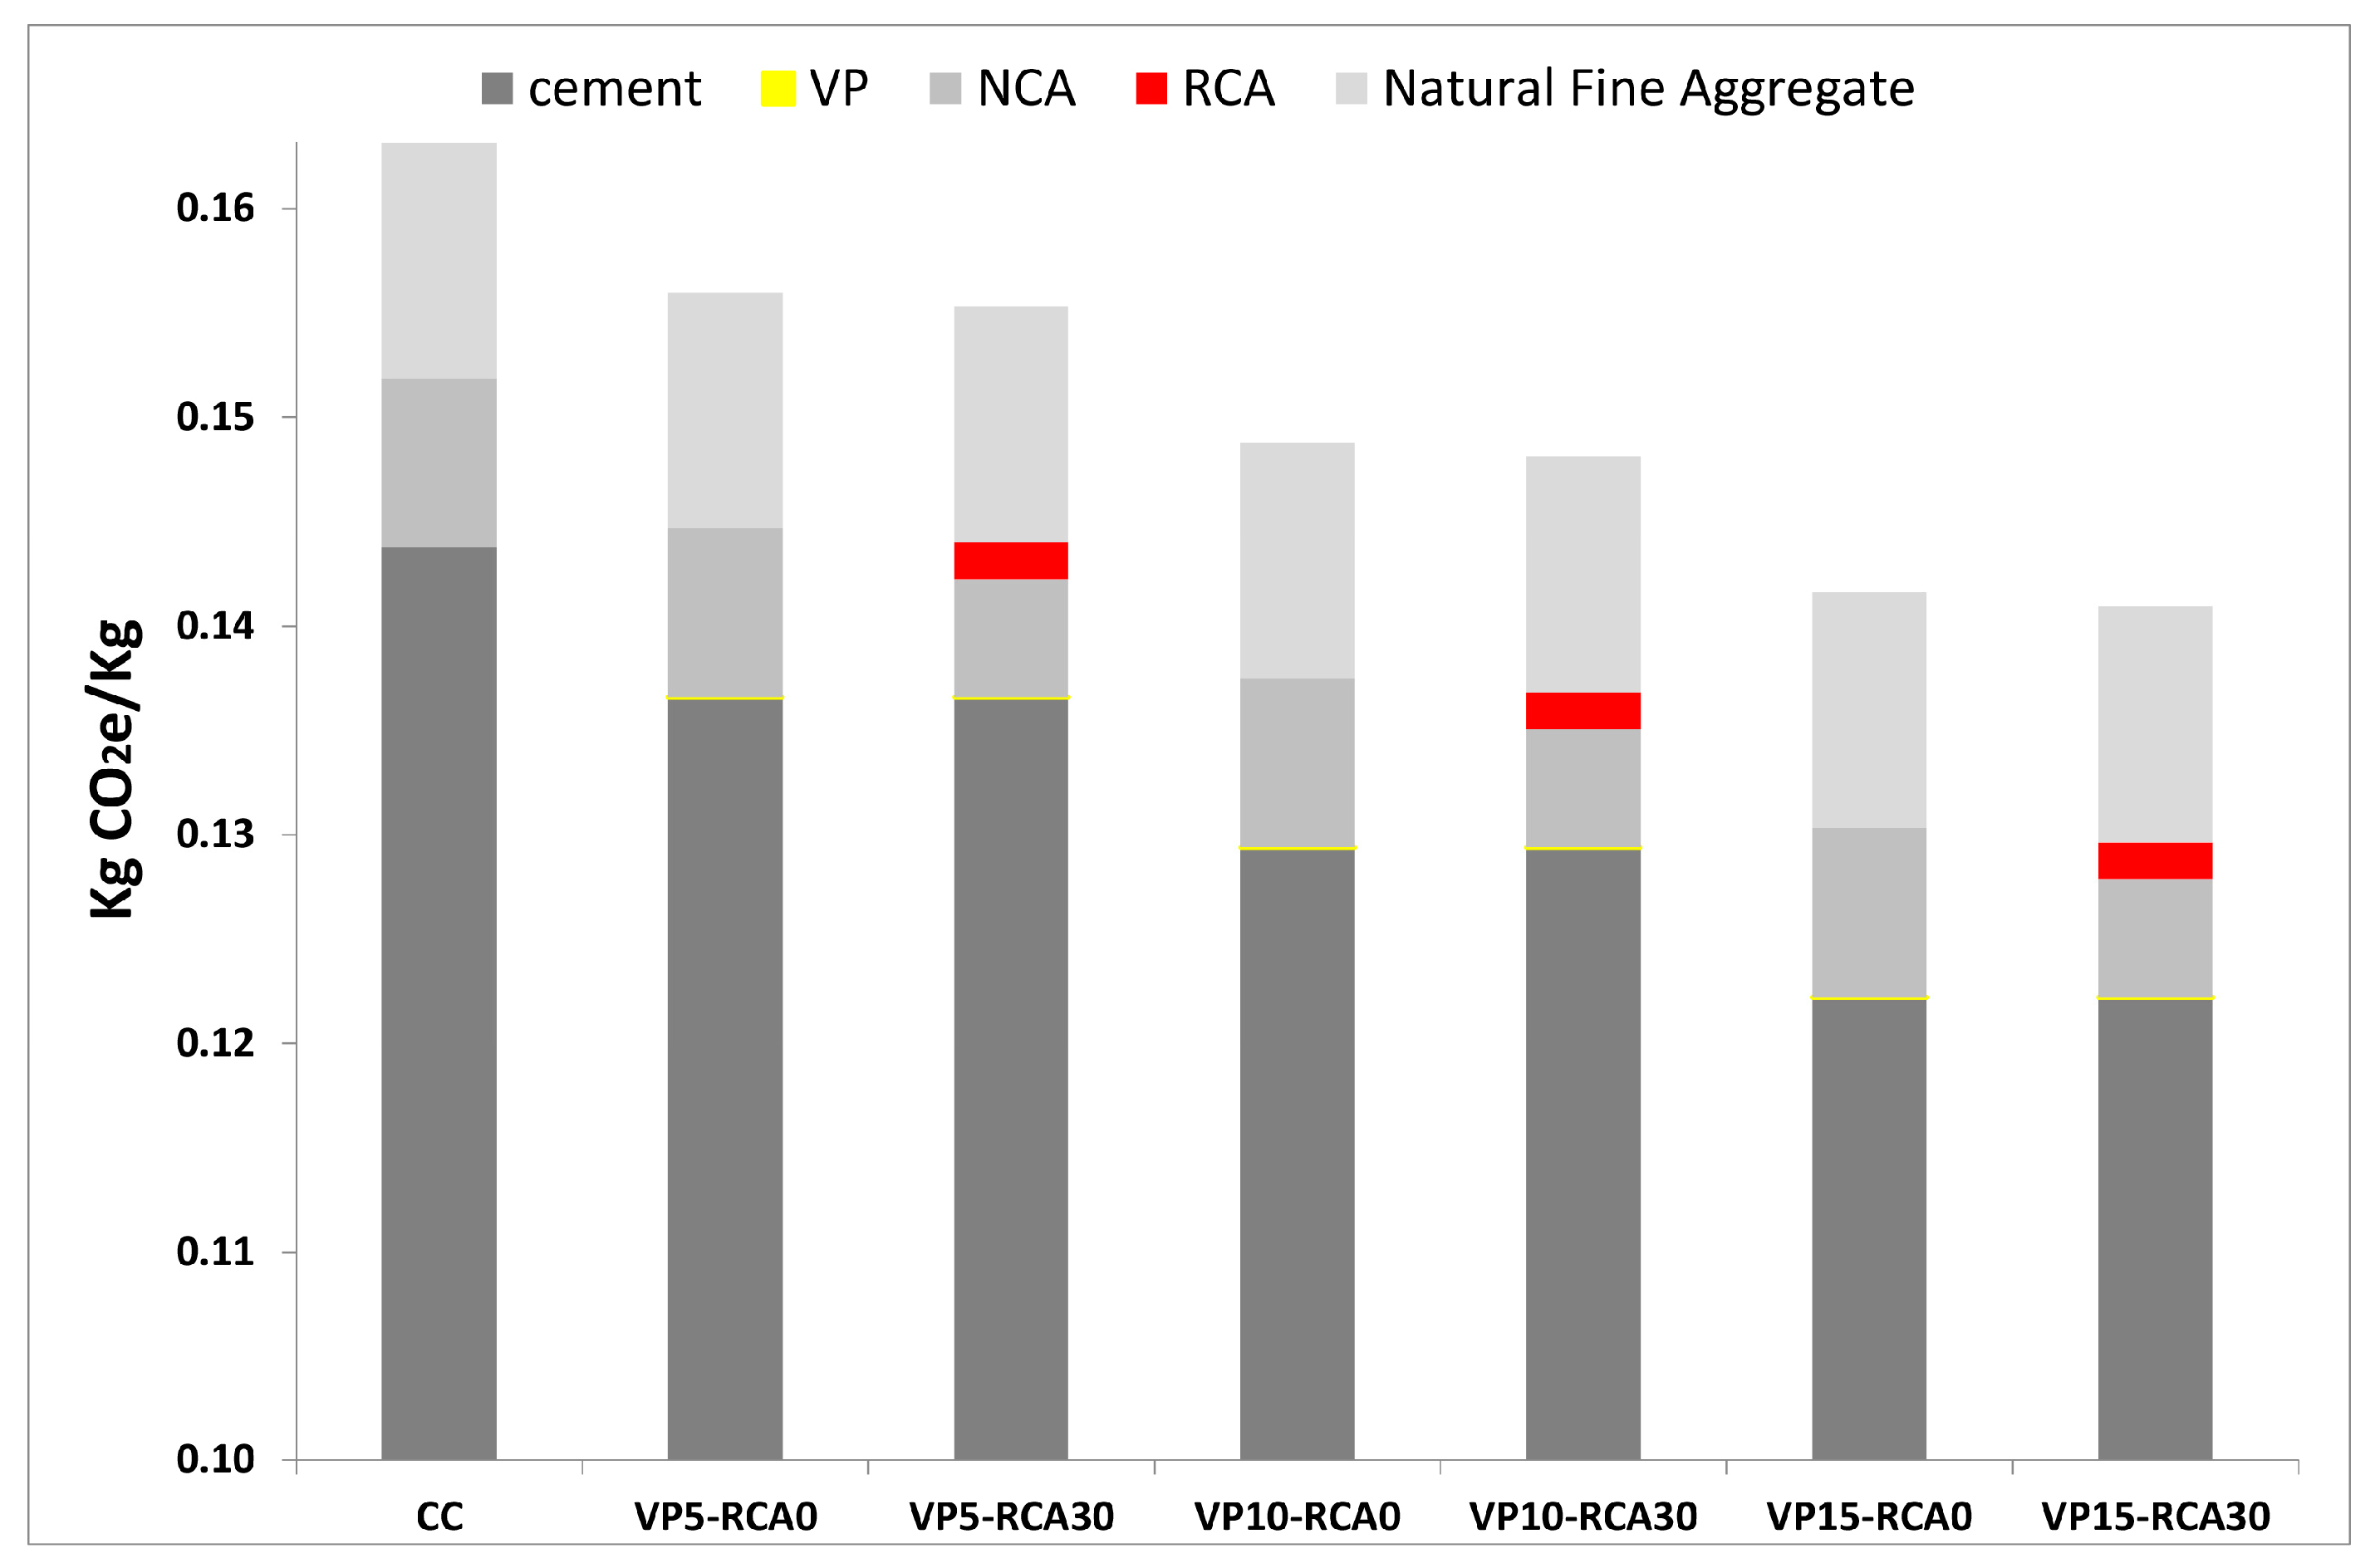
3.6. Greenhouse Gas (GHG) Assessment
As can be observed in
Figure 13, each 5% increase of the VP content produces a reduction of approximately 4.4% in CO
2 emissions. On the other hand, if 30% of RCA is included in the concrete, the CO
2 emissions are reduced an additional 0.4%.
Therefore, for the maximum replacement percentages analysed (30% RCA and 15% VP) in this work, CO2 emissions generated during the concrete manufacture process would be reduced by up to 13.6%.
Results from the SUB-RAW index (
Table 6) indicated that VP is much more sustainable than cement and according to Bontempi’s interpretation of this index [
27], the embodied energy and the CO
2 footprint of VP is three orders of magnitude lower than those for cement, while NCA are slightly more sustainable than RCA due to their lower embodied energy.

 ,
, 


