Abstract
Since the 1992 United Nations Conference on environment and development held in Rio de Janeiro (Brazil) and the adoption by China State Council in March 1994 of the “China Agenda 21”, sustainability has become a major issue in China urbanization policies. After more than two decades of development practice with a breakneck speed of urbanization, how sustainable is the recent development process in China? This paper combines the frameworks of Cities Prosperity Index (CPI) and Sustainable Cities Index (SCI) and propose a China Urban Sustainability Index by Fuzzy Evaluation (CUSI-FE) as a monitoring tool in the light of the UN Sustainable Development Goals (SDGs). With 5 years data covering 51 indicators, the model is tested to assess the performance of provincial cities in China during 5-years period from 2012 to 2016 (the year of the adoption of the SDGs). The results reveal that the overall sustainability level in China is barely average with lower performances in environmental sustainability. Indeed, a strength/weakness analysis, coupled with sensitivity analysis shows that the economic productivity and the large infrastructure development have had a strong energy cost and a sensible impact on environmental quality. Sustainable energy measures and industrial waste recycling are more likely to improve the sustainability of the cities, while the GDP growth will continue to contribute significantly also.
1. Introduction
Along with the global sustainable development strategies, especially the “twenty-first Century agenda”, China has formulated the “Chinese twenty-first Century agenda” in 1994 with the goal of promoting urban sustainable development in China [1]. Since then, the strategy of sustainable development has been included in China’s planning systems and some of its big cities had to carry out the sustainable development perspectives which were incorporated into the “95” plan, then in the “2010 Vision”. But for the past two decades china has been going through a record speed and scale of urbanization [2] and series of environmental problems including landscape fragmentation, regional climate change, biodiversity loss and ecosystem degradation have been registered [3,4,5,6] raising various concerns about the assessment of the sustainability practices in China.
The earliest sustainability assessment works can be traced back to the “sustainable development index system”—of 83 descriptive indicators—jointly elaborated by “China National Bureau of Statistics” and “China twenty-first Century agenda management center” to assess the development of china from 1990 to 1996 [7]. Later on, under a variety of concepts and projects, many assessing methods and indicator systems have been developed to evaluate the performances of Chinese different cities. Among many others, there are National Garden City Standard (1992, 2010), National Model Cities for Environmental Protection Assessment Indicator and Implementing Detailed Rules (1997, 2011), Chinese urban developmental strategy Performance Index (2002), Construction indicators of Ecological County, Municipality and Province (2003, 2007), National Civilized City Assessment System (2005, 2011), Livable City Scientific Evaluation Standards (2007), Circular economy assessment system (2007), Sino-Singapore Tianjin Eco-city indicator system (2008), Caofeidian Area ·Tangshan Bay Eco-city indicator system (2008), Urban Sustainability Index (2010), Low-carbon city standard (2011), National Ecological Civilization Pilot Demonstration Zone Indicator (2013), National Ecological Civilization Pioneer Demonstration Zone Indicator System (2013) all developed by various national departments and organizations [8].
Some scholars used indicator-based approaches and specific methods to assess the sustainable development of individual cities: principal component analysis for Daqing city [7], Full Permutation Polygon Synthetic Indicator—FPPSI for JIning city [9], Back Propagation (BP) Neural Network Algorithm for Baotou city [10], extension evaluation model for Tianjin [11] and so forth.
Besides, some other studies of sustainable development assessment covered specific regions of china using likewise indicator-based approaches, for example, Analytic Hierarchy Process (AHP) used for 10 cities in Shanxi province [12]; Driving Force-Pressure-State-Impact-Response (DPSIR) model to evaluate the regional sustainable development of 18 cities in Henan province (Entropy weight method was used for weight assignment and a composite index is calculated by weighted averaging, then Theil index was used to generate the spatial structure of regional sustainable development [13]; TOPSIS multi-criteria decision analysis method for 18 cities and counties in Hainan provinces [14], factor analysis and cluster analysis for assessing human settlement environment in 11 provincial cities in the western part of china [15] and so forth.
When it comes to the comprehensive analysis of Chinese cities and their assessment not individually nor in a specific region but throughout many provinces in order to present not only a snapshot of the general situation but also to compare the cities’ performances in terms of urban sustainable development throughout the whole country, fewer studies have been conducted so far. For instance, Chen Changjie et al. [16] through a Population-Resource-Economy-Environment-Science & Technology (PREEST) indicator system evaluated the comprehensive sustainability of china using principal component analysis. The study did not focus on cities but rather analysis the country’s overall performance from 1987 through 2001. Xiaojian Yang [17] used neural network analysis for the assessment of 31 provincial cities’ sustainability between 1990 and 1999. The neural network was used to determine the variables’ weights and “the sustainability capacity” values are calculated by averaging. Ziran Zhang et al. [18] using data from 1990 to 2011, with 42 specific indicators, evaluated the sustainable economic development of Chinese cities covering one of the largest scopes so far (264 cities—big, middle and small sizes included). Through principal component analysis method, the 42 specific indicators were grouped into 9 secondary components, then 5 primary components. After a 5-steps process analysis (normalization, Kaiser-Meyer-Olkin (KMO)) and Bartlett’s Test, main component value calculation, weight assignment and economic sustainability aggregated value calculation) the 264 cities are ranked according to their scores. Lu Huang [19] conducted a ‘multi-index analysis’ of the sustainable development between 1978 and 2012 of 10 megacities through 6 aggregated indexes: Ecological Footprint (EF), Bio capacity (BC), Environmental Performance Index (EPI), City Development Index (CDI) and Human Development Index (HDI). Qiyu Tu [20] used 19 indicators covering economic development, spatial development and public services to evaluate how innovative the construction and management mode of 16 megacities were during 2014–2015 based on production-life-ecology synergy. The cities’ performances were compared though a multilayer analysis—no overall values were calculated. Cheng Peng et al. [21] using Data Envelopment Analysis (DEA) and Exploratory Spatial Data Analysis (ESDA) and data from 2003, 2008 and 2013 to analyze the spatial-temporal differentiation in urban sustainable development capacities of 280 cities at prefecture level and above in China. But the sustainability values were not calculated for many western cities including provincial cities. Feng Yang [22] using simple percentage calculation of 10 indicators to evaluate the sustainability of 19 provincial cities in 2014. The United Nations Development Program (UNDP) [23] combined the Urban Human Development Index (UHDI) and Urban Ecological Input Index (UEII) to evaluate the China Sustainable Cities Index (CSCI) of 35 big and middle-size cities by arithmetical averaging.
Most of the above-mentioned assessment works used linear aggregation models to assess Chinese cities’ urban sustainability performances. But Gasparatos & Scolobig [24] observed that indicator-based models entail subjective choices of indicators, weights, normalization and aggregation. However, Andriantiatsaholiniaina et al., Kouloumpis et al. and Phillis et al. [25,26,27,28] defended that, given the fuzzy nature of sustainability, the lack of rigorous definition and the ambiguity of some of its components (especially for developing countries), subjectivity is unavoidable. They, therefore, invented SAFE model (Sustainability Assessment by Fuzzy Evaluation), for the purpose of integrating this “unavoidable” subjectivity by using fuzzy logic to process the various sustainability indicators. The model has been used to assess countries and world.
The current state of art does not provide any indicator system suitable for applying this methodology to the assessment of Chinese cities, which is the aim of this study.
This paper, therefore, intends to propose a China Urban Sustainability Index by Fuzzy Evaluation (CUSI-FE), an indicator system suitable for applying fuzzy evaluation to sustainability assessment in the China national context. The indicator system has the objective of leveraging the “china city statistical yearbooks [29]” and the “china urban environment statistical yearbooks [30]” to ensure that indicators’ data are available, measurable and capable of being regularly updated for periodic evaluation [31].
CUSI-FE will be tested to evaluate the recent sustainability performance of Chinese provincial cities, while addressing the following concerns about the previous assessment works on urban development in China.
- Most of the latest assessment studies either used data dating back to 2011 and before—in which case do not report on the recent development since then—or chose discontinuous timeline of data and in some cases just one or two years data (2015 most recent). In this paper, sustainability is considered as a process instead of a punctual state and should be better assessed through a continuous time-series data.
- Furthermore, the study aims at accompanying the overall evaluation with a strength/weakness analysis for two purposes: understanding the sector by sector performance of the cities that might explain their overall sustainability score and providing a map of good and bad examples that might be useful for further analysis and policy making. A sensitivity analysis performed on each basic indicator will also serve policy making by pointing out the indicators that are most likely to improve the cities’ sustainability during the coming years.
In the following sections, the indicator set design and the methodological framework of CUSI-FE will be presented as well as the details of the data processing and the assessment results such as the main strengths and weaknesses of the 31 Chinese provincial cities, their sustainability scores and ranks and their sustainability-improving factors (SIF).
2. Methodology
2.1. Indicator-Set Design Approach
Urban sustainability indicator systems, on the one hand, can be categorized according to the geographical scale of their assessment targets: building (super-micro), parcel (micro), neighborhood/suburb (mezzo), city/region (macro) and nation (super-macro) [32,33].
On the other hand, urban sustainability indicator systems, according to the World Bank (1997) [34] can be classified into three major types: (i) systemic indicators, which use one indicator to identify a complex problem; (ii) thematic indicators systems, which include a small set of indicators to evaluate sustainable development policy for specific issues; and (iii) Large indicator sets, which include large lists of indicators covering a wide range of sustainability issues.
The indicator system, CUSI-FE, proposed here, is a super-macro level, since it’s intended to assess china nationwide cities and a large indicator sets, inspired by international other large indicator sets such as: Sustainable Cities Index (SCI) [35] which covers productivity, infrastructure, quality of life, equity and social inclusion, environmental sustainability, governance and legislation; Cities Prosperity Index (CPI) [36] which covers a variety of indicators, all organized in three dimensions: People (Social), Planet (Environment) and Profit (Economy).
The indicator selection for CUSI-FE is done by bottom-top approach—from the basic indicators to the Overall Sustainability Value (OSV), in two steps: (i) from the United Nations Sustainable Development Goals (SDGs) [37] to the basic indicators; (ii) from basic indicators to components; and (iii) from components to OSV.
2.1.1. From the SDGs to Basic Indicators
The Sustainability goals, as set by the United Nations are summarized as follow:
- SDG1
- End Poverty, including increase of income, social inclusion and access to basic services.
- SDG2
- End hunger, achieve food security, improved nutrition and promote sustainable agriculture
- SDG3
- Ensure healthy lives and promote well-being for all at all ages
- SDG4
- Ensure inclusive and quality education for all and promote lifelong learning
- SDG5
- Achieve gender equality and empower all women and girls
- SDG6
- Ensure access to water and sanitation for all
- SDG7
- Ensure access to affordable, reliable, sustainable and modern energy for all
- SDG8
- Promote inclusive and sustainable economic growth, employment and decent work for all
- SDG9
- Build resilient infrastructure, promote sustainable industrialization and foster innovation
- SDG10
- Reduce inequality within and among countries
- SDG11
- Make cities inclusive, safe, resilient and sustainable
- SDG12
- Ensure sustainable consumption and production patterns
- SDG13
- Take urgent action to combat climate change and its impacts
- SDG14
- Conserve and sustainably use the oceans, seas and marine resources
- SDG15
- Sustainably manage forests, combat desertification, halt and reverse land degradation, halt biodiversity loss
- SDG16
- Promote just, peaceful and inclusive societies
- SDG17
- Revitalize the global partnership for sustainable development
Based on their relevance to SDGs, indicators are selected throughout the existing most complete, reliable and periodic urban development related databases: “china city statistical yearbook [29]” and the “china urban environment statistical yearbook [30]” (see Table 1 for the list of indicators and their related SDGs).

Table 1.
Basic indicators and related sustainable development goals (SDGs).
2.1.2. From Basic Indicators to Secondary and Primary Components
The indicators are then organized into 8 secondary components inspired by the Sustainable Cities Index (2016) [35]: sanitation & recycling, environmental quality, energy, productivity, infrastructures, health, education and social inclusion.
Next, a comparison between the frameworks of CPI and SCI helps sort out the secondary components into environment, economy and society. SCI is organized on a People-Planet-Profit structure, corresponding to the Triple-Bottom-Lines structure of sustainability: Society-Environment-Economy (Figure 1). The secondary components are associated to the three principal components based on the correspondence between SCI and CPI (see Table 2).
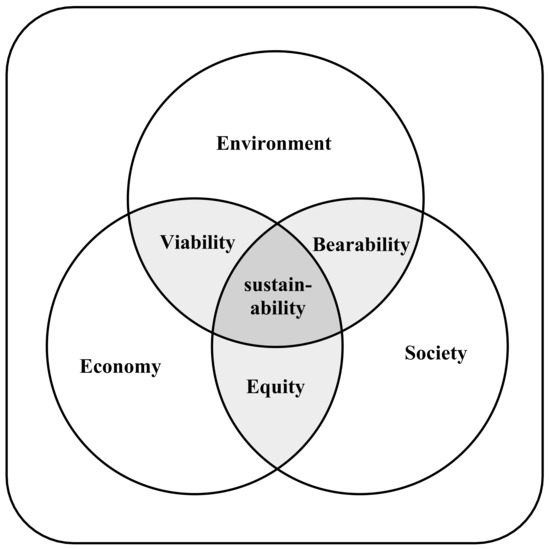
Figure 1.
Triple-Bottom-Lines structure of sustainability.
Table 2.
From secondary components to primary components, based on cities prosperity index-sustainable cities index (CPI-SCI) correspondence.
As a direct result of the CPI-SCI correspondence, the Economy component comprises productivity, infrastructure, governance and legislation, while the Society comprises infrastructure, quality of life (including health and education) and social inclusion.
In this analysis, it occurs that Infrastructures can be assigned to Economic or to Society, understandably because infrastructures have direct benefits both to Economy and Society. In this CUSI-FE, Infrastructures will be assigned to the Economy because they mostly include production-empowering infrastructures. Governance is evaluated by both CPI and SCI in terms of days to start a business or ease of doing business, which according to the correspondence will be assigned to the Economy. CUSI-FE, instead, evaluates governance in terms of public management which will be assigned to the Social inclusion (secondary component).
As final result, the 8 secondary components of CUSI-FE (sanitation & recycling, environmental quality, energy, productivity, infrastructures, health, education and social inclusion) are assigned to Economy, Society and Environment as following (see Figure 2 for the full framework from basic indicators to the Overall Sustainability Value):
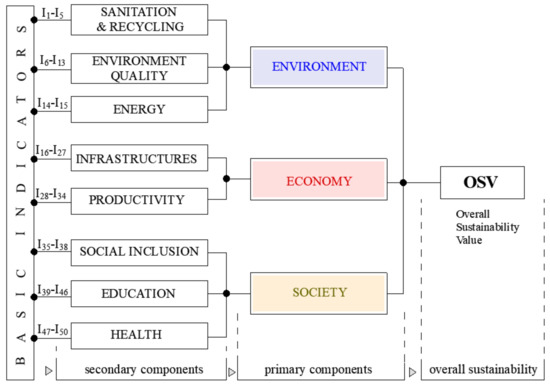
Figure 2.
Theoretical framework of China Urban Sustainability Index by Fuzzy Evaluation (CUSI-FE) (inference logic from basic indicators to overall sustainability value (OSV)).
- -
- Environment: sanitation & recycling, environmental quality, energy;
- -
- Economy: productivity, infrastructures;
- -
- Society: health, education and social inclusion.
2.2. Data Collection
The data collection for this study has been guided by a space-time requirement of the assessment model: the availability for all targeted cities (space) and the availability on a yearly frequency (time). To meet this bi-dimensional requirement, all data have been collected from two sources: the “china city statistical yearbook” and the “china urban environment statistical yearbook” which are the most detailed, urban development-related and yearly available data sources in china. The data are collected for each year from 2012 through 2016.
Through the two sources, there are certain data which are not expressed in a form of ratio that allows comparability among cities. To solve this, those data are divided by the population or the GDP (depending on the social or economic benefit of the information they carry) to create “objective indicators”. For instance, the “high education institutions” are divided by the population to give a “high education institutions per 10,000 persons” and the “expenditure for science and technology” is divided by the GDP to give an “expenditure for science and technology as percentage of GDP”. All indicators, their components, definitions and threshold values are presented in Table 3 and Table 4.
Table 3.
Basic indicators’ units and definitions.
Table 4.
Input indicators’ standard values and corresponding sources.
2.3. Data Processing
In order to comprehend the performances of the cities, the data processing integrates a strength-weakness analysis to the fuzzy evaluation framework developed by Phillis et al. [27,28] and goes through the following 6 steps: data collection & indicator set design (1); normalization (2); exponential smoothing (3); strength/weakness analysis (4); fuzzy analysis (5); and sensitivity analysis (6). The Figure 3 schematizes the 7-steps computing process from input indicators to the Overall Sustainability Value (OSV) of each city as output. The strength and weakness analysis is performed after exponential smoothing (step 3) and the sensitivity analysis is performed at the end as repeating the calculation (from step 3) after changing one input variable at the time. From the step 5 of the data computing process, the fuzzy inference logic follows the theoretical framework of CUSI-FE represented in Figure 2.
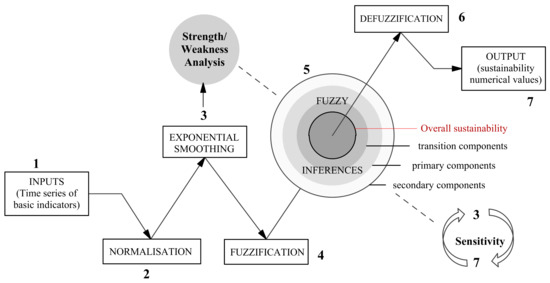
Figure 3.
Computing process of Overall sustainability.
2.3.1. Normalization
Since the basic indicators have a variety of units. To obtain comparable dimensionless values, the data (for all indicators) are normalized on [0, 1], where 0 is the completely unsustainable value and 1 the completely sustainable one. This is done through a linear interpolation formula which uses standard values (Tc, τc, Uc and υc) for each indicator. zc (t) is the value of an indicator c at time t and xc (t) its normalized value. Uc and υc respectively are the upper and lower thresholds values of unsustainability, while Tc and τc respectively are the upper and lower thresholds values of sustainability.
Two types of standards are used in this model: “objective standards” and “subjective standards”. The objective norms are the Chinese national norms as set by the most recent official sources (see Table 2 for the specific sources for each indicator). The subjective norms are the threshold values set relatively to the targeted cities. In this case, those threshold values are calculated national averages which are set as upper or lower boundaries for sustainable values (depending on the positivity or the negativity of the indicator). For example, 579 students/10,000 pers. is the average value for “students’ enrollment in high education institutions”. This indicator is considered positive, which means the higher the value is, the better it is. For any value above 579 the normalized value corresponds to 1 and for any value beneath that, the normalized value is calculated through linear interpolation.
2.3.2. Exponential Smoothing
Exponential smoothing is used to alleviate the inaccuracies and the memory effects attached to some indicators. The effects of SO2 concentration for example depend on the past and present emissions, therefore exponential smoothing—as proposed by Kouloumpis et al. [26] is used to “combine the past with the present [28]”.
xc is the aggregated value for an indicator c where xc (t1), xc (t2), …, xc (tK) are the normalized values in years t1, t2, …, tK which need not be consecutive because of missing data. β ∈ [0, 1] is a parameter chosen to minimize the following mean squared error;
where
(tk) is the weighted average prior to tk, given by
2.3.3. Strength/Weakness Analysis
For each city, the input indicators have been ranked on the basis of their smoothed values right before the fuzzy analysis to show the best performances relatively to the target values (norms). The indicators with the highest smoothed values—close or equal to the completely sustainable value (0.9 < Xi ≤ 1.0)—have been collected for each city and identified by the sector (secondary component) they belong to. Then the frequency of each sector is computed by the following formula:
where Ns is the number of times a Sector is identified in the matrix of indicators with the highest smoothed values (in the case of strengths) or the lowest smoothed values (in the case of weaknesses) and Ni is the number of indicators with 0.9 < Xi ≤ 1.0 (in the case of strengths) or 0.0 ≤ Xi < 0.5 (in the case of weaknesses).
A sample calculation is done from the following table (Table 5) which is the list of input indicators with the highest smoothed values for Beijing city. In the last column, these input indicators, replaced by the sector each of them belongs to, allow us to calculate the frequency of each sector on the list using the “Fs” formula described above.
Table 5.
List of Input indicators with the highest smoothed values for Beijing city.
Sanitation & Recycling (SR), for instance, is identified three times on the list, so NEP = 3. For Beijing city, Ni = 25 indicators, which is also the maximum number of indicators with 0.9 < Xi ≤ 1.0 among all the 31 cases (31 provincial cities). Therefore, the frequency of SR is given as FSR = 3/25 = 12%.
The frequencies of all the eight sectors are presented in Table 6 to show the best performances of Beijing city. It can be seen that the sector of Transport & Telecom (25%) is the best among all seven sectors.
Table 6.
Best performances of Beijing city.
The above demonstrated calculation has been done for all the 31 provincial cities, using the highest smoothed values (0.9 < Xi ≤ 1.0) to express strengths (almost or completely sustainable) and for the lowest smoothed values (0.0 < Xi ≤ 0.5) to express weaknesses (below average). The complete results are shown in the Section 3.
2.3.4. Fuzzy Analysis
Fuzzification
In the analysis process, each basic indicator’s aggregated value calculated after exponential smoothing is projected into different fuzzy sets (Figure 4a). The outcome values belonging to the same component are then analyzed by hierarchical fuzzy reasoning system to yield the fuzzy value of that component (Figure 4b) all the way up to the overall sustainability (Figure 4c).
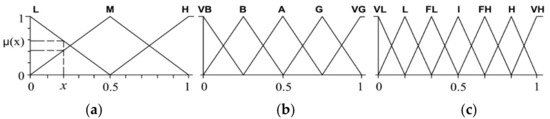
Figure 4.
Fuzzy sets and their corresponding membership functions µ(x). (a) Basic indicators; (b) Components; (c) Overall sustainability.
Three fuzzy sets are used for basic indicators: low (L), Medium (M) and High (H). Five fuzzy sets are used for composite indicators (primary and secondary components): Very Bad (VB), Bad (B), Average (A), Good (G) and Very Good (VG). For Overall sustainability seven fuzzy sets are used: Very Low (VL), Low (L), Fairly Low (FL), Intermediate (I), Fairly High (FH), High (H) and Very High (VH).
Example: Beijing time series (2012–2016) for indicator “Waste water treatment rate” is 87.90% (in 2016), 86.10% (in 2015), 84.60% (in 2014), 83.00% (in 2013) and 81.68% (in 2012). The target value is τ = 85% (China National Healthy City Standards) and the unsustainable value is u = 0% (minimum possible). The normalized values are:
- x2016 = 1 (since 87.9 > τ)
- x2015 = 1 (since 86.1 > τ)
- x2014 = (84.6 − 0)/(85 − 0) = 0.995
- x2013 = (83.0 − 0)/(85 − 0) = 0.976
- x2012 = (84.6 − 0)/(85 − 0) = 0.960
Through exponential smoothing, Beijing “Waste water centralized treatment rate” aggregated value is x = (1 + 1 × ß (2015 − 2014) + 0.995 × ß (2014 − 2013) + 0.976 × ß (2013 − 2012) + 0.960 × ß (2012−2011))/((1 + (2015 − 2014) + (2014 − 2013) + (2013 − 2012) + (2012 − 2011)) = 0.987, (ß = 1). According to Figure 4a, this value is Low with membership grade μL(0.987) = 0, medium with membership grade μM(0.987) = (1 − 0.987)/(1 − 0.5) = 0.027, High with grade μH(0.987) = (0.98654 − 0.5)/(1 − 0.5) = 0.973. At this stage, instead of calculating a defuzzified value for the component by creating rules for all possible combinations between membership functions of all indicators sharing the same components, the judgment process is simplified by choosing the linguistic value with the highest membership grade and affect it with the corresponding grade as a weight. In this case, Beijing “Waste water treatment rate” will be considered high (H) with grade 0.973.
Next, these values using “if-then” linguistic rules will be combined to relate input indicators to a composite indicator.
Fuzzy Inferences
Integer values are assigned to the fuzzy sets starting with 0 for the lowest fuzzy set and continuing with 1 for the next fuzzy set and so on. We therefore have L = μiL × 0, M = μiM × 1 and H = μiH × 2 for basic indicators; VB = μiVB × 0, B = μiB × 1, A = μiA × 2, G = μiG × 3 and VG = μiVG × 4 for primary and secondary components; and VL = μiVL × 0, L = μiLx × 1, FL = μiFL × 2, I = μiI × 3, FH = μiFH × 4, H = μiH × 5 and VH = μiH × 6, for OSV, where μiX is the membership grade of each indicator’s input (i) for the membership function (X).
When a rule fires, the sum of the “weighted values” (μiX × integer value) of its inputs determines the fuzzy set of the output. Taking “Sanitation & Recycling” of Beijing as example (see Table 7), If “Ratio of industrial solid waste” is High and “Waste water centralized treatment rate” is High and “water reuse rate” is Low and “Ratio of domestic waste treatment” is High and “City sewage pipes” is High, then the output of “Sanitation & Recycling” is Good. That is done by the following process.
Table 7.
Fuzzy inference sample calculation for environmental protection in Beijing.
The sum of inputs will be: Sum = H + H + L + H + H = 0.611 × 2 + 0.973 × 2 + 0.591 × 0 + 1 × 2 + 1 × 2 = 7.168 which in the rule base of Sanitation & Recycling corresponds to the membership function G (Good). To be faithful to the weights assigned to the membership functions, the rule base as designed here is not just a matrix of integer values (assigned to each fuzzy set). Instead, it is a matrix of decimal values ranging from the minimum possible to the maximum possible combination of inputs and corresponding outputs (see Figure 5).
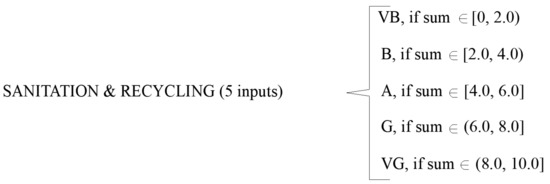
Figure 5.
Sample rule base calculated for Sanitation & Recycling.
For Sanitation & Recycling, the minimum possible combination is sum = 0. The maximum is sum = 2 + 2 + 2 + 2 + 2 = 10. Therefore, the possible values ranging from 0 to 10 will be distributed symmetrically over the functions VB, B, A, G and VG (see Figure 6).
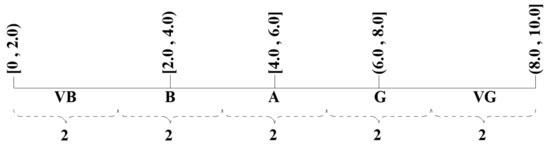
Figure 6.
Sample symmetrical distribution of environmental protection values.
The rule bases of the primary or transition components and the OSV are made on the basis of the same principle and their weighted values (WV) are calculated by the formula:
where dv are the decimal values of the previous indicators or component, ∂I the weight assigned to each indicator or component and IV the integer value of the current primary or transition component.
Defuzzification
At the final stage, a defuzzification is done, which consists of converting the fuzzy values of sustainability into a number dV (defuzzified value) on [0, 1]. The defuzzification is done by the following formula to get the OSV scores and the scores of Living Environment, Economy and Society.
The linguistic values of OSV after defuzzification are determined by locating dV on the following scale between 0 and 1 (see Figure 7).
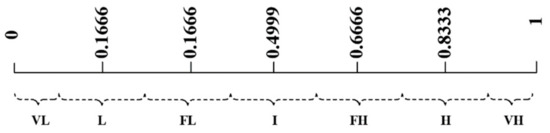
Figure 7.
Scale of OSV linguistic values.
2.3.5. Sensitivity Analysis
Unlike the ranking which shows a snapshot of the cities performances compared to one another, the sensitivity analysis tends to provide a policy making tool by answering the more important question than knowing the rank of cities which is: how can their sustainability level can be improved. Indeed, the sensitivity analysis evaluates how fast each variable, if improved, can improve the Overall Sustainability Value which is written as OSV (I1, …, Ii + δ, …), where Ii denotes basic indicators. If a given indicator (Ii) is improved by a small quantity δ > 0, then Overall Sustainability Value is written as OSV (I1, …, Ii+ δ, …) which would be a greater value since the fuzzy evaluation model is monotonic [25]. The improvement rate is calculated then by ∆I (1 − Ii), as ∆I is calculated as follows:
The choice of this equation is argued by Phillis et al. [26]. 1 − Ii corresponds to the distance of each indicator from its sustainable value and the margin for improvement of this indicator. Thus, improving an indicator whose value is already in a sustainable region (i.e., I = 1) would not improve OSV. Instead, the model detects indicators that affect OSV faster.
3. Assessment Results and Discussion
3.1. Cities’ Overall Ranking
The following Table 8 presents the ranking of the 31 provincial cities and their respective performance in terms of Environment, Economy and Society. Two types of ranking are given: the overall ranking based on the OSV values and the sector by sector ranking based on the corresponding partial scores. The two types of ranking confirmed that good performance in a single sector or two is not enough for sustainability; sustainability indeed requires a full harmony between its environmental, economic and societal performances. For instance, Nanning city, despite the 3rd rank in Environment is ranking 25th (overall) because of its relatively bad performance in Society (30th) and Economy (26th).
Table 8.
Sustainability scores and ranking of the Chinese provincial cities.
The sector by sector scores also give an idea about specific performances of each city taken individually, which in many cases can be confirmed by the detailed outcomes of the strength/weakness analysis (see Section 3.2). For instance, Hangzhou which had very good economic and social performances was not that good at the Environment; according to the strength/weakness analysis, almost half of its weaknesses are in Environmental Quality and Energy. Guangzhou had relatively impressive performances in Infrastructure, Social Inclusion and Education but has considerable Environmental Quality and Energy issues.
On average, the scores show that Chinese cities have better performance in Economy and the Environment is the least developed. All in all, the results of the overall ranking yielded three classes of cities, identified by their linguistic values given by the OSV scale in Figure 7: FH, I and FL.
- -
- Class FH (Fairly High), fairly sustainable cities among which we have some of the mega cities like Beijing, Shanghai and some other big cities. The surprising case is Urumqi city. After having ranked 4th among the china provincial cities in 2011 [18], here, despite the 7th and 9th position in Society and Economy, respectively, it is ranking 1st in Environment, which gives it the 2nd overall rank after Beijing. This might testify the recent progress in the development of the city. Nevertheless, it is important to remark that this environmental score does not necessarily mean that impressive of a performance on a global perspective, since the environmental performance of all the 31 cities are very poor on average and the best cases are barely above the average of 0.5 out of 1 (completely sustainable value).
- -
- Class I (Intermediary level), barely sustainable cities represent the majority (74%). Among them are counted some big cities such as Guangzhou, Tianjin and Chongqing. This majority indicates that the general sustainability of china is still at an average level and a lot is still needed to do towards sustainable development.
- -
- At the bottom of the list are two cities (Harbin and Lhasa), classified as Fairly Low sustainability level cities (class FL). Their OSVs are far below the 0.5 average score on a [0.1] scale.
The following figure (Figure 8) represents the OSV values of the cities on a graphical scale.
Figure 8.
China provincial cities and their OSV values.
The comparison of the ranking obtained in this paper with four other recent works (see Table 9) shows some similarities (the rank of Beijing, Hangzhou and Shanghai for example) but also some differences, which may have many possible explanations that cannot be told here precisely. The variations might merely be explained by the differences in the data timelines, the assessment scopes, or the methods used. The variations might also reflect the real changes in the performances of the cities over the recent years (for instance, a progress in the case of Yinchuan and Taiyuan which did not rank among the top ten before and a regression in the case of Guangzhou); but a further study might be necessary to answer this question precisely.
Table 9.
Top-ten cities ranking comparison with previous works.
Nevertheless, it is important to remember that the main advantage of the assessment performed in this paper using fuzzy logic is to take into account the fact that sustainability itself—the way it is composed by various indicators—is embedded in subjectivity, which fact was not considered in the previous assessment of Chinese cities.
3.2. Strengths and Weaknesses
The upper side (strengths) of the following figure (Figure 9) presents the best performances of each city taken individually and compares the cities with one another, showing the good examples in each sustainability sector. Likewise, the lower side (weaknesses) presents the below-average performances of each city taken individually and compares the cities with one another, showing the worst cases in each sustainability sector. Comparing, on the one hand, the sectors among them, it can be read that Infrastructures, Sanitation and recycling are the outstanding comprehensive strength of the cities. On the other hand, it can be read that the weaknesses are various but the most outstanding sectors of weakness are Education and Environmental Quality—even though the latter represent a strength for certain middle cities such as Kunming, Haikou and Fuzhou. The energy appears to be a sector of more weakness than strength. The production strength is quite fairly distributed among the cities but the last twelve cities (especially Shijiazhuang, Xining, Nanjing, Chongqing, Harbin and Lhasa) still have some struggles. Perceptible efforts are made in terms of social inclusion for half of the cities, while the other half still have some challenges with this aspect. The health sector is quite balanced between strength and weakness, it’s obviously not a sector of a big performance but not a sector of that much of weakness either.
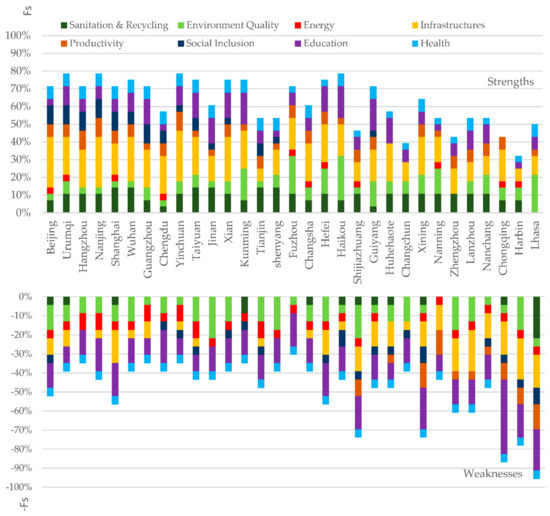
Figure 9.
Strengths and weaknesses of the cities classified by sustainability sectors.
Based on this strength/weakness comparison, one can deduce that the one factor that weights the most in the balance as a strength of Chinese cities is the Economic—especially the infrastructure development, which is understandable regarding the importance given to the economy by the country’s development policies so far. The mixed situation of the environmental quality is also understandable because, the efforts in this sector are rather recent; the heavy cost of the infrastructure and the production sectors for big cities like Beijing, Shanghai, Guangzhou, Hangzhou, Nanjing and Wuhan is very perceptible in the weakness of the Environmental Quality. Besides, it can be noted that the Education and Health sectors are still sectors of major challenge, probably because of the very high population density, meaning that a lot is still needed to do.
Furthermore, it can be noticed that regardless of their overall ranking various cities are good or bad examples in various sectors. For instance, Fuzhou and Haikou can be taken as good examples in terms of Environment Quality, while Beijing and Shanghai are bad examples.
3.3. Sensitivity
For each provincial city, each indicator’s improvement rate ∆I (1 − Ii), as described in 3.6, has been calculated and all indicators have been ranked according to their ∆I values. The indicators that have the highest improving rates are considered Top Sustainability Improving Factors (Top-SIF). Only the top-three SIFs are presented in Table 10.
Table 10.
The cities top three Sustainability Improving Factors.
As shown by the strength/weakness analysis, the high productivity for economic development of Chinese cities has heavy environmental costs and the energy consumption is a sector of weakness. This observation is confirmed here by the sensitivity analysis (summarized in Figure 10). Indeed, the electricity consumption (Id14) has 20% of frequency among the top-five Sustainability Improving Factors, which means that sustainable energy practices will have a great contribution to the sustainability improvement of the cities. In addition to sustainable energy practices, the cities need also to mitigate the environmental cost of the high productivity by increasing the reuse of industrial wastes because the “industrial waste reuse” (Id1) is the third most sensitive for improving sustainability of the assessed cities (Figure 10).
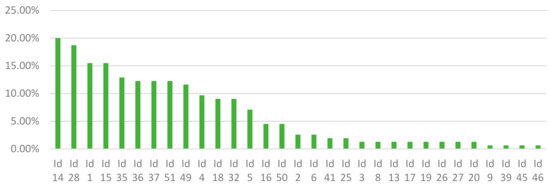
Figure 10.
Frequency of the top-five sensitive indicators.
The second SIF is the GDP growth rate (Id28). As the current trend of development of china relies a lot on the economic productivity, GDP growth still has a big contribution but Social Inclusion (Id35, Id36 and Id37) will also be important for improvement. The other indicators (Ii) in Figure 10 can be identified in Table 1.
4. Conclusions
In this paper, China Urban Sustainability Index by Fuzzy Evaluation (CUSI-FE) is proposed and tested with 31 provincial cities.
Based on five years data (2012–2016), China provincial cities’ sustainability performances have been evaluated and the results reveal Three classes of provincial cities: fairly sustainable cities (class FH), barely sustainable cities (class I) and Low sustainability cities (Class FL). The majority of the cities (74%), including big cities like Guangzhou, Tianjin and Chongqing, is class I (Intermediary), indicating that the general sustainability of china is still at an average level and a lot is still needed to do towards sustainable development.
The study provides two types of ranking: an overall ranking based on the Overall Sustainability Value (OSV) and a sector by sector—Environment, Economy and Society—partial ranking. The two types of ranking confirmed that even impressive performances in a single sector or two does not mean a city’s development is sustainable; sustainability indeed requires a full harmony between its environmental, economic and societal performances.
Still, as confirmed by the strength/weakness analysis, a big importance is given to the Infrastructure development and economic productivity so far, while the environmental sustainability is low on average, reason why a relatively less important city such as Urumqi—more balanced between economic, social and environmental development—is “surprisingly” ranking second. After having ranked 4th among the china provincial cities in 2011 [18], here, despite the 7th and 9th position in Society and Economy, respectively, it is ranking 1st in Environment, which gives it the 2nd overall rank after Beijing.
The assessment model through its strength/weakness and sensitivity analyses, also provides information for local policy makers as the improvement of the 31 provincial cities’ sustainability performance is concerned. Based on the results of these two analyses, one can conclude that during the coming years, urban sustainability in china could be sensibly improved by adopting more sustainable energy policies, as well as adopting a more environmentally responsible production, with a particular accent on industrial waste recycling. Social inclusion will also be important, while the GDP growth will continue to be one of the major improving factors.
The main limitation of this assessment model is the fact that governance is measured here only with one indicator in terms of participation to public management and social organization (Indicator 38), due to the unavailability or incompleteness of other data (corruption-related for instance) for many cities as considered in this paper.
Nevertheless. the assessment of Chinese provincial cities as presented in this paper, gives on the one hand, an idea about the sustainability performance of Chinese cities between 2012 and 2016, right before the implementation of the national plan released in September 2016, in compliance with the United Nations’ SDGs (2030 Agenda) [23]. On the other hand, the results of the sensitivity analysis, as well as the strength & weakness analysis could be useful for decision making and policy adjustments needed to achieve the SDGs in respect of the country’s local realities. Future assessments will be necessary for monitoring the sustainability performances of the cities and how they comply with the global “New Urban Agenda”.
Author Contributions
Conceptualization, B.Z. and K.B.B.; methodology, K.B.B.; validation, B.Z.; formal analysis, K.B.B.; investigation, B.Z. and K.B.B.; resources, B.Z.; data curation, K.B.B.; writing—original draft preparation, K.B.B.; writing—review and editing, K.B.B.; visualization, K.B.B.; supervision, B.Z.; project administration, B.Z.; funding acquisition, B.Z.
Funding
This research was funded by the Natural Science Foundation of China, grant number 51478470.
Acknowledgments
Authors would like to thank Luyun Liu, Ph.D. (School of Landscape Architecture, Central south University of Forestry and Technology, Changsha, China) for her advices provided during the revision process (round 2) of this paper and Ms. Chen Luo (School of Architecture and Art, Central South University, Changsha, China), for her orientations throughout the data collection process.
Conflicts of Interest
The authors declare no conflict of interest.
References
- Zhang, L.Y. History of Sustainable Development in China. 2005. Available online: http://kns.cnki.net/kns/download.aspx?filename=hJnZrB1RCF3NtBVUvZTYVdmYWF1U0RHNz0GULRUby0UT1tyQ3k0Y58icmx2SChXN4Vle1BnbyJVVvFnQSVlNrMmcPJXRrw0MVNFMHx2cWB3VrpnUKhDUrRWQx5UcXR0Y5QjW0UEawZVZJdHTvdWRyU0bt10QaRXb&tablename=CJFD2005&dflag=pdfdown (accessed on 12 October 2017).
- Wu, J.G.; Xiang, W.N.; Zhao, J.Z. Urban ecology in China: Historical developments and future directions. Landsc. Urban Plan. 2014, 125, 222–233. [Google Scholar] [CrossRef]
- Gaubatz, P. China’s urban transformation: Patterns and processes of morphological change in Beijing, Shanghai and Guangzhou. Urban Stud. 1999, 36, 1495–1521. [Google Scholar] [CrossRef] [PubMed]
- Liu, J.Y.; Zhan, J.Y.; Deng, X.Z. Spatio-temporal patterns and driving forces of urban land expansion in China during the economic reform era. AMBIO 2005, 34, 450–455. [Google Scholar] [CrossRef] [PubMed]
- Bai, X.M.; Chen, J.; Shi, P.J. Landscape urbanization and economic growth in China: Positive feedbacks and sustainability dilemmas. Environ. Sci. Technol. 2012, 46, 132–139. [Google Scholar] [CrossRef] [PubMed]
- Liu, Z.F.; He, C.Y.; Zhou, Y.Y.; Wu, J.G. How much of the world’s land has been urbanized, really? A hierarchical framework for avoiding confusion. Landsc. Ecol. 2014, 29, 763–771. [Google Scholar] [CrossRef]
- Wang, F. Study on the Indicator System and Appraisal for Sustainable Development of Resource-Based City. Master’s Thesis, Northeastern Petroleum University, Daqing, China, 2006. [Google Scholar]
- Lu, H.; Ya, L.J.; Wu, J.G. Assessing urban sustainability of Chinese megacities: 35 years after the economic reform and open-door policy. Landsc. Urban Plan. 2016, 145, 57–70. [Google Scholar]
- Li, F.; Liu, X.S.; Hu, D.; Wang, R.S. Evaluation method and its application for urban sustainable development. Acta Ecol. Sin. 2007, 27, 4793–4802. [Google Scholar]
- Song, Y.C.; Ho, W.; Zhang, P.; Han, Y. Resource-based city sustainable development index: Prediction based on the BP neural network. J. Xi’an Univ. Financ. Econ. 2014, 27, 1672–28176. [Google Scholar]
- Gao, L.F.; Tu, Y.T. Extension Evaluation Method on Urban Sustainable Development. 2010. Available online: http://en.cnki.com.cn/Article_en/CJFDTOTAL-KJIG201012012.htm (accessed on 24 August 2018).
- Zhang, J.; Li, Q.; Zhou, Y. The Evaluation of the Sustainable Development of Shaanxi Province. 2013. Available online: http://en.cnki.com.cn/Article_en/CJFDTOTAL-ZGRZ2013S2113.htm (accessed on 24 August 2018).
- Qiao, X.N.; Yang, Y.L.; Yang, Y.J.; Feng, D.X. Evaluation of sustainable development in Henan Province Based on DPSIR model and Theil coefficient. Areal Res. Dev. 2017, 36, 18–22. [Google Scholar]
- Jing, L.H.; Zhuang, H.Y. Research on Sustainable Development of Hainan Province—Based on Improved Entropy Weight TOPSIS Method. 2017. Available online: http://kns.cnki.net/kns/download.aspx?filename=wpUUV5mYzQ3dNR1cLh1byQmdVZWbh5kNwtCNHJVYUZ2ZEtETWVXeqFXROl0Y042QKRjVkJVa41ESm5EV3FEWtt0a0MEVzBFTS9mert0ckx0KJlkRClHWGJDZjFnMaFzMohXVKpneyljY4RVR2FnbIhmQhB3Ly52c&tablename=CJFDLAST2017&dflag=pdfdown, (accessed on 12 October 2017).
- Hu, M.F. Evaluation of Sustainable Development of Human Settlements in Western Cities. Surv. Mapp. Tech. Equip. 2016, 18, 40–44. [Google Scholar]
- Chen, C.J.; Fu, X.F.; Ma, X.W.; Wei, Y.M. Study on comprehensive evaluation of sustainable development in China. China Popul. Ressour. Environ. 2004, 14, 1–6. [Google Scholar]
- Yang, X.J. Evaluation and Adjustment of the Sustainable Development in City Based on Neural Network. Ph.D. Thesis, Donghua University, Shanghai, China, 2007. [Google Scholar]
- Zhang, Z.R.; Zhang, P.; Liu, X.H.; Wang, Y.; Huang, Z.G. Sustainability of Chinese Cities: An Assessment based on the data from 1990 through 2011. Financ. Rev. 2014, 5, 14–69. [Google Scholar]
- Huang, L. Sustainability Assessment of Urban Development and Planning in China: A Sustainability Science and Indicator-Based Approach. Ph.D. Thesis, Zhejiang University, Zhejiang, China, 2015. [Google Scholar]
- Tu, Q.Y. Evaluating the Sustainable Development of Chinese Mega Cities: An Innovation Approach. Urban Dev. Stud. 2016, 23, 100–108. [Google Scholar]
- Peng, C.; Chen, Z.F.; Wu, H.R.; Yao, N. Spatial-temporal differentiation of urban sustainable development in China based on ESDA. China Popul. Resour. Environ. 2016, 26, 144–151. [Google Scholar]
- Yang, F. Report on the Sustainable Development of 19 Cities in China. China Econ. Trade Her. 2017, 5, 9–13. [Google Scholar]
- UNDP. China Sustainable Cities Report 2016: Measuring Ecological Input and Human Development; United Nations Development Program in China: Beijing, China, 2016. [Google Scholar]
- Gasparatos, A.; Scolobig, A. Choosing the most appropriate sustainability assessment tool. Ecol. Econ. 2012, 80, 1–7. [Google Scholar] [CrossRef]
- Andriantiatsaholiniaina, L.A.; Kouikoglou, V.S.; Phillis, Y.A. Evaluating strategies for sustainable development: Fuzzy logic reasoning and sensitivity analysis. Ecol. Econ. 2004, 48, 149–172. [Google Scholar] [CrossRef]
- Kouloumpis, V.D.; Kouikoglou, V.S.; Phillis, Y.A. Sustainability assessment of nations and related decision making using fuzzy logic. IEEE Syst. J. 2008, 2, 224–236. [Google Scholar] [CrossRef]
- Phillis, Y.A. Kouikoglou, V.S. Fuzzy Measurement of Sustainability; Nova Science Publishers: Hauppauge, NY, USA, 2011; pp. 1–171. [Google Scholar]
- Phillis, Y.A.; Kouikoglu, V.S.; Verdugo, K. Urban sustainability assessment and ranking of cities. Comput. Environ. Urban Syst. 2017, 64, 254–265. [Google Scholar] [CrossRef]
- National Bureau of Statistics. China City Statistical Yearbook (2012–2016). Available online: http://www.yearbookchina.com/navibooklist-N2017060038-1.html (accessed on 24 August 2018).
- National Bureau of Statistics and Ministry of Environmental Protection. China Statistical Yearbook on Environment (2012–2016). Available online: http://www.yearbookchina.com/navibooklist-n3018061501-2.html (accessed on 24 August 2018).
- Hemphill, L.; Berry, J.; McGreal, S. An indicator-based approach to measuring sustainable urban regeneration performance: Part 1, conceptual foundations and methodological framework. Urban Stud. 2004, 41, 725–755. [Google Scholar] [CrossRef]
- Yigitcanlar, T.; Dur, F.; Dizdaroglu, D. Towards prosperous sustainable cities: A multiscalar urban sustainability assessment approach. Habitat Int. 2015, 45, 36–46. [Google Scholar] [CrossRef]
- Dizdaroglu, D.; Yigitcanlar, T. Integrating urban ecosystem sustainability assessment into policy-making: Insights from the Gold Coast City. J. Environ. Plan. Manag. 2015, 59, 1–25. [Google Scholar] [CrossRef]
- World Bank. Expanding the Measure of Wealth: Indicators of Environmentally Sustainable Development; World Bank: Washington, DC, USA, 1997. [Google Scholar]
- Arcadis. Sustainable Cities Index. Available online: https://www.arcadis.com/en/global/our-perspectives/sustainable-cities-index-2016/ (accessed on 14 August 2018).
- UN-Habitat CPI Global City Report. Available online: https://unhabitat.org/cpi-global-city-report-2015/ (accessed on 14 August 2018).
- United Nations. United Nations Sustainable Development Goals. Available online: https://www.un.org/sustainabledevelopment/sustainable-development-goals/ (accessed on 14 August 2018).
- China National Health City Standard. 2014. Available online: http://weisheng.cixi.gov.cn/module/download/downfile.jsp?classid=0&filename=150831154736470.doc (accessed on 14 August 2018).
- National Ambient Air Quality Standards (GB3095-2012); Ministry of Ecology and Environment of the People’s Republic of China: Beijing, China, 2012.
- Code for Planning Urban Electric Power (GB/T50293-2014); Ministry of Housing and Urban-Rural Development of the People’s Republic of China: Beijing, China, 2014.
- China National Bureau of Statistics. Natural Gas Access in China 2005–2015. 2016. Available online: http://www.chyxx.com/industry/201612/474068.html (accessed on 22 August 2018).
- China National Bureau of Statistics. Urban Water Access Standards. 2012. Available online: http://www.docin.com/p-1322584782.html (accessed on 22 August 2018).
- China 12th Five-Year Plan/Outline of Urban Public Transport Development. Available online: https://doc.guandang.net/b0c95c0f3173fb749fc9131b1.html#down (accessed on 24 August 2018).
- United Nations Statistic Division (UNSD). Per Capita GDP in US Dollars. 2016. Available online: https://unstats.un.org/UNSD/snaama/dnllist.asp (accessed on 14 August 2018).
- World Bank. GDP Per Capita (Current US$). 2017. Available online: https://data.worldbank.org/indicator/NY.GDP.PCAP.CD (accessed on 14 August 2018).
- OECD. Employment Rate. 2018. Available online: https://data.oecd.org/emp/employment-rate.htm (accessed on 14 August 2018).
- Gill, P. (Ed.) The Public Library Service: IFLA/UNESCO Guidelines for Development; DE GRUYTER SAUR: Munich, Germany, 2001. [Google Scholar]
- UNDATA. Life Expectancy. 2017. Available online: http://data.un.org/Data.aspx?d=PopDiv&f=variableID%3A66 (accessed on 14 August 2018).


© 2018 by the authors. Licensee MDPI, Basel, Switzerland. This article is an open access article distributed under the terms and conditions of the Creative Commons Attribution (CC BY) license (http://creativecommons.org/licenses/by/4.0/).