4.2.2. User Interaction Behavior–Perception Index System Establishment
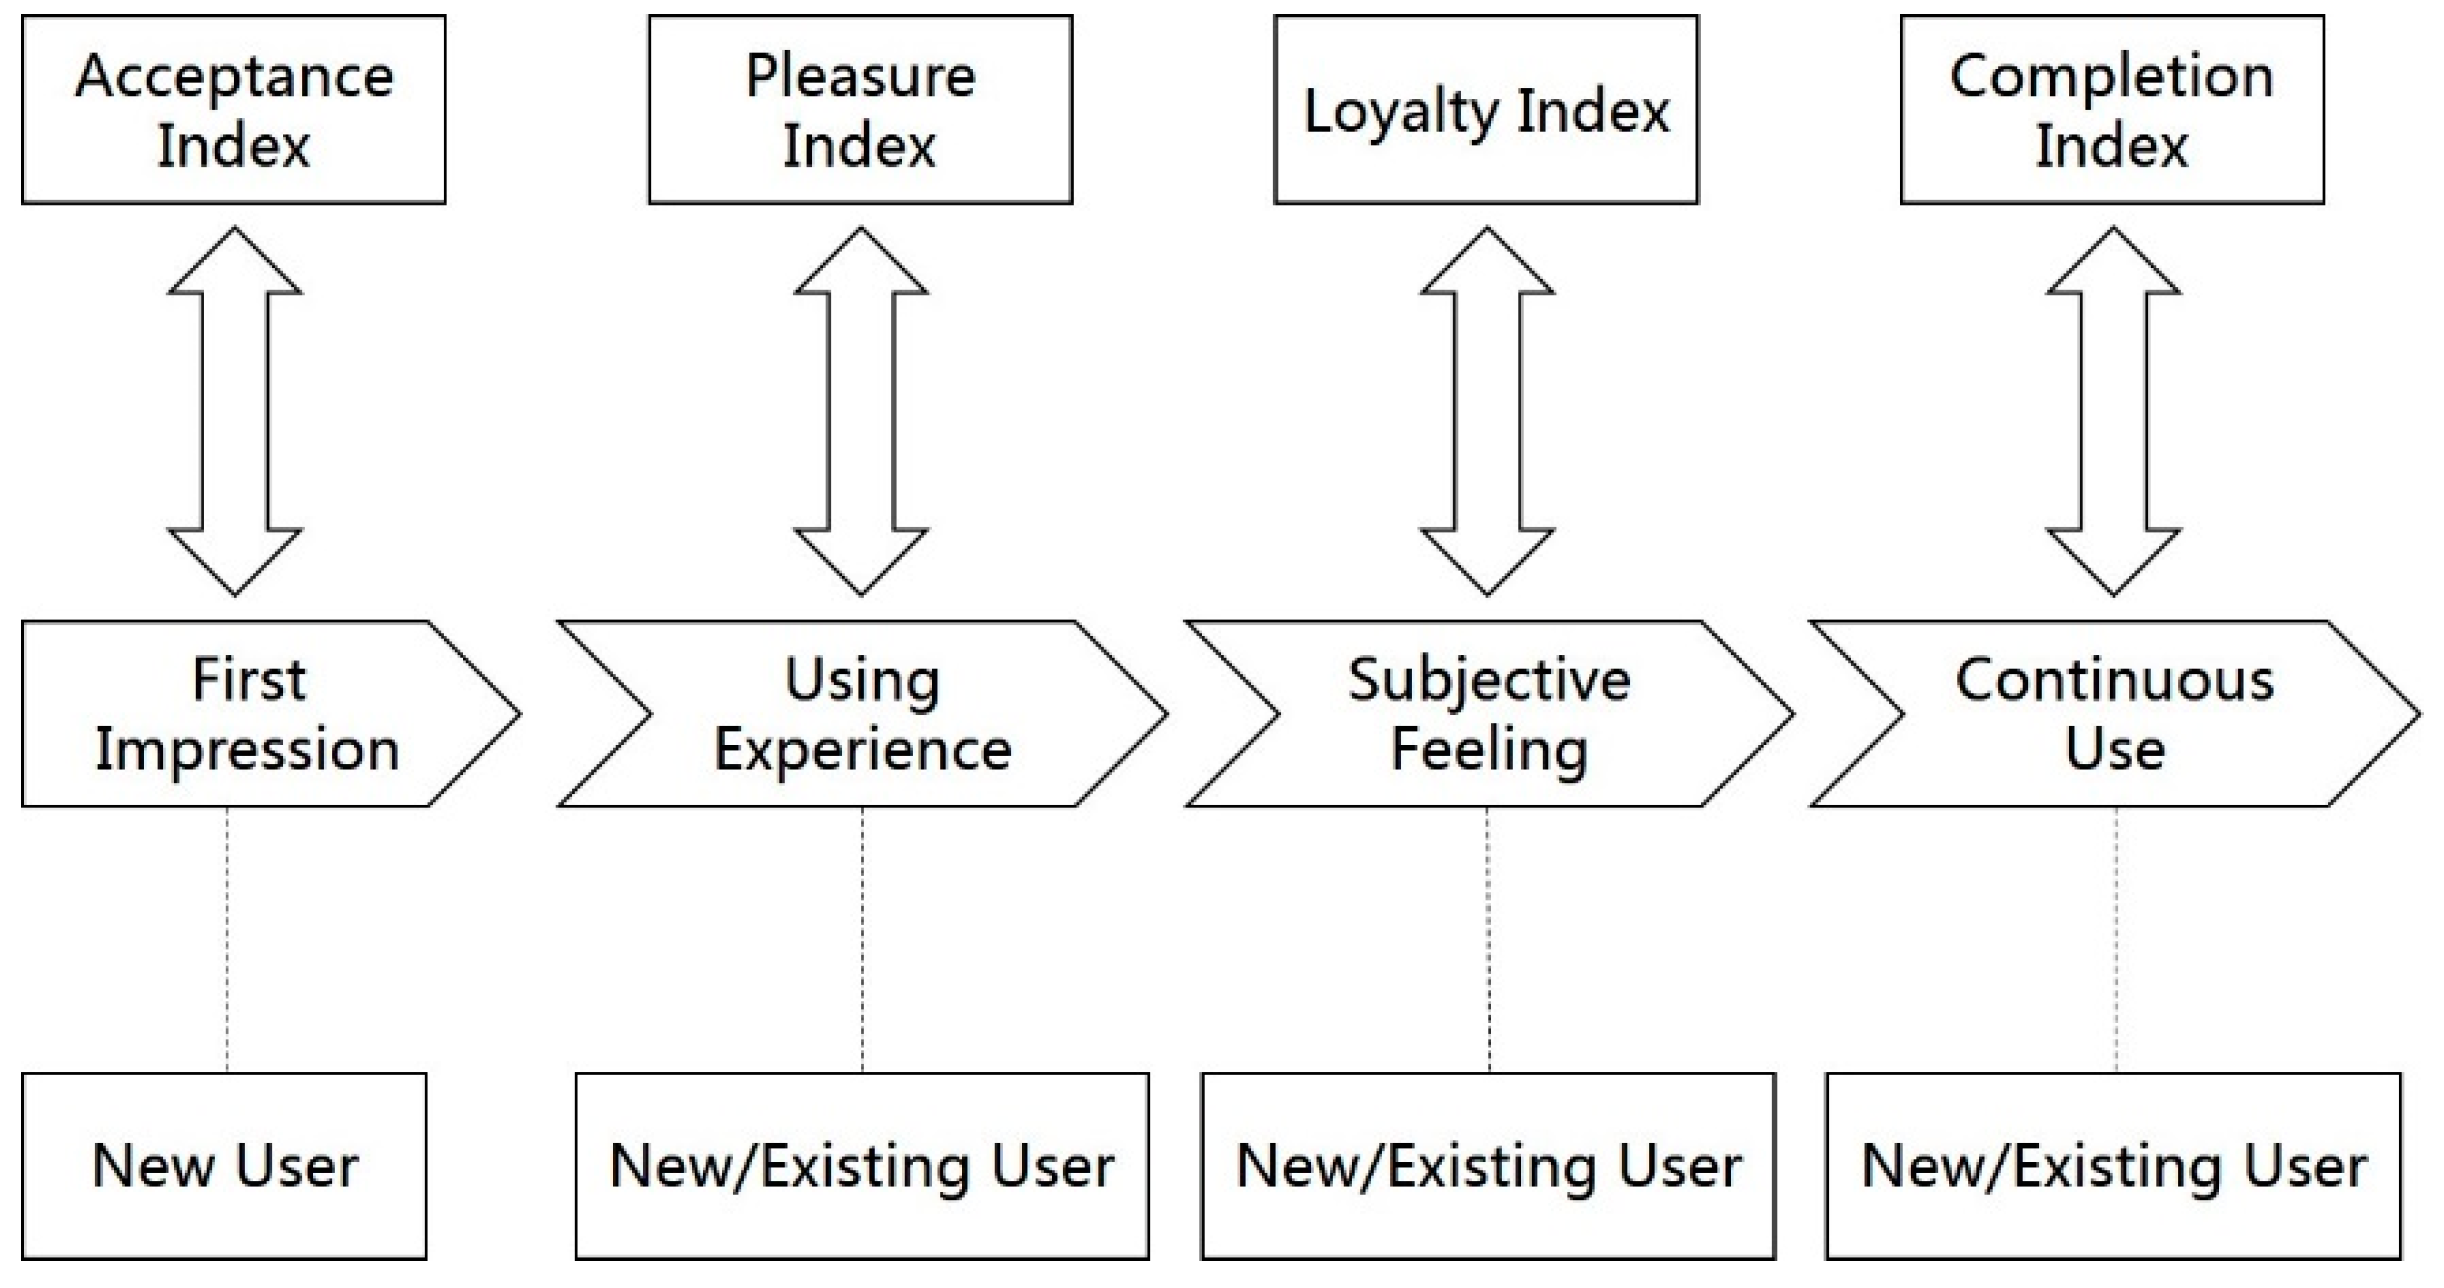
The proposed user interaction behavior-perception model consists of four indexes: acceptance index, pleasure index, the loyalty index, and the completion index.
Figure 9 depicts the correlation between the four indexes, user groups, and user journey.
As shown in
Figure 9, the acceptance index is designed to be collected from new users. It refers to a user’s understanding and acceptance of interactive functions. It is the new user’s first impression of the product. Data are collected during the cognitive and interactive stages of the user’s lifecycle.
The pleasure index is collected from all users. It is the subjective perception of users to buy, use, and give feedback on products and services. It usually involves product interface aesthetics, ease of use perception, value-added services, and other factors. The collection phase of this indicator includes “agree/accept”, “consumption”, “support”, “reward”, and “share/re-purchase/leave”.
Collecting from all users, the loyalty index is user’s biased behavioral response to the digital content product, the featured services, and brands. The typical performance of this index is that a user is highly active while using the product and purchases products from the company multiple times afterward. The scope of the index collection includes three segments: “support”, “reward”, and “repurchase”.
The completion index is also collected from all users. It shows the procedural experience of users completing within APP actions, including qualitative indexes such as time on the page, the probability of browse failure, etc. The index collection scope includes “agree/acquire”, “consumption”, and “support”.
4.2.3. User Interaction Behavior–Perception Data Collection and Analysis
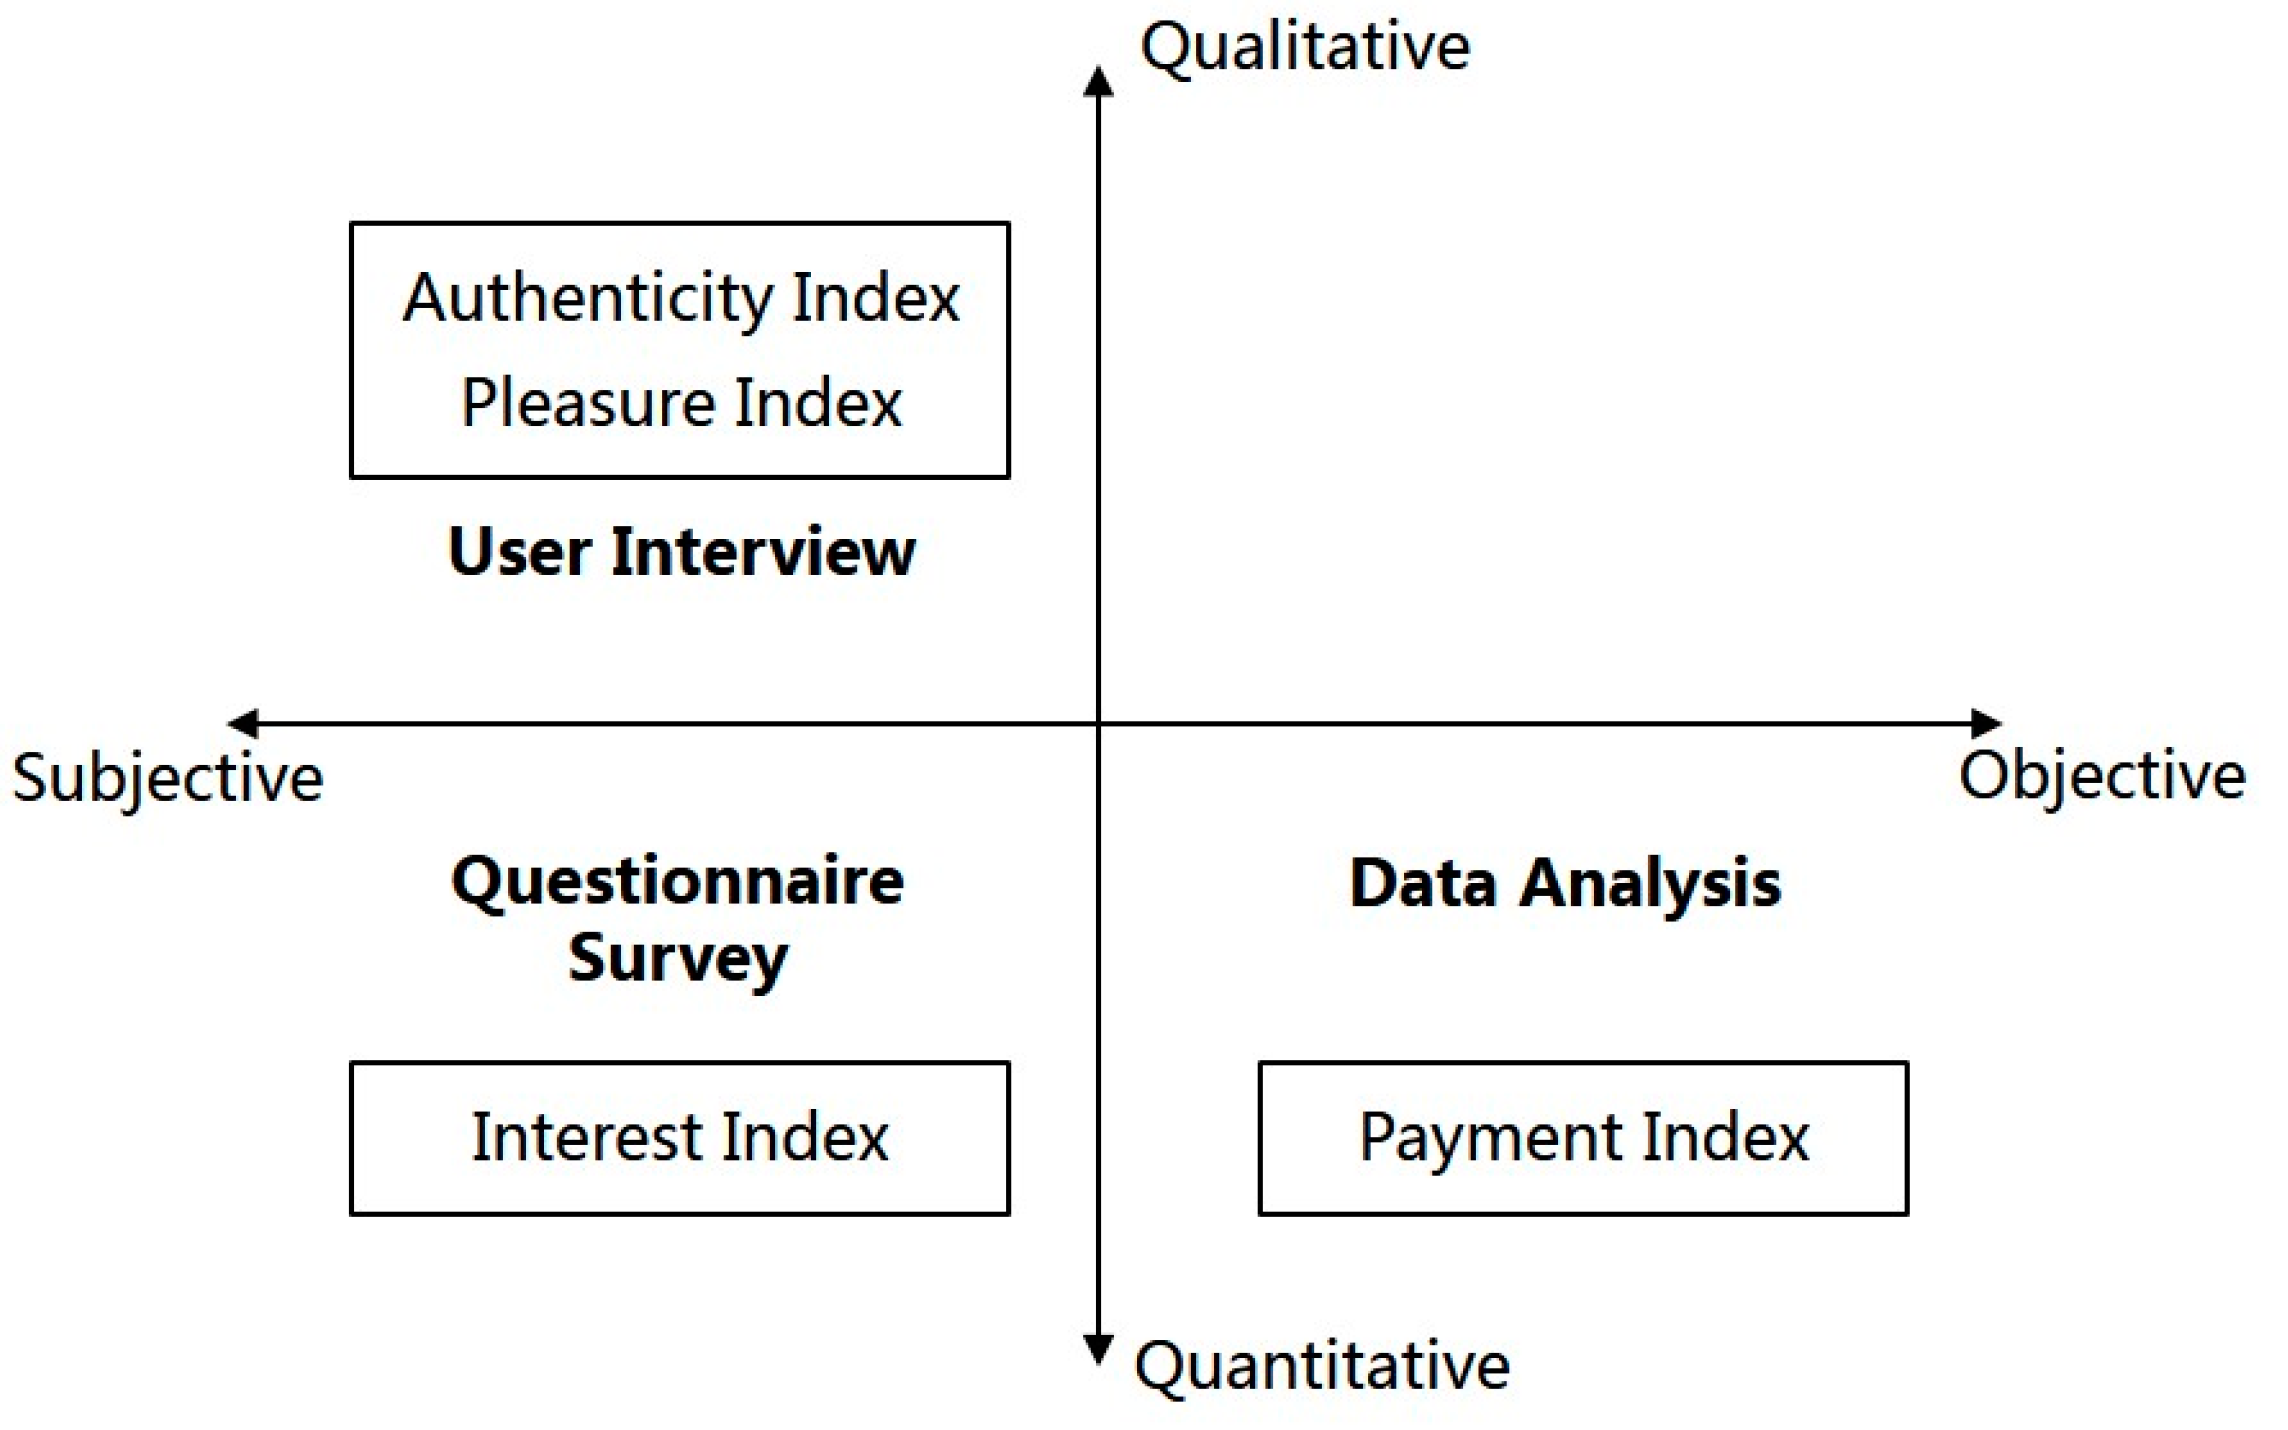
There are two main sources of user interaction behavior data that can be collected from digital content products: one is the user’s trace data inside the product, which can be monitored by embedding the “buried point”. The breakpoints and pain points of usage can be pinpointed through the intelligent analysis of such data. The other is a user’s experience-perception data. By adopting methods such as a questionnaire survey and user interviews, companies can collect user’s experience level quantitatively and aggregate specific facts of user experience qualitatively to form a detailed insight of each user’s true experience perception.
According to the characteristics of these two sources of data, this paper proposes the following two data collection methods:
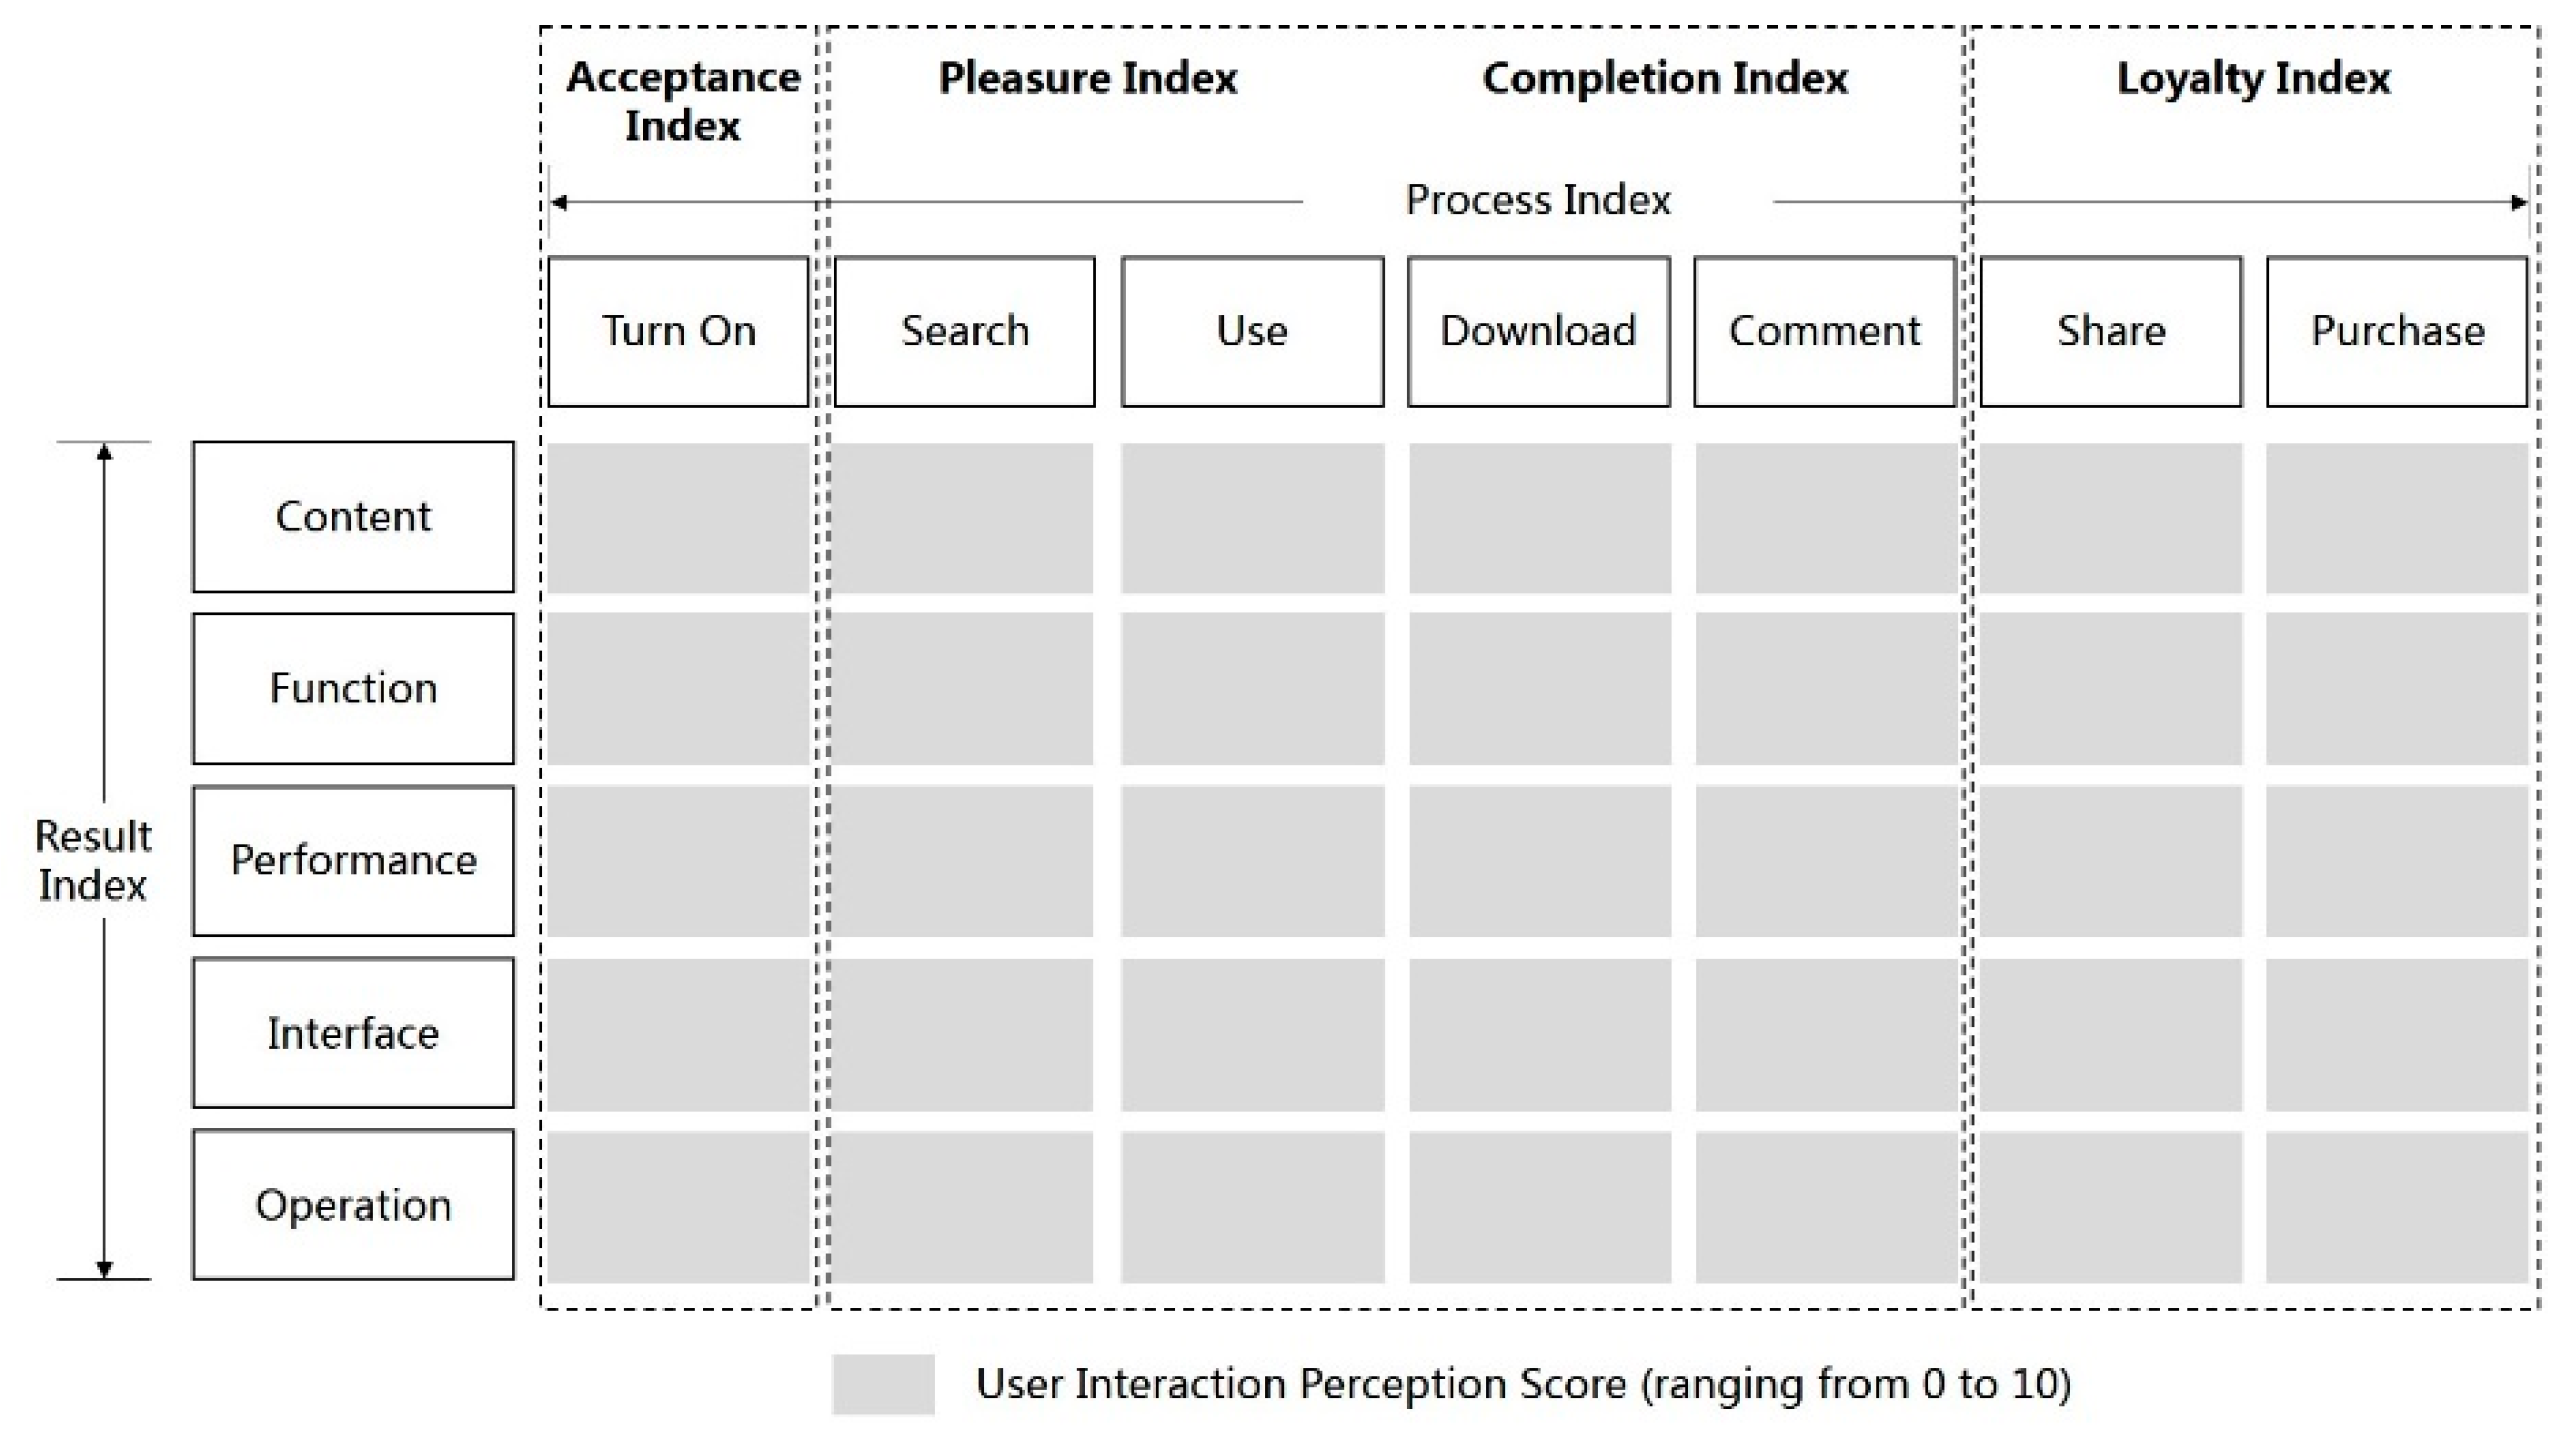
Method 1: user perception survey. The user experience survey can be conducted in two forms: a questionnaire and user interviews. By combing the user’s whole usage process “open—search—use—download—comment—share—pay” to the five dimensions of “content, performance, function, interface and operation”, a digital content product “user experience map” can be created, which quantifies each segment and dimension in the user journey with scores from 1 to 10. In this case, the company can understand how the experience of user interaction looks like and varies over time. Additionally, the “user experience map” can be converted into specific indexes in the user interaction behavior-perception model, namely, the acceptance, pleasure, loyalty, and completion indexes, as shown in
Figure 10. The perception data of each dimension of the user’s “turn-on” stage can be converted to the acceptance index of the product. The perception data of each dimension of the user’s search, use, download and comment stage can be converted to the user’s pleasure and completion index. The perception data of each dimension of the users’ sharing and purchase stage can be converted to the user’s loyalty index.
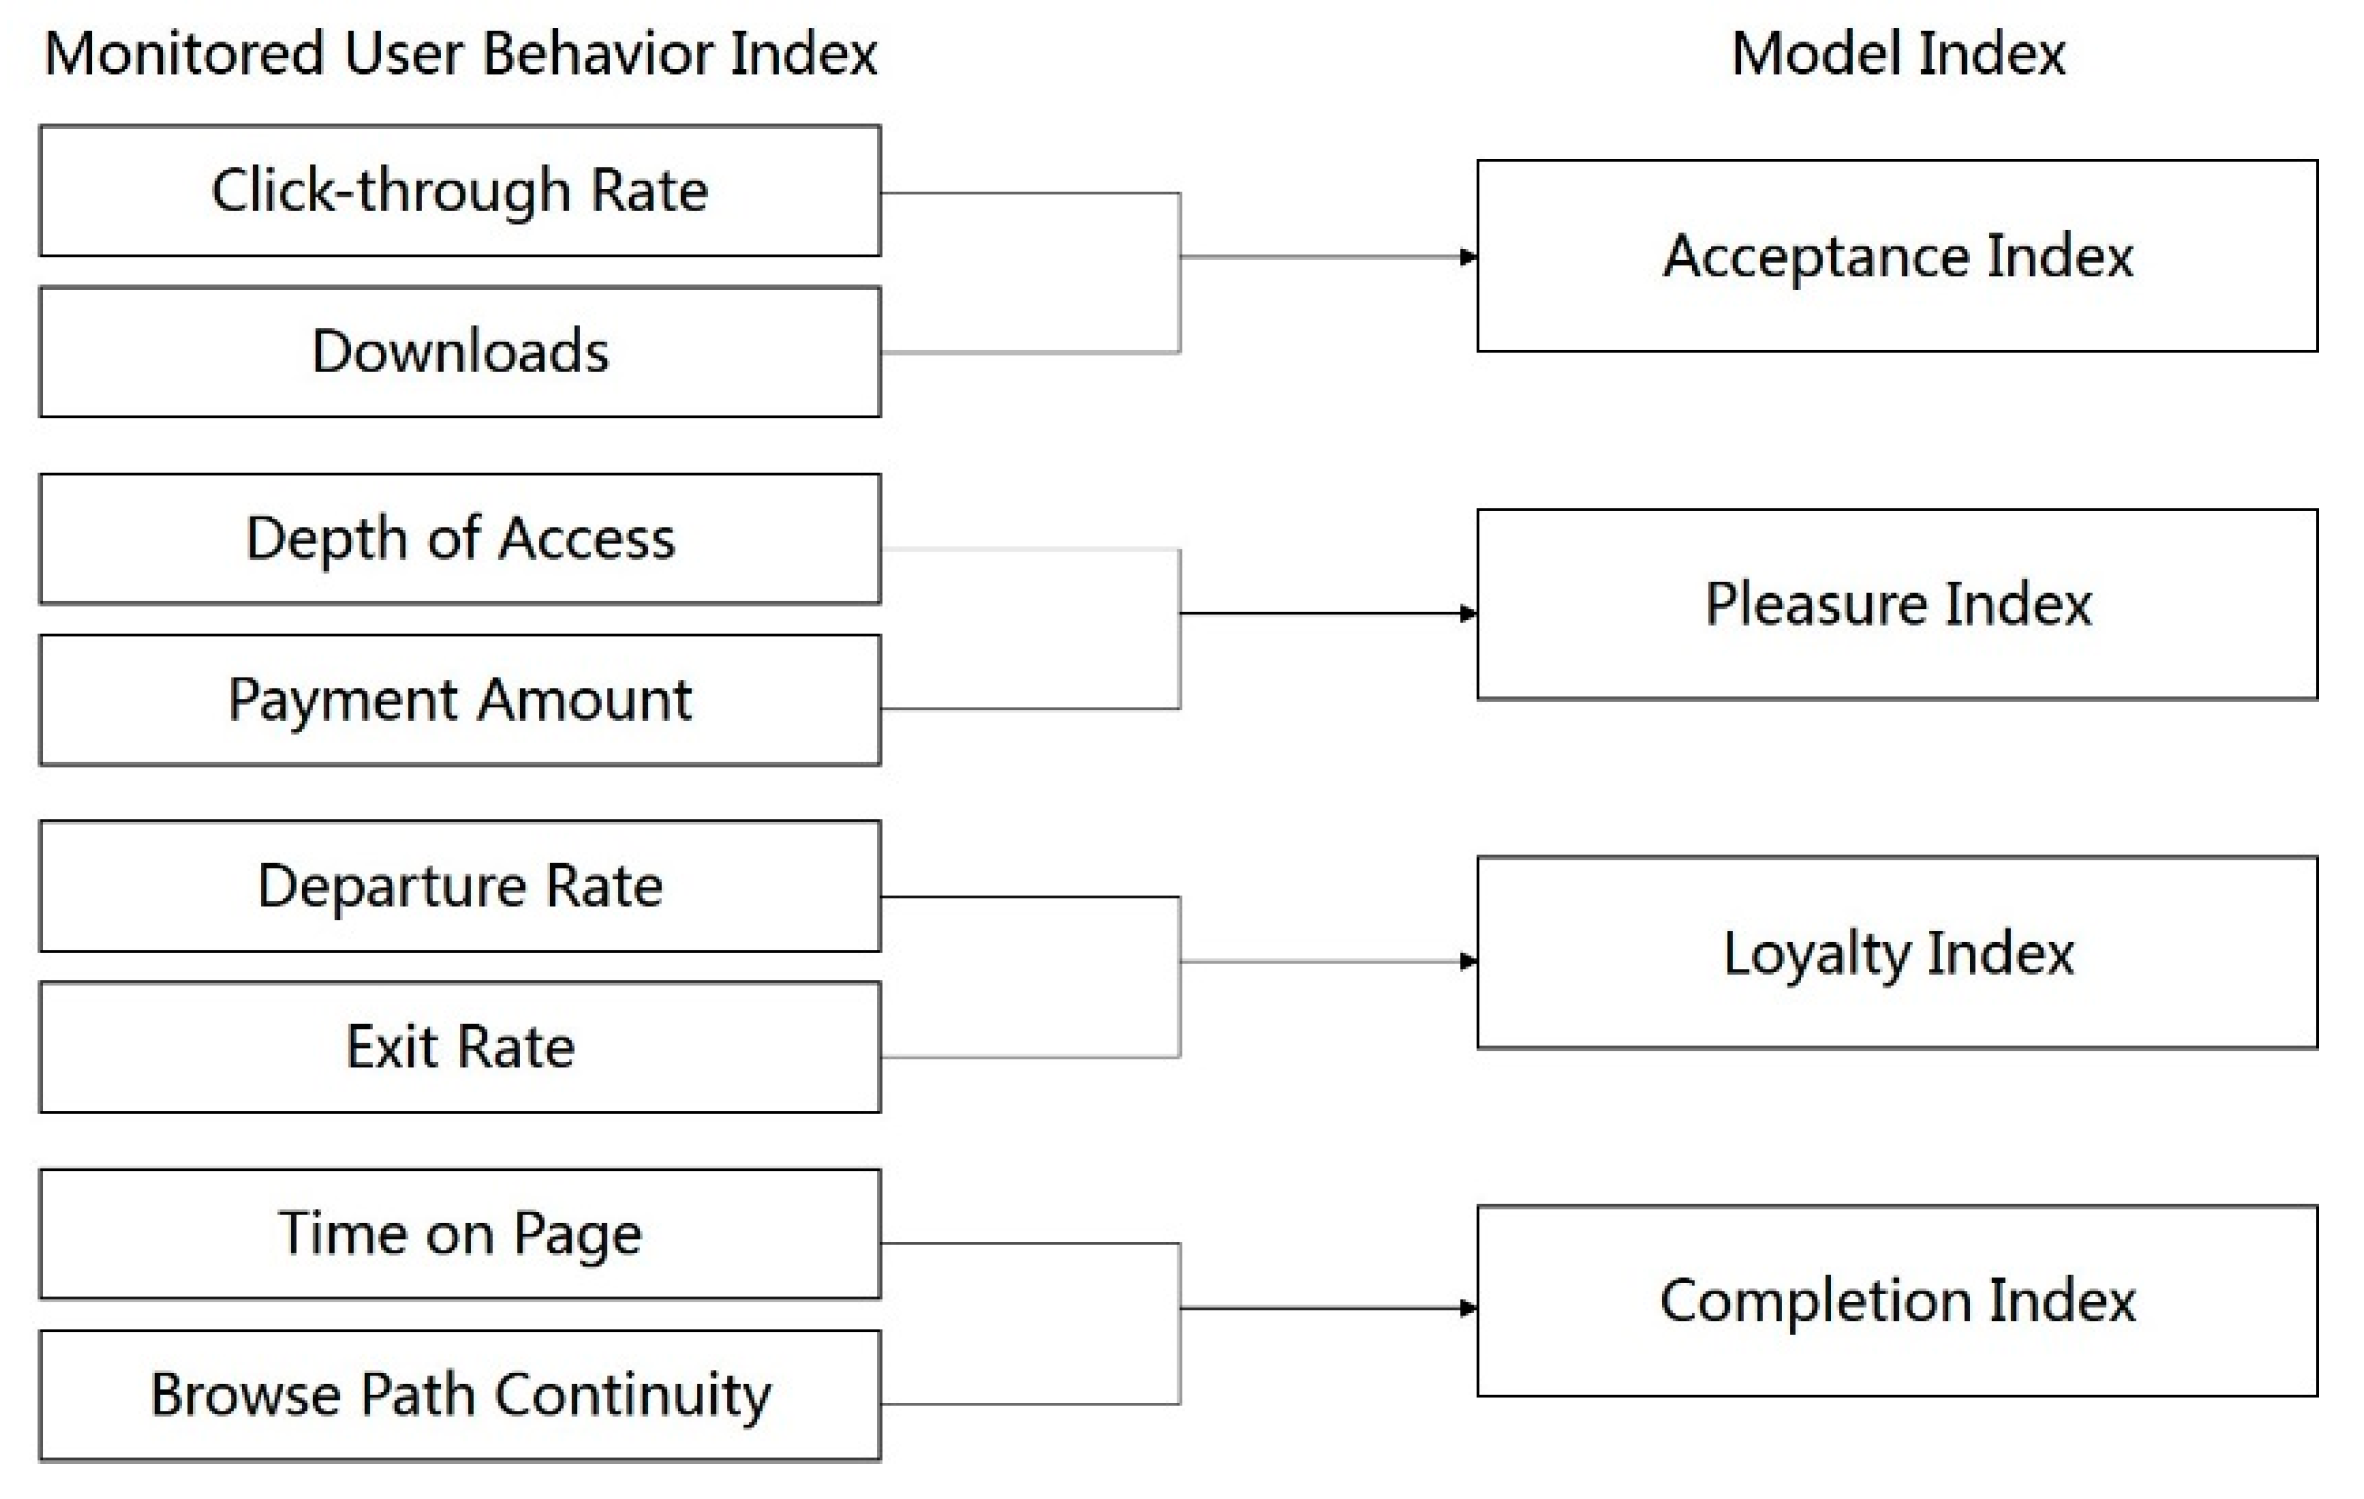
Method 2: user behavior data monitoring. By monitoring the user behavior data related indexes, the user’s real-time behavior trace can be automatically collected, which includes their click-through rate, access depth, time on page, departure rate, exit rate, download amount, payment amount, browsing path, etc. Then, the raw data collected need to be converted to the indexes in the proposed model in
Section 4.2.2, namely, the acceptability, pleasure, loyalty, and completion indexes. The correlation between the indexes and the collected user data in the user behavior monitoring is shown in
Figure 11. The user’s click-through rate and download data can be converted into the acceptance index. The access depth and payment value data can be converted into the pleasure index. The user’s departure rate and exit rate data can be converted into the loyalty index. The user’s time on page and browse path continuity data can be converted into the completion index.
When user behavior data and experience-perception data are integrated and the converted “acceptance, pleasure, loyalty, and completion” indexes are analyzed, the user experience pain points of their digital content products can be depicted distinctly, which requires pertinence measures to be taken for it. It is essential for companies to output user experience feedback and eliminate product experience drawbacks accordingly by upgrading products in time. In another word, companies should optimize product interaction ability goals with user interaction behavior-perception data to form an extended adoption of the C2B model, namely, the personalized customization format.
In order to verify the effectiveness of the proposed model, we teamed up with the same digital music software company in China to elevate the user experience level of their three APPs, namely, the mobile music APP, cellphone ringtone APP and karaoke APP. Voluntary and anonymous user participation was also demanded during the process of user perception data collection. Both a questionnaire survey and data monitoring were used as the data collection methods. Users were divided into two groups (new users and existing users) according to the proposed model index system shown in
Figure 10, to collect the corresponding data.
The four indexes of the user interaction behavior-perception model, namely, the acceptance index, pleasure index, loyalty index, and completion index, were converted and calculated from two data sources. First, we conducted a user perception survey in March 2018, and converted the collected data into the four corresponding indexes, each with a score range of 0 to 10. It was later averaged by the converted indexes from data collected in the user behavior monitoring with the same score range, making the final index score used for analysis ranging from 0 to 10.
Questionnaire Survey: In the user perception survey, three different questionnaires were designed to collect the user’s opinion of their experience of the investigated applications. According to the user experience map proposed in
Section 4.2.3, each of the three questionnaires consisted of a series of questions we designed for each segment of the user journey regarding the five aspects of user experience perception, namely, content, function, performance, interface, and operation. All participated users were asked to give a score ranging from 0 to 10 on each aspect of each user journey segment. The user experience perception level of a certain user journey segment is therefore quantified as the average score of five aspects from all users participated, which was further converted to the model index according to the correlation shown in the user experience map (
Figure 10). The personal features of the online user perception survey are shown in
Table 4.
Data Monitoring: In user behavior data monitoring, the data required for further index conversion was obtained from the company’ BOSS. After gaining permission via email confirmation from the targeted users, we extracted their required 8 types of data from BOSS in the time period of 1st to 31st March. The result of each type of data was calculated by averaging out all the users’ recorded behavior records. For example, we gained the average click-through rate of the company’s mobile music APP by averaging 500 targeted users’ daily click-through rate in March.
Results: The online questionnaire survey results of user perception are shown in
Table 5.
The results of the average behavior data from targeted users collected from data monitoring were later converted to the model index and shown in
Table 6.
In
Table 6, we divided the range of each value into 10 intervals. Among them, the demarcation point value of 10 was determined by the company’s user activity target this year, while the demarcation point of 1 represented the worst user activity performance recorded in the past year (March 2017–February 2018). Once the upper and lower bounds of the fractional interval were set, we determined the remaining boundary points based on linear distribution. After converting the user’s behavior data to a linear score range of 0–10, we further transformed the linear values into model index values according to the corresponding relationship between user data and the model index shown in
Figure 11. Considering that each index corresponds to two types of user behavior data, we simply adopted the same weight to each user data linear value, namely, we set the final value of the index as the average value of the two transformed user data linear scores. For example, in the company’s mobile music APP monitoring, the average click-through rate of all targeted users was 74%, which was transformed to the score band of 8 according to
Table 6. The average downloads quantity per day of targeted users was 28.3 MB, which was transformed to the score band of 9 according to
Table 6. The acceptance index score in user data monitoring of mobile music APP was therefore calculated as 8.5, the average value of score bands of click-through rate and downloads.
Based on the method proposed above, we quantitatively analyzed the user experience perception model index of March 2018 of the company’s 3 music APPs, as shown in
Table 7, and illustrated the user experience index distribution of the 3 APPs in the form of a radar chart, as shown in
Figure 12.
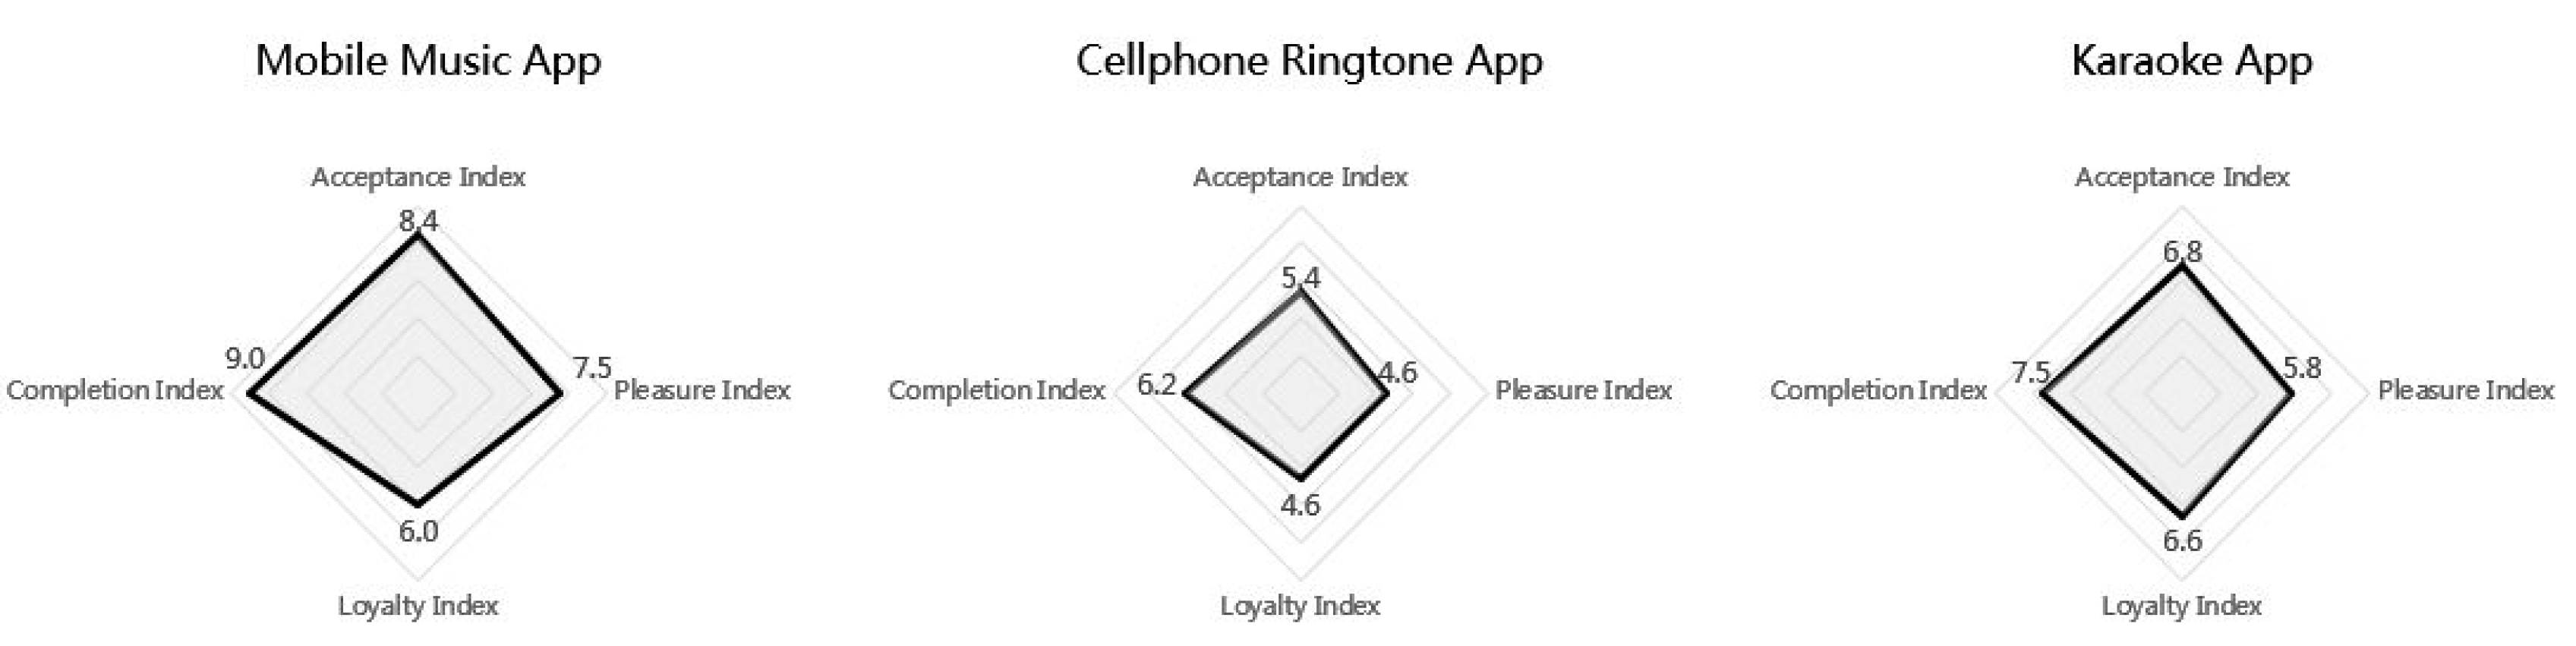
By combining the index scores in the user perception survey and user behavior monitoring and averaging them, the final results of the user experience of these 3 music APPs are shown in
Figure 12. According to the analysis results, mobile music APP reached the highest overall user perception score among the 3 APP product, while the cellphone ringtone APP was relatively less user-friendly with an average score of only 5.2 of four perception indexes. It can also be observed that the loyalty index and pleasure index of all three APPs were lower than the other two indicators, causing a common brand image weakness in the users’ perception.
The analysis results of the user behavior perception model were adopted in the company’s product optimization process in April 2018. Taking the mobile music APP as an example, the user experience radar chart indicated that although the acceptance index and completion index were in the favorable zone, the loyalty index and pleasure index were dragging behind. Corresponding measures were taken to optimize the user experience in such segments once the drawbacks were located, such as the preferential policy for membership renewal to promote user loyalty, and the introduction of the online music instrument games between stranger users to promote the pleasure level of the APP.


