Article

Design and Thermal Analysis of an Air Source Heat Pump Dryer for Food Drying

College of Engineering, Nanjing Agricultural University, Nanjing 210031, Jiangsu, China
*
Author to whom correspondence should be addressed.
Sustainability 2018, 10(9), 3216; https://doi.org/10.3390/su10093216
Submission received: 18 July 2018 / Revised: 30 August 2018 / Accepted: 3 September 2018 / Published: 8 September 2018
(This article belongs to the Section Sustainable Agriculture)

Abstract

:
In this study, an experimental heat pump dryer was designed. The specific moisture extraction rate and moisture extraction rate were used as performance indicators to explore the influence of environmental factors and the style of the hot air cycle on heat pump drying. The average temperature and humidity in Nanjing’s summer, winter, and throughout the whole year were taken as the experimental ambient temperature and humidity. Garlic slices 3 mm thick, with an initial moisture content of 66.714% w.b., were dried until the end moisture content was 10% w.b. Experimental results and thermal analysis showed that the open and semi-open heat pump dryers were greatly affected by ambient temperature and humidity. The closed heat pump drying system was greatly affected by the bypass air rate.

1. Introduction

Food drying is an important part of production. There are significant drawbacks to the traditional way in which heat for drying is gained by burning fuel: it consumes a large amount of energy and it causes serious environmental problems, such as haze problems in China [1,2,3,4]. A heat pump is a device that converts medium–low temperature heat energy into medium–high temperature heat energy. Its characteristic is to obtain a large amount of medium–high temperature heat energy using a small amount of high-grade energy, [5] which is energy saving and environmentally friendly. Using a heat pump as a heat source in food drying can solve many problems caused by the burning of fossil fuels and has attracted the attention of many researchers. Heat pump drying has the characteristics of high energy utilization, low drying temperature, and easy control, which makes it widely used in the drying process of wood, grain, and agricultural and sideline products [6,7,8,9].
A heat pump dryer (HPD) consists of a heat pump system and a dryer, and the performance of the HPD is greatly affected by the performance of the heat pump system. A different refrigerant can affect the performance of the heat pump system. It can improve the performance of the heat pump system by selecting the right refrigerant as the working medium of the heat pump system, according to the ambient temperature. Shen et al. [10] designed an air source HPD in which refrigerants R22 and R134a are adopted as the working medium for the high-stage and low-stage, respectively. According to their study, the supplying temperature can increase to 70 °C. Lee et al. [11] designed a two-cycle HPD, where one cycle used the refrigerant 124 to get a temperature greater than 80 °C and the other cycle used the refrigerant 134a.
Two cycles are performed in the HPD: (1) the refrigerant circulation in the heat pump system and (2) the drying medium circulation in wind tunnel and drying chamber. The heat exchange between the drying medium and the refrigerant is carried out by an evaporator and condenser. The drying medium absorbs moisture from material in the dryer and has a heat exchange with the heat pump system in the HPD, so its nature will have a great impact on the performance of the HPD. Chapchaimoh et al. [12] dried ginger in a closed heat pump dryer separately, using air and nitrogen as the drying medium. According to their study, when the supplied air temperature is 50 °C, the specific moisture extraction rate (SMER) of ginger drying in air is 0.06 kg water/MJ compared with 0.07 kg water/MJ.
In this paper, the drying medium is air. Hot air circulation can affect the heat exchange between the drying medium and the heat pump system, as well as affect the inlet temperature and humidity of the drying chamber. According to the style of the hot air cycle, the HPD can be divided into an open type, semi-open type, and closed type. Liu et al. [13] used a closed heat pump drying system to dry carrot slices with a thickness of 3 mm. In the experiment, researchers compared the effects of different supplied air temperatures and airflow rates on the drying performance of the heat pump dryer. Taşeri et al. [14] dried pomace with drying air at a temperature of 45 °C and different air velocities in open type HPD and closed HPD. According to their study, the drying air velocity was slightly effective on reducing the drying time; however, there was no significant effect on the power consumption. They compared the energy consumption of the HPD and convective dryer and found that the energy consumption was reduced by up to 51%.
Specific moisture extraction rate and moisture extraction rate (MER) are commonly used to evaluate an HPD. Ganjehsarabi et al. [15] performed exergy and exergoeconomic analyses of a heat pump tumbler dryer by using actual thermodynamic and cost data. They dried wet cotton fabric, and the results showed that the SMER was equal to 1.08 kg/kWh. Mortezapour et al. [16] used a hybrid photovoltaic–thermal solar dryer equipped with a heat pump system for drying saffron. According to their study, a maximum dryer efficiency of 72% and a maximum SMER of 1.16 were obtained at an air flow rate of 0.016 kg/s and air temperature of 60 °C when using the heat pump.
Control strategy is very important in improving the performance of a heat pump [8]. Wei et al. [17] used the Artificial Neural Network (ANN) model for predicting the performance of the Heat Pump (HP). Their study indicated that the ANN model was reliable and robust. Based on the ambient temperature and water temperature, a new dual fuzzy controller was studied to understand the effect of the initial opening and superheat of the electronic expansion valve on the performance of the air source heat pump water heater [18]. Yang et al. [6] proposed a synchronous control strategy to improve the control accuracy of a closed-loop HPD’s superheat and drying temperature. Ju et al. [19] provided an evaluation method for the convection hot air-drying method to improve drying efficiency and reduce energy consumption by controlling relative humidity. Although many studies have been reported on HPD, the performance of HPD influenced by the hot air circulation method in different ambient temperature and humidity conditions was seldom reported. In places like Nanjing, which is located in a subtropical monsoon climate zone, there are large changes in temperature and humidity. Thus, it is very significant for industrial manufacturers to explore the effect of different hot air circulation modes on the performance of the HPD under different ambient temperatures and humidity conditions. However, few existing works have considered the combined effects of ambient temperature and humidity and different hot air circulation methods on the drying performance of HPD. In order to fill the gaps in this research, this work studied the drying performance of HPD with different hot air cycle modes under different environmental conditions and carried out thermal analyses on this. In order to explore this question, an experimental HPD was designed. In this machine, the style of the hot air cycle can be changed by switching the air duct valve, so we can evaluate the performance of HPD with different styles of the hot air cycle. In the experiment, SMER and MER are used as performance indicators to explore the influence of environmental factors and hot air circulation on heat pump drying. The average temperature and humidity in Nanjing’s summer, winter, and throughout the whole year were the experimental environmental conditions, and garlic slices were used as the dried material. In the selected ambient temperature and humidity, garlic slices were dried using different hot air circulation methods of HPD, and an enthalpy–humidity diagram of circulated air and drying kinetics were used to analyze the experimental results.

2. Design of the Heat Pump Dryer

To improve the performance and develop a new heat pump system, many studies have focused on improving the performance of conventional heat pump systems through different methods, such as improving compressor performance, using a new heat pump working medium, or using multi-stage compression. The performance of HPD is not only influenced by the performance of the heat pump system but also the style of its hot air cycle, therefore we designed a heat pump dryer. The HPD structure diagram is shown in Figure 1. By opening and closing the air duct valve, the style of its hot air cycle can be changed.

2.1. Heat Pump System

The heat pump system is composed of three groups of air source vapor compression heat pump. Because the frequency conversion technology has a limited capacity for compressor power, researchers can start and stop the heat pump units according to the actual working conditions of the HPD. Compressor power is shown in Table 1.
For the heat pump system, the refrigerants selection for the heat pump is quite important. This is because it not only affects the performance greatly but also restricts the application of an HPD, as it has to satisfy the international standard of ozone depression potential (ODP). R407C is a new type of environmentally friendly heat pump medium with an ODP of 0, which can effectively protect the ozone layer. R407C has very similar characteristics and performance to R22 which makes it a long-term alternative to R22. R134a has good thermodynamic properties with an ODP value of 0. The ambient temperature of group 1, 2, and 3 heat pumps (see Figure 1) gradually increased. Different refrigerants are suitable for different ambient temperatures. Considering the cost and feasibility of heat pump development, the working medium of the three groups of heat pump systems were refrigerants R407C, R22, and R134a, respectively.

2.2. Air Duct Layout

The style of the hot air cycle can be achieved by adjusting the air valves. According to the degree of ventilation with the surroundings, the HPD can be divided into open, semi-open, and closed types. Exhaust gas exiting the drying chamber often contains excess heat, and the outflow gas temperature is generally higher than the ambient temperature. Therefore, it is usually necessary to pass the gas flowing out of the drying chamber through the evaporator of the heat pump system. However, if the material to be dried contains more dust, the dust will be mixed into the exhaust gas. When flowing through the evaporator, the dust will adhere to the evaporator surface, affecting its heat exchange. In this case, dust should be avoided for dry exhaust gas passing through the evaporator. The proportion of the bypassed air in the closed circulation can be adjusted by adjusting the degree of the opening and closing of the air duct valves. The fans’ power levels are shown in Table 1. The main fan is a fan close to the drying chamber.

2.3. Data Acquisition and Control System

The hardware of the data acquisition and control system is mainly composed of executive components such as industrial personal computer, Programmable Logic Controller (PLC), sensors, and inverters. The main hardware configuration is shown in Table 2 below. Programmable Logic Controller control programming is completed using STEP7 V4.0 and the configuration software is Win CC (Siemens, Berlin, Germany). Win CC does not have a PPI driver, so it cannot directly communicate with the S7-200 serial port. However, Win CC is driven by the Object Linking and Embedding for Process Control (OPC) server. Therefore, communication between Win CC and S7-200 can be realized through OPC. PC Access is used as the OPC server. The data acquisition and control process is shown in Figure 2.
The sensor transmits the temperature, humidity, air flow velocity, and mass signals collected from the site to the PLC expansion module. After the A/D conversion of the Analogy Input (AI) port of the expansion module, the analog signal is converted into a digital signal and stored in the input image register. The Central Processing Unit (CPU) converts the digital quantity into the actual value and stores it in the variable memory. The data is transmitted to the upper Industrial Computer via the Point to Point Interface (PPI) communication. PC Access on the IPC will obtain data from the PLC data registers as the OPC server. The configuration software Win CC will read data from PC Access as an OPC client and display it on the monitor screen in real time.
Traditional PID (proportion-integral-derivative) control has the advantages of having a simple algorithm, good robustness, and high reliability, and it has been widely used in industrial production processes. The HPD realized closed-loop control of the temperature and air flow at the entrance of the drying chamber. The air flow and temperature signals in the drying chamber collected by the data acquisition system are used as feedback signals. The control algorithm adopted PID control, and the key parameters in the control process were determined through the PID adaptive and tuning function of STEP7 V4.0. PID control process diagram is as shown in Figure 3.
The specific control process is as follows. The flow rate determined by the air flow will cause a disturbance to the temperature. The control strategy is to control the air flow first, then the temperature. The control process of the air flow is as follows. The PLC’s expansion module outputs the analog signal to control the frequency converter, and the frequency of the blower drive motor is controlled by the frequency converter. Then, the blower speed is controlled, and the air flow is controlled and adjusted through the blower speed. The process of temperature control is similar to the control of air flow and also uses frequency-converting control.
The temperature control process is as follows. When the temperature of the drying chamber differs greatly from the set temperature, the researchers start or stop the compressors and the electric heater according to the actual situation. When the drying chamber temperature is stable, it is controlled by PLC. Programmable Logic Controller controls the frequency converter. The frequency converter controls the compressor drive motor frequency then controls the motor rotation speed and adjusts the heat pump heating amount to achieve the purpose of controlling the temperature.

3. Experiment

3.1. Experimental Materials

The fresh garlic was harvested in Shouguang, Shandong Province, according to Chinese national standard GB5009.3-2016. The wet basis moisture content of garlic was 66.714%. Fresh garlic was peeled and sliced into thin slices, according to Yan’s study [20]. The garlic slice thickness was set to 3 mm.

3.2. Experimental Setup

The HPD described above is shown in Figure 4. The air duct valves are divided into a total of six grades (0–5), where 0 is fully closed and 5 is fully open, as shown in Figure 5. The style of the hot air cycle in the heat pump drying process is changed by adjusting the air duct valves. The heat pump operating state parameters are shown in Table 3.
Fresh garlic slices with a mass of 15 kg were spread on a drying tray with fine holes in a drying chamber which as shown in Figure 6 (1 × 1 × 0.6 m). The mass sensor on the drying plate can weigh the quality of the garlic slice. Therefore, garlic slices can be weighed in the drying process without taking them out of the drying chamber, reducing the effect of heat loss on the experimental results.

3.3. Experimental Ambient Conditions

In order to study the mean annual efficiency and the performance under cold ambient temperatures, three kinds of typical climatic conditions in Nanjing were chosen as experimental ambient conditions in the experiment: January (T1 = 2.4 °C, RH1 = 76%), July (T2 = 27.8 °C, RH2 = 81%), and the yearly average temperature and relative humidity (T3 = 15.4 °C, RH3 = 76%).

3.4. Experimental Cases

Adjustment of the air duct valves and the style of the hot air cycle selected are shown in Table 4. The semi-open heat pump drying systems were grouped according to the indraft of fresh air volume into the environment. For closed heat pump drying systems, they were divided into six groups according to hot air bypass rate (BAR), as follows.
BAR = Ar   Quantity Bypass Air   Quantity Flowing   Through   the   Evaporator

3.5. Experimental Procedures

Every experiment was performed under a constant drying temperature of 50 °C and an air velocity of 1 m/s. Under the three selected ambient conditions, every experimental case was performed three times according to the experimental procedure.
For all experiments, the drying system was run for about 20 min to obtain steady-state conditions, and when the drying chamber temperature reached 50 °C, 15 kg of fresh garlic slices were put in the drying chamber. When the moisture content of the garlic slices reached 10% w.b., the garlic slices were taken out of the drying chamber. Flow chart of experimental operating procedures is as shown in Figure 7.

3.6. Evaluation Parameters

The HPD should input the energy and extract the water for the material. To evaluate the system efficiency of an HPD, SMER was always used. For this study, this was defined as the ratio of water extracted from material to the total energy consumption (including the electric energy consumed by compressors, electric heater, and fans) in whole drying process, as follows.
SMER = The   Dehumidification   Quantity Electric   Energy   Consumption   total
where SMER is measured in kg/(kWh).
For HPD evaluation, in addition to considering energy consumption, the efficiency of the drying process is also an important indicator. In this study, MER was used to evaluate the drying efficiency of HPD, as follows.
MER = The   Dehumidification   Quantity Time   Used
where “Time Used” refers to the time the material is placed in the drying chamber until the drying is completed, and MER is measured in kg/h.

4. Results and Discussions

4.1. Experimental Results

Comparing the data in the table, it is easy to find that the higher the degree of closure of HPD, the smaller the influence of external environmental factors. When the hot air circulation mode of the HPD is the open type, the performance of the HPD is greatly affected by ambient conditions. When the hot air circulation mode of the HPD is the semi-open type, the performance of the HPD is affected both by fresh air indraft rate and the ambient conditions. When the hot air circulation mode of the HPD is the closed type, the performance of the HPD is greatly affected by the BAR. Therefore, the discussion and analysis of the three hot air circulation methods of HPD are presented separately in the following sections. Experimental Results is as shown in Table 5.

4.2. Theory

In the equations that follow, the following symbols with subscripts and superscripts are used, as follows.
SymbolNameUnits
SMERSpecific moisture extraction ratekg/(kW∙h)
MERMoisture extraction ratekg/h
COPCoefficient of performance-
cpSpecific heat at constant pressurekJ/(kg∙K)
TTemperatureK
RHRelative humidity-
dAbsolute humiditykg water vapor/kg dry air
DRDrying rateg/(g∙h)
rsEvaporative latent heat of waterkJ/kg
hEnthalpykJ/kg
mMass flow ratekg/s
QLCooling capacity of heat pumpkW
QHHeating capacity of heat pumpkW
TMTorque of the compressorN∙m
nRotation rate of the compressorr/min
WPower consumptionkW
xFresh air entering rate-
SubscriptName
drdrying chamber
evapevaporator
condcondenser
refrefrigerant
aircirculated air
ininlet
outoutlet
compcompressor
HPDheat pump dryer
ehelectric heater
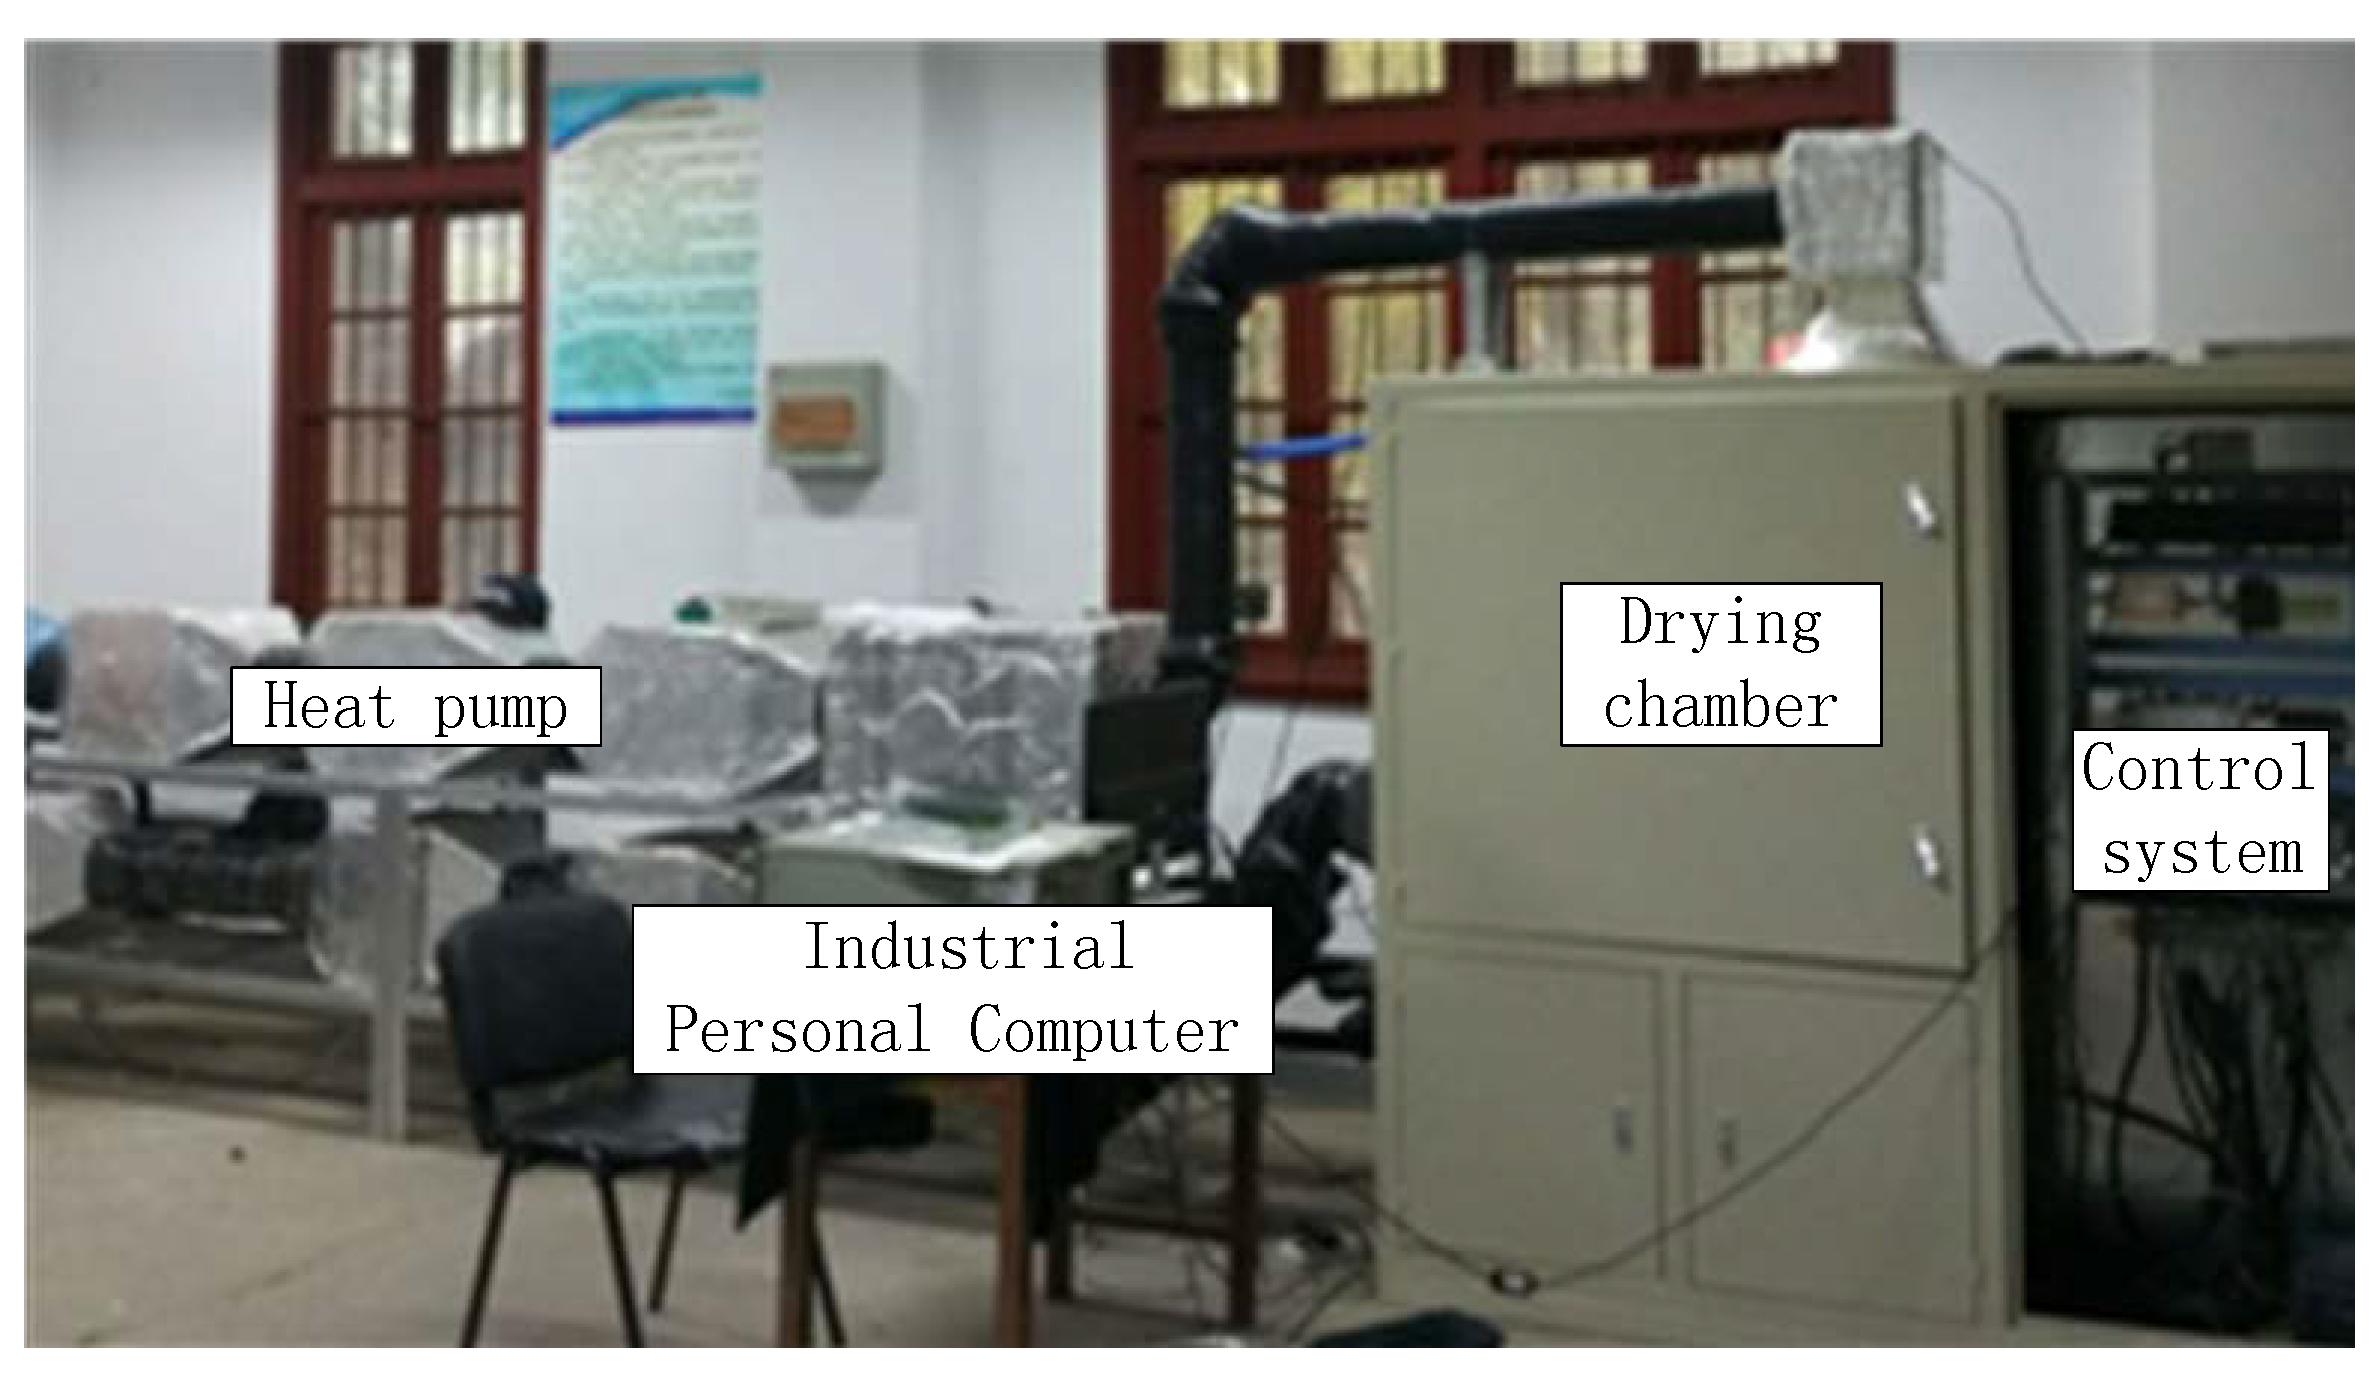
A HPD without an electric heater consists of a heat pump system and drying chamber.
In the ideal model, the process of heating hot air in the drying chamber can be regarded as a hot air adiabatic cooling process, as follows.
c p ( T air , dr , in T air , dr , out ) = ( d air , dr , out d air , dr , in ) r s
However, in practice, the hot air enthalpy decreases when hot air flows through the drying chamber, as follows.
Δ h air , dr = c p ( T air , dr , in T air , dr , out ) r s ( d air , dr , out d air , dr , in )
For materials, there is the following formula.
DR = M t M t + Δ t Δ t
where t1 and t2 are the drying times (in h), and Mt and M t + Δ t are the moisture contents (in db) at times t and ( t + Δ t ) , respectively.
In the drying chamber, the lost moisture of the material migrates to circulated air. The following formula can be obtained according to the law of conservation of mass.
m air , dr ( d air , dr , out d air , dr , in ) = G DR 3 , 600 , 000
where G is the mass of the absolute drying material.
There are two heat exchange processes with the heat pump system during the hot air cycle, as follows.
Q L = m air , evap ( h air , evap , in h air , evap , out ) = m ref , evap ( h ref , evap , out h ref , evap , in )
Q H = m air , cond ( h air , cond , out h air , cond , in ) = m ref , cond ( h ref , cond , in h ref , cond , out )
The enthalpy value of circulated air is calculated as follows.
h air = c p , air T + r s d
c p , air = 1.01 + 1.84 d
For the heat pump system, there is the following formula.
W comp = Q H Q L = T M n 9550
By adjusting the motor frequency, the compressor speed and the compressor power can be controlled.
The heating coefficient of performance (COP) formula is as follows.
COP = Q H W comp

4.3. Discussion and Analysis of the Closed Type HPD

The enthalpy–humidity diagram of circulated air is used to analyze and discuss the closed type HPD. As shown in Figure 8, the air flowed through 1-2(1’-2’) in the drying chamber. It was expected that point 2 was delegated the outlet parameter from the mainly drying chamber, as shown in Formula (4). Δ h 1 2 is enthalpy loss of circulated air when the hot air passes through the drying chamber. When the BAR was zero, the air flowed through 2-3-4 (2’-3’-4’) in the evaporator. The heat absorbed from condenser through 4-1(4’-1’).
According to the second law of thermodynamics, heat will not flow spontaneously from a cold object to a hot one, so W comp is indispensable for HPD. According to the first law of thermodynamics, for a closed type HPD, the formula is as follows.
W comp + W eh = m air Δ h air , dr + Δ Q HPD
where Δ Q HPD is HPD’s heat change value per unit time, in kJ/s.
When HPD is in a steady-state, W comp is greater than m air Δ h air , dr . Many researchers use the auxiliary condenser to remove excess heat from the system. As we all know, this will waste a lot of energy. For a closed type HPD, if the inlet of the drying chamber maintains a constant temperature, Δ Q HPD should be small to save energy. The compressor power can be controlled by adjusting the frequency converter, so it is achievable to decrease Δ Q HPD .
It is known that if W comp decrease, Q L will decrease. As shown in 
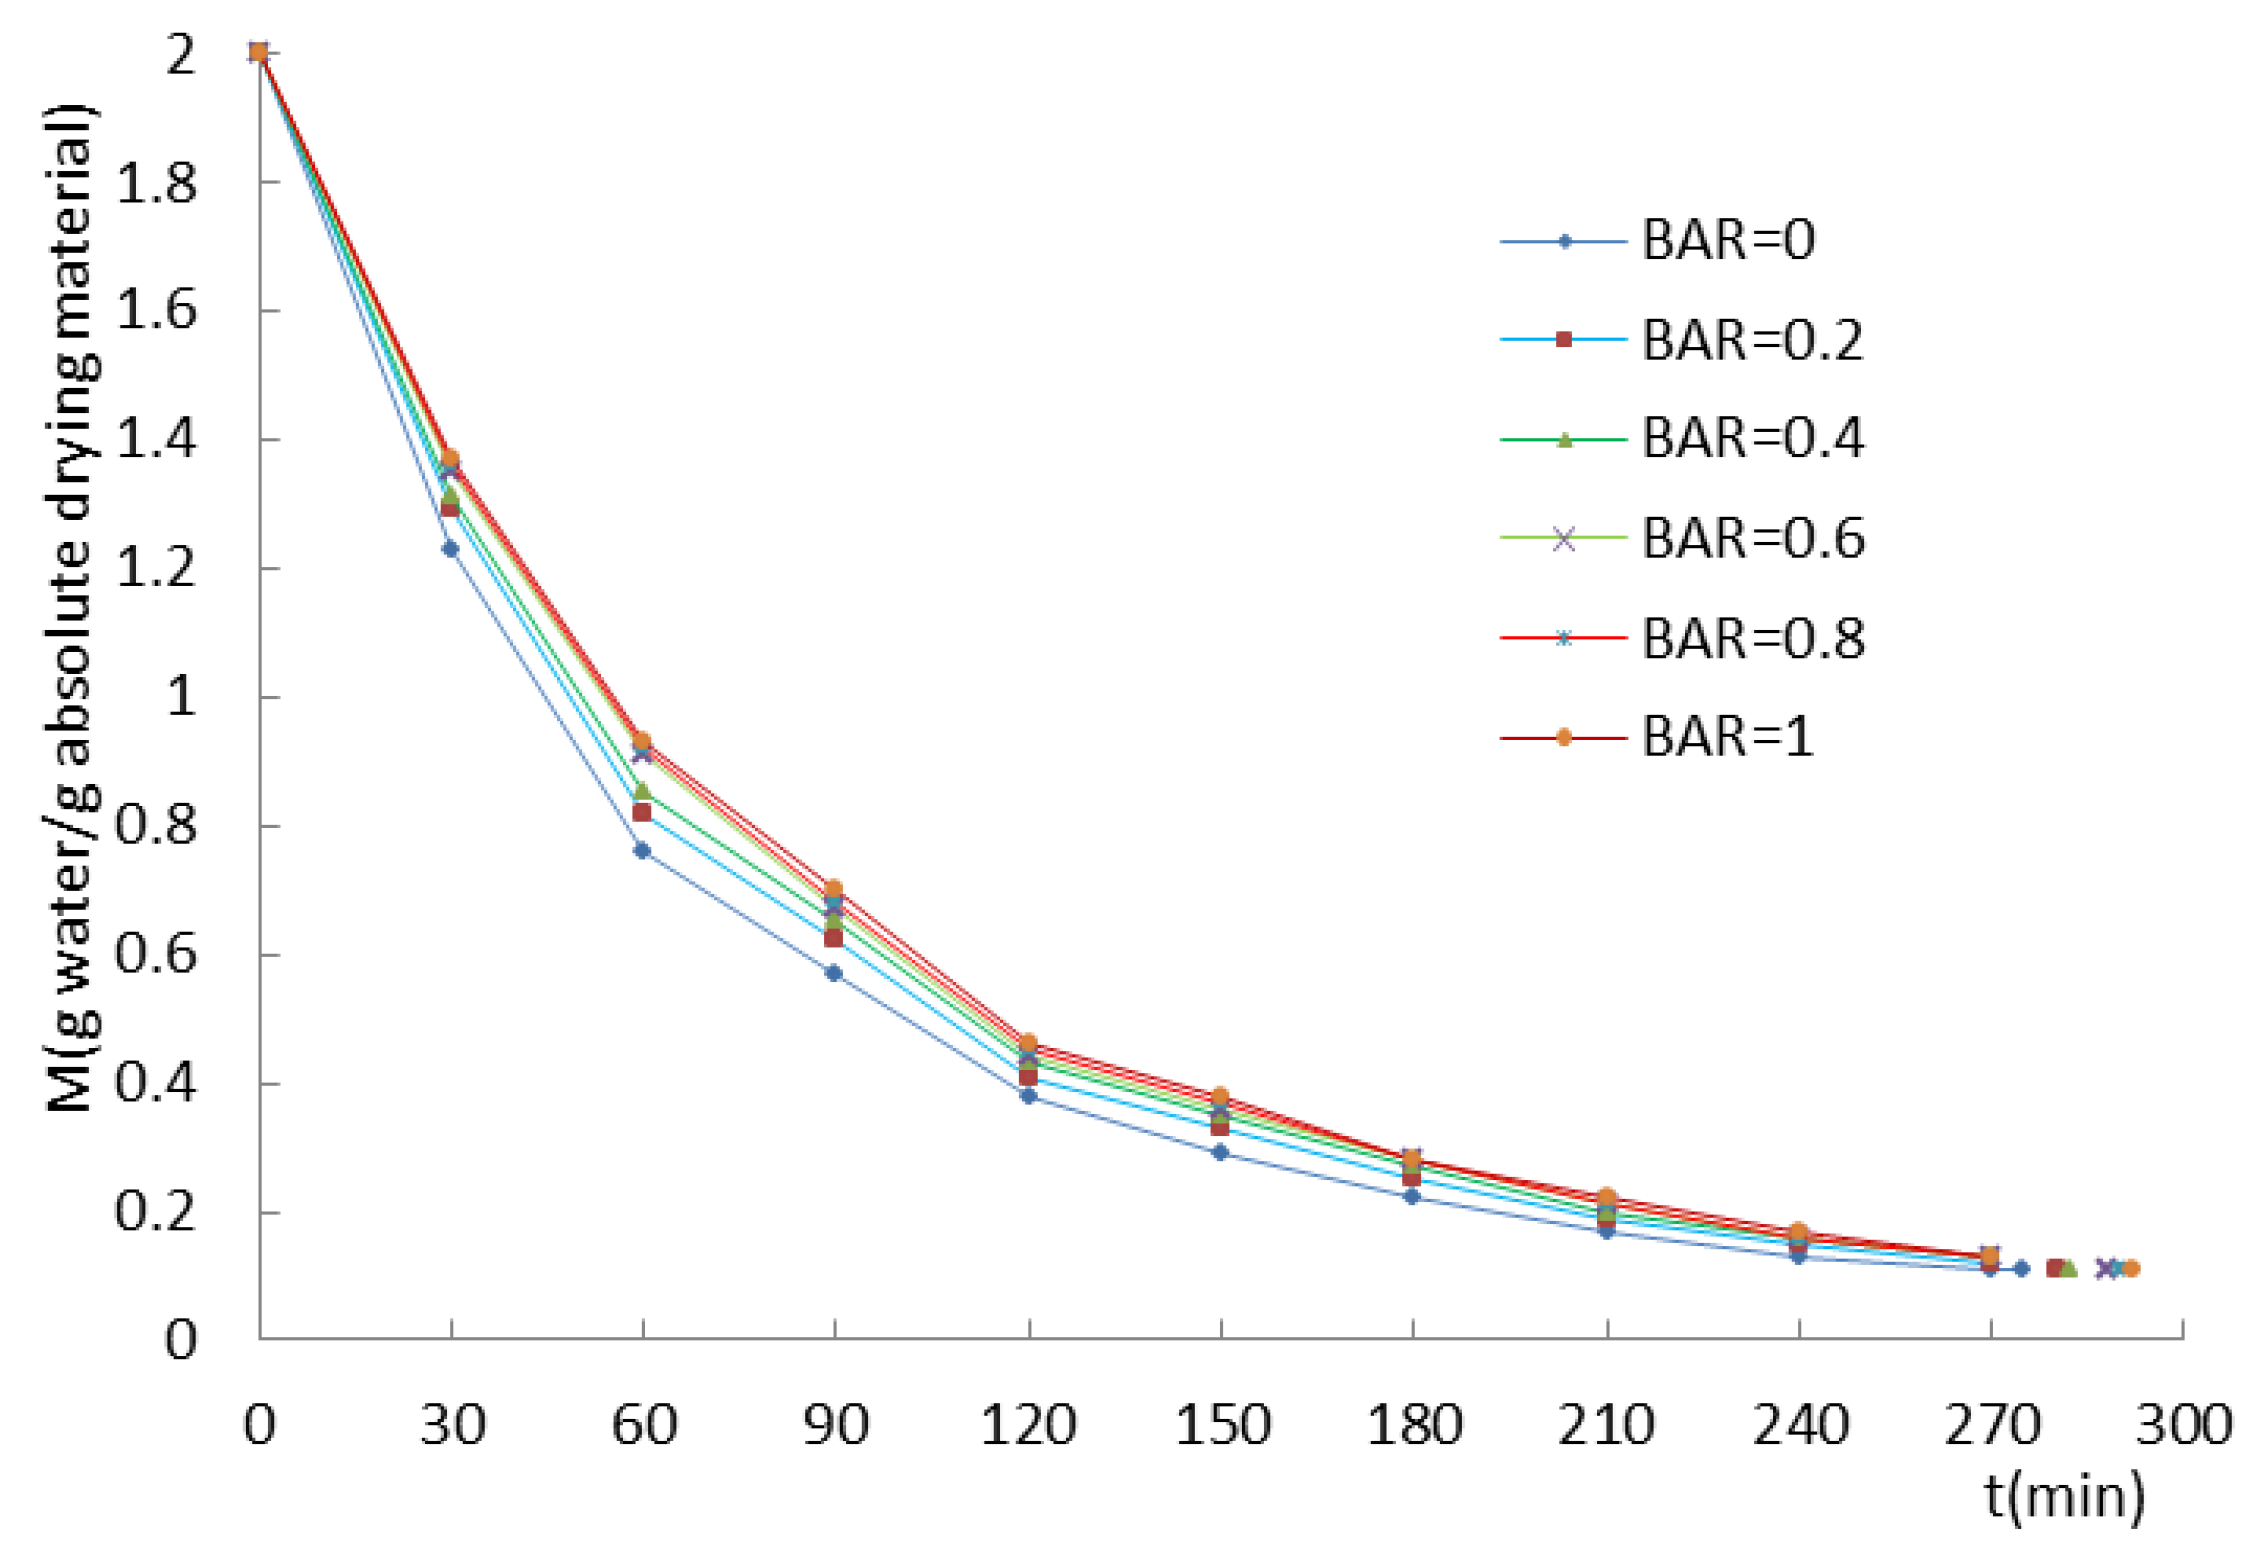
Figure 5, 1-2-3-4 is the cycle of circulated air when compressor frequency is high and 1’-2’-3’-4’ is the cycle of circulated air when compressor frequency is low. In the experiment, we found that drying rate (DR) will decrease when the air humidity at the inlet of the drying chamber increases. This is consistent with Hao-Yu’s research conclusions [21]. According to Formula (7), Δ d 2 1 > Δ d 2 1 . This increases the time for drying the material to the specified moisture content and the electric energy consumed by the fan. This, in turn, affects the MER and SMER values of HPD.
As we know from experimental data, when the hot air circulation mode of the HPD is the closed type, the performance of the HPD is greatly affected by the BAR. As shown in Figure 5, if the system operated at different BARs, air flow from the main drying chamber divided into two paths. One was 2’-3’-5’ which flowed through the evaporator and extracts the moisture from the air. The other path flows through the air bypass duct. The two airs mixed at point 6’. The heat absorbed from the condenser from 6’ to 1’. Thus, the HPD with air bypass duct could decrease the heat absorption as follows.
Q L = m air , dr ( h 2 h 6 ) = c p , air ( T 2 T 6 ) + r s ( d 2 d 6 )
Q H + W eh = m air , dr ( h 1 h 6 ) = c p , air ( T 1 T 6 ) + r s ( d 1 d 6 )
W comp = Q H Q L = Q H COP
After HPD enters steady-state conditions, the COP of the heat pump system tends to be stable. Compared with the HPD without an air bypass duct, the heating capacity of the HPD with an air bypass duct is reduced, and the compressor work is reduced as follows.
Δ Q L = Δ Q H = m air , dr ( h 6 h 4 )
Δ W comp = Δ Q H COP
According to the fluid flow continuity equation, a closed HPD’s circulated air can be calculated using the equation as follows.
m air , dr = m air , evap + m Bypass = m air , cond
Point 6’ is the confluence of m air , evap and m Bypass , with the following equation.
d 6 = BAR 1 + BAR d 2 + 1 1 + BAR d 5
h 6 = BAR 1 + BAR h 2 + 1 1 + BAR h 5
Circulated air at the outlet of the drying chamber is at a high temperature and high humidity, it needs to flow through the evaporator to reduce its temperature and humidity. As BAR increases, the amount of air flowing through the evaporator decreases, and the heat exchange effect of evaporator will increase. However, the improvement of the heat transfer effect of the evaporator is not unlimited and, as the BAR increases, the flow of air through the evaporator drops to a certain amount, and d5’ can no longer be reduced.
The following formula can be derived based on Formula (10).
h 6 = BAR 1 + BAR ( c p , air T 2 + r s d 2 ) + 1 1 + BAR ( c p , air T 5 + r s d 5 )
According to the above analysis, under the premise of keeping d 6 unchanged or slightly increasing, increasing the value of h 6 can improve the HPD performance index. According to the experimental results, under the conditions of this paper, the best SMER value is obtained when the BAR is equal to 0.4. However, with the rise of BAR, d6’ will also rise, which will affect the HPD’s DR and MER, as shown in Figure 9.

4.4. Discussion and Analysis of Open Type and Semi-Open Type HPD

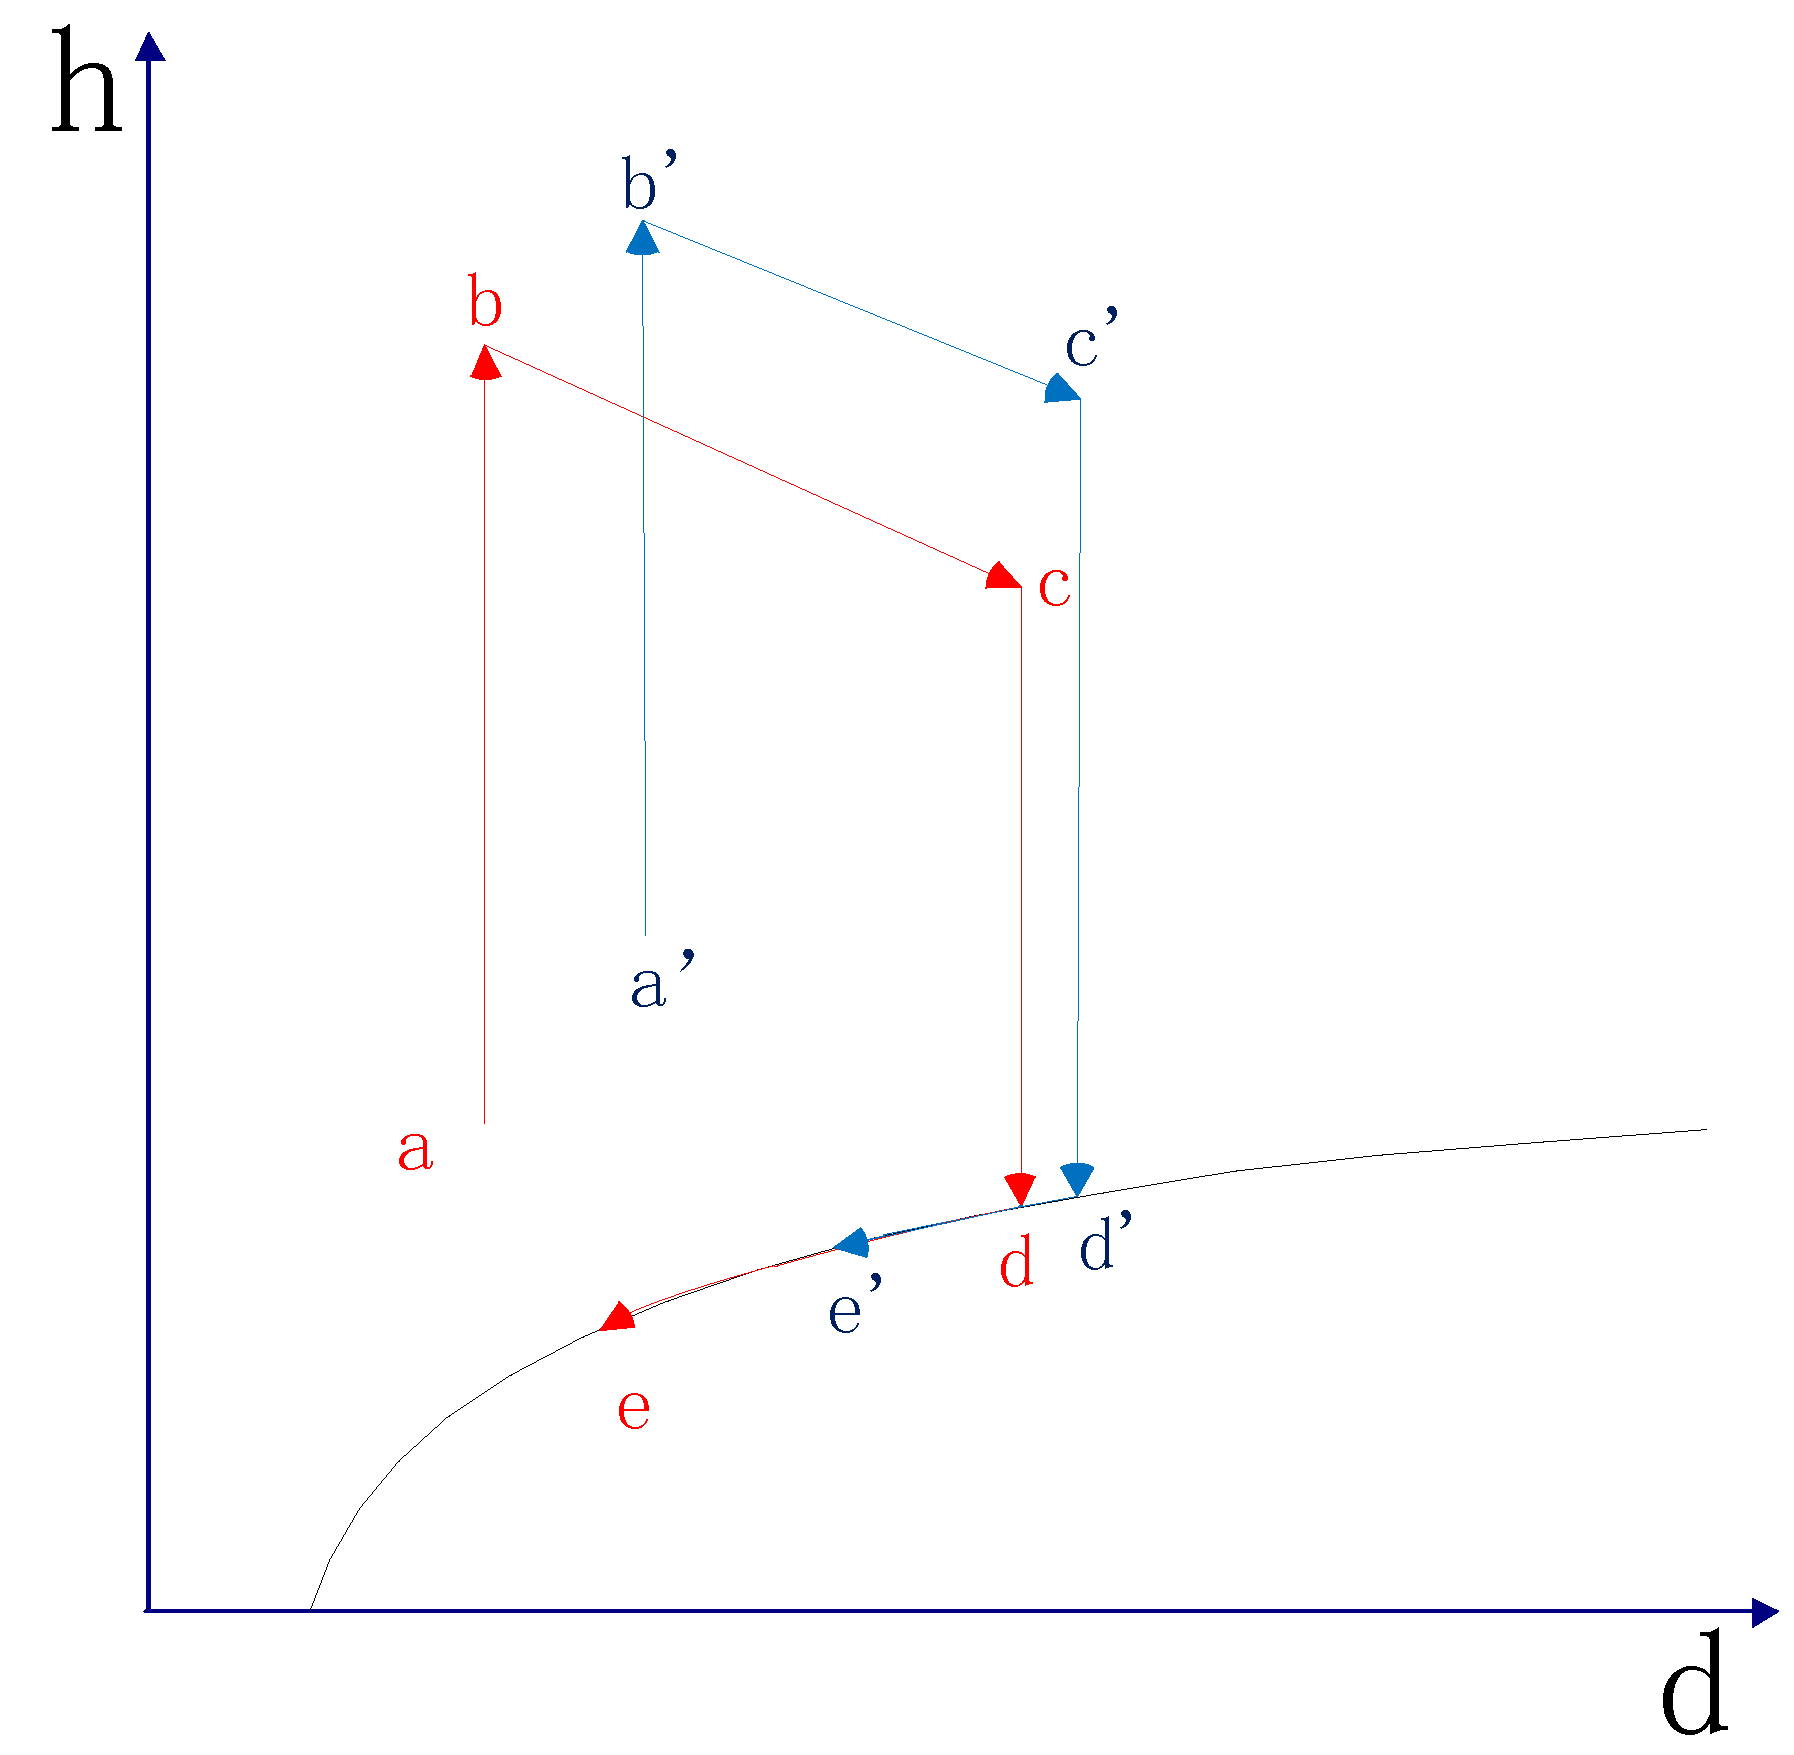
The enthalpy–humidity diagram of circulated air is used to analyze and discuss the open type HPD. As shown in Figure 10, point a (a’) indicates parameters of the outside ambient air. The heat was absorbed from the condenser through a–b (a’–b’), and the circulated air that flowed through b-c (b’-c’) in the drying chamber, as shown in Formula (7). Δ h b c is the enthalpy loss of circulated air when the hot air passes through the drying chamber. The air flowed through c-d-e (c’-d’-e’) in the evaporator and was discharged to the outside environment.
As we know from experimental data, when the hot air circulation mode of the HPD is open type, the performance of the HPD is greatly affected by ambient conditions. As shown in Figure 10, a-b-c-d-e is the cycle of circulated air when the ambient temperature and ambient humidity are low, and a’-b’-c’-d’-e’ is the cycle of circulated air when the ambient temperature and ambient humidity are high. According to the first law of thermodynamics, for the open type HPD, the formula is as follows.
W comp + W eh = m air ( Δ h air , dr + h air , HPD , out h air , HPD , in )
Point a shows the inlet air state parameters of the HPD when the HPD works in a high ambient temperature and high ambient humidity, and point a’ shows the inlet air state parameters of HPD when the HPD works in a low ambient temperature and low ambient humidity. Ta is greater than Ta’, so if the lower temperature air is heated to the same temperature, the HPD needs to consume more power for the compressor and electric heater, and this would affect the HPD’s SMER. According to the experimental results, Δ d b c > Δ d b c , so a high ambient temperature and high ambient humidity reduce the open type HPD’s MER and material’s DR.
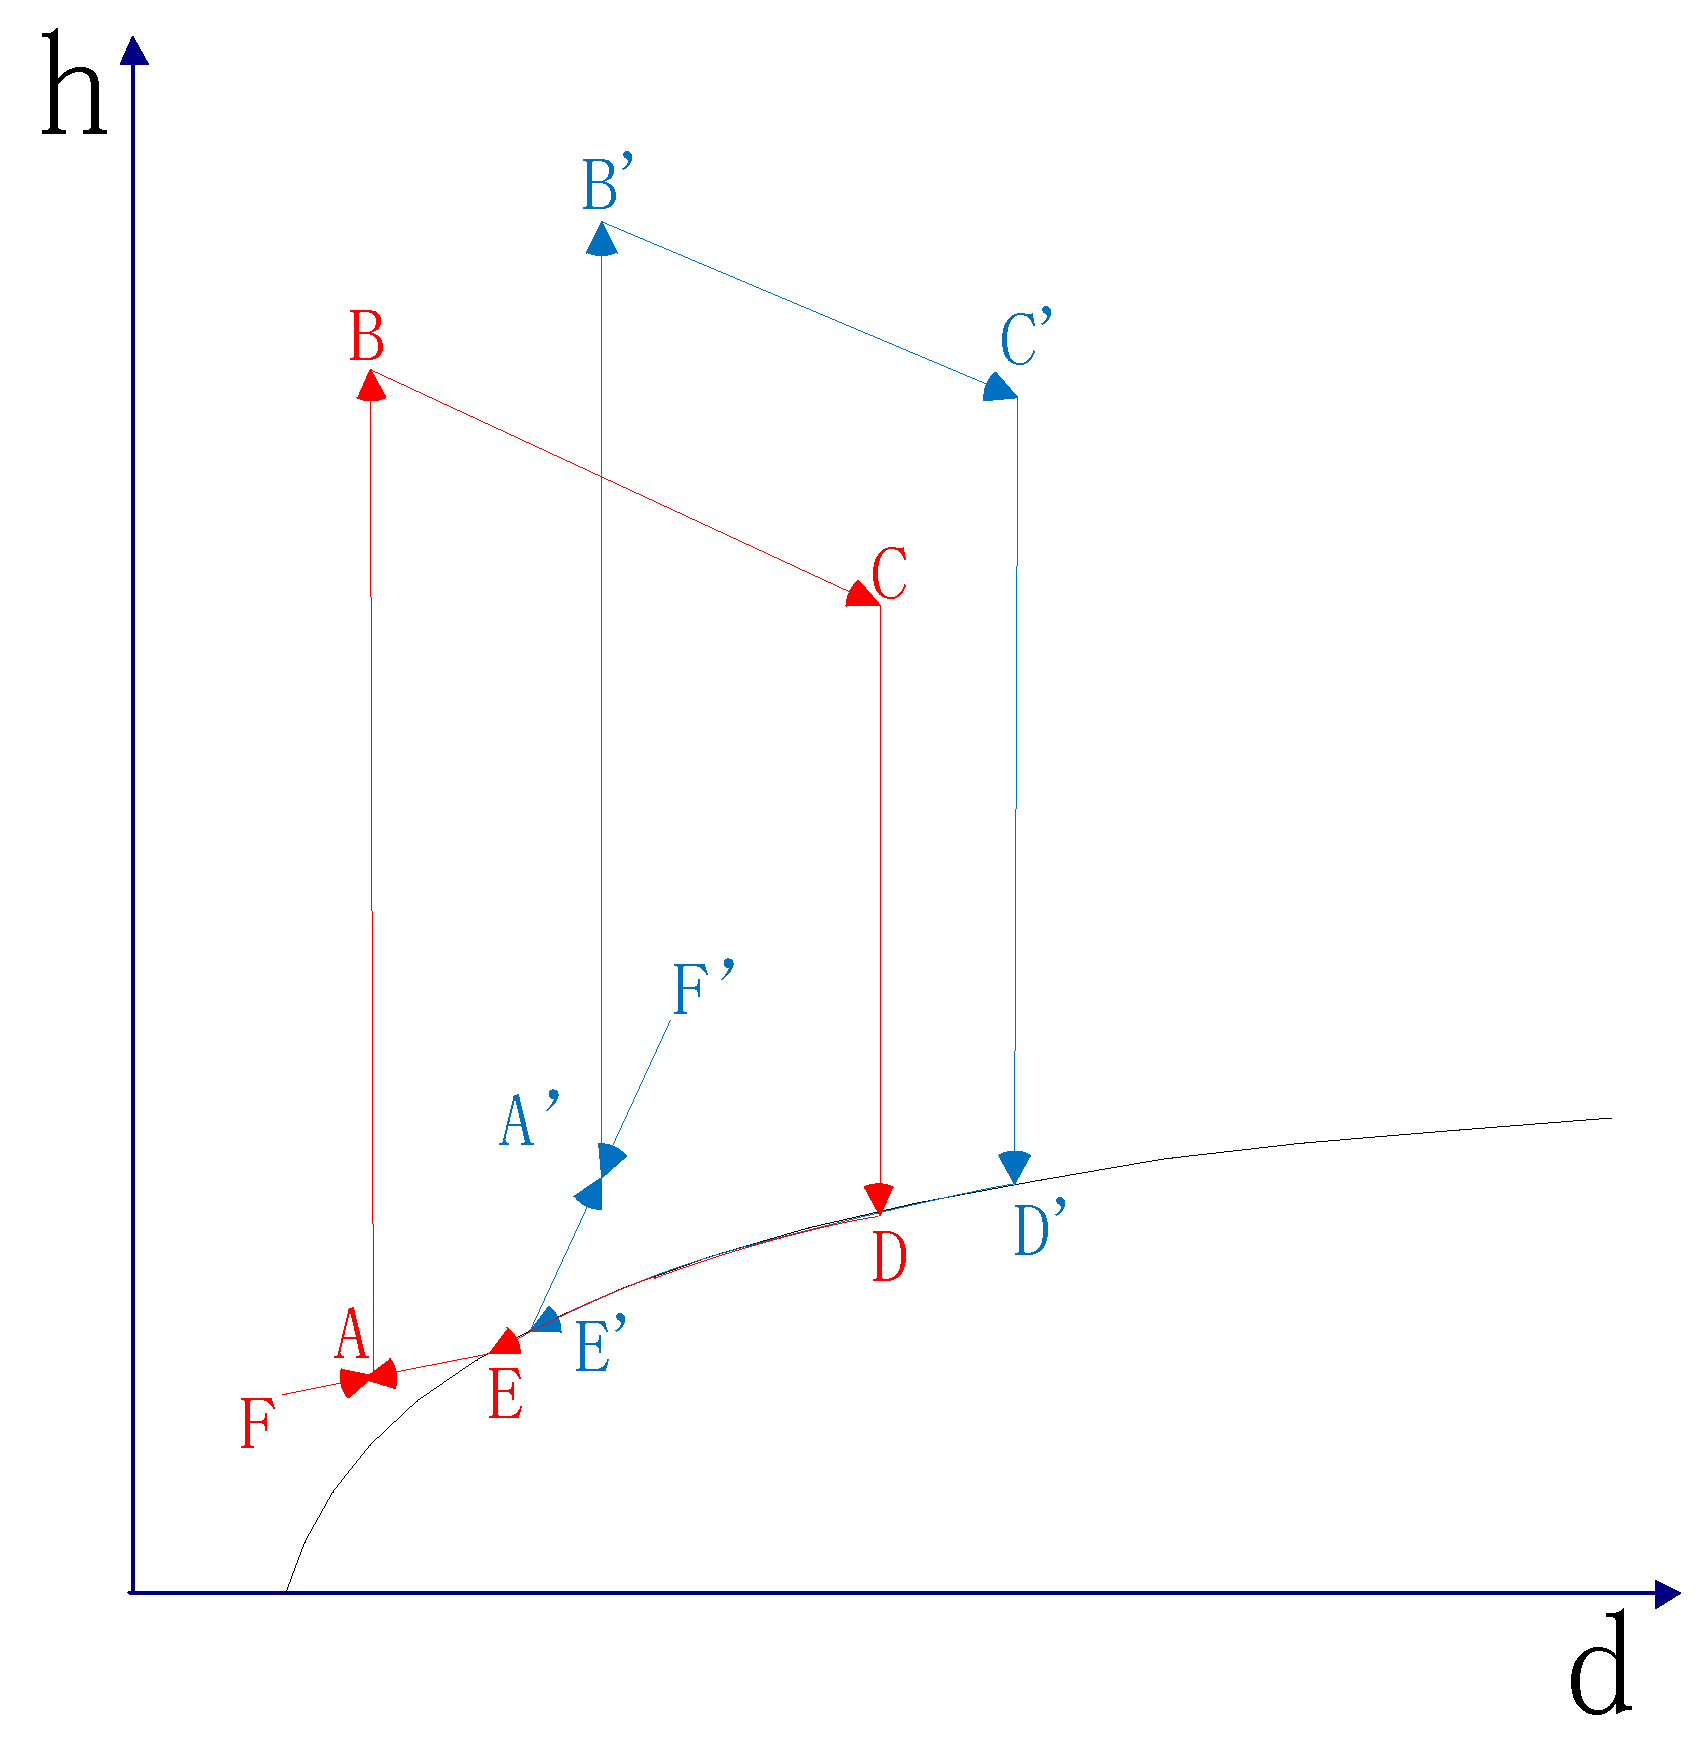
The enthalpy–humidity diagram of circulated air is used to analyze and discuss the semi-open type HPD. As shown in Figure 11, point F(F’) indicates parameters of outside ambient air, circulated air, and outside ambient air mixed at point A (A’). The heat was absorbed from the condenser through A–B (A’–B’), and circulated air flowed through B-C (B’-C’) in the drying chamber, as shown in Formula (7). Δ h B C is the enthalpy loss of circulated air when the hot air passes through the drying chamber. The air flowed through C-D-E (C’-D’-E’) in the evaporator and then divided two paths. One path mixed with the outside ambient air at point F (F’), and the other path discharged to the outside environment. Point A’s state parameters can be calculated as follows.
d A = x 1 + x d F + 1 1 + x d E
h A = x 1 + x h F + 1 1 + x h E
x = Air   Quantity   Fresh   air   entering Air   Quantity   Still   circulated   air
As we know from experimental data, when the hot air circulation mode of the HPD is open type, the performance of the HPD is greatly affected by ambient conditions. As shown in Figure 11, E, F-A-B-C-D-E is the cycle of circulated air when the ambient enthalpy and ambient humidity are lower than circulated air’s enthalpy and humidity at the outlet of the evaporator respectively, and E’, F’-A’-B’-C’-D’-E’ is the cycle of circulated air when the ambient enthalpy and ambient humidity are higher than circulated air’s enthalpy and humidity at the outlet of the evaporator, respectively. According to the first law of thermodynamics, for the semi-open type HPD, the formula is as follows.
W comp + W eh = m air [ Δ h air , dr + x ( h air , HPD , out h air , HPD , in ) ]
Point A shows the inlet air state parameters of the condenser when the HPD works in a high ambient temperature and high ambient humidity, and point A’ shows the inlet air state parameters of the condenser when the HPD works in a low ambient temperature and low ambient humidity. TA is greater than TA’, so if the lower temperature air is heated to the same temperature, the HPD needs to consume more power for the compressor and electric heater, and this would affect the HPD’s SMER. According to the experimental results, Δ d B C > Δ d B C , so a high ambient temperature and high ambient humidity reduce the open type HPD’s MER and the material’s DR.

4.5. Discussion on Energy Consumption and Economic Considerations
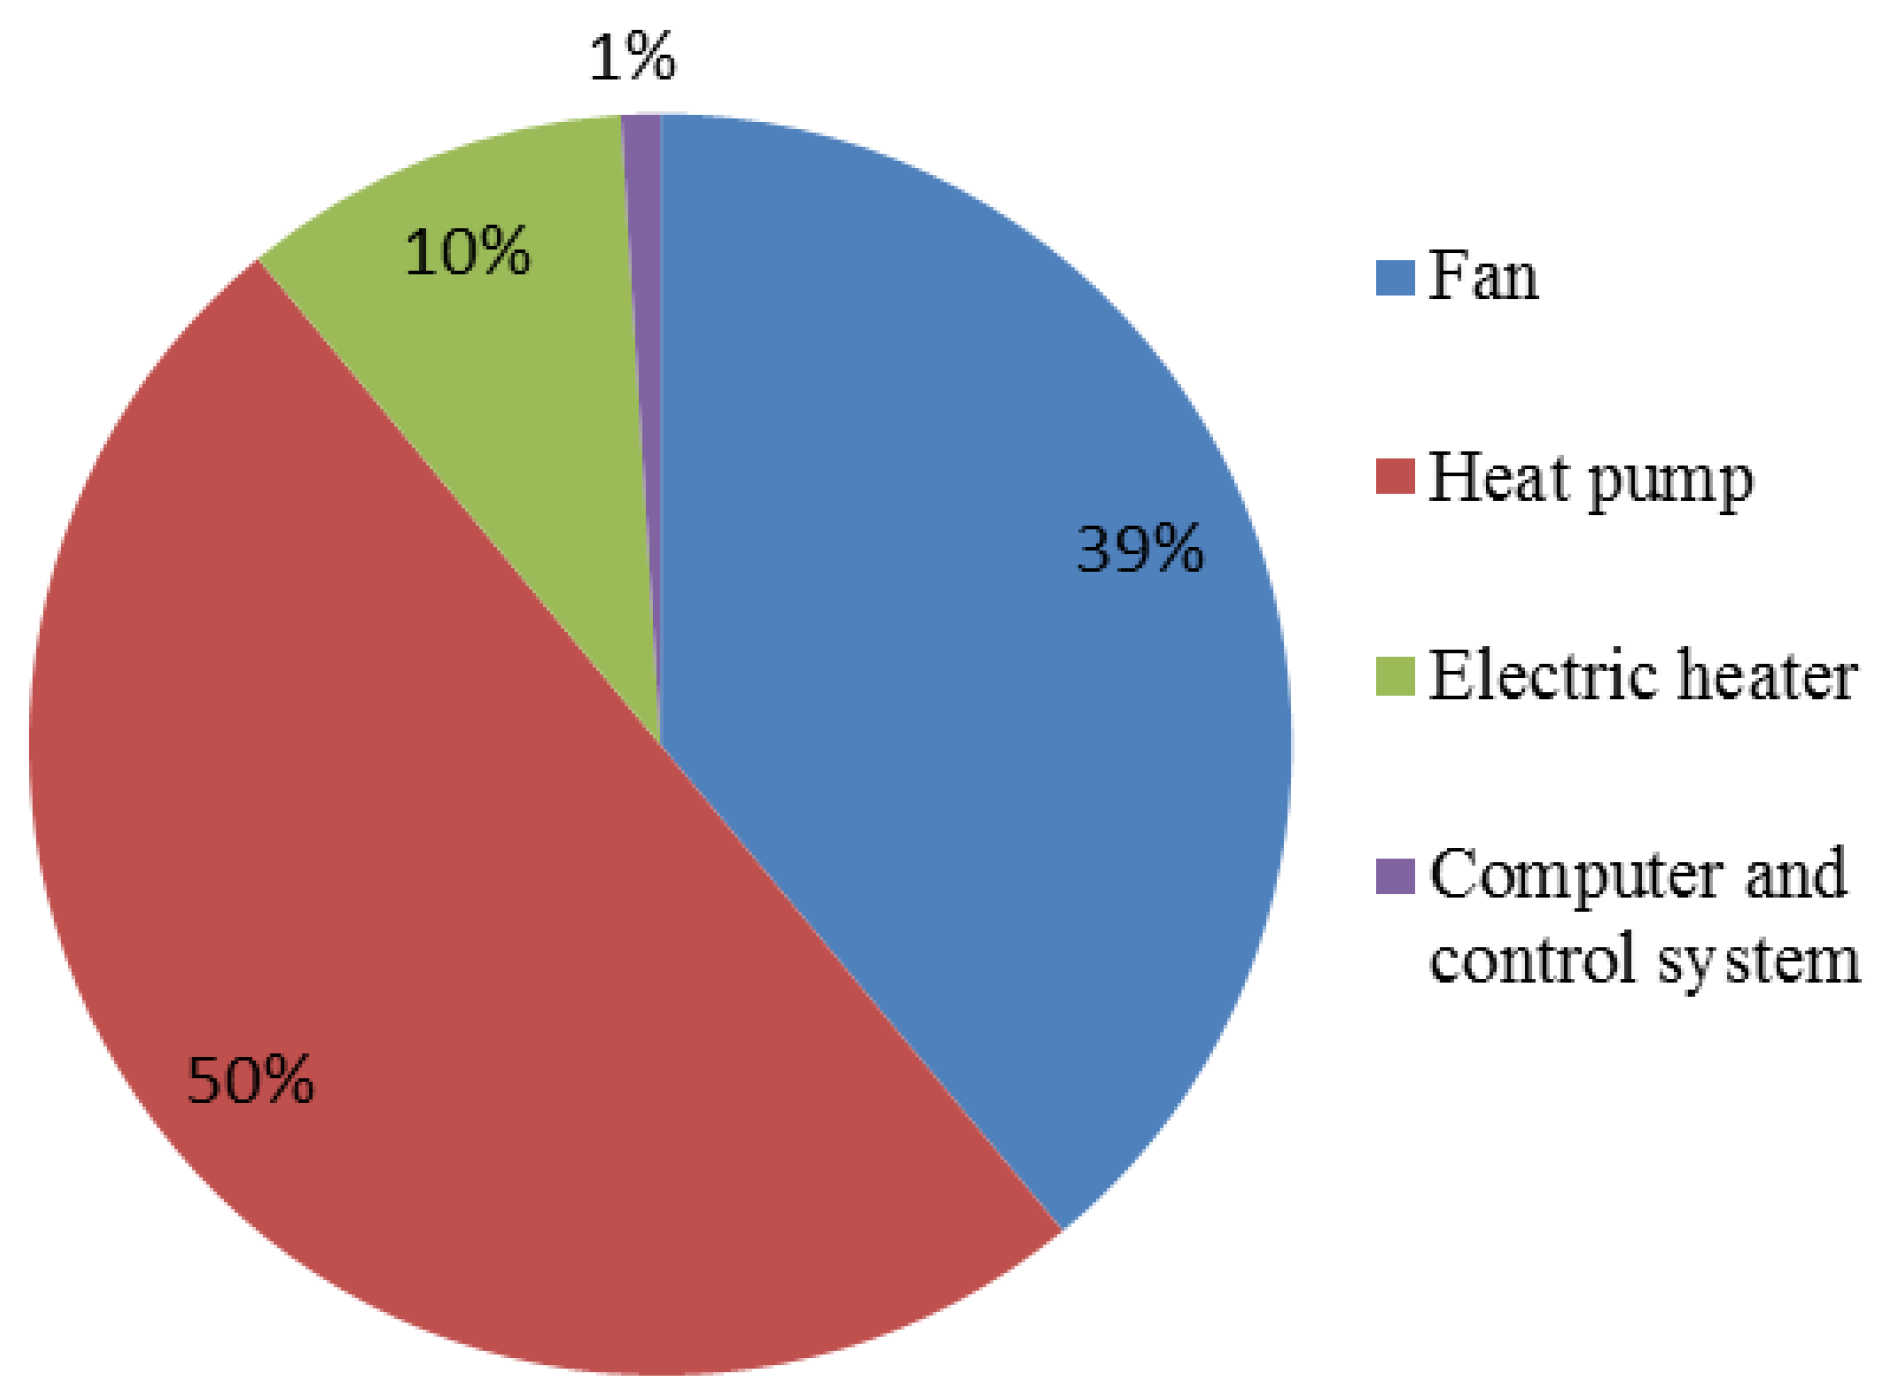
As shown in Figure 12, the analysis of the HPD’s electricity consumption through the heat pump, fan, electric heater, and control system accounted for 50, 39, 10, and 1% of total consumption, respectively. The fan consumes much power. This is mainly because the HPD uses a lot of duct valves and a complex duct layout to achieve the experimental requirements, and this affects SMER as shown in Formula (2). Thus, this machine needs more fluid mechanics analysis and optimization.
Global garlic production is approximately 25 million tons annually, and China’s garlic production is about 10 million tons. In order to improve product quality, dehydrated garlic slices have a larger market. At present, drying dehydrated garlic slices in China generally using hot air circulation drying. The energy consumption per unit product of the hot air circulation dryer is 2.8 (kw·h)/kg. In practical production, after reducing the energy consumption of the fan, energy consumption per unit product of HPD can be reduced to 1 (kw∙h)/kg. This is because traditional hot air circulation drying mainly uses electric heaters as heat sources. A large amount of heat energy in the air flowing out of the drying chamber is wasted. This heat can be recovered using the evaporator in the HPD.
The traditional hot air circulation drying model is as follows.
W eh = m air ( h air , dr , in h air , HPD , in )
The formula for open type HPD model is Formula (24), that for the semi-open type HPD is Formula (28), and that for the closed type is Formula (14).

5. Conclusions

In this paper, a multifunctional air source heat pump dryer was designed, and an experimental investigation on drying performance for this dryer with diffident styles of hot air cycle was conducted by drying 3 mm garlic chips in three typical conditions of ambient temperature and humidity. The enthalpy–humidity diagram of circulated air was used to analyze the drying rate and energy consumption of the HPD’s different hot air circulation modes in different ambient temperature and humidity conditions. The following conclusions could be reached.
  • The open type HPD is more affected by the environmental temperature and humidity conditions. In summer, the high temperature and humidity of the ambient air makes the MER smaller and makes SMER larger. However, in winter, the low temperature and low humidity of the ambient air makes MER larger and makes SMER smaller.
  • The semi-open type HPD is affected by the combined effect of ambient temperature and humidity conditions and the proportion of fresh air in the environment. Under different conditions of ambient temperature and humidity, changing the ratio of the indraft fresh air by adjusting the duct valves can significantly improve the performance of the system.
  • The closed type HPD is less affected by ambient temperature and humidity conditions and is greatly affected by the bypass air rate. When the BAR is 0.4, the HPD’s SMER is maximal. As the BAR increases, MER decreases.
  • Through a thermodynamic analysis of the HPD, it is very easy to find that low humidity inlet air in the condenser can improve drying rate. A high enthalpy of the condenser inlet air can reduce energy consumption, and low humidity and high enthalpy of the condenser inlet air can be obtained by adjusting the HPD hot air circulation method in different ambient temperature and humidity conditions.

Author Contributions

H.L. and K.C. conceived and designed the experiments; J.L. performed the experiments; H.L. and K.Y. analyzed the data; R.F. contributed analysis tools; H.L. and S.A.S. wrote the paper.

Funding

The authors gratefully acknowledge the financial support from the Jiangsu Agricultural Science and Technology Innovation Fund [CX (17)1003].

Conflicts of Interest

The authors declare no conflict of interest.

References

  1. Minea, V. Drying Heat Pumps—Part I: System Integration. Int. J. Refrig. 2013, 36, 643–658. [Google Scholar] [CrossRef]
  2. Minea, V. Drying Heat Pumps—Part II: Agro-food, Biological and Wood Products. Int. J. Refrig. 2013, 36, 659–673. [Google Scholar] [CrossRef]
  3. Song, M.J.; Deng, S.M.; Mao, N.; Ye, X.M. An Experimental Study on Defrosting Performance for an Air Source Heat Pump Unit with a Horizontally Installed Multi-Circuit Outdoor Coil. Appl. Energy 2016, 165, 371–382. [Google Scholar] [CrossRef]
  4. Song, M.J.; Liu, S.C.; Deng, S.M.; Sun, Z.L.; Yan, H.X. Experimental Investigation on Reverse Cycle Defrosting Performance Improvement for an ASHP Unit by Evenly Adjusting the Refrigerant Distribution in Its Outdoor Coil. Appl. Therm. Eng. 2016, 114, 611–620. [Google Scholar] [CrossRef]
  5. Chen, D. Heat Pump Technical Manual; Chemical Industry Press: Beijing, China, 2012. (In Chinese) [Google Scholar]
  6. Yang, Z.; Zhu, Z.-S.; Zhao, F. Simultaneous Control of Drying Temperature and Superheat for A Closed-Loop Heat Pump Dryer. Appl. Therm. Eng. 2016, 93, 571–579. [Google Scholar] [CrossRef]
  7. Phoungchandang, S.; Nongsang, S.; Sanchai, P. The Development of Ginger Drying Using Tray Drying, Heat Pump-Dehumidified Drying, and Mixed-mode Solar Drying. Dry. Technol. 2009, 27, 1123–1131. [Google Scholar] [CrossRef]
  8. Lutfy, O.F.; Selamat, H.; Noor, S.B.M. Intelligent Modeling and Control of a Conveyor-Belt Grain Dryer Using A Simplified Type-2 Neuro-Fuzzy Controller. Dry. Technol. 2015, 33, 1210–1222. [Google Scholar] [CrossRef] [Green Version]
  9. Pal, U.S.; Khan, M.K. Calculation Steps for the Design of Different Components of Heat Pump Dryers under Constant Drying Rate Condition. Dry. Technol. 2008, 26, 864–872. [Google Scholar] [CrossRef]
  10. Shen, J.B.; Guo, T.; Tian, Y.F.; Xing, Z.W. Design and Experimental Study of an Air Source Heat Pump for Drying with Dual Modes of Single Stage and Cascade Cycle. Appl. Therm. Eng. 2018, 129, 280–289. [Google Scholar] [CrossRef]
  11. Lee, K.H.; Kim, O.J.; Kim, J. Performance Simulation of a Two-Cycle Heat Pump Dryer for High-Temperature Drying. Dry. Technol. 2010, 28, 683–689. [Google Scholar] [CrossRef]
  12. Chapchaimoh, K.; Poomsa-ad, N.; Wiset, L.; Morris, J. Thermal Characteristics of Heat Pump Dryer for Ginger Drying. Appl. Therm. Eng. 2016, 95, 491–498. [Google Scholar] [CrossRef]
  13. Liu, S.C.; Li, X.G.; Song, M.J.; Li, H.L.; Sun, Z.L. Experimental Investigation on Drying Performance of an Existed Enclosed Fixed Frequency Air Source Heat Pump Drying System. Appl. Therm. Eng. 2018, 130, 735–744. [Google Scholar] [CrossRef]
  14. Taseri, L.; Aktas, M.; Sevik, S.; Gulcu, M.; Seckin, G.U.; Aktekeli, B. Determination of Drying Kinetics and Quality Parameters of Grape Pomace Dried with a Heat Pump Dryer. Food Chem. 2018, 260, 152–159. [Google Scholar] [CrossRef] [PubMed]
  15. Ganjehsarabi, H.; Dincer, I.; Gungor, A. Exergoeconomic Analysis of a Heat Pump Tumbler Dryer. Dry. Technol. 2014, 32, 352–360. [Google Scholar] [CrossRef]
  16. Mortezapour, H.; Ghobadian, B.; Minaei, S.; Khoshtaghaza, M.H. Saffron Drying with a Heat Pump–Assisted Hybrid Photovoltaic–Thermal Solar Dryer. Dry. Technol. 2012, 30, 560–566. [Google Scholar] [CrossRef]
  17. Wei, X.Q.; Li, N.P.; Peng, J.Q.; Cheng, J.L.; Su, L.; Hu, J.H. Analysis of the Effect of the CaCl2 Mass Fraction on the Efficiency of a Heat Pump Integrated Heat-Source Tower Using an Artificial Neural Network Model. Sustainability 2016, 8, 410. [Google Scholar] [CrossRef]
  18. Jiang, M.; Wu, J.; Wang, R.; Xu, Y. Research on the control laws of the electronic expansion valve for an air source heat pump water heater. Build. Environ. 2011, 46, 1954–1961. [Google Scholar] [CrossRef]
  19. Ju, H.Y.; Zhao, S.H.; Mujumdar, A.S.; Fang, X.F.; Gao, Z.J.; Zheng, Z.A.; Xiao, H.W. Energy efficient improvements in hot air drying by controlling relative humidity based on Weibull and Bi-Di models. Food Bioprod. Process. 2018, 111, 20–29. [Google Scholar] [CrossRef]
  20. Yan, D. Characteristics of Garlic Dried by Heat Pump. Master’s Thesis, South China Agricultural University, Guangzhou, China, 2016. (In Chinese). [Google Scholar]
  21. Ju, H.Y.; El-Mashad, H.M.; Fang, X.M.; Pan, Z.L.; Xiao, H.W.; Liu, Y.H.; Gao, Z.J. Drying Characteristics and Modeling of Yam Slices under Different Relative Humidity Conditions. Dry. Technol. 2016, 34, 296–306. [Google Scholar] [CrossRef]
Figure 1. Heat pump dryer structure diagram.
Sustainability 10 03216 g001
Figure 2. Heat pump drying device data acquisition and control process diagram.
Sustainability 10 03216 g002
Figure 3. PID (proportion-integral-derivative) control process diagram.
Sustainability 10 03216 g003
Figure 4. Multi-functional heat pump drying test device.
Sustainability 10 03216 g004
Figure 5. Air valve.
Sustainability 10 03216 g005
Figure 6. Drying chamber.
Sustainability 10 03216 g006
Figure 7. Flow chart of experimental operating procedures.
Sustainability 10 03216 g007
Figure 8. Enthalpy–humidity diagram of a closed type HPD.
Sustainability 10 03216 g008
Figure 9. Experimental drying kinetic curves of garlic slices.
Sustainability 10 03216 g009
Figure 10. Enthalpy–humidity diagram of the open type HPD.
Sustainability 10 03216 g010
Figure 11. Enthalpy–humidity diagram of the semi-open type HPD.
Sustainability 10 03216 g011
Figure 12. HPD’s electricity consumption percentage.
Sustainability 10 03216 g012
Table 1. Electric power.
EquipmentPowerNumber
Main fan0.8 kw1
Auxiliary fan0.3 kw1
Compressors0.6 kw3
Electric heater1 kw1
Table 2. Data acquisition and control system of the main hardware configuration.
EquipmentManufacturerTypeNumber
Programmable Logic Controller (PLC)SiemensS7-200 (CPU224XP)1
PLC Extension ModuleSiemensEM231 (Thermal resistance type)1
PLC Extension ModuleSiemensEM231 (AI4)2
PLC Extension ModuleSiemensEM232 (AO4)1
PLC Extension ModuleSiemensEM235 (AI4, AO1)1
InverterSiemensMM4404
Industrial ComputerYanhuaIpc610l1
Temperature and Humidity SensorBeijing JiuchunjianJCJ200W5
Temperature SensorShenzhen RBDPT1004
Air flow SensorE+EEE651
Solid State RelayOmronG3N1
Mass SensorTecsisEX301B1
Signal AmplifierInterfaceSGA/A1
Table 3. Heat pump operating state parameters.
TypeHeat Pump 1Heat Pump 2Heat Pump 3
Evaporating temperature0 °C0 °C0 °C
Evaporating pressure500 kPa498 kPa293 kPa
Condensing temperature55 °C55 °C55 °C
Condensing pressure2200 kPa2181 kPa1491 kPa
Table 4. The style of the hot air cycle.
NumberThe Style of the Hot Air CycleRegulation
Case 1Open typeOpen air valves 1, 3, 5, 7, 9, and 12
Case 2Semi-open type 1Open air valves 1, 3 (60%), 5, 7, 9 (60%), and 12
Case 3Semi-open type 2Open air valves 1,3 (20%), 5, 7, 9 (20%), and 12
Case 4Closed type BAR = 0Open air valves 2, 5, 7, and 12
Case 5Closed type BAR = 0.2Open air valves 1 (20%), 2, 5, 7, 8 (20%), and 12
Case 6Closed type BAR = 0.4Open air valves 1 (40%), 2, 5, 7, 8 (40%), and 12
Case 7Closed type BAR = 0.6Open air valves 1 (60%), 2, 5, 7, 8 (60%), and 12
Case 8Closed type BAR = 0.8Open air valves 1 (80%), 2, 5, 7, 8 (80%), and 12
Case 9Closed type BAR = 1Open air valves 1, 2, 5, 7, 8, and 12
Note: In the experiment, air valves not mentioned in the table were closed.
Table 5. Experimental results.
NumberAmbient Condition 1 (T = 2.4 °C, RH = 76%)Ambient Condition 2 (T = 15.4 °C, RH = 76%)Ambient Condition 3 (T = 27.8 °C, RH = 81%)
MERSMERMERSMERMERSMER
Case 12.215 ± 0.003 d1.028 ± 0.002 f2.093 ± 0.001 f1.031 ± 0.003 e1.927 ± 0.001 h1.037 ± 0.003 e
Case 22.200 ± 0.001 d1.120 ± 0.002 b2.065 ± 0.003 c1.118 ± 0.003 bc2.067 ± 0.003 f1.122 ± 0.002 bc
Case 32.087 ± 0.002 b1.109 ± 0.002 c2.113 ± 0.003 d1.108 ± 0.002 cd2.113 ± 0.002 d1.115 ± 0.002 c
Case 42.152 ± 0.001 c1.093 ± 0.002 e2.190 ± 0.001 a1.101 ± 0.001 d2.189 ± 0.002 a1.095 ± 0.004 d
Case 52.139 ± 0.001 c1.102 ± 0.001 d2.146 ± 0.001 b1.103 ± 0.003 d2.144 ± 0.002 b1.109 ± 0.001 c
Case 62.121 ± 0.002 c1.130 ± 0.002 a2.128 ± 0.002 e1.134 ± 0.004 a2.128 ± 0.002 c1.136 ± 0.001 a
Case 72.083 ± 0.001 ab1.121 ± 0.002 b2.082 ± 0.003 g1.122 ± 0.002 b2.083 ± 0.003 e1.125 ± 0.002 b
Case 82.067 ±0.003 ab1.109 ± 0.002 c2.072 ± 0.001 h1.113 ± 0.003 c2.073 ± 0.003 f1.113 ± 0.004 c
Case 92.058 ± 0.002 a1.107 ± 0.002 cd2.050 ± 0.002 i1.107 ± 0.002 cd2.053 ± 0.002 g1.111 ± 0.004 c
Note: Mean ± standard error. Different shoulder letters in the same column indicate a significant p < 0.05 difference, as below. Where T is temperature, RH is relative humidity, MER is moisture extraction rate, SMER is specific moisture extraction rate.

