1. Introduction
Local governments (LGs) play a crucial role in the sustainable development of their communities and, more generally, of their countries as a whole [
1]. To be successful, they need regular access to financing. In particular, a major issue they face as they grow their infrastructure is the sustainability of their debt financing.
LG debt has grown during the past several years from about 17 percent of total public debt in 2013 to almost 21 percent in 2017 [
2,
3]. Some of this growth has been in countries, such as Japan and Italy, where total public debt now exceeds GDP [
4]. This debt burden, if not well managed, can affect the sustainability of an LG when it needs to expand its infrastructure to meet growing citizen demands. In effect, sustainable growth in infrastructure requires having not only a reasonable debt burden [
5], but also an ability to meet ongoing debt-service obligations.
The two major forms of an LG’s debt are bank loans and bonds. From an LG’s perspective, bonds are a more attractive option for infrastructure projects that require a significant amount of capital. In particular, bonds can have a repayment schedule that is in line with the cash inflows from the investments (e.g., revenues from expanded water and sewer facilities). They also allow an LG to reach a larger pool of investors than is possible with bank financing. Moreover, in many instances they can reduce the financing costs for large investments [
6]. Finally, issuing bonds does not directly affect the line of credit that an LG has with a commercial bank, thereby leaving room for the short-term financing needs associated with the LG’s current operations.
For bonds to be a feasible means of financing, and hence to provide enhanced sustainability for an LG, there needs to be a combination of financially sustainable and credible issuers on one side, and interested and informed investors on the other. However, in some LGs, such a combination is often missing, mainly due to the lack of information for both issuers and investors. As a result, the lack of intelligible financial data and transparent security exchanges for LG bonds can serve to limit an LG’s financing options. Moreover, even if financing is obtained, the lack of a robust arrangement between issuers and investors can result in a higher cost of debt [
7,
8,
9,
10].
This paper examines the factors that determine the cost of debt for LGs in non-mature bond markets. A better understanding of these factors can serve to improve an LG’s access to financing as well as reduce its cost of debt [
11]. One potential result of this improved knowledge is that local and national policymakers will have the information necessary to assure an efficient market for an LG’s bonds. This increased efficiency would likely reduce the LG’s debt-service obligation, thereby enhancing its ability to sustain its ongoing operations.
The Italian LG bond market provides an example of a non-mature market, with few rated bonds (8 out of 1305 in our sample), very limited trading volumes, and practical difficulties in obtaining and interpreting financial information. Beginning in 1995, Italian LGs were allowed to issue bonds according to specific rules. The resulting cash inflows were to be used for capital investments, mainly for infrastructure projects. In contrast with state bonds, the debt-service payments for an LG’s bonds were to be in mortgage-like installments, i.e., payments that included both principal and interest.
In 1996 there were only six bond issues, totaling EUR 227 million. In the following years, several LGs issued bonds totaling EUR 5 to EUR 7 billion per year. Currently, about EUR 8.5 billion of Italian LGs’ total outstanding debt of EUR 49.5 billion is represented by LG bonds [
12,
13].
Because of these changes, long-term debt of Italian LGs increased consistently between 2000, when it was EUR 16.9 billion, and 2011, when it reached almost EUR 60 billion. Beginning in 2012 it decreased constantly, reaching EUR 46.7 billion in 2017. Now, due to an expanding economy, analysts expect a reversal of this declining trend and thus an increase in LGs’ bond-related debt [
14]. However, if Italian LGs are to obtain increased bond financing, and hence ensure their sustainability as viable public sector entities, they will need to ensure greater transparency in terms of the information needed to promote the development of an efficient market.
This paper aims to contribute to the sustainable development literature in two ways. First, we discuss how non-mature LG bond markets can be improved, identifying the risk premium drivers inherent in an underdeveloped market environment, such as the Italian market for LG bonds. Second, we provide local and national policymakers with the necessary information to implement policies aiming to reduce the cost of an LG’s debt, both directly (targeting the determinants) and indirectly (promoting the development of the market).
In
Section 2, we review what the literature considers to be the relevant factors (internal financial factors and specific local socio-economic factors). We describe the specific context of Italian LGs that may have an influence on the cost of debt, and can help to determine underlying reasons for bond spreads among these LGs. In
Section 3 we describe our methodology.
Section 4 discusses our findings.
Section 5 provides some conclusions.
2. Factors Determining LGs’ Cost of Debt
2.1. Internal Financial Factors Determining LGs’ Cost of Debt
Financial indicators and fiscal variables are often used as determinants of LGs’ cost of debt. Below is a list of variables deemed to be relevant by the most relevant academic literature.
(F1) Current revenues, current expenditures and operating balance. The current revenues and current expenditures of the issuing LG are the two most important financial factors one has to consider when evaluating the issuer’s liquidity risk. The difference between current revenues and current expenditures (i.e., current balance) can indicate if the LG is generating or absorbing financial resources from its operating activities, and if this flow of resources can be used to pay for principal and interest. Therefore, the higher the current surplus, the better the issuer can cope with debt repayments. Martell [
15] states that lower borrowing rates are related to higher revenues and lower expenditures. Bastida et al. [
16] also state that a surplus on current accounts reduces sovereign credit spreads; therefore, the ratio of current savings to current revenues (current savings as current revenues minus non-financial current expenditures) is controlled in their model. Specifically, the measurement of these two variables is different across the literature, by using either: the rate of revenue growth and expenditures per capita to measure the two variables of revenues and expenditures separately [
16,
17]; or the current balance to include revenues and expenditures in one variable [
18,
19,
20,
21,
22].
(F2) Own-source revenues and intergovernmental revenues. According to Martell [
15], own-source revenues, mainly referring to taxes, have an impact on cost of debt. LGs with higher tax receipts are perceived by the market as having a lower default probability, as a financially autonomous LG is held responsible for its own resources. According to Chapman [
23], LGs face more risk when they rely on intergovernmental revenues because they are more uncertain about their revenue inflows, since decisions about these amounts are made by other entities. The variable of tax revenue over total revenues is included in the models by Martell [
15] and Bastida et al. [
16].
(F3) Level of diversification of revenues. Literature on the measurement of the fiscal or financial condition of LGs also detects several other financial measures that may be associated with the cost of debt. For example, the level of diversification of revenues matters. Relying on a high proportion of elastic revenues (i.e., those revenues that are responsive to specific socio-economic factors) versus inelastic revenues (i.e., those that are independent of socio-economic factors) may increase the level of financial risk [
24].
(F4) Capacity to sell capital assets. An interesting way to consider financial resources is that proposed by Berne and Schramm [
25]. In their perspective, resources are seen as assets that may be related either to the long-term or short-term horizon. The long-term horizon refers mainly to the capacity to secure new revenues or raise fees and taxes. This can be done by either, as discussed above, increasing current revenues or selling available capital assets.
(F5) Overall balance between revenues and expenditures. Jacob and Hendrick [
26] also cite the fund balance as the difference between all revenues and all expenditures. A positive fund balance means a residual slack available to fund future expenditures, while a negative situation makes clear that there is a more financially risky situation.
(F6) Expenditure fixity. Furthermore, Jacob and Hendrick [
26] also mention expenditure “fixity” (i.e., debt installments, personnel expenses, and long-term contract-related expenditures). High fixity means that the level of fixed liabilities cannot be altered in the near term, reducing the ability of an LG to react to fiscal shocks. In short, high expenditure fixity results in a higher financial risk.
(F7) Cash balance, conversion of short-term assets into cash, capacity to incur short-term liabilities. Other than the long-term perspective on financial resources, Berne and Schramm [
25] also refer to the short-term horizon; the sources of cash revenues which are positively linked with the financial condition are cash balances, the level of conversion of short-term assets into cash, and the capacity to incur in short-term liabilities to gain cash.
(F8) Level of short-term liabilities, short-term debt outstanding. Hendrick [
27] suggests several financial condition measures based on different groups of measures (revenues, assets and other resources; expenditures and liabilities; net financial condition–balance and solvency) divided into dimensions that reflect the attribute or properties (future/current, less controllable/more controllable, external/internal, stable/volatile). Among those not mentioned above, Hendrick identifies cash solvency (i.e., the capability to pay for short-term liabilities) and liquidity. This latter point of view has been predominant not only in the American context [
28] but also for some European authors who have focused their research on municipal solvency assessment [
29,
30].
(F9) Debt burden. Finally, a relevant internal factor is the existing stock of debt load or the debt service which accounts for annual expenses in interest and capital repayment [
18]. The higher the debt burden, the higher default risk the issuer will face. The existing debt can be measured by overall debt/GDP, overall debt/total revenues, overall debt/current revenues and in per capita terms [
20,
21,
22,
31,
32]. The variable of debt service is used in Capeci [
18], and is affected by the debt structure and interest rates of existing loans.
While the factors above refer to the financial and more controllable elements, other important elements of financial condition related to external, less controllable and more stable elements have been identified. They are referred to as specific local-economic factors and are discussed in the next sub-section.
2.2. Specific Local Socio-Economic Factors Determining LGs’ Cost of Debt
If the above factors are regarded as internal financial variables, then the below factors can be regarded as local socio-economic variables. They, in turn, have proved to have an impact on cost of debt.
(S1) Revenue bases and expenditure needs. As discussed in the previous section, these are an important indicator of fiscal or financial condition. Some authors in this field have focused on the long-term perspective, where the point of view has focused on the trends in an LG’s tax base relative to its expenditures and commitments [
33]. The imbalance between revenue capacity and expenditure needs cannot be assessed from the financial reports, but some authors consider it as the main cause of fiscal distress [
34,
35] and thus suggest that it needs to be measured
Local income, usually specified as local GDP per capita or income per capita, is an important indicator of the economic base over which local taxes are levied, because the richer a territory the higher the taxes that can be collected [
32,
36]. Similarly, unemployment is commonly used in assessing the economic strength of the issuing LG, and a high unemployment rate tends to lead to higher interest rates. The underlying logic is that an LG’s potential revenue basis is represented by the income levels of its community, but if there is a high unemployment rate there will be the need to assist the local community with more local public services. This latter variable is used in Johnson and Kriz [
37] and Booth et al. [
20] as a determinant of debt cost.
(S2) Financial report quality. Another factor that affects LGs’ cost of debt is the financial report quality. Disclosure theory argues that there is an information asymmetry problem between issuers and investors, and methods that alleviate information asymmetry can improve transparency, thus reducing the cost of debt [
38,
39]. Literature in the field of public accounting points out that the competition among different types of accounting systems is an important deterrent to transparency in LGs and leads to a reduction in the quality of financial information [
40,
41]. In several countries accrual accounting, the basis of financial information for investors, is still far from providing the true and fair view of an LG [
42]. What has emerged is a vicious cycle where, because accrual accounting information is poor, it is not used for financial health evaluations, and, therefore, LGs do not place any priority on improving it [
43]. While this is a phenomenon bounded at the national level, some local differences within the same country may exist [
43,
44].
(S3) Credit ratings. Credit rating (i.e., a third-party certification) is a useful tool to reduce information asymmetry and thus the cost of debt [
45,
46,
47]. Information on the LG’s financial, debt, economic and even administrative conditions is analyzed by the rating agencies providing a holistic index [
37,
48]. In particular, rating agencies focus their efforts in an attempt to assess the qualitative side of the local economy, local management and political context as these aspects have a great influence on an LG’s financial conditions [
49,
50,
51,
52]. This requires significant investigation efforts by analysts [
53]; it is thus expensive, and therefore not all LGs are provided with these analyses.
(S4) Announcements of deficit spending. Some authors have found evidence linking deficits to interest rates [
54,
55]. In particular, Wachtel and Young [
56] find that an announcement of higher future deficits leads to a current increase in interest rates in anticipation of future financing. While this study is relative to the central government level, it can be easily transposed to LGs.
(S5) Intensity of relationship between advisors and underwriters. Moldogaziev and Luby [
57] explore the intensity of the relationship between municipal advisors and underwriters, as well as their quality and location, to assess the resulting impact on borrowing costs for negotiated debt. This research corroborates what has also been demonstrated by others [
58]: there is a detrimental impact of debt management network stability on a variety of financial outcomes, including the cost of debt.
(S6) State supervision. State supervision attitude also matters. Marks and Raman’s [
59] empirical evidence indicates that state supervision is systematically associated with lower borrowing costs. By studying the U.S. market, Marks and Raman assert that local budgetary financial distress is allowed to escalate into a national crisis through the bond markets; it can attract national attention and increase debt finance cost not only for the city in question but all local governments within that state. Hence, states have the incentive to incur monitoring costs to supervise the local budgetary process and to avoid the misuse of borrowing powers of LGs.
(S7) Demography. Geographic region, together with the size of the issuer, can also affect interest cost. Smaller issuers typically place their issues with local investors, while larger issues of major LGs tend to find their way to the national market. Smaller issuers may pay higher costs if they are located in regions with unfavorable economic and demographic characteristics [
31,
60]. However, Allen et al. [
61] doubt this view, as they expect local investors to be more knowledgeable about local issuers, in which case the interest cost can therefore be lower.
(S8) Organized crime. Finally, Benton [
62] found that violent and organized crime reduces foreign direct investment and that armed conflict lowers sovereign credit ratings. Building on these insights, the author argues that violent crime reduces financial institutions’ confidence in the capacity of governments to repay loans and raises the costs attached to loans. Also, the crime rate might be used as an indicator of overall spending needs [
63]: more crime means more spending needs and thus a higher probability to worsen an LG’s financial conditions.
(S9) Lender’s characteristics. The above socio-economic factors are all from the perspective of the issuer, but there also are factors relating to the perspective of lender or investor. For example, investors’ risk aversion is a factor that is external to the issuer but common to the market or the economy and is likely to affect the yield of a local bond issue. Schulz and Wolff [
64] finds that yield spreads between central and state government bonds are mainly driven by international risk aversion. Bernoth et al. [
65] uses yield spread between low grade US corporate bonds (BBB-rated) and benchmark US government bonds as an empirical proxy for international risk aversion.
2.3. Italian LGs
Italy is a country based on a civil law legal system and belongs to the Napoleonic or Southern European tradition [
66,
67], which is characterized by an organic conception of the state, a career civil service, a predominance of law over management and the pre-eminence of law and a system of courts in enforcing public accountability. It has three main levels of government: state, regional, and municipal. There also is a fourth level, the province (between regions and municipalities), which has been recently transformed into a second-tier LG, a sort of consortium amongst municipalities. Italy is often referred to as a “regionalised country” [
2], in particular since the constitutional reform of 2001 and the fiscal federalism law of 2009 both granted greater autonomy to the regions. LGs are basically represented by municipalities and provinces (and, more recently, by other second tiers LGs) and also are granted a certain level of fiscal, financial and organizational autonomy.
There are about 8000 municipalities (comuni) with a high degree of fragmentation resulting in a significant variation in the actual tasks and activities performed by the various municipalities, even though uniform regulations apply. The most important spheres of municipal activity are waste management and disposal, water and natural gas distribution, social services and housing, urban planning, road building and maintenance, public transportation and mobility, school buildings, sport and leisure. Differences amongst municipalities mainly relate to quality and quantity rather than the existence of the services provided. In fact, in small municipalities several core services, such as transportation and local utilities, are provided by consortiums of second tier LGs (such as unioni di comuni or comunità montane), or external companies usually controlled by a group of cities (partecipate), which manage areas far larger than those of each municipality and receive funding from municipalities. These groupings partially bridge the gaps in size amongst municipalities.
Currently there are 107 provinces (93 province and 14 città metropolitane) each covering a jurisdiction that represents the sum of several municipal jurisdictions. They are in charge of transport, local roads, environmental protection, sewerage, waste, secondary schools, etc. Following a recent new law issued in 2014, provincial tasks have been partially transferred to regions, municipalities or new inter-municipal bodies, depending on each region.
The financing system of municipalities is currently based on own-source revenues, including a municipal property tax (
Imposta Municipale Propria IMU), a municipal tax on building licenses, a waste tax and an elective share of personal income tax, with some municipal leeway on the rate. The financial autonomy has increased between the first 15 years of the 21st century, increasing from 63% (2000) to 84% (2014) [
68].
Provincial own taxes include a vehicle insurance tax, a vehicle registration tax, a surtax on electricity consumption (abolished in 2011) and a share of personal income tax. The financial autonomy has slightly increased along the first 15 years of the 21st century, from 61% (2000) to 68% (2014) [
68]. The remaining part of municipal and provincial revenues is represented by state and regional grants distributed with the aim of equalization.
2.4. The Context of Italian LGs and the Factors Affecting Debt Cost
There are five characteristics that we consider relevant when studying the LGs’ cost of debt in Italy: the bankruptcy procedures, the implicit bond seniority, the legal debt limit, the accounting system and the decentralized state supervision of LGs accounts.
(C1) Bankruptcy. First of all, Italian LGs are subject to bankruptcy procedures. Moldogaziev et al. [
69] state that bankruptcy protection rules can influence bondholder risk exposures, and the empirical results suggest that municipalities eligible to file for bankruptcy protection pay a premium. The premium is higher if issuers are unconditionally authorized to file for bankruptcy protection, especially for debt with longer maturities. Different from a state takeover but similarly to the private sector, bankruptcy procedure refers to that situation where an LG’s state of insolvency is declared or imposed by a court order, and creditors are paid by clearance of assets and credits [
70]. In Italy, the law provides three typologies of situations of financial distress for LGs: the most severe default or bankruptcy (
dissesto); the intermediate pre-default (
predissesto), which is a sort of condition in which the LG is subjected to a series of central government continuous checks; and, the least acute imbalance that occurs in the rebalancing procedure (
procedura di riequilibrio). The latter procedure was introduced in 2012 to help LGs in financial distress find a different solution than
dissesto by providing a revolving fund for cash advancements; nevertheless, even LGs in the
dissesto procedure have received financial help by the central government with special laws. An LG is considered to be in the bankruptcy (
dissesto) condition when (a) it is not able to continue its functions and essential services, or (b) it cannot pay creditors with regular resources (i.e., insolvency). LGs declared in default status are managed by a settlement committee (
organo straordinario di liquidazione), which takes care of assets and credits clearance. This procedure usually increases the delay of creditors’ payment by LGs and lasts five years—but with possible extensions to ten years. All debts and credits concerning constrained funds, operations starting from the default declaration date onwards and, in particular, long-term bank loans and bond repayments, are excluded from this special procedure and remain managed by ordinary institutional bodies. The ordinary institutional bodies are in charge of putting in place all measures aimed at increasing receipts and reducing expenses, in order to restore a balanced financial situation.
(C2) Payment delegation mechanism that protects loans and bonds from bankruptcy. Second, LGs’ loans, including bonds, may be supported by an irrevocable payment delegation (delegazione di pagamento), a mechanism that implements a priority on funds obtained from collection of revenues, to pay debt instalments. It consists of a writ of execution. In other words, while long term debt creditors are considered common unsecured creditors, they in fact benefit from a better position than other creditors. This delegation is very likely to be applied, especially when an LG experiences or may experience liquidity problems.
(C3) Legal debt burden limit. Third, LGs must comply with a debt limit based on the percentage of interest and other debt costs out of current revenues. This is a legal debt burden that has changed during the past twenty years, from 25 percent in 2000 to the current 10 percent and a low of 8 percent in 2011. In case an LG reaches this limit, it cannot get a new long-term loan.
(C4) Opacity of accounting. Fourth, traditional public accounting has not been replaced by accrual accounting yet. Italian LGs were subject to a reform of financial reporting in 1995. The new legislation was enacted with the aim, also, to provide better transparency and accountability [
71,
72]. While the traditional obligation-based budgetary accounting system continued to have a pivotal role (through the annual budget and report), a new set of financial and non-financial information was required to measure the economy, efficiency and effectiveness. Therefore, the demand for high-quality data is limited and while fiscal consolidation limits are computed according to obligation-based accounting, accrual accounting has not been considered important by local decision makers (municipal councils) or auditors [
73]. According to an European Commission study, Italy is in the lowest quartile of EU countries in terms of development of accrual accounting [
74]. Yet, according to some authors, at a conceptual level the timing and recording of accounting numbers in the obligation-based accounting system roughly approximate, at least for current revenue and expenditure, the accrual accounting system. Therefore, the former can be a valuable proxy [
75]. For these reasons, budgetary obligation-based accounting system information is used in the present study. It must be noted that starting from 2015 the budgetary obligation-based accounting system has been slightly changed [
76], but this is not relevant for our study as the relevant dimensions used here have not been affected.
(C5) State supervision with a regionalized pattern. Finally, state supervision of LGs’ accounts, which has an impact on borrowing costs as discussed previously, possesses a sort of regionalized pattern. The Court of Auditors (Corte dei conti) pursues the auditing function by Italian constitution and has 21 regional audit units to carry out its activity at the LG level. While these regional units are coordinated by the Local governments section (Sezione delle autonomie) of the national Court of Auditors via national guidelines, each regional unit has a certain degree of autonomy and carries out its auditing duties by covering different percentages of LGs every year and using different approaches (e.g., selection of LGs to audit using financial ratios from annual financial report, randomized selection, selection on the basis of previous inspection, etc.). In other words, despite national guidelines, state supervision differs in the different regional jurisdictions.
3. Data and Methodology
3.1. Data
In order to investigate the drivers of Italian LGs’ bond spreads, we rely on a sample of 1,305 variable and fixed rate bonds issued by Italian LGs between 2000 and 2015. Differently from previous studies [
22], we extend the sample to all the LG bonds available on Bloomberg, including also LGs that are not Province Capitals (
Capoluoghi di Provincia). In fact, although bonds of smaller LGs may not be as informative as bonds issued by larger LGs, they still add significant variability to the sample. In addition, differently from Pinna [
22], we compute the spread of fixed rate bonds as the difference between their yield to maturity at issuance and the swap rate with the same maturity of the bond (i.e., asset swap spread for fixed bonds and discount margin for floating rate notes). In this way, we can compare fixed and floating rate notes, with the spread at issuance of the latter being equivalent to their discount margin (i.e., the spread at issuance above the floating benchmark rate). Moreover, we also compute the spread between the Italian BTP (
Buoni del Tesoro Poliennali) and German Bund (typically considered the risk-free benchmark for EU countries) (i.e., national government bonds with 10 years of maturity), and collect the data regarding the coupon and maturity structure, the maturity date and the amount issued of the bond (financial data are collected via Bloomberg). Consequently, we collect financial characteristics from financial reports (
conto del bilancio), which are LG specific, from Aida PA (by Bureau van Dijk—A Moody’s Analytics Company) database. We provide the full list and summary statistics of the financial indicators used in this study in
Table 1. In order to accommodate for the common financial reporting lag in Italian LGs, we use financial data lagged by 2 or 3 years before the issuance of the bond, depending on whether the bonds are issued after or before the month of June, when most of Italian LGs’ financial reports are usually published. Finally, we consider two socio-economic variables, namely income per capita (provided by the Italian tax authority
Agenzia delle Entrate) and an indicator of the Mafia presence within the LG provincial jurisdiction. We construct the latter index considering the number of LGs filed for Mafia affiliations within the LG’s province until the bond issuance date, divided by the number of cities within the province. Regarding income per capita, in order to adjust for missing data, we assume that the relative wealth of cities did not change significantly over time, and use the last available measure provided by the Italian tax authority.
The resulting dataset constitutes 1305 bonds, of which 1102 are issued by cities and 203 by provinces. The coupon structure of the bonds is well distributed, with a slight majority of the bonds (59%) having floating/variable coupons. A few bonds in the dataset do not have embedded options (call/sink/put), and only 8 bonds in the sample are rated. It is interesting to note that in terms of spread at issuance, fixed coupon bonds have on average an appreciably lower spread, which varies significantly over time in line with the term structure (namely the difference between long-term and short-term government bonds) of the Italian yield curve. This pattern suggests that the typical investor of Italian LG bonds has been strongly income focused, preferring fixed coupons when the short-term yields were relatively low (benchmark for the floating rate bonds) and variable coupons when short-term yields were relatively higher. This behavior is not perfectly rational; in fact, a steep yield curve would suggest higher rates in the future, and should tilt rational investors toward floating rate notes (due to their lower sensitivity to interest rate increases). We report the full descriptive statistics of the variables used in this study in
Table 1.
3.2. Methodology
Relying on the panel data presented in
Section 3.1, we estimate the sensitivities of the LGs’ spread at issuance to a vector of LG financial characteristics and socio-economic variables through a cross sectional OLS (ordinary least squares) regression model with White standard errors. In doing so we control for sovereign risk (proxied by the BTP-Bund spread), amount issued, years to maturity, the coupon structure, maturity structure (e.g., callable, sinkable etc.) and type of LG (province or municipality), which are likely (as typical for any other bond) to explain a large part of the LGs’ spread [
77].
Following is the specification of our model, where “Financial”, “Social” and “Controls” are vectors of financial variables, socio-economic and control variables respectively:
In order to normalize the variables and control for outliers we winsorize at a 5% level the spread at issuance and the accounting ratios, and we take the natural logarithm of our two variables, i.e., CR and TOG.
Among the several LG financial and social factors discussed in the literature, we focus on a specific set of ratios and indicators, which are available for the majority of the LGs in our sample and we expect to explain the different cost of financing between different issuers. Within such a set of indicators (full list and definition can be found in
Table A1) we select and discuss in the next paragraphs those that we find to statistically explain the LGs’ spread at issuance (full list and results in the
appendix); i.e., have a robust, statistically significant impact on the LGs’ cost of financing.
The Current Balance Ratio (CBR) should represent one of the most important financial condition indexes, covering factor F1 discussed above. This ratio is computed by dividing current revenues by current expenditures and debt repayments. If it is greater than 1, the LG is self-financing its new capital assets. If it is below 1, current expenditures and debt repayments are not fully covered by regular inflows of financial resources. On one hand, this would mean more need of new debt; on the other hand, this may create a need to increase taxes or decrease services, thereby having a potentially negative impact on the LG’s economic environment and, in turn, affecting the future capability to repay debt. Therefore, the higher CBR, the lower is the cost of debt.
The level of Current Revenues (CR) is a good proxy for the size of the LG (factor S7). Not only do higher current revenues mean a larger population and thus larger income from taxes, but also a wider set of services and activities provided in answer to special needs (e.g., increase in maintenance costs in mountainous areas) or a wider user base (e.g., tourist or business areas). Going beyond the size proxy, in case an LG does not have sufficient liquidity to payback the bondholders, according to Italian law the treasurer must provide liquidity in advance for approx. 42% of current revenue. Therefore, we expect that investors would require a lower spread from larger LGs with higher current revenues, since they have a larger pool of revenues to guarantee the bond repayment (factor F1). In order to normalize the distribution of the variable we take the natural logarithm of CR (LnCR).
The third variable of our model is the level of Transfers from Other Governments (TOG). As discussed in literature, LGs that finance their expenses through transfers coming from other public entities may be regarded as not totally self-sufficient by investors (factor F2). Moreover, there might be a moral-hazard issue for LGs for whom a large part of current revenues comes from other public entities. Therefore, we would expect that investors require a higher spread from LGs with higher transfers from other government entities. Also in this case, we take the natural logarithm of the variable (LnTOG) to normalize the distribution.
The Saturation of the Legal Debt Burden (LDB) discussed above (factors F9 and C3) is another variable of our model. In case an Italian LG reaches the maximum interest/current revenue ratio allowed by law, it cannot issue other debt, which may, in fact, be used to refinance part of the capital structure. Therefore, it seems reasonable that investors demand a higher risk premium to invest in debt-saturated LGs.
Unpaid Treasury Advances (UTA) measures factor F7 discussed above. An LG that is not able to repay treasury advances may have serious liquidity problems, which in turn could jeopardize the repayment of an LG’s bonds. Therefore, we argue that investors may require a higher spread to invest in their bonds.
We use Income per Capita (IC) as a proxy for the wealth of the LG (factor S7) and the information about the revenue base and expenditures needs (factor S1). Investors might perceive richer LGs as more reliable, thereby requiring a lower spread at issuance.
We use an index of the Mafia presence in the LG’s territory (MI) as a proxy for the quality of the financial data published by the LG’s administration (factor
S2), which may in fact be more prone to financial fraud. Also, recent literature has discussed the premium investors ask in case of criminal organizations’ presence in LGs’ jurisdiction (factor
S8). Investors might require a higher premium to invest in LGs with a Mafia infiltration history. A synopsis of all independent variables used is presented in
Table 2, while we report their correlation matrix in
Table A2 of
Appendix.
The model does not consider some of the variables discussed in the literature for several reasons. Credit rating scores (factor S3), as discussed previously, are available for a very limited number of LGs as the Italian market represents a non-mature market. In the initial model, we have controlled for rating scores for those cases (n = 8) with rating scores, but results did not provide any significant evidence about their impact on cost of bonds. Unemployment rate (another aspect included in factor S7) has not been used for two reasons: it would follow the same pattern as IC and it is not available at the municipal level. There are also no proxies for the announcement of higher future deficits (factor S4), which would instead require a qualitative analysis for each LG. The intensity of the relationship between municipal advisors and underwriters (factor S5) cannot be measured. Due to the incomplete implementation of accrual accounting, asset information is not available or relevant; therefore, factor F4 cannot be measured. Considering the many different types of revenue an LG may have, we have limited the consideration of diversification of revenues (factor F3) considering just the two types of revenue that both types of LGs—provinces and municipalities—have: own-sources and intergovernmental grants (LnTOG). State supervision, via the regional branches of the Court of Auditors (factors S6 and C5), while not homogeneous, cannot be estimated over the period covered. The overall balance between revenues and expenditures (factor F5), the fixity level of expenditures caused by personnel and debt installments (factor F6), and the level of short-term liabilities and short-term debt outstanding (factor F8) do not seem relevant. Some explanations will follow. Factors C1 (bankruptcy), C2 (payment delegation mechanism that protects loans and bonds from bankruptcy) and C4 (opacity of accounting) have not been included in the analysis as they represent constants. Finally, variables about lender characteristics (factor S9) have not been included, since the purpose of this paper is to evaluate the cost of debt for specific LGs as independent entities. In this respect, considerations about potential lenders should not be considered.
4. Findings and Discussion
In
Table 3, we report the results of regression (1) following the main specifications of the model. Differently from the previous literature, our results show that investors rely not only on sovereign risk and the bond characteristics, but also on accounting and socio-economic variables in determining the spread at issuance of LG bonds.
In particular, controlling for the bond structure, size, and sovereign risk (BTP-Bund spread), we find that the level of current revenues (LnCR), transfers from other government entities (LnTOG), debt saturation (LDB), income per capita (IC) and the Mafia index dummy (MI) are all statistically significant determinants of the LGs’ spread at issuance.
As expected, debt saturation, transfers from other government entities and the Mafia index dummy are positively related to the spread at issuance; i.e., LGs with higher debt (closer to the legal limit), lower internal revenues, and operating in a province where public administrations have Mafia-related criminal records face additional costs to issue bonds compared to their peers. In particular, considering an average sample spread at issuance of 9.59 bps (bps = basis points, 1 basis point is equal to 1/100th of 1%), we find that one standard deviation increase in the transfers from other governments entities leads, on average, to an increase of 2.21 bps in the spread at issuance (+23% in relative terms), while a one standard deviation increase in the debt saturation ratio leads to a less significant 0.86 bps increase in spread at issuance (+9%), everything else held constant.
Therefore, as in Martell [
15] and Bastida et al. [
16], we also find that investors require a higher risk premium to invest in LGs whose revenues depend on other government entities. Interestingly, transfers from other governments seem to have a larger impact on the bond spread than the debt burden, which is widely studied in the literature [
20,
21,
22,
31,
32], and directly affects the debt service. This may be a peculiarity of the Italian market, where government efficiency, transparency and rule of law is rather low compared to the developed world. Italy ranks 105th (score 3.2/10) in the “Public Institution” dimension of the Global Competitiveness Ranking of the World Economic Forum, just before Nicaragua, Sierra Leone and Honduras. The Public Institution dimension takes into account “excessive bureaucracy and red tape, overregulation, corruption, dishonesty in dealing with public contracts, lack of transparency and trustworthiness, inability to provide appropriate services for the business sector, and political dependence of the judicial system” as well as “the proper management of public finance”. Therefore, the opaque and rather unreliable Italian public institutional environment may increase the uncertainty of the revenues coming from other government entities.
Moreover, LGs that operate in a province where public administrations have a Mafia history pay on average 2.6 bps more (+27%) than their peers that operate in less troubled areas. Considering the nature of our index—which is a proxy for Mafia infiltration in the LG’s area—our results probably differ from Benton [
62]. In fact, in the last three decades, organized crime in Italy moved from pursuing violent crimes (the type of crimes studied in Benton [
62]) to mainly drug-dealing (also international) and financial crimes (e.g., money laundering activities)—thereby raising concerns regarding the transparency and financial reporting quality of LGs with mafia infiltration. Therefore, we argue that the positive relation between our Mafia index and the spread at issuance reflects the results of Peng and Brucato [
38] and Bharath et al. [
39], who find that reducing the information asymmetry can ultimately reduce LGs’ cost of debt. Consequently, our results incidentally shed a light on the importance of transparency for LGs and the benefits it might have on LGs’ cost of financing.
In addition, we also include in the model the unpaid advances dummy (UTA), for which statistical significance is captured only by income per capita (IC); however, it is consistently positively related to the spread at issuance across different specifications of the model (see
Table A3). In fact, a positive value of such a variable constitutes a strong sign of financial distress for an LG. While the payment delegation mechanism covers investors from the risk of financial distress, investors still seem sensitive to bankruptcy risk: the higher the probability of being involved in a bankruptcy procedure, the higher is the risk premium. Therefore, our study suggests that the findings of Moldogaziev et al. [
69] can be extended to those cases where bondholders are safeguarded by a special status, but where bankruptcy rules apply. This might signal an overreaction of the investors to the opaque and inefficient Italian public institutions, which are in fact in charge of both the payment delegation and the bankruptcy procedures.
On the other hand, the level of current revenues (LnCR) and the income per capita (IC) are negatively related to the LG’s spread at issuance; i.e., larger and richer LGs pay, on average, a lower risk premium compared to their peers. In particular, a one standard deviation increase in LG current revenues leads to an average decrease of 2.21 bps in the spread at issuance (−23%), while a one standard deviation increase in income per capita leads to only a 0.25 bps (−2.6%) decrease in the LG’s bond spread. Our results are therefore consistent with the view of Rivers and Yates [
31] and Simonsen et al. [
60], who argue that larger LGs face a lower cost of financing since they can access the national bond market. However, it is important to consider that in the Italian market LGs may still be able to obtain a lower cost of financing through private placement (via foundations/local investors) of their bonds, thus resembling the dynamics described in Allen et al. [
61]. This is also evident in our sample, where certain small LGs (e.g., City of San Felice sul Panaro) have even been granted a negative spread at issuance. In addition, our results suggest that the level of revenue (i.e., the size of the LG) is more important than the revenue base (i.e., the income per capita of the LG’s population) that provides the tax base for the LG [
32,
36].
Hence, differently from the previous literature, we are able to identify the LG-specific variables that distinguish bonds issued by different Italian LGs, even though their impact on the spread at issuance is not strongly economically significant if considered in absolute level. However, considering the results relative to the very low average spread at issuance (9.59 bps), the impact of the LG-specific variables on the spread at issuance is nevertheless significant.
In line with the previous literature, in our model the largest part of the variation in the spread of Italian LGs bonds is also mainly due to variables that do not depend on the LG’s internal factors (financial and socio-economical), such as the bond structure, size, and the BTP-Bund spread. In fact, including only the aforementioned control variables, the model explains about 50% of the variation in LG’s bond spreads (based on the R-squared measure).
Our study does not support the relevance of such important financial ratios as the current balance ratio (CBR). While it usually is considered one of the most important factors of financial distress assessment [
16], its computation from the public accounting system in use (which is not accrual-based) might hamper its validity and understandability by investors. For this reason, investors are better to rely on other easy-to-compute and easy-to-understand measures.
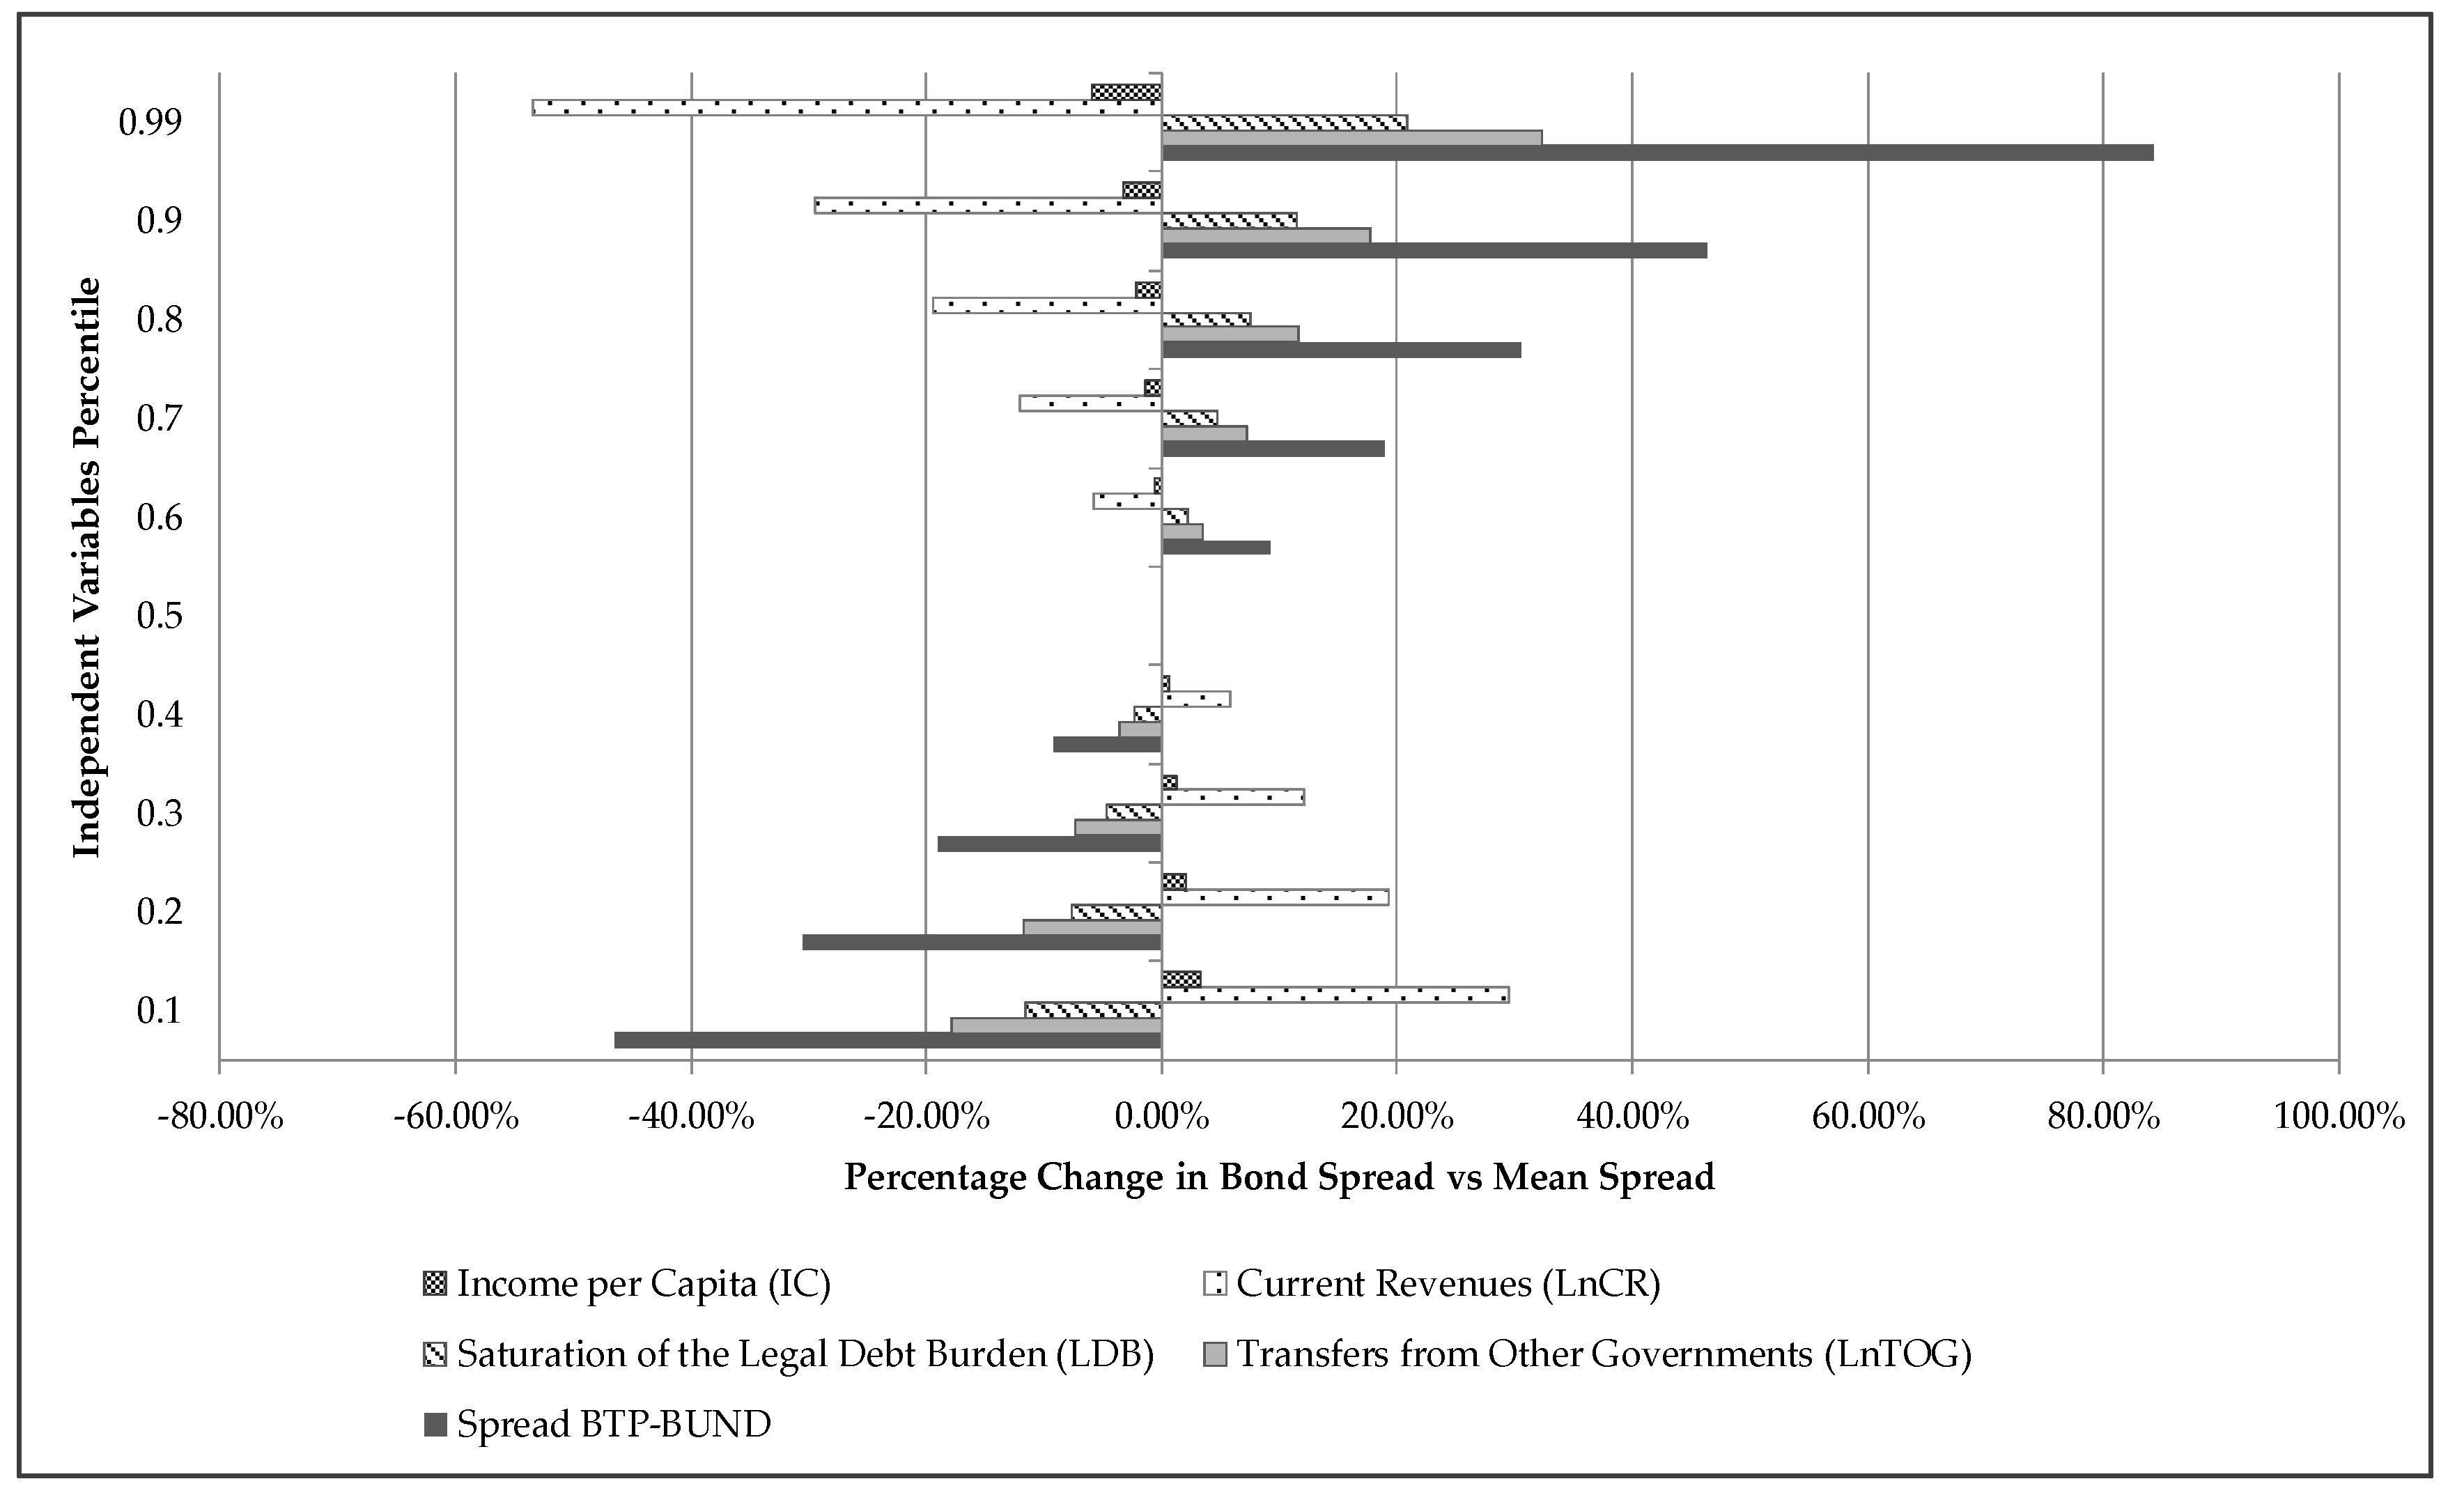
In
Figure 1 we report the sensitivity analysis of the bond spread at issuance to its main determinants found in the regression analysis of
Table 3. Holding everything else constant, we compute the percentage changes in the spread at issuance relative to the estimated average spread, given ten-percentile changes in the distribution of the main independent variables. The sensitivity analysis confirms what one can infer from the regression coefficients estimated in
Table 3. The most relevant factors beyond the BTP-Bund spread are the level of Current Revenues (CR) and Transfers from other Governments (TOG). For instance, an increase of two ten-percentile changes in the Current Revenues distribution generates a reduction of roughly 12% in the LG’s bond spread.
Although outside the main goal of our paper, in the
appendix we also provide the reader with an out of sample analysis of our model (see
Table A4 and
Table A5). Such analysis, however, is not meant to test the forecasting ability of our model within the current market environment.
The contribution of LG-specific variables may be significantly larger with an updated sample, especially considering the generally much tighter and compressed spread environment that characterized the years where most of the bonds of the sample were issued (i.e., the period 2001–2008). This was due to a much more relaxed attitude of investors to both credit and liquidity risk before the 2008 financial crisis. The sharp decline in the number of LG bonds issuances in the 2009–2017 period (only 69 bonds issued from a sample of 1305), was not a coincidence. In this regard, we control also for a crisis dummy, which, however, is not statistically significant; this is probably due to the relatively low number of observations after the financial crisis. In fact, as also found by Schulz and Wolff [
64], higher risk aversion could increase the cost of financing LGs’ bonds. Hence, in a less favorable environment, financial and non-financial factors may play a larger role in determining the cost of financing LGs. Consequently, our results provide a rather conservative estimate of the impact that LGs’ internal factors have on their cost of financing. In fact, we would expect such an impact to be much larger in the current and future economic environments, where investors are much more attentive to liquidity and credit risk.
In fact, even though the high seniority of the LGs’ bonds (by means of the irrevocable payment delegation) might decrease the relative importance of LGs’ internal factors, the rather opaque accounting system, together with the uncertainty embedded in Italian decentralized controls and bankruptcy procedures, brings attention to a set of internal financial and socio-economic indicators that act as proxies for the LG’s credit risk.
Therefore, considering that the level of financial transparency and standardization for Italian LGs lags significantly behind, we would expect that improvements in the financial reporting standards and better access to information could increase the relative importance of LGs’ balance sheets in determining their creditworthiness. In fact, the better the access to the LG’s financial statements, the easier it is for an investor to differentiate among different LGs. In other words, we would expect the marginal effect on the spread at issuance of current revenues, saturation of the legal debt burden, unpaid current advances, and transfers from other governments to increase with the level of transparency and accessibility of LGs’ financial statements.
5. Conclusions
Our results show that investors in the Italian bond market consider several specific financial and socio-economic indicators when assessing an LG’s credit risk. Specifically, an LG operating in a region with a history of organized crime, that has comparatively high revenues coming from other government entities, and that has relatively high existing debt, faces higher bond-issuance costs compared to its peers.
In Italy an LG operating in a high crime area paid on average 2.6 bps more (+27% relative to the average sample spread) on its debt, while a one standard deviation increase in transfers from other governments led to an average increase of 2.21 bps in the bond spread (+23%). By contrast, LGs with higher operating revenues (often because they are located in an area with high per-capita income) paid, on average, a lower spread at issuance. For instance, a one standard deviation increase in the LG’s current revenues led to an average decrease of 2.21 bps in the spread (−23%).
Clearly, not all LGs will have an experience similar to that of Italy. Moreover, while the combination of these three factors can be very powerful, there also may be a case that the presence of only one or two of those factors also can be influential. Further research is needed to assess the relative impact of each of these factors in other jurisdictions.
Despite these limitations, our research has several interesting sustainability implications for local and national policymakers. First, in contrast to previous research, our results emphasize the importance of providing an LG’s financial reports to potential bond investors. These reports contain information on the LG’s dependency on transfers from other government entities, and also on the amount of revenues from current operations, both of which can serve to influence the risk premium.
Second, additional improvements and standardization of the accounting system may lead to a circular process that can be beneficial to an LG. Specifically, better accessibility and understandability of financial statements can make an LG’s bonds more attractive to investors, which would lower the financing cost, thereby creating an incentive to further improve the quality of financial reports. Unfortunately, while financial information seems relevant, the current balance ratio, usually considered one of the most relevant factors affecting the cost of debt, is not statistically significant. However, this may be due to its difficult computation and interpretation by investors.
Third, the move to accrual accounting, which has been promoted not only in Italy, via recent reforms, but in Europe (via the imminent implementation of the harmonized accrual-like European Public Sector Accounting Standards (EPSAS) from 2021) [
42], and several other countries [
78], may improve the set of comprehensible financial information used by potential investors in the future, similar to the case in mature market contexts. This may further increase the efficiency of markets, and thus promote enhanced debt accessibility and sustainability.
Fourth, our results suggest that investors can be affected by institutional and transparency inefficiencies. For instance, we found that transfers from other governments have a larger impact on a bond’s spread than the saturation of the legal debt burden, which is an objective financial distress measure. Indeed, when an LG’s revenues are dependent on other public entities, there is a risk that those revenues may vary in future years, which raises a concern about the LG’s sustainability. This calls for a higher level of financial autonomy to decrease the cost of debt, which corroborates previous research.
Fifth, our finding that LGs with a history of criminal activity pay more to issue debt, on average, may be due, on one hand, to overall inefficiency effects, and, on the other, to a perceived lower level of transparency of the LG’s financial information. Clearly, not all LGs have a history of criminal activity. Nevertheless, this factor sheds light not only on the need to prevent criminal activity, but also on the importance of external auditors, especially in the case of a higher probability of criminal activity.
Finally, external auditors also help to improve the level of accounting transparency, especially by detecting possible flaws. The result is a need for specific interventions, such as continuous audits instead of randomized ones. This is especially important in areas that have been affected historically by accounting opacity.
Considering the time horizon used in our sample, which included a period characterized by extremely tight spreads, our results provide a rather conservative estimate of the effects that the above factors have on an LG’s bond spreads. Therefore, further empirical research is needed to focus on the determinants of Italian LGs spreads, thereby considering current market conditions, which are characterized by significant risk aversion.
More generally, our results have important implications for non-mature municipal bond markets. Although our analysis has been carried out only for the Italian case, many of the distinct financial and socio-economic indicators that proved to be significant in our study might also be significant in other contexts, albeit with some technical differences. In particular, the quality and timeliness of the financial reports is a factor whose relevance remains valid for many non-mature municipal bond markets. The efforts of international institutions like the World Bank in projects intended to improve financial disclosure of LGs with the aim to improve fiscal and financial sustainability go exactly in this direction [
79].
The same idea is appropriate for the transparency and dependency of LGs on transfers from other government institutions; this is a situation common to many LGs in non-mature municipal bond markets, especially several countries of Africa and Asia, a few areas of Central and Southern America and the Pacific Ocean region, and some former Soviet Union countries [
80].
Finally, the sensitivity to the level of crime reported in specific LG areas is a trait that could be analyzed in several non-mature markets, especially in areas with fast-growing economies experiencing high levels of crime, such as Brazil and South Africa [
81]. Further research could address other countries with non-mature LGs bond settings to assess whether the determinants are similar. That research might also assess whether different levels of sophistication of accrual accounting information have different effects on an LG’s ability to move toward a more mature bond market, and hence one with greater sustainability.


