Psychometric Properties of the State-Trait Anxiety Inventory (Form Y) among Malaysian University Students


Abstract
:1. Introduction
1.1. Concepts of State and Trait Anxiety
1.2. The Objective
2. Method
2.1. Respondents
2.2. Measures
2.3. Data Analysis
3. Results
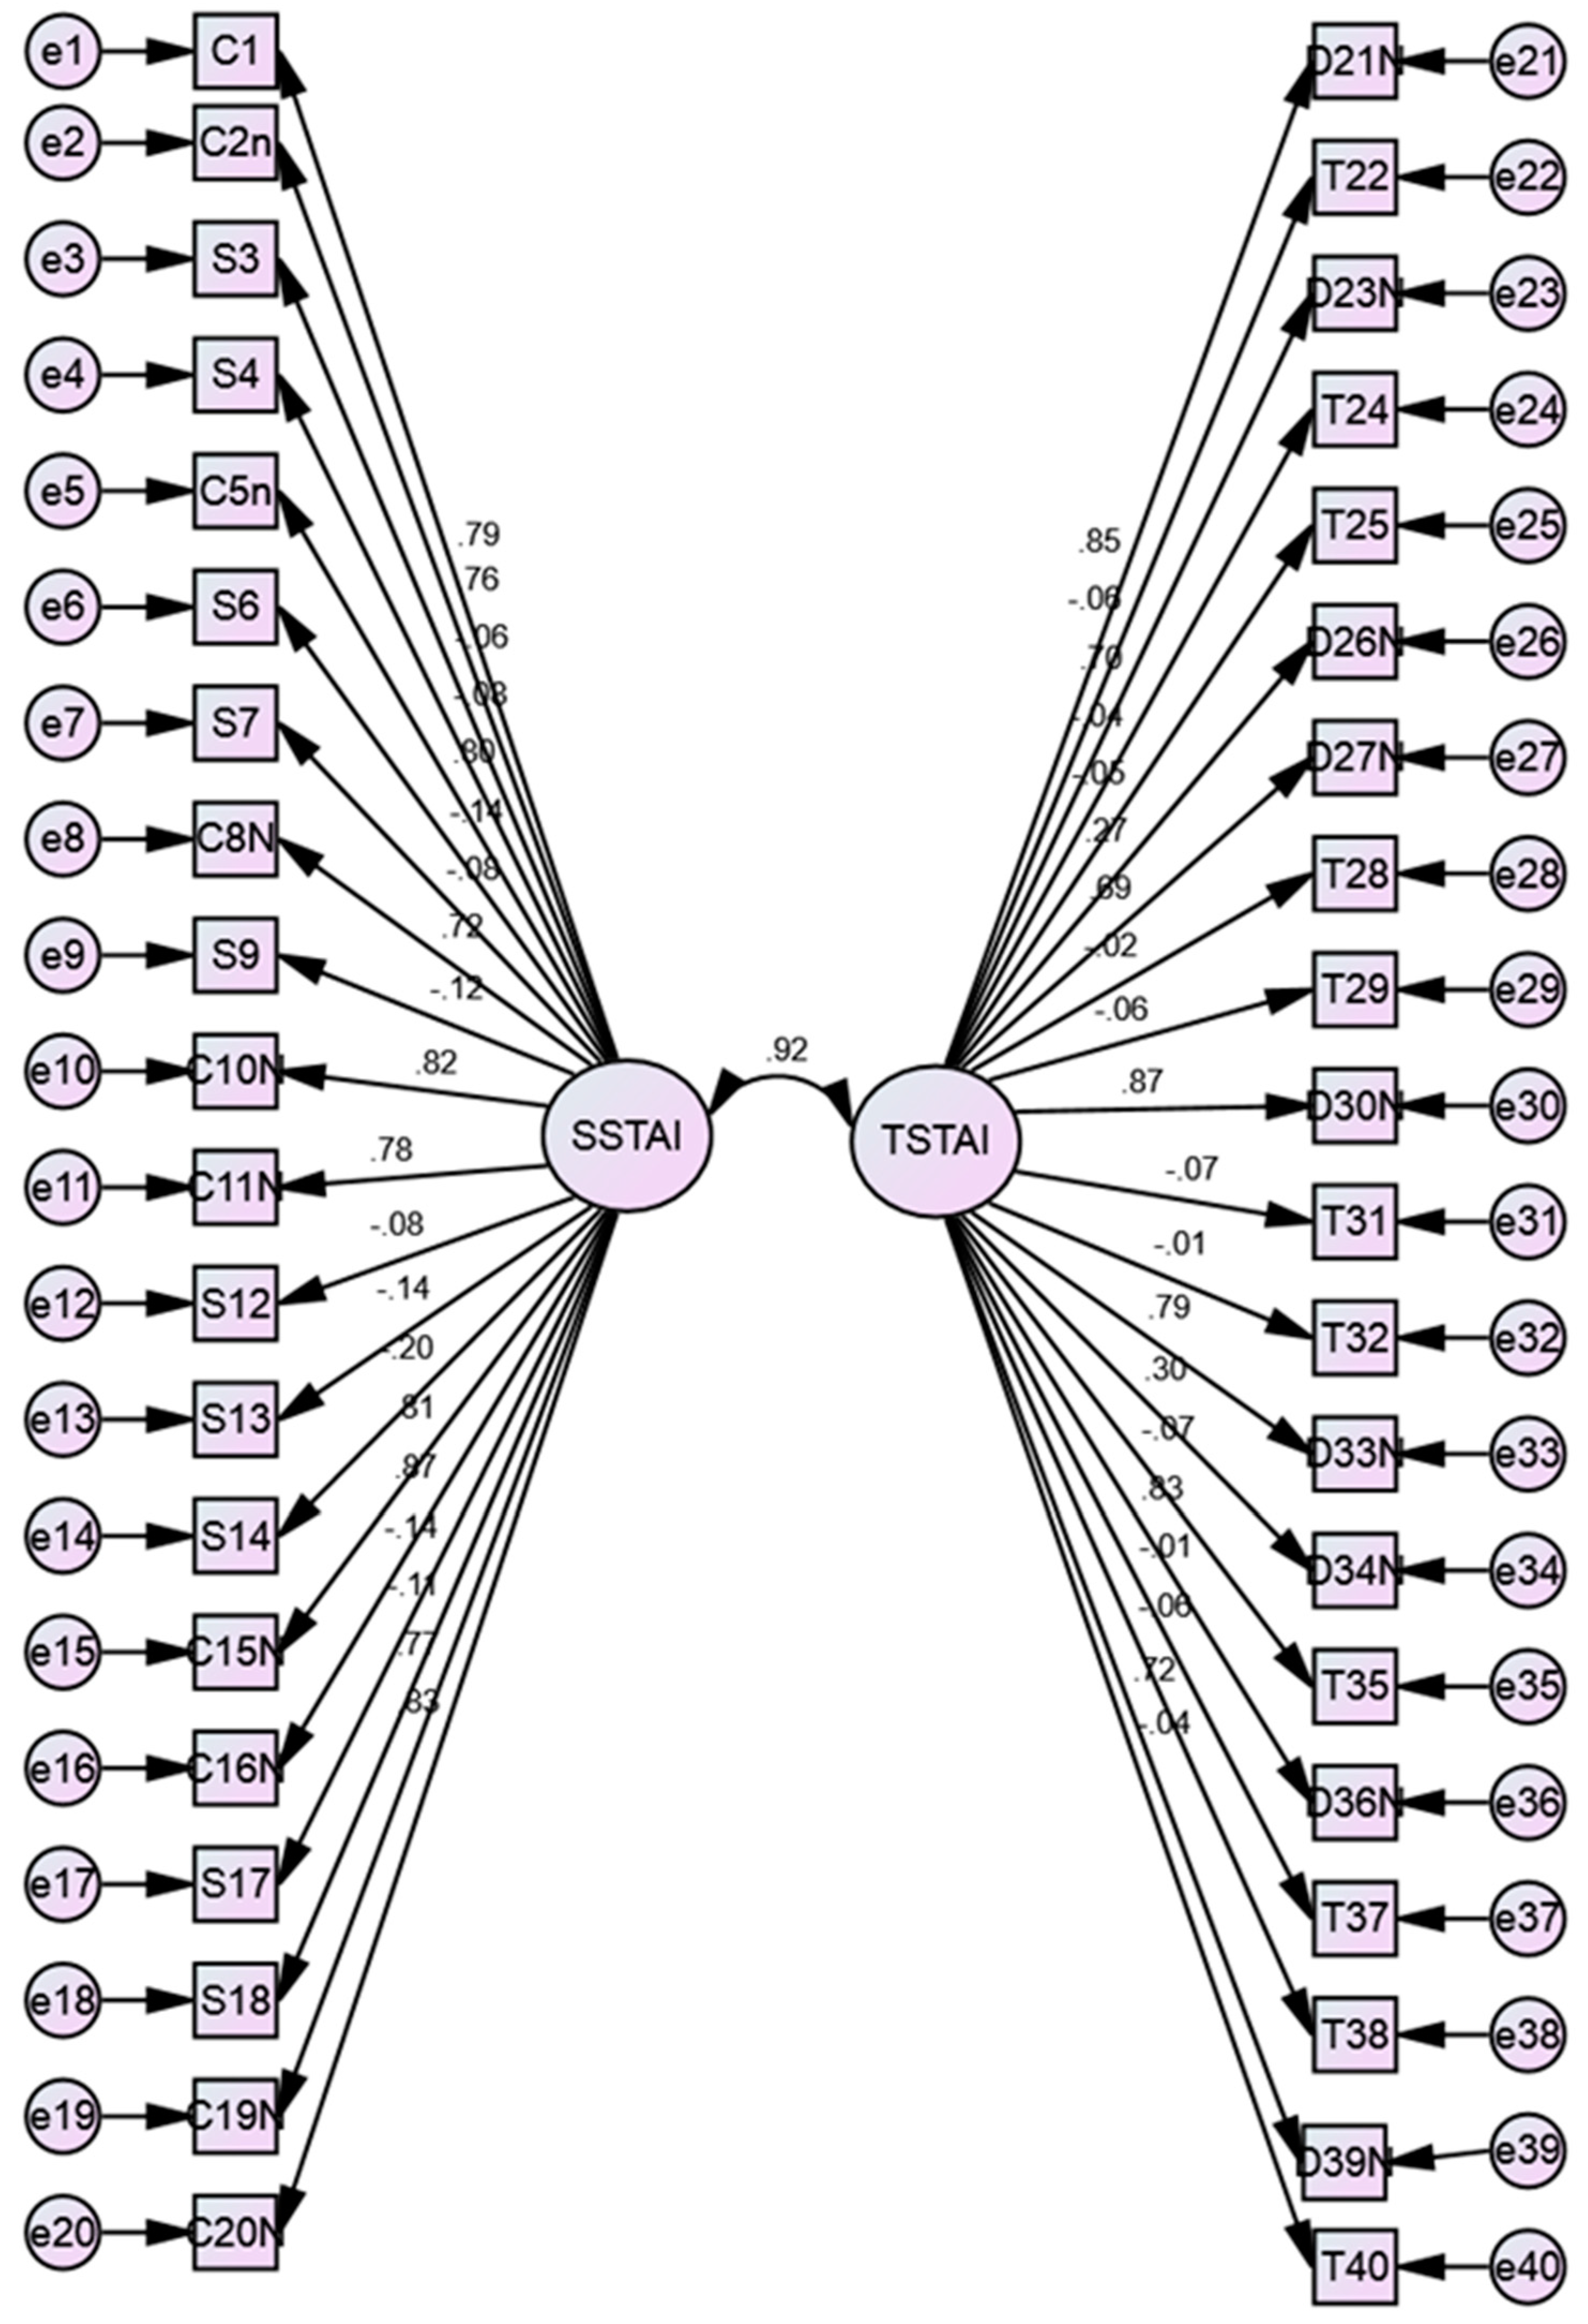
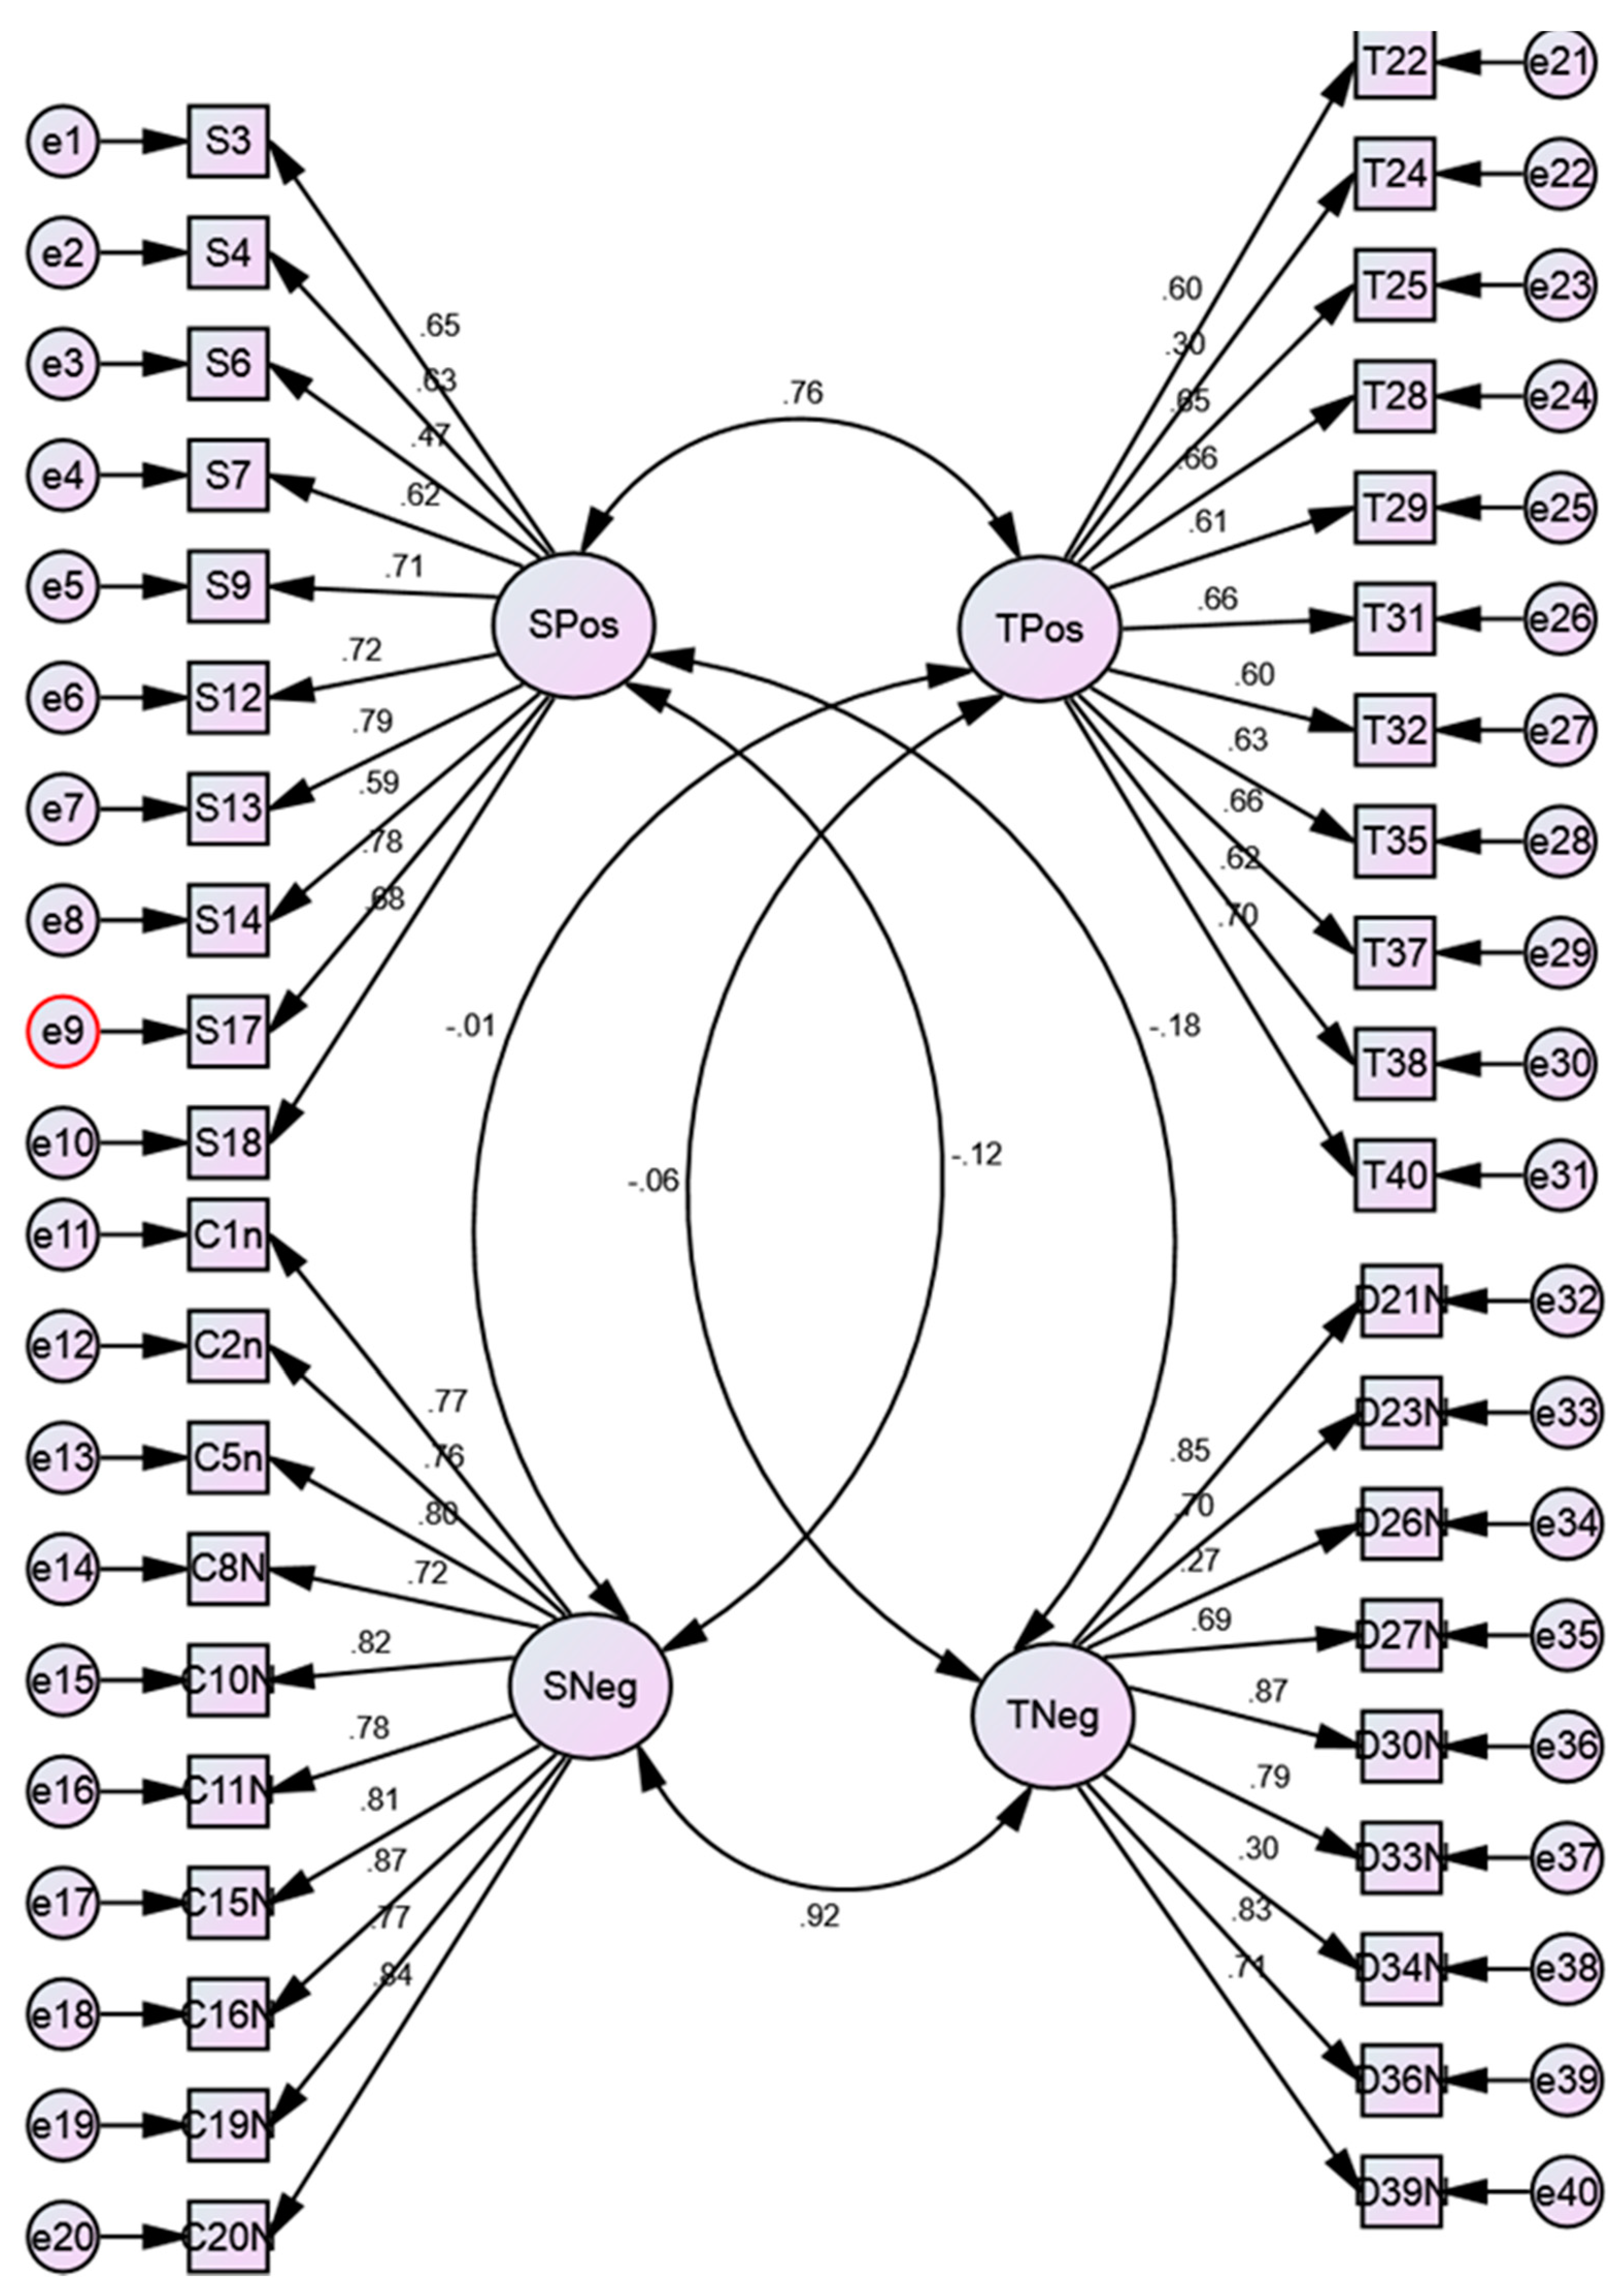
3.1. The Two-Factor Model and Four-Factor Model of State-Trait Anxiety Inventory (STAI)
3.2. Composite Reliability
3.3. The Convergent Validity of the STAI
3.4. The Discriminant Validity of the STAI
4. Discussion and Conclusions
Author Contributions
Funding
Acknowledgments
Conflicts of Interest
Appendix A
Appendix A.1. Supplement Studies on Validation of the STAI
Appendix A.2. Validation of the STAI in Malaysia
Appendix B. Standardized Regression Weights

| Item Loading | Item Loading | ||||||
|---|---|---|---|---|---|---|---|
| D21 | <--- | TSTAI | 0.847 * | C20 | <--- | SSTAI | 0.828 * |
| D22 | <--- | TSTAI | −0.062 | C19 | <--- | SSTAI | 0.773 * |
| D23 | <--- | TSTAI | 0.702 * | C18 | <--- | SSTAI | −0.109 |
| D24 | <--- | TSTAI | −0.040 | C17 | <--- | SSTAI | −0.140 |
| D25 | <--- | TSTAI | −0.046 | C16 | <--- | SSTAI | 0.871 * |
| D26 | <--- | TSTAI | 0.269 * | C15 | <--- | SSTAI | 0.809 * |
| D27 | <--- | TSTAI | 0.690 * | C14 | <--- | SSTAI | −0.197 |
| D28 | <--- | TSTAI | −0.022 | C13 | <--- | SSTAI | −0.138 |
| D29 | <--- | TSTAI | −0.063 | C12 | <--- | SSTAI | −0.083 |
| D30 | <--- | TSTAI | 0.873 * | C11 | <--- | SSTAI | 0.783 * |
| D31 | <--- | TSTAI | −0.070 | C10 | <--- | SSTAI | 0.817 * |
| D32 | <--- | TSTAI | −0.006 | C9 | <--- | SSTAI | −0.121 |
| D33 | <--- | TSTAI | 0.788 * | C8 | <--- | SSTAI | 0.716 * |
| D34 | <--- | TSTAI | 0.300 * | C7 | <--- | SSTAI | −0.080 |
| D35 | <--- | TSTAI | −0.074 | C6 | <--- | SSTAI | −0.143 |
| D36 | <--- | TSTAI | 0.829 * | C5 | <--- | SSTAI | 0.799 * |
| D37 | <--- | TSTAI | −0.014 | C4 | <--- | SSTAI | −0.081 |
| D38 | <--- | TSTAI | −0.063 | C3 | <--- | SSTAI | −0.057 |
| D39 | <--- | TSTAI | 0.715 * | C2 | <--- | SSTAI | 0.756 * |
| D40 | <--- | TSTAI | −0.038 | C1 | <--- | SSTAI | 0.789 * |
| Item Loading | Item Loading | ||||||
|---|---|---|---|---|---|---|---|
| C18 | <--- | SPos | 0.677 | D22 | <--- | TPos | 0.595 |
| C17 | <--- | SPos | 0.777 | D24 | <--- | TPos | 0.299 |
| C14 | <--- | SPos | 0.590 | D25 | <--- | TPos | 0.652 |
| C13 | <--- | SPos | 0.790 | D28 | <--- | TPos | 0.658 |
| C12 | <--- | SPos | 0.718 | D29 | <--- | TPos | 0.611 |
| C9 | <--- | SPos | 0.706 | D31 | <--- | TPos | 0.663 |
| C7 | <--- | SPos | 0.619 | D32 | <--- | TPos | 0.596 |
| C6 | <--- | SPos | 0.466 | D35 | <--- | TPos | 0.631 |
| C4 | <--- | SPos | 0.632 | D37 | <--- | TPos | 0.663 |
| C3 | <--- | SPos | 0.651 | D38 | <--- | TPos | 0.624 |
| C20 | <--- | SNeg | 0.841 | D40 | <--- | TPos | 0.702 |
| C19 | <--- | SNeg | 0.773 | D21 | <--- | TNeg | 0.846 |
| C16 | <--- | SNeg | 0.873 | D23 | <--- | TNeg | 0.702 |
| C15 | <--- | SNeg | 0.810 | D26 | <--- | TNeg | 0.269 |
| C11 | <--- | SNeg | 0.783 | D27 | <--- | TNeg | 0.690 |
| C10 | <--- | SNeg | 0.818 | D30 | <--- | TNeg | 0.873 |
| C8 | <--- | SNeg | 0.716 | D33 | <--- | TNeg | 0.789 |
| C5 | <--- | SNeg | 0.799 | D34 | <--- | TNeg | 0.301 |
| C2 | <--- | SNeg | 0.760 | D36 | <--- | TNeg | 0.829 |
| C1 | <--- | SNeg | 0.770 | D39 | <--- | TNeg | 0.715 |
References
- United Nations. Sustainable Development Goals: 17 Goals to Transform Our World. 2015. Available online: http://www.un.org/sustainabledevelopment/development-agenda/ (accessed on 11 June 2018).
- World Health Organization. World Health Organization Definition of Health 1998. Available online: http://www.who.ch/aboutwho/definition.htm (accessed on 11 June 2018).
- World Health Organization. Workers’ Health: Global Plan of Action. Sixtieth World Health Assembly. 2007. Available online: http://www.who.int/occupational_health/publications/global_plan/en/ (accessed on 11 June 2018).
- Macik-Frey, M.; Quick, J.C.; Nelson, D.L. Advances in occupational health: From a stressful beginning to a positive future. J. Manag. 2007, 33, 809–840. [Google Scholar] [CrossRef]
- Di Fabio, A. Positive Healthy Organizations: Promoting well-being, meaningfulness, and sustainability in organizations. Front. Psychol. 2017, 8, 1938. [Google Scholar] [CrossRef] [PubMed]
- Di Fabio, A. The psychology of sustainability and sustainable development for well-being in organizations. Front. Psychol. 2017, 8, 1534. [Google Scholar] [CrossRef] [PubMed]
- Caplan, G. Principles of Preventive Psychiatry; Basic Books: Oxford, UK, 1964; ISBN 0422982709. [Google Scholar]
- Di Fabio, A.; Kenny, M.E. From decent work to decent lives: Positive Self and Relational Management (PS&RM) in the twenty-first century. Front. Psychol. 2016, 7, 361. [Google Scholar] [CrossRef] [PubMed]
- Kenny, M.E.; Hage, S.M. The next frontier: Prevention as an instrument of social justice. J. Prim. Prev. 2009, 30, 1–10. [Google Scholar] [CrossRef] [PubMed]
- Hage, S.M.; Romano, J.L.; Conyne, R.K.; Kenny, M.; Matthews, C.; Schwartz, J.P.; Waldo, M. Best practice guidelines on prevention practice, research, training, and social advocacy for psychologists. Counsel. Psychol. 2007, 35, 493–566. [Google Scholar] [CrossRef]
- World Health Organization. Mental Health Status of Adolescents in South-East Asia: Evidence for Action. 2017. Available online: http://apps.who.int/iris/handle/10665/254982 (accessed on 11 June 2018).
- Institute for Public Health. National Health and Morbidity Survey, NHMS. In Non-Communicable Diseases, Risk Factors & Other Health Problems; Ministry of Health: Singapore, 2015; Volume II. [Google Scholar]
- Dyson, R.; Renk, K. Freshmen adaptation to university life: Depressive symptoms, stress, and coping. J. Clin. Psychol. 2006, 62, 1231–1244. [Google Scholar] [CrossRef] [PubMed]
- Radeef, A.S.; Faisal, G.G.; Ali, S.M.; Ismail, M.K.H.M. Source of stressors and emotional disturbances among undergraduate science students in Malaysia. Int. J. Med. Res. Health Sci. 2014, 3, 401–410. [Google Scholar] [CrossRef]
- Beiter, R.; Nash, R.; McCrady, M.; Rhoades, D.; Linscomb, M.; Clarahan, M.; Sammut, S. The prevalence and correlates of depression, anxiety, and stress in a sample of college students. J. Affect. Dis. 2015, 173, 90–96. [Google Scholar] [CrossRef] [PubMed]
- Regehr, C.; Glancy, D.; Pitts, A. Interventions to reduce stress in university students: A review and meta-analysis. J. Affect. Dis. 2013, 148, 1–11. [Google Scholar] [CrossRef] [PubMed]
- Mahmoud, J.S.R.; Staten, R.; Hall, L.A.; Lennie, T.A. The relationship among young adult college students’ depression, anxiety, stress, demographics, life satisfaction, and coping styles. Issues Ment. Health Nurs. 2012, 33, 149–156. [Google Scholar] [CrossRef] [PubMed]
- Latiff, L.; Aszahari, M. Prevalence of mental health problems and the associated factors among undergraduate students in a public university. J. Public 2014, 1, 59–69. [Google Scholar]
- Sahoo, S.; Khess, C.R.J. Prevalence of depression, anxiety, and stress among young male adults in India. J. Nerv. Ment. Dis. 2010, 198, 901–904. [Google Scholar] [CrossRef] [PubMed]
- Spielberger, C.D. Anxiety and Behavior; Academic Press: New York, NY, USA, 1966. [Google Scholar]
- Spielberger, C.D.; Gorsuch, R.L.; Lushene, R.; Vagg, P.R.; Jacobs, G.A. Manual for the State-Trait Anxiety Inventory; Consulting Psychologists Press: Palo Alto, CA, USA, 1983. [Google Scholar]
- Spielberger, C.D.; Vagg, P.R.; Barker, L.R.; Donham, G.W.; Westberry, L.G. The factor structure of the State-Trait Anxiety Inventory. In Stress and Anxiety; Sarason, I.G., Spielberger, C.D., Eds.; Hemisphere: Washington, DC, USA, 1980. [Google Scholar]
- Tabachnick, B.G.; Fidell, L.S.; Osterlind, S.J. Using Multivariate Statistics; Pearsons: New York, NY, USA, 2001. [Google Scholar]
- Kline, R.B. Principles and Practice of Structural Equation Modeling, 2nd ed.; Guilford Press: New York, NY, USA, 2005. [Google Scholar]
- Julian, L.J. Measures of anxiety: State-Trait Anxiety Inventory (STAI), Beck Anxiety Inventory (BAI), and Hospital Anxiety and Depression Scale-Anxiety (HADS-A). Arthritis Care Res. 2011, 63, S467–S472. [Google Scholar] [CrossRef] [PubMed] [Green Version]
- Hu, L.T.; Bentler, P.M. Fit indices in covariance structure modeling: Sensitivity to under parameterized model misspecification. Psychol. Methods 1998, 3, 424–453. [Google Scholar] [CrossRef]
- Hair, J.F.; Ringle, C.M.; Sarstedt, M. PLS-SEM: Indeed a silver bullet. J. Mark. Theory Pract. 2011, 19, 139–152. [Google Scholar] [CrossRef]
- Hair, J.F.; Hult, G.T.M.; Ringle, C.M.; Sarstedt, M.A. Primer on Partial Least Squares Structural Equation Modeling, 2nd ed.; Sage: Thousand Oaks, CA, USA, 2017. [Google Scholar]
- Quek, K.F.; Low, W.Y.; Razack, A.H.; Loh, C.S.; Chua, C.B. Reliability and validity of the Spielberger State-Trait Anxiety Inventory (STAI) among urological patients: A Malaysian study. Med. J. Malaysia 2004, 59, 258–267. [Google Scholar] [PubMed]
- Vitasari, P.; Wahab, M.N.A.; Herawan, T.; Othman, A.; Sinnadurai, S.K. Re-test of State Trait Anxiety Inventory (STAI) among engineering students in Malaysia: Reliability and validity tests. Procedia 2011, 15, 3843–3848. [Google Scholar] [CrossRef]
- Szpak, J.L.; Kameg, K.M. Simulation decreases nursing student anxiety prior to communication with mentally ill patients. Clin. Simul. Nurs. 2013, 9, e13–e19. [Google Scholar] [CrossRef]
- Kaipper, M.B.; Chachamovich, E.; Hidalgo, M.P.L.; da Silva Torres, I.L.; Caumo, W. Evaluation of the structure of Brazilian State-Trait Anxiety Inventory using a Rasch psychometric approach. J. Psychosom. Res. 2010, 68, 223–233. [Google Scholar] [CrossRef] [PubMed]
- McLean, C.P.; Anderson, E.R. Brave men and timid women? A review of the gender differences in fear and anxiety. Clin. Psychol. Rev. 2009, 29, 496–505. [Google Scholar] [CrossRef] [PubMed]
- Hunt-Shanks, T.; Blanchard, C.; Reid, R.; Fortier, M.; Cappelli, M.A. Psychometric evaluation of the Hospital Anxiety and Depression Scale in cardiac patients: Addressing factor structure and gender invariance. Br. J. Health Psychol. 2010, 15, 97–114. [Google Scholar] [CrossRef] [PubMed]
- Van de Vijver, F.J.R. Contributions of internationalization to psychology: Toward a global and inclusive discipline. Am. Psychol. 2013, 68, 761–770. [Google Scholar] [CrossRef] [PubMed]
- Fountoulakis, K.N.; Papadopoulou, M.; Kleanthous, S.; Papadopoulou, A.; Bizeli, V.; Nimatoudis, I.; Kaprinis, G.S. Reliability and psychometric properties of the Greek translation of the State-Trait Anxiety Inventory form Y: Preliminary data. Ann. Gen. Psychiatry 2006, 5, 2. [Google Scholar] [CrossRef] [PubMed]
- Van Der Bij, A.K.; De Weerd, S.; Cikot, R.J.L.M.; Steegers, E.A.P.; Braspenning, J.C.C. Validation of the Dutch short form of the state scale of the Spielberger State-Trait Anxiety Inventory: Considerations for usage in screening outcomes. Public Health Genom. 2003, 6, 84–87. [Google Scholar] [CrossRef] [PubMed]
- Iwata, N.; Mishima, N.; Shimizu, T.; Mizoue, T.; Fukuhara, M.; Hidano, T.; Spielberger, C.D. The Japanese adaptation of the STAI Form Y in Japanese working adults—The presence or absence of anxiety. Ind. Health 1998, 36, 8–13. [Google Scholar] [CrossRef] [PubMed]
- Ma, W.F.; Liu, Y.C.; Chen, Y.F.; Lane, H.Y.; Lai, T.J.; Huang, L.C. Evaluation of psychometric properties of the Chinese Mandarin version State-Trait Anxiety Inventory Y form in Taiwanese outpatients with anxiety disorders. J. Psychiatr. Ment. Health Nurs. 2013, 20, 499–507. [Google Scholar] [CrossRef] [PubMed]
- Hashim, E.; Hasyila, W.W.; Ang, Y.; Helmy, A.A.; Husyairi, H. Psychometric properties of the Malay Translated Spielberger State-Trait Anxiety Inventory in exploring parental anxiety. Med. Health 2018, 13, 106–116. [Google Scholar]
- Hishinuma, E.S.; Miyamoto, R.H.; Nishimura, S.T.; Goebert, D.A.; Yuen, N.Y.C.; Makini, G.K.; Carlton, B.S. Prediction of anxiety disorders using the State-Trait Anxiety Inventory for multiethnic adolescents. J. Anxiety Disord. 2001, 15, 511–533. [Google Scholar] [CrossRef]


| Comparative Fit Index (CFI) | >0.90 |
| Tucker-Lewis Index (TLI) | >0.90 |
| Root Mean Square Error of Approximation (RMSEA) | 0.05–0.08 |
| Chi-Square Statistic value (CMIN/DF) | <5.0 |
| Fit Indices | Recommended Fit | The Two-Factor Model | The Four-Factor Model |
|---|---|---|---|
| χ2 (df) | 4281.871 (740) | 1406.789 (623) | |
| CMIN/DF | CMIN/DF < 5.0 | 5.786 | 2.270 |
| CFI | >0.90 | 0.554 | 0.883 |
| TLI | >0.90 | 0.506 | 0.869 |
| RMSEA | 0.05–0.08 | 0.119 | 0.061 |
| AIC | Smaller value | 4521.871 | 1918.272 |
| ECVI | Indicate better fit | 13.300 | 5.642 |
| Factors | Composite Reliability (CR) | Average Variance Extracted (AVE) |
|---|---|---|
| State Anxiety | 0.732 | 0.223 |
| Trait Anxiety | 0.858 | 0.323 |
| State Anxiety Present | 0.888 | 0.447 |
| State Anxiety Absent | 0.945 | 0.633 |
| Trait Anxiety Present | 0.868 | 0.381 |
| Trait Anxiety Absent | 0.888 | 0.492 |
| CR | AVE | MSV | Max R(H) | State Anxiety Present | State Anxiety Absent | Trait Anxiety Present | Trait Anxiety Absent | |
|---|---|---|---|---|---|---|---|---|
| State Anxiety Present | 0.888 | 0.472 | 0.593 | 0.897 | 0.687 | |||
| State Anxiety Absent | 0.945 | 0.633 | 0.852 | 0.964 | −0.115 | 0.796 | ||
| Trait Anxiety Present | 0.874 | 0.410 | 0.593 | 0.971 | 0.770 | −0.008 | 0.640 | |
| Trait Anxiety Absent | 0.900 | 0.544 | 0.852 | 0.979 | −0.180 | 0.923 | −0.057 | 0.738 |
© 2018 by the authors. Licensee MDPI, Basel, Switzerland. This article is an open access article distributed under the terms and conditions of the Creative Commons Attribution (CC BY) license (http://creativecommons.org/licenses/by/4.0/).
Share and Cite
Bee Seok, C.; Abd Hamid, H.S.; Mutang, J.A.; Ismail, R. Psychometric Properties of the State-Trait Anxiety Inventory (Form Y) among Malaysian University Students. Sustainability 2018, 10, 3311. https://doi.org/10.3390/su10093311
Bee Seok C, Abd Hamid HS, Mutang JA, Ismail R. Psychometric Properties of the State-Trait Anxiety Inventory (Form Y) among Malaysian University Students. Sustainability. 2018; 10(9):3311. https://doi.org/10.3390/su10093311
Chicago/Turabian StyleBee Seok, Chua, Harris Shah Abd Hamid, Jasmine Adela Mutang, and Rosnah Ismail. 2018. "Psychometric Properties of the State-Trait Anxiety Inventory (Form Y) among Malaysian University Students" Sustainability 10, no. 9: 3311. https://doi.org/10.3390/su10093311
APA StyleBee Seok, C., Abd Hamid, H. S., Mutang, J. A., & Ismail, R. (2018). Psychometric Properties of the State-Trait Anxiety Inventory (Form Y) among Malaysian University Students. Sustainability, 10(9), 3311. https://doi.org/10.3390/su10093311