Abstract
In response to serious environmental and socio-cultural challenges brought about by fast urbanization, the concept of a sustainable city emphasizes the quality of life of urban residents, assuring the importance of parkland provision in urban development. Despite China’s fast urban expansion in recent decades, scant attention has been paid to the development pattern of urban parkland in China and its implications toward urban sustainability. Engaging official data from government sources, this study conducted a spatial-temporal analysis of urban parkland in China. Results support the overall fast increase of urban parkland provision in China with a clear regional disparity. Moreover, the shift of development momentum from the east to the west has been identified in the recent decade. The status of economic development, the progress of urbanization, and the level of urban development investments are identified as key influential factors influencing the temporal changes of urban parkland in China. With the increasing demand for urban parkland and its important role in ensuring urban sustainability, recommendations to improve urban park development in China are proposed, including integrating urban parkland in urban land use management with specific planning guidelines, establishing a dynamic urban parkland monitoring system, incorporating both national and regional policy frameworks catering for both national standards and regional preferences, and shifting urban development investments with more emphasis on urban maintenance expenditure.
1. Introduction
The global trend of fast urbanization has caused serious environmental, economic, cultural, and social challenges. A sustainable approach to urban development is thus critical to ensure sustainability in city life. It is strongly believed that the development of sustainable cities should incorporate the environmental, social, and cultural aspects of city life, in particular to enhance people’s satisfaction, experiences, and perceptions of the quality of their everyday environments [1,2]. A variety of frameworks have been developed over recent decades to assess the sustainability of cities, among which urban recreational land use is considered an important component [1,2].
Urban parks, as the most typical type of urban recreational land use, can be considered as spaces that offer a natural environment in an urban setting, wherein urban residents and tourists engage in socio-cultural and recreational activities [3,4,5]. As essential spaces that provide opportunities for public outdoor recreation [5,6], urban parks are of strategic importance for the quality of life and sustainability of our increasingly urbanized society [2,5,7,8,9,10,11,12,13]. The positive effects of urban recreational land use have been documented over the last two centuries [3,14]; they highlight how the sustainability of a city can be enhanced by providing significant environmental, socio-cultural, health, and economic services.
From an environmental perspective, urban parks contribute to enhancing human-nature relations through environmental conservation, air and water purification, wind and noise filtering, microclimate stabilization, wildlife habitat protection, and ecosystem maintenance [2,4,15,16,17,18]. In particular, different from urban green spaces, urban parks are also of crucial significance to the social resilience of cities because they generate spaces for social activities, strengthen urban residents’ place attachment, increase social integration and interaction among residents, promote the development of social ties, and enhance living satisfaction [3,4,19]. Research also illustrates that urban parks can provide psychological and physical health benefits—stress reduction [4,20,21], support of mental health [22], generating contemplativeness and a sense of peacefulness and tranquility [20]—that support city dwellers [8]. All these aspects significantly enhance the livability of modern cities and the well-being of residents in increasingly urbanized societies [2,4,23]. The economic services of urban parks did not initially appear to be important; however, the development of urban tourism highlighted the environmental, socio-cultural, and recreational values of urban parks. It helped improve the attractiveness and competitiveness of cities for both residents and prospective visitors, thus enhancing its economic contribution to urban development [2,4]. All of the above contributions are important for urban sustainability.
With increasing tourism and recreation influencing the trajectory of urban development and inducing evident changes in land use [24], urban parks have become an indispensable part of urban development and planning [14]. The amount of land earmarked for recreational and social use has exhibited continuous growth in recent decades, as citizens have become more aware of environmental issues and the rising need for urban recreational and social activities [7]. As a result, many authors have predicted that the recreational use of urban land will experience rapid expansion [24,25]. On the other hand, McPherson (2006) argued that urban parks could possibly be threatened by urban expansion, defined by the construction of new buildings and roads to accommodate the increasing urban population. Therefore, the status of urban recreational land, as represented by urban parks, can be complicated in the process of urbanization.
Due to the importance of urban parks, their critical role in city sustainability, and to facilitate an enhanced urban sustainability, research on the expansion trends of urban parkland is of vital importance. It helps identify practical implications of urban parkland development. In particular, such research is of great importance in developing countries that are undergoing dramatic social transformation and urbanization.
China has experienced rapid urbanization and industrialization in recent decades, resulting in fast expansion of urban land and largescale rural-urban population migration [26]. With more than 690.79 million people living in cities, urban dwellers now account for approximately 51.27% of China’s population, surpassing the number of rural dwellers for the first time in China’s history at the end of 2011 [27]. This major shift has placed tremendous demands on urban land use in China [28,29].
To accelerate urban economic growth, the Central Government has in recent decades been earmarking most of China’s resources to urban development projects. During this economic transition, massive amounts of rural land were converted for urban use [26,28,29,30,31,32]. On the other hand, with the increase in leisure time and disposable income in China, recreation and tourism needs have experienced a continuous increase. This transformation has spurred greater diversity in the use of urban land. Besides workplaces, transportation, infrastructure, and shopping spaces, cities now strive to provide open spaces, parks, and amenities in response to the increasing demand for social and recreational activities.
Due to concerns about the above-mentioned transformation, provision of urban parks to ensure sustainable development and quality of life in urban areas is critical. Previous research identified the regional disparity of urban recreational land development both at a national level [33] and at a municipal level, with case studies being conducted in Beijing [34] and Shenzhen [35]. The use of urban recreational spaces by seniors and other vulnerable groups have been measured [19,23] and the risk of social inequity, induced by the unequal provision of urban parks, has been discussed [33].
The growing literature on urban parks indicates the need to further examine urban parkland expansion in China. Such research is of critical importance in understanding the development pattern of urban parkland and its implications on sustainable urban development in China. However, current research in urban recreational land use in China is largely fragmented and focuses on small scale analysis.
In this context, using macro time series data, this study investigates the spatial-temporal evolution of urban parkland provision and discusses practical implications of urban park development on enhanced urban sustainability in China. Specific research goals include: (1) examination of the provision of urban parkland in China by measuring its scale, elasticity, intensity, and gradient level; (2) analyzing the factors influencing the spatial and temporal changes of urban parkland in China; (3) examining the spatial disparity features of urban parkland expansion across 31 provinces; and (4) discussing the practical implications of urban parkland development in China.
2. Methods and Materials
2.1. Data Sources
The national government open databases were used to acquire data to ensure consistency and compatibility. Databases used include “2016 Urban Development Statistical Yearbook” from the official website of Ministry of Housing and Urban-Rural Development of the People’s Republic of China (http://www.mohurd.gov.cn/) and the official website of National Bureau of Statistics of the People’s Republic of China (http://data.stats.gov.cn/easyquery.htm?cn=C01).
The selection of indicators was based on results and experiences from previous studies with consideration of data relevance and availability. Key indicators were selected including (1) urban population; (2) area of urban parkland and area of urban construction land, both of which are key indicators for urban land use; (3) GDP, urban maintenance expenditure, urban fixed assets investment as urban economic indicators; and (4) urban annual quantity of wastewater discharge as an urban environmental indicator.
It should be noted that the national level data of the above factors are available from 1981 to 2016. Therefore, national level data of all the above key indicators from 1981 to 2016 were used in the temporal analysis of national urban parkland expansion and the influencing factor analysis. However, as the provincial level data from the above data source are inconsistent and incomplete, the analysis of spatial expansion of urban parkland engages available provincial level data from 1999 to 2016 including urban parkland, urban construction land, and urban population. The study area covers 31 provinces and the urban areas of each province in 2016 are shown in Figure 1.
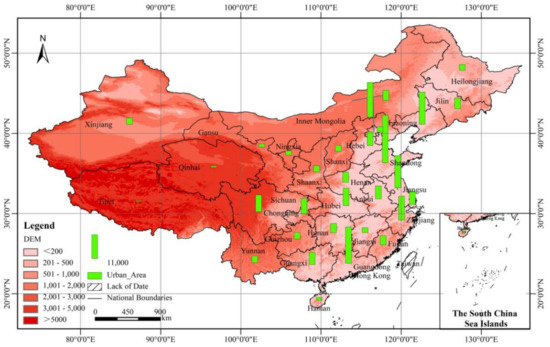
Figure 1.
Urban areas of 31 provinces of China in 2016.
2.2. Analyzing Methods and Indices
Temporal and spatial characteristics of urban parkland use were analyzed using key indices including the land use change dynamicity index (M), the elastic coefficient of land use change (E), and the land expansion intensity index (S). The study period was divided into three five-year stages (1999–2004, 2005–2010, 2011–2016) to explore in detail the trend of expansion.
In Equation (1), the land use change dynamicity index (M) has frequently been applied to evaluate the velocity of urban land use change [36] and landscape change [37,38]. It was used in this study to measure the expansion rate of urban parkland during the period 1999–2016 in China. The index can be calculated as follows:
M denotes the velocity of variation in urban parkland over the given period, and Ua and Ub represent the area of urban parkland (hm2) at the beginning (moment a) and at the end (moment b). Δt means the duration of a certain period.
In Equation (2), the elastic coefficient of land use change (E) is often used to describe the relationship between the land use change rate and the population change rate, which evaluates the coordination of changes in urban construction land with population growth. It was used in this study to measure the rationality of urban parkland use. The index can be formulated as follows:
Ei stands for the elasticity of urban parkland use, Mi denotes the land use change dynamicity during a special period (i), and Pi denotes the population change dynamicity during a special period (i).
In Equation (3), the land expansion intensity index (S) is used to analyze the change intensity of different regions of the country, reflecting the uneven spatial distribution of urban parkland.
Si stands for the expansion intensity of urban parkland use, Ai means the expansion area of “i” province in “t” period, and A means the total expansion area of the whole country in “t” period.
In Equation (4), the gradient of the land use expansion level index (T) is normally used to describe the gradient of urban construction land use change at different levels [34]. In this study, it was used to measure the gradient level of the urban parkland expansion rate in different regions in China.
Ti stands for the gradient level of the urban parkland expansion of “i” province, Xi denotes the annual expansion rate of “i” province, and X means the average annual expansion rate of the whole country. Here, in order to master the whole situation and position the local level, we divided the total situation of the whole country into four groups according to the value of T. Group 1 was named “fast growth group”, in which T > 2.0; Group 2 was named “middle growth group”, in which 1.0 < T ≤ 2.0; Group 3 was named “slow growth group”, in which 0.0 < T ≤ 1.0; Group 4 was named “negative growth group”, in which T ≤ 0.0.
Equation (5) is the regression model of the influence of park growth, yi is the independent variable, standing for the per capita parkland area of “i” year; a is the constant; bn is the regression coefficient; Xni is the argument vector, standing for “n” several specific independent variables “x” of “i” year, ε is the disturbance term.
It should be noted that the influencing factor analysis of urban parkland development was analyzed based on national level statistics of selected factors from 1981 to 2016. Correlation and regression analysis were engaged to explore the interrelations between urban parkland and overall economic and environmental situations. Meanwhile, restricted by the availability of the provincial level data, the analysis of spatial expansion of urban parkland engaged provincial level data only from 1999 to 2016, mainly including urban parkland, urban construction land, and urban population.
3. Findings
3.1. Temporal Expansion of Urban Parkland in China from 1981 to 2016
As illustrated in Table 1, with an overall increase over 27 times from 1981 to 2016, China has experienced a continuous growing trend of urban parkland. Despite the similarity in the total expansion rate and annual expansion rate between the period of 1981 to 1998 (423.35%, 24.90%) and 1999 to 2016 (440.44%, 25.91%), the later period exhibited a much higher contribution (84.48%) to the overall urban parkland expansion for the study period of 1981 to 2016, which might be caused by the fast urbanization since 2000 in China.

Table 1.
Temporal features of urban parkland expansion in China from 1981 to 2016.
To elaborate the change pattern from 1999 to 2016, this period was divided into three stages with a five-year interval. Both Phase 2 and Phase 3 exhibited the highest level of expansion areas and a contribution rate of more than 40%, indicating the national trend of fast urban parkland development in the recent 11 years (2005–2016).
As an important indicator of city sustainability and quality of life of city residents which could exclude regional population differences, per capita area of urban parkland was examined, demonstrating a rapid increase from 1.02 m2 per capita in 1981 to 10.34 m2 per capita in 2016, as shown in Figure 2. As indicated with the change pattern of the elastic coefficient (E)—an indicator of the correlation between the change rate of urban parkland and urban population—the increase rate of urban parkland was higher than that of urban population in most years of the study period, which indicates the enhanced capability of Chinese cities to satisfy the social and recreational demand of urban residents in the study area, which contributes to an enhanced urban sustainability.
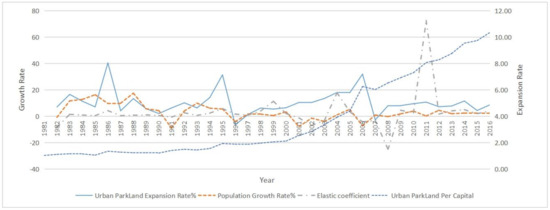
Figure 2.
The elastic coefficient (E) of urban parkland use in China from 1981 to 2016.
3.2. Comparison of Urban Parkland Expansion and Urban Construction Land Expansion from 1981 to 2016
Both urban parkland and urban construction land are important land use types in urban areas. Generally, urban construction land is used to measure the basic demand for work space and living space in cities and to monitor the expansion of the whole city. Urban parkland is related closely with the social, recreational, and environmental demands of citizens and the overall status of the urban ecosystem, which has a higher contribution to urban quality of life and sustainability. The change of relationship between urban construction land and parkland reflects the change in urban land use in response to the shift of demands of urban residents and requirements for urban sustainability. Therefore, the dynamicity index M value of urban parkland was calculated and compared with the dynamicity index of urban construction land.
As shown in Figure 3, the change pattern of the expansion rate of urban parkland was in line with that of urban construction land. However, the expansion rate of urban parkland was higher than that of urban construction land in most years during the period 1981–2016. It indicates that the provision of social and recreational spaces in Chinese cities increases faster than the provision of working or living spaces from 1981 to 2016, particularly for the period from 1999 to 2016. It infers that Chinese cities are shifting from mainly satisfying the basic working and living needs to creating a better living space for urban residents.
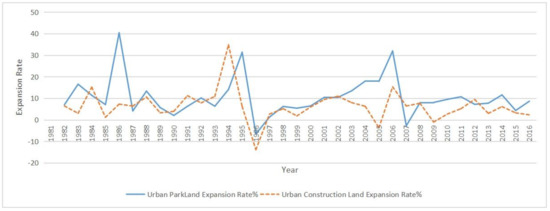
Figure 3.
The dynamicity index (M) of urban parkland (UPL) and urban construction land (UCL) in China from 1981 to 2016.
3.3. Influencing Factor Analysis of Urban Parkland Development in China from 1981 to 2016
It has been widely recognized that the growth of tourism and recreation, as reflected by land use for recreational and tourism purposes, has been closely related with economic development and environmental changes [24,33]. Further analysis was performed to understand factors influencing urban parkland development in China.
Drawing from previous studies, key indicators were selected including urban parkland, urban construction land, GDP, urban maintenance expenditure, urban fixed assets investment, and urban annual quantity of wastewater discharged. To better reflect the level of urban sustainability and excluding the influence of size of the city, per capita data was used in the correlation and regression analysis.
Correlation analysis was performed, as shown in Table 2, between per capita urban parkland (PC UPL) and factors as, per capita GDP (PC GDP), per capita urban construction land (PC UCL), per capita urban maintenance expenditure (PC UME), per capita urban fixed assets investment (PC UFAI), and per capita urban annual wastewater discharged (PC UAWD). As illustrated in Table 2, per capita urban parkland was positively correlated with per capita GDP, per capita urban construction land, per capita urban maintenance expenditure (PC UME), and per capita urban fixed assets investment (PC UFAI) at 0.01 level. However, the per capita urban annual wastewater discharge (PC UAWD) was not correlated, which was thus removed from the following regression analysis.
Table 2.
Correlation analysis between per capita (PC) urban parkland and other factors.
On the basis of the above correlation analysis, a regression model was constructed which took per capita urban parkland (PC UPL) as the independent variable and per capita urban construction land (PC UCL), per capita GDP (PC GDP), per capita urban maintenance expenditure (PC UME), and per capita urban fixed assets investment (PC UFAI) as dependent variables. In order to transform the relationship between the level of urban parkland development and other factors into a linear one, the logarithm of the following formula was taken:
According to the results of the regression analysis as shown in Table 3, the final influencing model is as the following:
Table 3.
Linear regression analysis of urban parkland expansion in China.
Results of the above regression analysis suggest that per capita urban parkland (PC UPL) was positively influenced by per capita urban construction land (PC UCL), per capita GDP (PC GDP), and per capita urban maintenance expenditure (PC UME). Meanwhile, per capita urban fixed assets investment (PC UFAI) had negative impacts on per capita urban parkland. The results support the casual relationship between economic development, level of urbanization, urban investment, and urban parkland expansion. However, the influence from urban environmental factors on urban parkland expansion, which was restricted by the availability of data, may need further analysis.
3.4. Spatial Expansion of Urban Parkland from 1999 to 2016
To explore the spatial features of urban parkland expansion, the total expansion intensity (S), total growth rate, and average growth rate of urban parkland from 1999 to 2016 at both the national and provincial levels were examined. At the national level, urban parkland shows a total growth of 339,726.25hm2 and an annual growth of approximately 21,232.89 hm2, as shown in Table 4, indicating the fast transition of urban land use from construction to recreation in Chinese cities.
Table 4.
Spatial changes of urban parkland expansion intensity and dynamicity in China in 1999–2016.
The provincial level examination demonstrates the unequal distribution of urban parkland expansion throughout the country. With respect to the expansion area and expansion intensity, eastern provinces ranked first, followed by central provinces and western provinces, as shown in Table 4, which is in line with the general level of regional economic development. Moreover, the Guangdong, Shandong, Beijing, Jiangsu, and Zhejiang provinces, most of which are located in the coastal region with relatively higher levels of economic development and urbanization, as shown in Table 4, rank as the top five provinces in terms of total expansion area. The five provinces, respectively, have expansion intensities of 19.03%, 9.37%, 7.72%, 7.08%, and 4.75%, indicating their important contributions to the expansion of China’s urban parkland from 1999 to 2016.
However, different from the trend of the expansion area and expansion intensity, western provinces have an expansion dynamicity of 30.10%, which exceed the central provinces. Moreover, Tibet (110.48%) and Chongqing (88.81%), both from the west of China, demonstrate the highest expansion dynamicity in China. The underlining reason may be their relatively slow urbanization with low levels of urban park development before the 1990s and the rapid urban expansion in the recent two decades, emphasizing the role of urban park development responding to the needs to enhance resident quality of life, urban ecosystems, and urban sustainability. As reported in Tibet Daily (2017) [39], Lhasa, the capital city of Tibet, aims to become an “eco-city” through achieving more than 8 square meters of urban parkland per resident by 2020 to further improve its urban environment, enhance resident quality of life, and ensure urban sustainability.
3.5. Integrated Spatial and Temporal Analysis of Urban Parkland Expansion from 1999 to 2016
An integrated approach was adopted from both spatial and temporal perspectives to explore regional differences in the speed and level of urban parkland expansion. A formulation was applied to calculate the “T” value of 31 provinces in three phases, which describe the gradient level of provincial level urban parkland expansion in comparison with the national average.
Thirty-one provinces were categorized into four groups. The rapid growth group includes provinces with an urban parkland expansion rate over 2 times the national average (T > 2.0); the moderate growth group includes provinces with an urban parkland expansion rate slightly higher than the national average (1.0 < T ≤ 2.0); the slow growth group includes provinces with an urban parkland expansion rate lower than national average (0.0 < T ≤ 1.0); the last group refers to provinces with negative growth of urban parkland (T ≤ 0.0). A strong expansion trend of urban parkland at the provincial level was identified in China from 1999 to 2016 with no province with negative growth in the last phase.
Meanwhile, Figure 4 presented a clear regional disparity with different expansion patterns of urban parkland among 31 provinces throughout the three phases. In particular, the 10 western provinces that used to be positioned at slow growth (4 provinces) and negative growth groups (2 provinces) in Phase 1, gradually moved to the rapid growth group (2 provinces) and moderate growth group (4 provinces). In contrast, urban parkland expansion slows down among eastern provinces, with most provinces moving from rapid and moderate growth groups to the slow growth group. It indicates the development momentum for urban parkland in China is shifting from the most developed eastern provinces to the least developed western provinces in the study period.
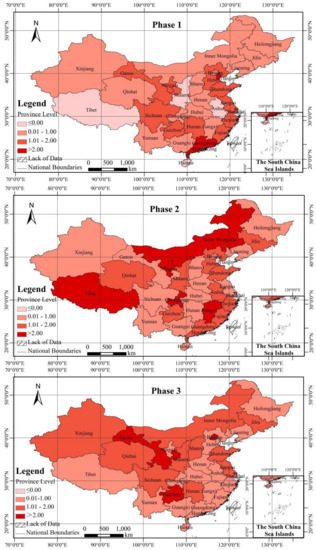
Figure 4.
Provincial level comparison of urban parkland expansion gradients in China throughout the three phases (1999–2004, 2005–2010, 2011–2016).
4. Discussions
In the global context of fast urbanization, cities are facing tremendous challenges with the growth of urban population and resource use, calling for a sustainable approach to urban development ensuring sustainability across the environmental, economic, social, and cultural aspects of city life. Urban parkland plays a crucial role in sustainable urban development and has the power to influence residents’ well-being and quality of life. However, studies of urban parklands or recreational lands are still limited in China and the trend of urban parkland expansion over the recent decades is still unclear. Engaging official statistics of both national and provincial levels, this study examined the recent urban parkland expansion in China from both temporal and spatial perspectives.
4.1. Substantial Growth of Urban Parkland Provision in China
Consistent with previous research [33,34,35], results indicate that urban parkland increases over 27 times, and per capita area of urban parkland also increases from 1.02 m2 per capita to 10.34 m2 per capita from 1981 to 2016. The substantial growth at a national scale indicates the rapid increase in urban recreational land use and a huge improvement in urban social and environmental conditions and citizen’s quality of life since 1981 in China. To further understand the influencing factors of the overall expansion trend of urban parkland in China from 1981 to 2016, correlation and regression analysis was performed. It was identified that urban parkland development is highly influenced by three key factors: the status of economic development as represented by regional GDP, the progress of urbanization as represented by the area of urban construction land, and the urban development investments represented by urban maintenance expenditure and urban fixed assets investment. Moreover, the identified spatial disparity of urban parkland development in China also reinforces the results from the influencing factors analysis, indicating the casual relationship between economic development status, level of urbanization, and urban parkland development.
4.2. Regional Disparity in Urban Parkland Provision in China
Despite the overall strong expansion of urban parkland in China, there is a clear regional disparity identified as a result of the regional disparity in economic and social development in China, which is largely caused by China’s development policies, geographic location, and historical and cultural conditions. In general, east provinces contributed 61.60% of expansion intensity followed by central provinces (22.10%) and west provinces (16.30%). Cities in eastern provinces, with higher levels of urbanization and economic development, have taken the lead in developing recreational opportunities to enhance the social and cultural welfare of its cities. However, the trend is picking up in central and western provinces in the recent five years. The regional disparity of urban parkland provision calls for different urban development strategies and policy preferences in the eastern, central, and western parts of China responding to different stages of development and needs for urban sustainability.
4.3. Shift of Focus on Sustainability in China’s Urban Development Process
With a total national growth of 339,726.25 hm2 and an annual growth of approximately 21,232.89 hm2 from 1981 to 2016, the spatial and temporal change of urban parkland reflects the increasing needs of social and recreational spaces in Chinese cities, with pressures from the increase in population and rapid urbanization and economic development. Providing more recreational space has already become an important concern in urban planning and development in China to enhance the sustainability of cities. The overall increasing urban parkland provision indicates the shifting momentum from economy-centered to people-centered in Chinese urban development during the study period, with more considerations on residents’ social and recreational needs and quality of life, and the socio-cultural and environmental sustainability of cities.
5. Recommendations and Future Research
With the identified temporal and spatial changes of urban parkland in China, the increasing demand for urban parkland and its important role in ensuring urban sustainability were supported. Recommendations to improve urban park development in China to facilitate an enhanced urban sustainability are now proposed.
First, the increase of overall urban parkland and per capita urban parkland from the national to provincial scale has indicated the increasing need in urban recreational land use in the context of sustainable urban development in China. However, current urban land use planning in China does not have specific regulations on urban parkland. Therefore, it is suggested that urban parkland should be formally integrated into urban land use management with specific planning guidelines to ensure its proper development. Moreover, an urban parkland use plan can be developed at national, provincial, and municipal levels to guide its fast development in China and urban parkland management offices can be established respectively to facilitate the implementation of such development plans.
Second, in response to the temporal change of urban parkland and the regional disparity, it is suggested to establish a dynamic urban parkland monitoring system at the national and provincial level with a range of indicators such as total expansion, per capita expansion, expansion intensity and dynamicity, to track changes in urban parkland in relation with the changes in urban population and urban construction land. The monitoring data will help identify key areas and regions for improvements and help understand causal relations between urban parkland and other factors in urban development. Thus, it will support policies and regulations to improve the accessibility and distribution of urban parkland at a national and regional scale. Moreover, to reduce the regional disparity and enhance regional equity, there is a need for a national level policymaking to regulate and standardize urban park planning and development, and facilitate experience sharing to transfer lessons and good practices between different regions.
Third, it is identified that urban development investments have substantial influence on parkland development. To enhance urban parkland development for improved resident satisfaction and urban sustainability, urban investments should leverage more on urban maintenance expenditure rather than urban fixed assets investment.
This study was developed on the analysis of available statistics at the national and provincial scale, which outlines the spatial and temporal development pattern of urban parkland in China and attempts to understand the causal relationships of these changes. However, due to the restrictions of environmental indicators (i.e., air quality, water quality etc.) and socio-cultural indicators (i.e., population structure, health concerns, environmental attitude etc.) at national and provincial scales, the interactive relationships between these factors and the expansion of urban parkland were not thoroughly explored in the study, indicating opportunities for future analysis at both temporal and spatial scales.
Moreover, governments, at national and provincial to local scales, are key drivers of urban park development through policymaking and advocacy. The role of governments in urban park development was not reflected in this study due to the lack of suitable indicators to represent the government role. Future studies could continue to explore the correlation between government policy and urban parkland expansion at national and provincial levels.
Author Contributions
Conceptualization, W.L. and M.S.; Data curation, W.L.; Formal analysis, W.L. and M.S.; Funding acquisition, W.L.; Methodology, W.L.; Writing—original draft, W.L.; Writing—review & editing, W.L. and M.S.
Funding
This research was supported by the Scientific Research Fund of Hunan Provincial Education Department: 15B148 and National Nature Science Foundation of China: 51578507.
Acknowledgments
The author would like to thank Master Candidate Cheng Zhong, Li Jiang, and Dongjie Li of Hunan Normal University for their help in data collection, reference consolidation, and map making.
Conflicts of Interest
The authors declare no conflict of interest.
References
- Yigitcanlar, T.; Dur, F.; Dizdaroglu, D. Towards prosperous sustainable cities: A multiscalar urban sustainability assessment approach. Habitat Int. 2015, 45, 36–46. [Google Scholar] [CrossRef]
- Chiesura, A. The role of urban parks for the sustainable city. Landsc. Urban Plann. 2004, 68, 129–138. [Google Scholar] [CrossRef]
- Campbell, L.K.; Svendsen, E.S.; Sonti, N.F.; Johnson, M.L. A social assessment of urban parkland: Analyzing park use and meaning to inform management and resilience planning. Environ. Sci. Pol. 2016, 62, 34–44. [Google Scholar] [CrossRef]
- Razak, M.A.W.A.; Othman, N.; Nazir, N.N.M. Connecting people with nature: Urban park and human well-being. Procedia Soc. Behav. Sci. 2016, 222, 476–484. [Google Scholar] [CrossRef]
- Solecki, W.D.; Welch, J.M. Urban parks: Green spaces or green walls? Landsc. Urban Plann. 1995, 32, 93–106. [Google Scholar] [CrossRef]
- Wilson, J.D.; Tierney, P.; Misook, K.; Zieff, S. Temporary parks? Sunday streets, serving the need for urban outdoor recreation. J. Park Recreat. Adm. 2012, 30, 38–52. [Google Scholar]
- Poudyal, N.C.; Hodges, D.G.; Merrett, C.D. A hedonic analysis of the demand for and benefits of urban recreation parks. Land Use Pol. 2009, 26, 975–983. [Google Scholar] [CrossRef]
- Baur, J.W.R.; Tynon, J.F. Urban nature parks and neighborhood social health in portland, oregon. J. Park Recreat. Adm. 2013, 31, 23–44. [Google Scholar]
- Hofmann, M.; Westermann, J.R.; Kowarik, I.; van der Meer, E. Perceptions of parks and urban derelict land by landscape planners and residents. Urban For. Urban Green. 2012, 11, 303–312. [Google Scholar] [CrossRef]
- Jabben, J.; Weber, M.; Verheijen, E. A framework for rating environmental value of urban parks. Sci. Total Environ. 2015, 508, 395–401. [Google Scholar] [CrossRef] [PubMed]
- Latinopoulos, D.; Mallios, Z.; Latinopoulos, P. Valuing the benefits of an urban park project: A contingent valuation study in thessaloniki, greece. Land Use Pol. 2016, 55, 130–141. [Google Scholar] [CrossRef]
- Shuib, K.B.; Hashim, H.; Nasir, N.A.M. Community participation strategies in planning for urban parks. Procedia Soc. Behav. Sci. 2015, 168, 311–320. [Google Scholar] [CrossRef]
- Tu, X.; Huang, G.; Wu, J. Contrary to common observations in the west, urban park access is only weakly related to neighborhood socioeconomic conditions in Beijing, China. Sustainability 2018, 10, 1115. [Google Scholar] [CrossRef]
- BenDor, T.; Westervelt, J.; Song, Y.; Sexton, J.O. Modeling park development through regional land use change simulation. Land Use Pol. 2013, 30, 1–12. [Google Scholar] [CrossRef]
- Tzoulas, K.; Korpela, K.; Venn, S.; Yli-Pelkonen, V.; Kaźmierczak, A.; Niemela, J.; James, P. Promoting ecosystem and human health in urban areas using green infrastructure: A literature review. Landsc. Urban Plan. 2007, 81, 167–178. [Google Scholar] [CrossRef]
- Nowak, D.J.; Mcpherson, E.G. Quantifying the impact of trees: The Chicago urban forest climate project. [French]. Unasylva 1993, 173, 39–44. [Google Scholar]
- Bai, T.; Mayer, A.; Shuster, W.; Tian, G. The hydrologic role of urban green space in mitigating flooding (Luohe, China). Sustainability 2018, 10, 3584. [Google Scholar] [CrossRef]
- Huang, M.; Cui, P.; He, X. Study of the cooling effects of urban green space in Harbin in terms of reducing the heat island effect. Sustainability 2018, 10, 1101. [Google Scholar] [CrossRef]
- Rahman, K.; Zhang, D. Analyzing the level of accessibility of public urban green spaces to different socially vulnerable groups of people. Sustainability 2018, 10, 3917. [Google Scholar] [CrossRef]
- Kaplan, R. The analysis of perception via preference: A strategy for studying how the environment is experienced. Landsc. Plann. 1985, 12, 161–176. [Google Scholar] [CrossRef]
- Ulrich, R.S. View through a window may influence recovery from surgery. Science 1984, 224, 420–421. [Google Scholar] [CrossRef] [PubMed]
- Hartig, T.; Mang, M.; Evans, G.W. Restorative effects of natural environment experiences. Environ. Behav. 1991, 23, 3–26. [Google Scholar] [CrossRef]
- Zhai, Y.; Li, K.; Liu, J. A conceptual guideline to age-friendly outdoor space development in china: How do Chinese seniors use the urban comprehensive park? A focus on time, place, and activities. Sustainability 2018, 10, 3678. [Google Scholar] [CrossRef]
- Williams, A.M.; Shaw, G. Future play: Tourism, recreation and land use. Land Use Pol. 2009, 26, S326–S335. [Google Scholar] [CrossRef]
- McMurry, K.C. The use of land for recreation. Ann. Assoc. Am. Geogr. 1930, 20, 7–20. [Google Scholar] [CrossRef]
- Liu, T.; Liu, H.; Qi, Y. Construction land expansion and cultivated land protection in urbanizing china: Insights from national land surveys, 1996–2006. Habitat Int. 2015, 46, 13–22. [Google Scholar] [CrossRef]
- Long, H. Land use policy in China: Introduction. Land Use Pol. 2014, 40, 1–5. [Google Scholar] [CrossRef]
- Cao, Y.; Bai, Z.; Zhou, W.; Ai, G. Gradient analysis of urban construction land expansion in the Chongqing urban area of china. J. Urban Plan. Dev. 2014, 141, 05014009. [Google Scholar] [CrossRef]
- Huang, Z.; Wei, Y.D.; He, C.; Li, H. Urban land expansion under economic transition in china: A multi-level modeling analysis. Habitat Int. 2015, 47, 69–82. [Google Scholar] [CrossRef]
- Gao, J.; Wei, Y.D.; Chen, W.; Chen, J. Economic transition and urban land expansion in provincial china. Habitat Int. 2014, 44, 461–473. [Google Scholar] [CrossRef]
- Liu, J.; Nijkamp, P.; Huang, X.; Lin, D. Urban livability and tourism development in china: Analysis of sustainable development by means of spatial panel data. Habitat Int. 2017, 68, 99–107. [Google Scholar] [CrossRef]
- Wang, Z.; Fang, C.; Zhang, X. Spatial expansion and potential of construction land use in the Yangtze River delta. J. Geogr. Sci. 2015, 25, 851–864. [Google Scholar] [CrossRef]
- Chen, W.Y.; Hu, F.Z.Y. Producing nature for public: Land-based urbanization and provision of public green spaces in China. Appl. Geogr. 2015, 58, 32–40. [Google Scholar] [CrossRef]
- Yao, L.; Liu, J.; Wang, R.; Yin, K.; Han, B. Effective green equivalent—A measure of public green spaces for cities. Ecol. Indic. 2014, 47, 123–127. [Google Scholar] [CrossRef]
- You, H. Characterizing the inequalities in urban public green space provision in Shenzhen, china. Habitat Int. 2016, 56, 176–180. [Google Scholar] [CrossRef]
- Liu, Y.; Luo, T.; Liu, Z.; Kong, X.; Li, J.; Tan, R. A comparative analysis of urban and rural construction land use change and driving forces: Implications for urban–rural coordination development in Wuhan, central China. Habitat Int. 2015, 47, 113–125. [Google Scholar] [CrossRef]
- Krajewski, P.; Solecka, I.; Barbara Mastalska, C. Landscape change index as a tool for spatial analysis. IOP Conf. Ser. Mater. Sci. Eng. 2017, 245, 072014. [Google Scholar] [CrossRef]
- Krajewski, P. Assessing change in a high-value landscape: Case study of the municipality of Sobotka, Poland. Pol. J. Environ. Stud. 2017, 26, 2603–2610. [Google Scholar] [CrossRef]
- Tibet Daily. Lhasa: Create an “Eco-City”. Available online: https://www.mdpi.com/journal/sustainability/instructions (accessed on 7 December 2017).


© 2018 by the authors. Licensee MDPI, Basel, Switzerland. This article is an open access article distributed under the terms and conditions of the Creative Commons Attribution (CC BY) license (http://creativecommons.org/licenses/by/4.0/).