Adopting an Ecosystem Services-Based Approach for Flood Resilient Strategies: The Case of Rocinha Favela (Brazil)


Abstract
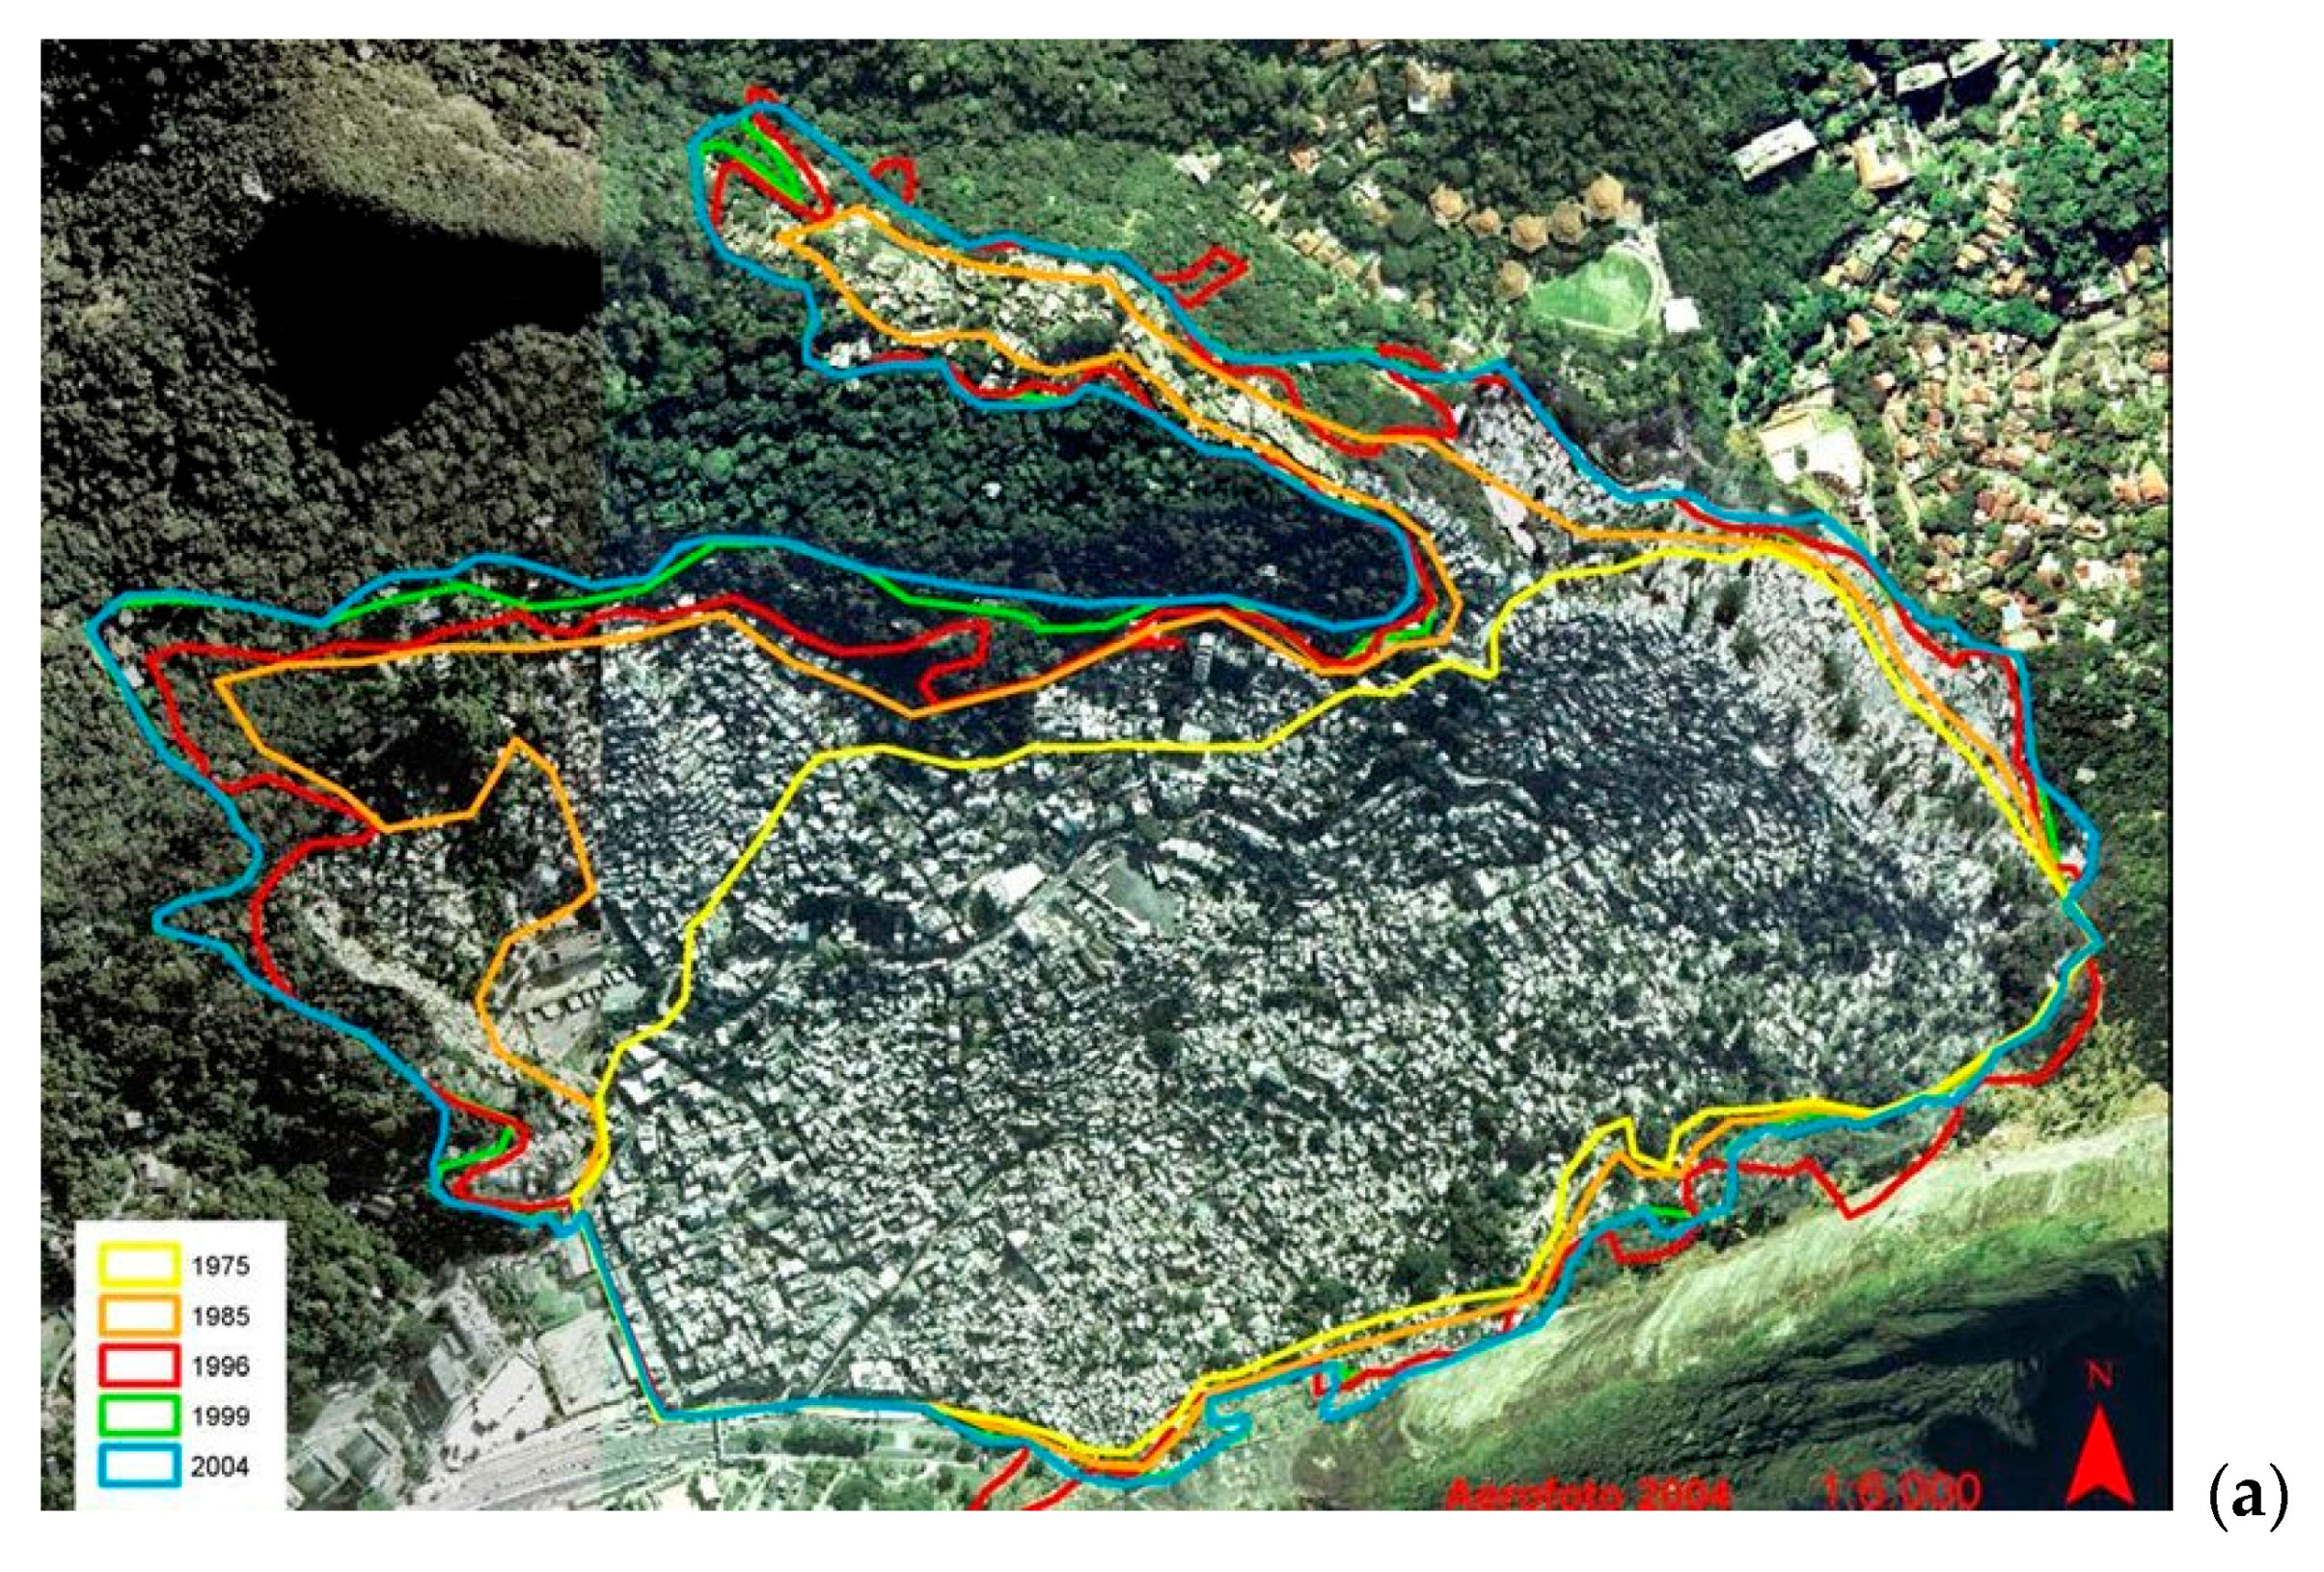
:1. Introduction
2. Materials and Methods
- A DEM specifically designed for this research, considering the isolines provided by Universidade Federal do Rio de Janeiro (only for the Rocinha area), the DEM developed by the United States Geological Survey (https://earthexplorer.usgs.gov/), and geological and geomorphological data provided by the Instituto Brasileiro de Geografia e Estatística (http://downloads.ibge.gov.br/downloads_geociencias.htm). Given the complexity of interpolation processing for DEM generation and a lack of detailed data, mapping did not extend to the entire metropolitan area of Rio de Janeiro but instead focused on Rocinha, while including the surrounding area with significant slopes and changes of elevation. DEM resolution was set at 5 × 5 m cells, within the range of between 4 and 10 m suggested by Salata et al. as the optimal resolution for model performance [24].
- The depth of root-restricting layers to estimate the amount of soil that is amenable to root plants in view of their significant flood mitigation capacity. These data were derived from information on soil textures in the “Mapa de solos do estado do Rio de Janeiro” available on the EMBRAPA website of the Ministry of Agriculture, Livestock and Food Supply (https://www.embrapa.br/) and data published by the Brazilian Institute of Geography and Statistics (https://www.ibge.gov.br/). Information on the root-restricting layer depth was also estimated using theoretical data [25,26].
- Data on average annual precipitation for each cell, collected from the Brazilian Institute of Geography and Statistics (available at https://www.ibge.gov.br/).
- Plant-available water content (PAWC) as an indicator of the ability of soil to retain water and make it sufficiently available for use by plants. It strongly affects the runoff process, given that plants typically respond to flooding by rooting [27]. As suggested by the InVEST User’s Guide, PAWC was calculated using SPAW (Soil-Plant-Air-Water) software developed by the National Agricultural Library of the United States Department of Agriculture (Washington, DC, USA) in cooperation with the Washington State University (http://hydrolab.arsusda.gov/SPAW/Index.htm). The SPAW model predicts the hydraulic performance of LULC considering a one-dimensional water budget based on daily time intervals [28]. The model is commonly used to simulate major components in the water budget such as runoff, infiltration or evapotranspiration.
- Average annual potential evapotranspiration as a fundamental component of the hydrologic budget including both soil and grass transpiration. As recommended by the InVEST User’s Guide, evapotranspiration was determined with reference to scientific data [29] and subsequently compared with the Penman-Monteith method as described in Irrigation and Drainage Paper No. 56 published by the Food and Agriculture Organisation using data from the Climatic Research Unit [30].
- Land use/land cover (LULC). The capacity of an ecosystem to provide services is closely related to LULC quality and biophysical conditions [31]. LULC is a key measure for linking human and natural systems for environmental management [32,33] and for spatial planning processes aimed at increasing sustainability. The LULC layer was created painstakingly, given the paucity of reliable, detailed data from different databases as defined by Arcidiacono et al. [21];
- Watersheds and sub-watersheds, cartographically identified in the “Mapa das Bacias e Sub-bacias Hidrográficas do Município do Rio de Janeiro—2004” (www.data.rio).
- Biophysical tables containing the nutrient loading and removal allocations (nitrogen and phosphorus) for each LULC class. Considering the lack of data for Rocinha area, nutrient data were derived according to the scientific documentation suggested by the InVEST User’s Guide [29,30,34,35,36] (See Table A1). These data were also used to estimate nutrient retention.
3. Results
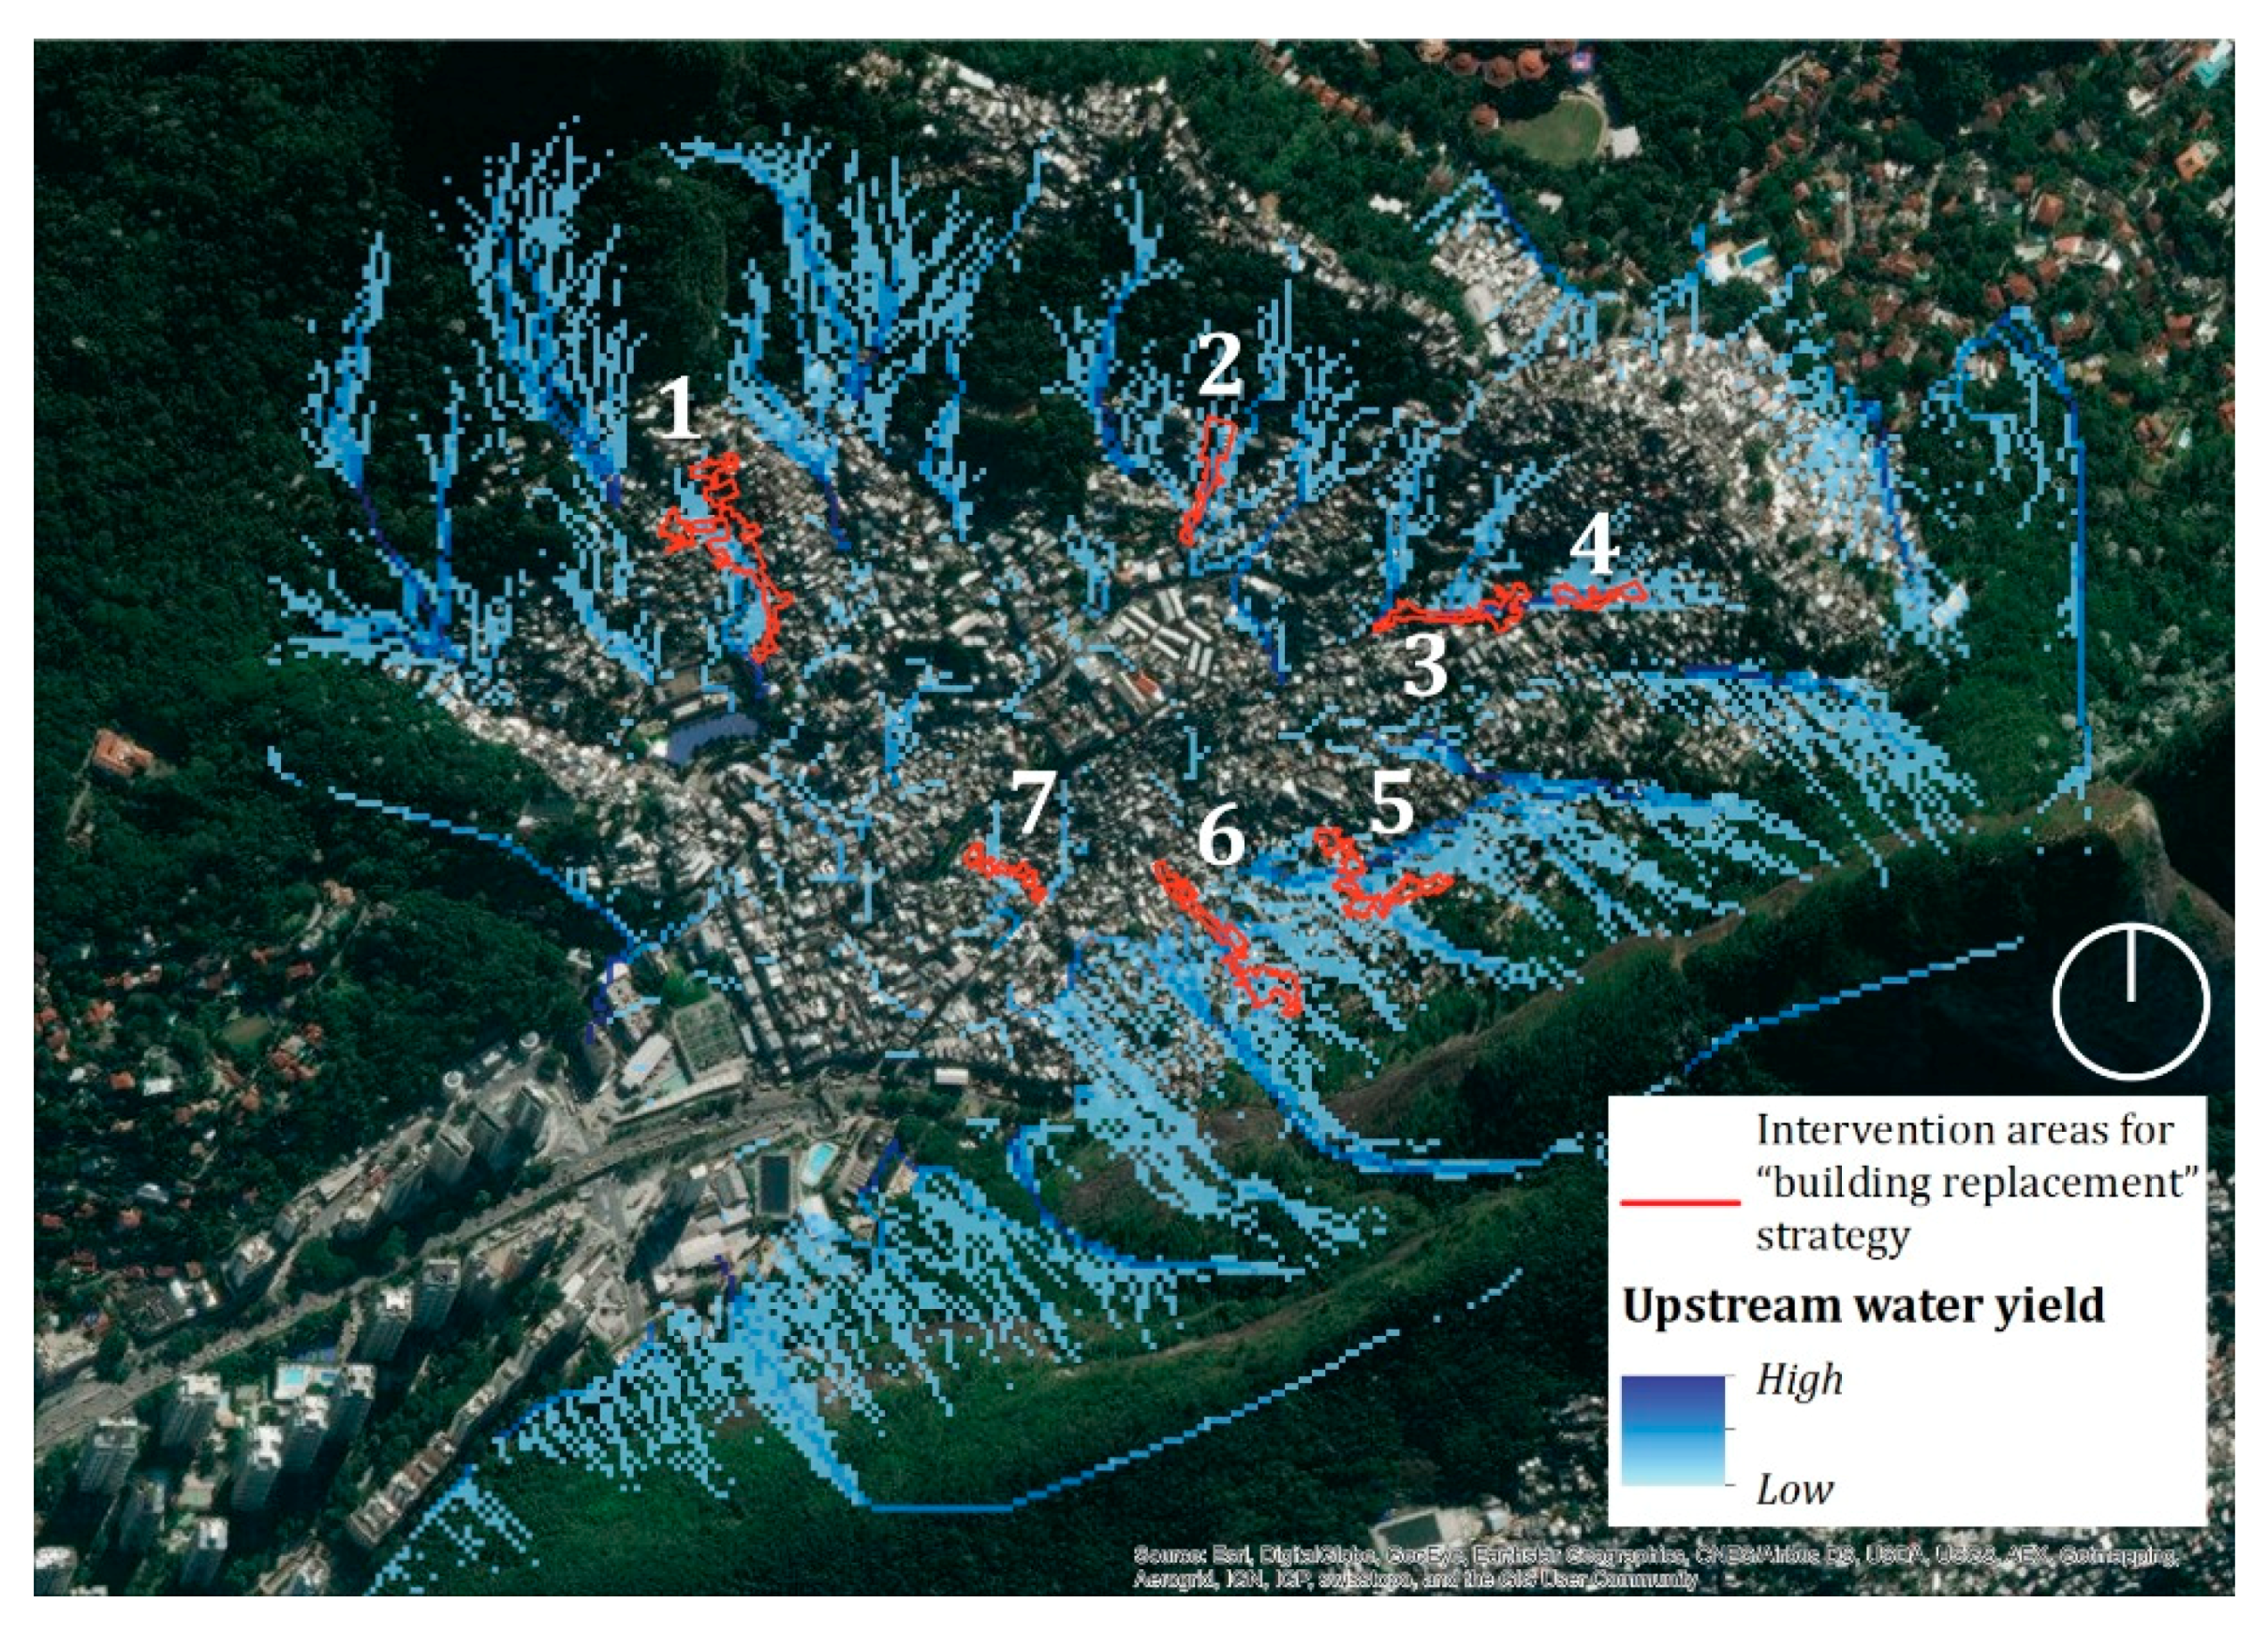
- Green roofs. These are roofs covered with vegetation placed over waterproofing material with drainage and irrigation systems. They can provide a range of ecosystem services, hence contributing to human well-being. Green roofs can improve rainwater drainage, thereby mitigating erosion, and also help purify groundwater by acting as a filter. They are a source of biodiversity, offering habitats for wildlife such as butterflies, bees and worms, while acting as a “stepping stone” for birds. They also absorb ultraviolet rays and improve building insulation by cooling buildings during the summer, while during the rainy season the vegetation coverage absorbs water, taking the pressure off building drainage systems. Finally, green roofs help trap atmospheric pollutants by absorbing carbon dioxide and sulphur dioxide. The Green My Favela project (http://www.greenmyfavela.org/) was set up to reclaim degraded land and create more productive green spaces inside favelas and involved several favelas across Brazil, including Rocinha [38].
- Green permeable paving consists of pre-cast blocks made of concrete or hard plastic with voids created by styrene void formers. Such modular systems reduce sub-base depths, eliminate kerb edges, can withstand gross vehicle weights of over 40 tonnes and optimise drainage capacity, and have already been applied in different favelas (e.g., the Guarapiranga basin, Brazil) where impermeable surfaces (asphalt) have been replaced with concrete blocks. The blocks have also been used in rural areas to create paths in unpaved areas. Permeable paving is connected with the strategy of demolishing buildings.
4. Discussion
5. Conclusions
Author Contributions
Funding
Acknowledgments
Conflicts of Interest
Appendix A

| LULC_code | Root_depth | Kc | load_n | load_p | eff_n | eff_p |
|---|---|---|---|---|---|---|
| 1111 | 1 | 0.156122052 | 0 | 0 | 0 | 0 |
| 111 | 1 | 0.224183527 | 0 | 0 | 0 | 0 |
| 112 | 1 | 0.287409281 | 0 | 0 | 0 | 0 |
| 121 | 1 | 0.108610855 | 0 | 0 | 0 | 0 |
| 122 | 1 | 0.261009662 | 0 | 0 | 0 | 0 |
| 123 | 1 | 0.108610855 | 0 | 0 | 0 | 0 |
| 124 | 1 | 0.108610855 | 0 | 0 | 0 | 0 |
| 131 | 1 | 0.100072785 | 0 | 0 | 0 | 0 |
| 141 | 550 | 0.522455436 | 0 | 0 | 0.6 | 0.6 |
| 142 | 1 | 0.537704119 | 0 | 0 | 0 | 0 |
| 211 | 675 | 0.483 | 210 | 80 | 0.4 | 0.4 |
| 212 | 800 | 0.616 | 275 | 100 | 0.4 | 0.4 |
| 221 | 1500 | 0.4 | 76 | 44 | 0.4 | 0.4 |
| 222 | 1200 | 0.75 | 85 | 55 | 0.4 | 0.4 |
| 231 | 550 | 0.72 | 0 | 0 | 0.6 | 0.6 |
| 241 | 800 | 0.72 | 30 | 90 | 0.4 | 0.4 |
| 2440 | 800 | 0.72 | 30 | 90 | 0.4 | 0.4 |
| 311 | 1500 | 0.7 | 0 | 0 | 0.8 | 0.8 |
| 321 | 550 | 0.72 | 0 | 0 | 0.6 | 0.6 |
| 322 | 550 | 0.72 | 0 | 0 | 0.6 | 0.6 |
| 324 | 550 | 0.72 | 0 | 0 | 0.6 | 0.6 |
| 330 | 1 | 0 | 0 | 0 | 0.6 | 0.6 |
| 331 | 1 | 0 | 0 | 0 | 0.6 | 0.6 |
| 332 | 1 | 0 | 0 | 0 | 0.6 | 0.6 |
| 410 | 0 | 0 | 0 | 0 | 0 | 0 |
| 411 | 0 | 0 | 0 | 0 | 0 | 0 |
| 511 | 0 | 0 | 0 | 0 | 0 | 0 |
| 512 | 0 | 0 | 0 | 0 | 0 | 0 |
| 523 | 0 | 0 | 0 | 0 | 0 | 0 |
References
- Lange, W.; Sandholz, S.; Nehren, U. Strengthening Urban Resilience through Nature: The Potential of Ecosystem-Based Measures for Reduction of Landslide Risk in Rio de Janeiro; Working Paper WP18WL1; Lincoln Institute of Land Policy: Cambridge, MA, USA, 2018. [Google Scholar] [CrossRef]
- de Assis Dias, M.C.; Saito, S.M.; dos Santos Alvalá, R.C.; Stenner, C.; Pinho, G.; Nobre, C.A.; de Souza Fonseca, M.R.; Santos, C.; Amadeu, P.; Silva, D.; et al. Estimation of exposed population to landslides and floods risk areas in Brazil, on an intra-urban scale. Int. J. Disaster Risk Reduct. 2018, 31, 449–459. [Google Scholar] [CrossRef]
- Istituto Moreira Salles Memoria Rocinha. Available online: http://memoriarocinha.com.br/en/linha-do-tempo/ (accessed on 20 June 2018).
- Jones, J.A.A. Water Sustainability: A Global Perspective; Hodder Education; Taylor & Francis Ltd.: London, UK, 2010; ISBN 9781444104882. [Google Scholar]
- de Groot, R.; Wilson, M.A.; Boumans, R.M.J. A typology for the classification, description and valuation of ecosystem functions, goods and services. Ecol. Econ. 2002, 41, 393–408. [Google Scholar] [CrossRef] [Green Version]
- Alcamo, J.; Hassan, R. Ecosystems and Human Well-Being. A Framework for Assessment; Island Press: Washington, DC, USA, 2003; Volume 5, ISBN 1559634022. [Google Scholar]
- TEEB. The Economics of Ecosystems and Biodiversity for National and International Policy Makers—Summary: Responding to the Value of Nature; TEEB: Geneva, Switzerland, 2009. [Google Scholar]
- McPhearson, T.; Andersson, E.; Elmqvist, T.; Frantzeskaki, N. Resilience of and through urban ecosystem services. Ecosyst. Serv. 2015, 12. [Google Scholar] [CrossRef]
- Frantzeskaki, N.; Tilie, N. The dynamics of Urban ecosystem governance in Rotterdam, the Netherlands. Ambio 2014, 43, 542–555. [Google Scholar] [CrossRef] [PubMed]
- Andersson, E.; Tengö, M.; McPhearson, T.; Kremer, P. Cultural ecosystem services as a gateway for improving urban sustainability. Ecosyst. Serv. 2015, 12, 165–168. [Google Scholar] [CrossRef]
- Nehren, U.; Sudmeier-Rieux, K.; Sandholz, S.; Estrella, M.; Lomarda, M.; Guillén, T. The Ecosystem-Based Disaster Risk Reduction: Case Study and Exercise Source Book; Partnership for Environment and Disaster Risk Reduction and Center for Natural Resources and Development: Geneve, Switzerland; Cologne, Germany, 2014; ISBN 978-3-00-045844-6. [Google Scholar]
- European Commission. A Framework Strategy for a Resilient Energy Union with a Forward-Looking Climate Change Policy; European Commission: Brussels, Belgium, 2015; pp. 1–21. [Google Scholar] [CrossRef]
- Potschin, M.; Kretsch, C.; Haines-Young, R.; Furman, E.; Berry, P.; Baró, F. Nature-based solutions. In OpenNESS Ecosystem Service Reference Book; Potschin, M., Jax, K., Eds.; EC FP7 Grant Agreement No. 308428; 2015; Available online: www.openness-project.eu/library/reference-book (accessed on 18 December 2018).
- European Commission. Towards an EU Research and Innovation Policy Agenda for Nature-Based Solutions & Re-Naturing Cities; European Commission: Brussels, Belgium, 2015; ISBN 978-92-79-46051-7. [Google Scholar]
- The World Bank. Implementing Nature—Based Flood Protection: Principles and Implementation Guidance; The World Bank: Washington, DC, USA, 2017; pp. 7–31. [Google Scholar]
- Grizzetti, B.; Lanzanova, D.; Liquete, C.; Reynaud, A.; Cardoso, A.C. Assessing water ecosystem services for water resource management. Environ. Sci. Policy 2016, 61, 194–203. [Google Scholar] [CrossRef]
- IBGE—Instituto Brasileiro de Geografi a e Estatística Mostra a Nova Dinâmica da Rede Urbana Brasileira. Available online: http://www.ibge.gov.br (accessed on 7 June 2017).
- Rekow, L. Fighting insecurity: Experiments in urban agriculture in the favelas of Rio de Janeiro. Field Actions Sci. Rep. 2015, 8, 1–8. [Google Scholar]
- Bosselmann, P. Urban Transformation. Understanding City form and Design; Island Press: Washington, DC, USA, 2009. [Google Scholar]
- Carmona, M.; Tiesdell, S.; Heath, T.; Oc, T. Public Plance Urban Space; Architectural Press Elsevier: Oxford, UK, 2003. [Google Scholar]
- Arcidiacono, A.; Causone, F.; Grosso, M.; Masera, G.; Tadi, M.; Zadeh, H.M. Environmental Performance and Social Inclusion: A Project for the Rocinha Favela in Rio de Janeiro. Energy Procedia 2017, 134, 356–365. [Google Scholar] [CrossRef]
- Gómez-Baggethun, E.; Kelemen, E.; Martín-López, B.; Palomo, I.; Montes, C. Scale Misfit in Ecosystem Service Governance as a Source of Environmental Conflict. Soc. Nat. Resour. 2013, 26, 1202–1216. [Google Scholar] [CrossRef]
- UN Habitat. Enhancing Urban Safety: Global Report of Human Settlements; United Nations Human Settlement Program: Nairobi, Kenya, 2007. [Google Scholar]
- Salata, S.; Garnero, G.; Barbieri, C.; Giaimo, C. The Integration of Ecosystem Services in Planning: An Evaluation of the Nutrient Retention Model Using InVEST Software. Land 2017, 6, 48. [Google Scholar] [CrossRef]
- Scott, K.; Pain, C. Regolith Science; Springer: Dordrecht, The Netherlands, 2009; ISBN 978-1-4020-8859-9. [Google Scholar]
- Fitzpatrick, R.; McKenzie, N.; Maschmedt, D. Soil morphological indicators and their importance to soil fertility. In Soil Analysis: An Interpretation Manual; CSIRO Publishing: Melbourne, Australia, 1999; pp. 55–69. [Google Scholar]
- Naidoo, G.; Mundree, S.G. Oecologia. Oecologia 1993, 93, 360–366. [Google Scholar] [CrossRef] [PubMed]
- Saxton, K.E. Soil water hydrology: Simulation for water balance computations. New Approaches Water Balanc. Comput. 1983, 47–60. [Google Scholar] [CrossRef]
- Droogers, P.; Allen, R.G. Estimating reference evapotranspiration under. Irrig. Drain. Syst. 2002, 16, 33–45. [Google Scholar] [CrossRef]
- Allen, R.G.; Pereira, L.S.; Raes, D.; Smith, M. Crop Evapotranspiration. Irrig. Drain. 1998, 300, 300. [Google Scholar] [CrossRef]
- Burkhard, B.; Kroll, F.; Nedkov, S.; Müller, F. Mapping ecosystem service supply, demand and budgets. Ecol. Indic. 2012, 21, 17–29. [Google Scholar] [CrossRef]
- Balmford, A.; Beresford, J.; Green, J.; Naidoo, R.; Walpole, M.; Manica, A. A global perspective on trends in nature-based tourism. PLoS Biol. 2009, 7, 1–6. [Google Scholar] [CrossRef] [PubMed]
- Arcidiacono, A.; Ronchi, S.; Salata, S. Ecosystem Services assessment using InVEST as a tool to support decision making process: Critical issues and opportunities. In Computational Science and Its Applications -ICCSA 2015; Springer: Cham, Switzerland, 2015; pp. 35–49. ISBN 978-3-319-21406-1. [Google Scholar]
- Reckhow, K.H.; Beaulac, M.N.; Simpson, J.T. Modeling phosphorus loading response under uncertain. A manual and compilation of export coefficients. Water Resour. Res. 1980, 30, 214. [Google Scholar]
- Haycock, N.; Burt, T.; Goulding, K.; Pinay, G. Buffer Zones: Their Processes and Potential in Water Protection; Haycock Associated Limited: Otley, UK, 1996; ISBN 0 9530051 0 0. [Google Scholar]
- White, M.J.; Arnold, J.G. Development of a simplistic vegetative filter strip model for sediment and nutrient retention at the field scale. Hydrol. Process. 2009, 23, 1602–1616. [Google Scholar] [CrossRef]
- Tallis, H.T.; Ricketts, T.; Guerry, A.D.; Wood, S.A.; Sharp, R.; Nelson, E.; Ennaanay, D.; Wolny, S.; Olwero, N.; Vigerstol, K.; et al. VEST 2.0 Beta User’s Guide. 2011. Available online: https://unstats.un.org/unsd/envaccounting/seeaRev/meeting2013/EG13-BG-4.pdf (accessed on 18 December 2018).
- Rekow, L. Green My Favela: An Act of Defiance. Int. J. Educ. Art 2012, 8, 305–319. [Google Scholar] [CrossRef]
- Farah Nagati, L.; De Assis Lefèvre, J.E. Urbanização de Favela na Bacia da Guarapiranga. Available online: http://www.temafavela.com.br/site/tfg-lilian/ (accessed on 9 May 2017).
- European Commission. Building a Green Infrastructure for Europe; Publications Office of the European Union: Luxembourg, 2013; ISBN 9789279334283. [Google Scholar]


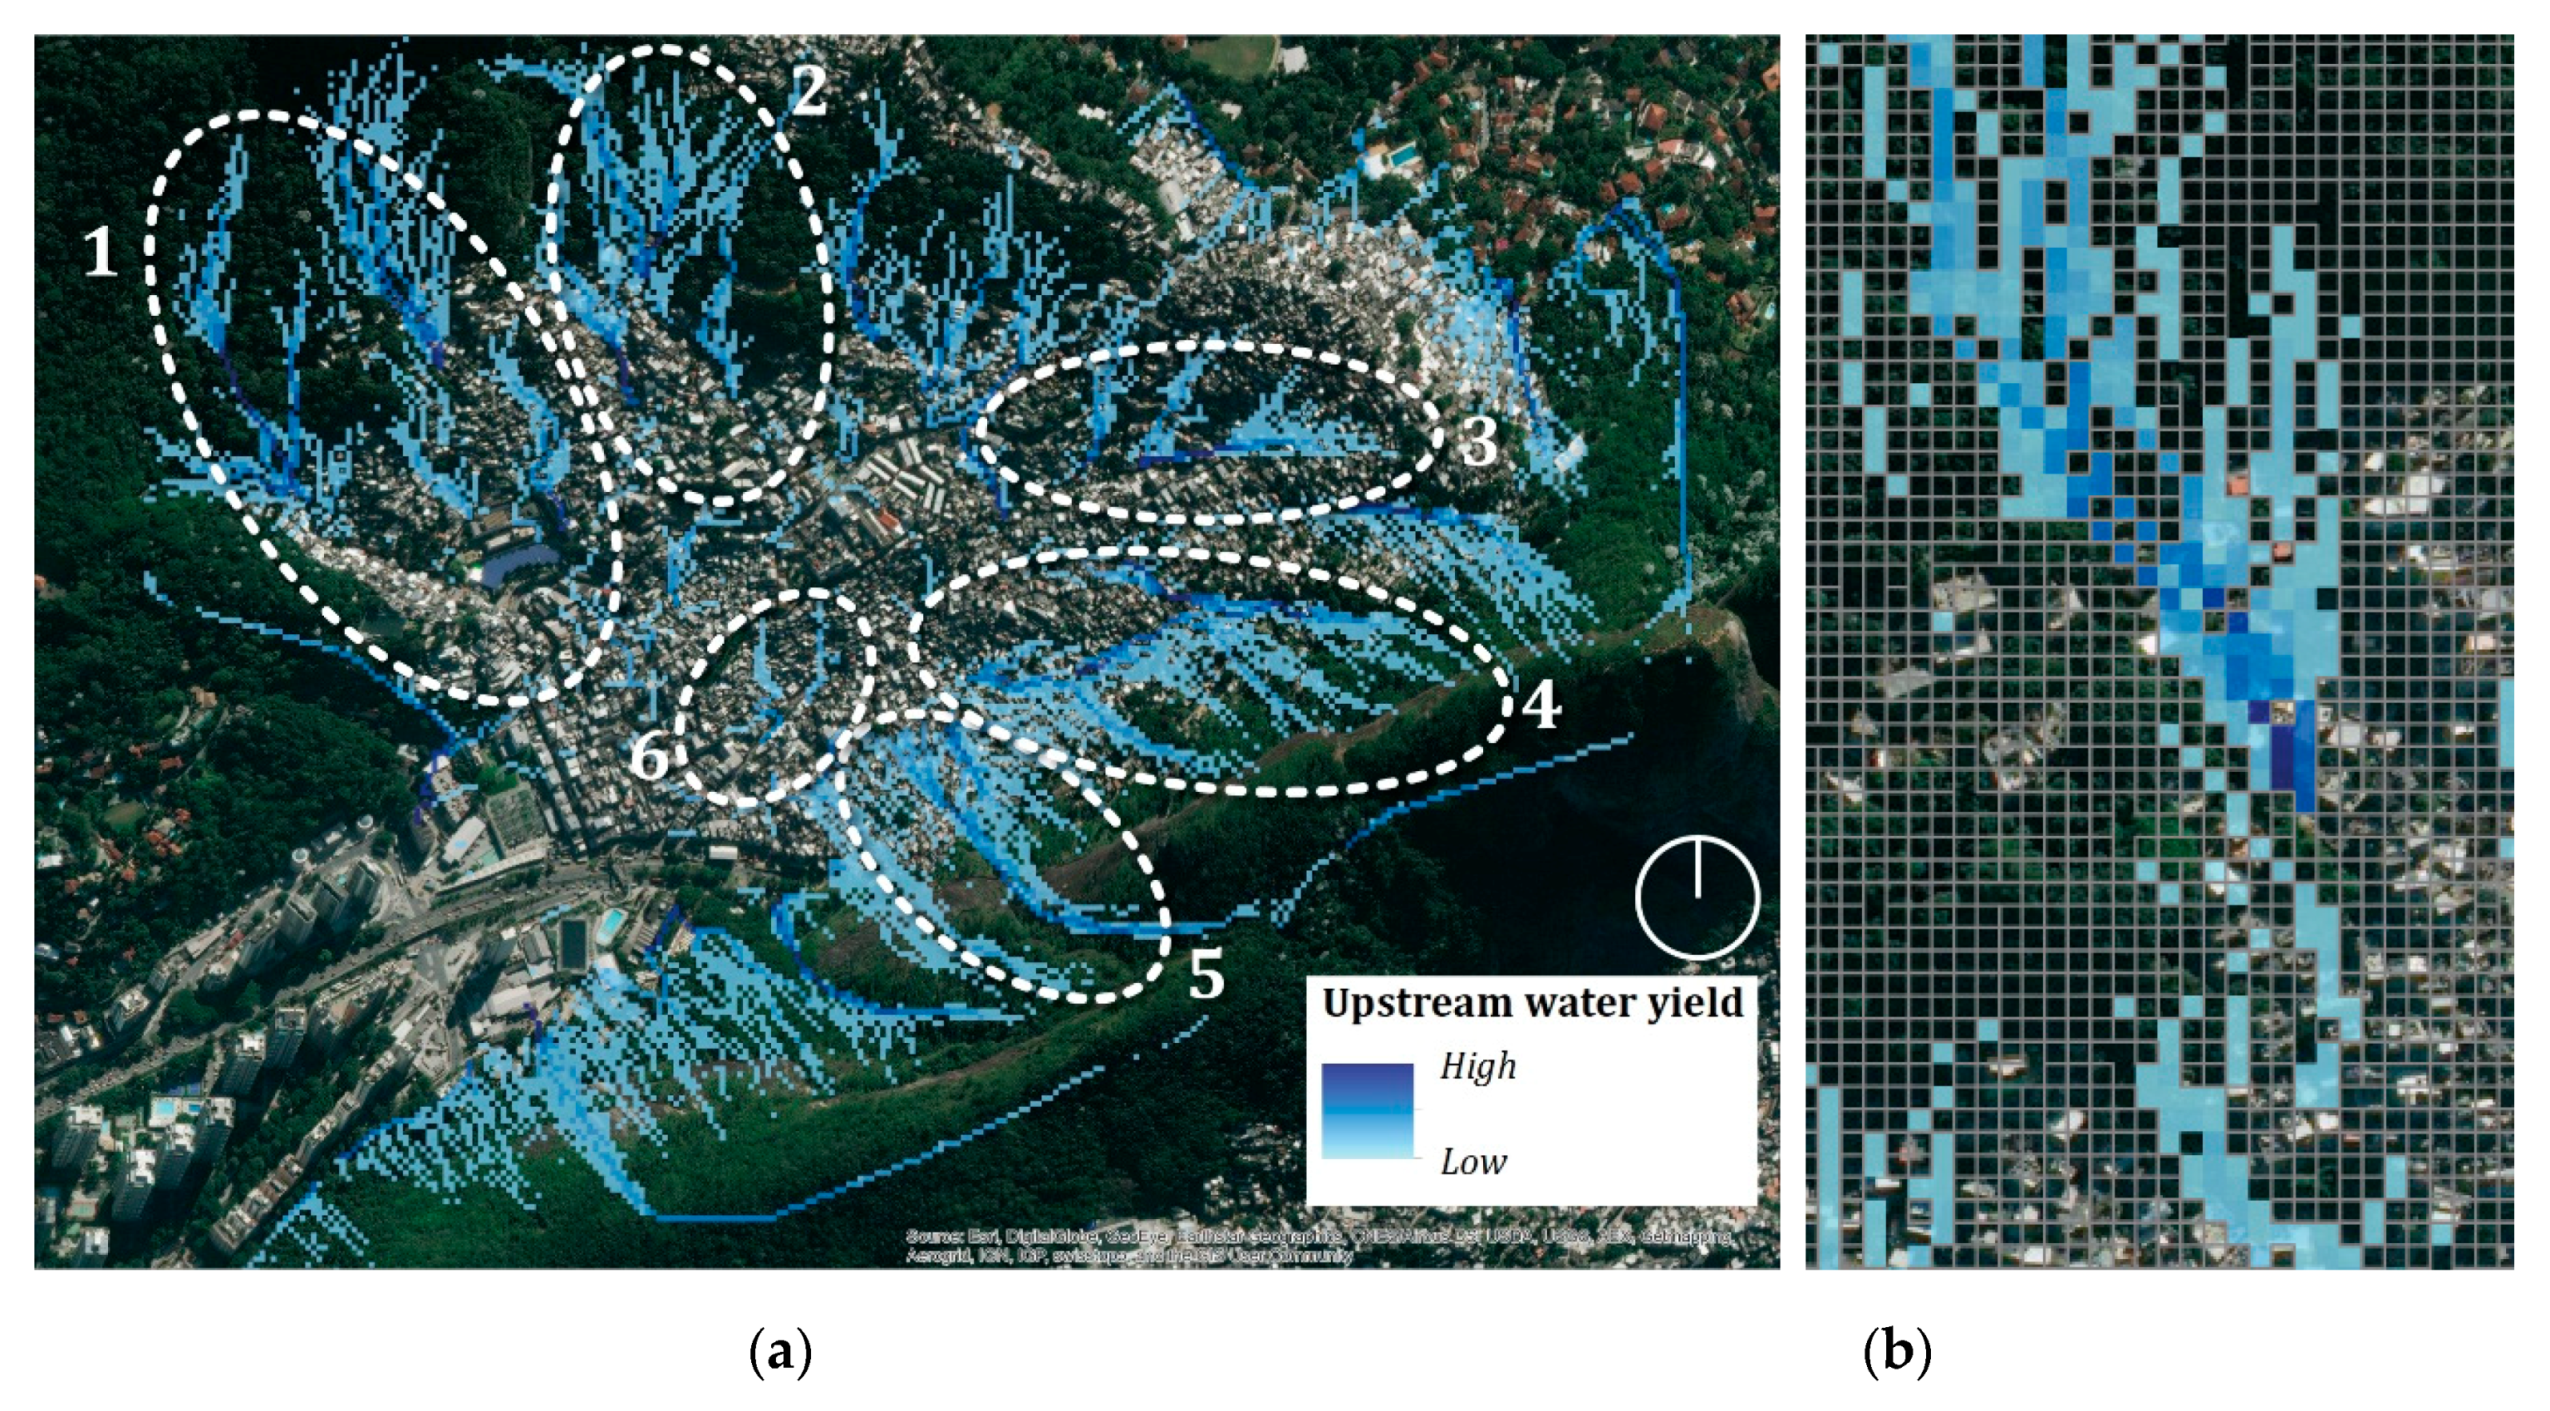


| Upstream Water in the Catchment Area | Quantity of Water Stored (Litres/Catchment Area) |
|---|---|
| 1 | 241,847.91 |
| 2 | 155,040.26 |
| 3 | 141,105.44 |
| 4 | 293,899.35 |
| 5 | 22,260.31 |
| 6 | 204,123.52 |
© 2018 by the authors. Licensee MDPI, Basel, Switzerland. This article is an open access article distributed under the terms and conditions of the Creative Commons Attribution (CC BY) license (http://creativecommons.org/licenses/by/4.0/).
Share and Cite
Ronchi, S.; Arcidiacono, A. Adopting an Ecosystem Services-Based Approach for Flood Resilient Strategies: The Case of Rocinha Favela (Brazil). Sustainability 2019, 11, 4. https://doi.org/10.3390/su11010004
Ronchi S, Arcidiacono A. Adopting an Ecosystem Services-Based Approach for Flood Resilient Strategies: The Case of Rocinha Favela (Brazil). Sustainability. 2019; 11(1):4. https://doi.org/10.3390/su11010004
Chicago/Turabian StyleRonchi, Silvia, and Andrea Arcidiacono. 2019. "Adopting an Ecosystem Services-Based Approach for Flood Resilient Strategies: The Case of Rocinha Favela (Brazil)" Sustainability 11, no. 1: 4. https://doi.org/10.3390/su11010004