Abstract
This study examines the relationship between street-level urban design perceptual qualities and walking behavior in the City of Dallas. While the city has the potential to experience growth in pedestrian activities, it exhibits a very low level of walking activity, placing it as one of the least walkable cities in the nation. To assess the impact of urban design qualities on walkability, we collected data on 23 features related to urban design, 11 built environment variables characterized as D variables comprising diversity, density, design, distance to transit, and destination accessibility. The sample included 402 street block faces in Dallas Downtown Improvement District. Accounting for spatial autocorrelation, we found that two urban design qualities, among five, including image-ability—such as a memorable quality of a place, and transparency—as to what degree people can see beyond the street’s edge—significantly influence pedestrian volume in downtown streets. These findings are in agreement with the two previous studies that used the same methodology in different cities (New York City, NYC and Salt Lake City, UT). According to the findings of these three studies, the other urban design qualities including human scale, complexity, as well as enclosure, are not playing a significant role in walkability, despite the theoretical justification and the extensive operationalization efforts. The findings of this study draw policy makers’ attention to creating more appealing and walkable places through the implementation of these urban design qualities.
1. Introduction
Walking has been proved by previous studies to bring significant social, economic, environmental, and public health benefits to the society [1,2,3]. Walkability is associated with reduction of ecological footprint, energy consumption, and car dependency [4,5]. Additionally, walkable metropolitan areas contribute significantly to attracting a higher level of educated people and creative class and retaining high-tech companies and innovative businesses that generate economic development [6].
Despite tremendous research on the benefit of walking, the prevalence of a sedentary life is still high in the U.S. Over a period of 30 years, the number of walking commuters in the U.S has declined approximately half from 1980 to 2010 [7]. In 2014, about 48% of the U.S adults did not meet the public health guidelines for 150 minutes of moderate physical activities in a week [8]. Moreover, around 30–60% of the population are not involved in physical activities [9].
Therefore, the big question for planners, public health experts and policy makers is how to make our cities more walkable and what factors contribute to walkability. According to previous studies, socioeconomic status (SES) such as educational attainment and household income are strongly correlated with physical activity [10]. In addition to socioeconomic characteristics, built environmental factors such as density, diversity, design, destination accessibility, and distance to transit (also known as D variables) could significantly affect walkability [11].
However, compared to neighborhood-level built environmental variables, there is little understanding on how street-level perceptual qualities might affect walkability. The reason is that there is little systematic effort to operationalize these qualities at the street level. Additionally, measuring them requires a detailed and intensive in-site data collection. These street-level factors, however, are relatively easier and less costly to improve than ones at the neighborhood level. Therefore, it is important for city officials, planners, and policy makers to have a better understanding of the role of these factors in providing more walkable environments.
It is also critical for a dynamic but auto-dependent city such as Dallas to move toward a more pedestrian friendly environment. According to a recent study by Leinberger and Lynch (2014) that compares large American cities in terms of walkability, Dallas holds the 25th rank among 30 cities though it has the potential to experience growth in a walkable development [12].
Hence, the goal of this study is to measure urban design qualities and to investigate their impacts on walkability in Downtown Dallas. This study is one of the first that comprehensively examine such a relationship in Dallas, adding new insights on how to make this car oriented city [13] more pleasing for pedestrians.
This study used the same methodology taken by Ewing and Clemente (2013) and Ameli et al. (2015) to study urban design qualities in New York City, NY and Salt Lake City; Utah [14,15], while it seeks to overcome their limitations by including a larger sample size (402 block faces), there are other important variables and a refined methodology for data collection. We added a measure of noise level in the imageability computation through smart phone applications. We also added several control variables such as sidewalk coverage, employment concentration and number of parks among other control variables. Finally, this research accounted for the variations in peak and off peak periods by limiting pedestrian counts data collection to only during the peak hours and on weekdays.
Our research team collected street level micro-scale data on 23 features related to urban design as well as 11 built environment variables and counted pedestrians. Our data collection covered 402 street block faces located in Dallas Downtown Improvement District (DID). We applied GIS techniques to measure land used and D variables for the 402 street block faces. Accounting for spatial autocorrelation, this study used Negative Binomial to examine how urban design qualities as well as D variables impact the level of pedestrian activity in each street segment located in the Downtown area in Dallas.
1.1. Mesoscale (Street Level) Built Environment and Walkability (D Variables)
The impacts of built environment on travel behavior and more specifically walking have been the subject of more than 200 empirical studies and two meta-analyses [11,16]. In planning and transportation literature, the built environment at mesoscale (neighborhood level) has been heavily studied as ‘D’ variables since Cervero and Kockelman (1997) introduced the concept in 1997 [17]. The original three Ds are density, diversity and design. Subsequent studies included destination accessibility, distance to transit and demographics [11]. Research efforts have operationalized the built environment by these variables to provide explanations for trip frequencies, trip distances, vehicle miles travelled (VMT), mode choices, as well as pedestrian mode choice and walking frequency [18,19,20,21,22,23,24,25,26].
Measuring four of the five D variables (diversity, density, distance to transit, and destination accessibility) seems relatively straightforward. Scholars often measure density as population, employment, or building floor area per unit of area [11]. Diversity relates to the number of different land uses in a specified location. Travel behavior studies have widely used entropy as a measure of diversity in which high values pertain to diversity in land use and low values indicate single use dominancy. Destination accessibility can be either local or regional. Local accessibility measures the distance from home to the nearest store while regional accessibility considers the distance to the central business district (CBD) or the number of employment centers in a given time. The distance to transit is typically measured by the shortest route distance from home or workplace to the closest bus stop or rail station [11].
Among the D variables, however, quantifying the design variable seems to be more complicated [14]. Design includes features attributed to street patterns, varying from highly dense, interconnected networks to cul-de-sacs and curving streets, forming what Southworth and Owens call ““loops and lollipops” (280). At the neighborhood level, design measures include the proportion of four way intersections, average block size, and the number of intersections per square mile [11].
1.2. Microscale (Street Level) Built Environment and Walkability
The Street-level microscale design qualities are referred to as perceptual or experiential qualities such as those corresponding to pedestrian route choice, speed and volume [27,28,29]. These qualities are known to contribute to the experience of walking; however, there is little empirical evidence to support this relationship due to the need for extensive data collection and lack of measurement reliability [30].
According to the literature, urban design features that make the street more walkable at the micro-level are pedestrian infrastructure such as presence of crosswalks, streetlights and sidewalks, green space accessibility, and qualities such as urban aesthetics, vacant or high-rise buildings, tidiness, quality of houses, block length, sidewalk coverage, graffiti, or presence of human activities [16,31,32,33,34,35,36]. In a recent study, Ewing and Clemente [14] developed procedures to measure nine “unmeasurable” qualities related to urban design. The research successfully created metrics for five urban design qualities, namely, imageability, enclosure, human scale, transparency, and complexity; however, they were unsuccessful in operationalizing four other qualities (i.e., linkage, legibility, coherence, and tidiness) from their original list [37].
Two subsequent studies attempted to validate the developed metrics for those five measurable qualities [14,15]. For example, examining the relation of urban design qualities to the number of walking pedestrians in New York City, Ewing and Clemente (2013) found that the operationalized metrics, to a great extent, explain the variations in the models, and that, among the five urban design qualities, transparency was more significant than others. In a recent study conducted in Salt Lake City, Utah, Ameli et al. (2015) investigated whether the same qualities impact walkability. The research concluded that both imageability and transparency are significantly related to walking traffic [15].
More empirical evidence is needed to provide better understanding of how effective are these urban design qualities on attracting pedestrian activities. This study selects Dallas since the city is ranked among the least walkable cities in the country [12] and seeks to investigate the determinant factors for creating more pedestrian friendly streets in Downtown Dallas [14,15].
2. Materials and Methods
2.1. Study Area
This study seeks to investigate the perceptual urban design determinants of walkability for 402 block faces (from each intersection to the next intersection) in Dallas’ Downtown Improvement District (DID). The DID is a special assessment area created at the request of the property owners, consisting of approximately 1777 properties, in the district that was established in 1992 and was renewed in 2001, 2006, and 2013. Within the study area, there is a vibrant mix of uses consisting of a residential neighborhood in the Southern part, a transit hub, and a lunchtime mainstay at the Northern and Western parts, servicing workers and out-of-town visitors, and Union Station and institutional buildings in the South and East for federal and local governmental entities.
The study area covers block faces situated in the Main, Young, Elm, Market, Pearl, Griffin, Wood, Jackson, Pacific, Ross, San Jancinto, Lamar, Record, Houston, Austin, Field, Commerce, Akard, Ervay, Saint Paul, Harwood, Federal, Olive and Bryan streets. With an area of about 1.4 square miles, the DID is comprised of 576 parcels mostly used for commercial and office uses. The area in home to more than 61,500 jobs and high-rise office buildings such as Bank of America Plaza, Renaissance Tower, Comerica Bank Tower, JPMorgan Chase Tower, and Thanksgiving Tower. As shown in Figure 1, few blocks in the North and South sides of the study area were excluded per request by the City of Dallas, our sponsor for this project, mainly due to being parking lots and not much of walking happening in these block faces, which was confirmed by our observation, and not many buildings and urban design qualities exist in these blocks.
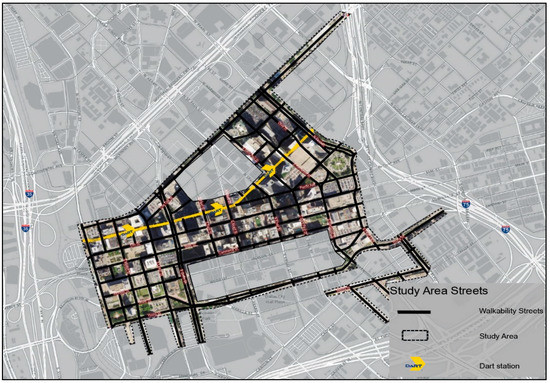
Figure 1.
Study Area; Downtown Improvement District in Dallas.
2.2. Data and Variables
The research team collected field data during the spring and summer of 2016 for 402 block faces from 3.00 pm to 7.00 pm. D variables were also measured using ESRI GIS and Network Analysis.
2.2.1. Urban Design Variables
This study used the same methodology developed by Ewing and Clemente (2013) [13] to quantify the urban design qualities. The original study by Ewing and Clemente (2013) involved (1) recruiting an expert panel of 10 urban designers and planners; (2) creating a library of 200-plus video clips of streetscapes around the U.S.; (3) selecting 48 representative clips to show to the expert panel; (4) having the expert panel rate urban design qualities of videotaped streetscapes with respect to urban design qualities; (5) measuring physical features of streetscapes from the video-clips; (6) statistically analyzing relationships between physical features and urban design quality ratings by the expert panel; (7) selecting five urban design qualities namely complexity, imageability, transparency, human scale, and enclosure; and (8) developing, testing, and refining a field manual that laid out procedures for measuring these qualities [14]. The five urban design qualities that survived this process are listed in Table 1.

Table 1.
Urban Design Qualities, Their Physical Features, Coefficients and P-Values (Source: [37]).
We measured all urban design features associated with each quality using the field manual from the original study. The field manual provides a step-by step instruction on how to collect data for each urban design feature presented in Table 1. Next, we used the coefficients from the original study, presented in Table 1, to compute the value of urban design qualities based on the list of significant physical features. However, the equation was modified to exclude the number of people in imageability and complexity equation since these counts will be used as dependent variables in the next step to examine the relationship between these qualities and pedestrian volume. Examples of high and low scored block faces for each urban design qualities are demonstrated (Figure 2).
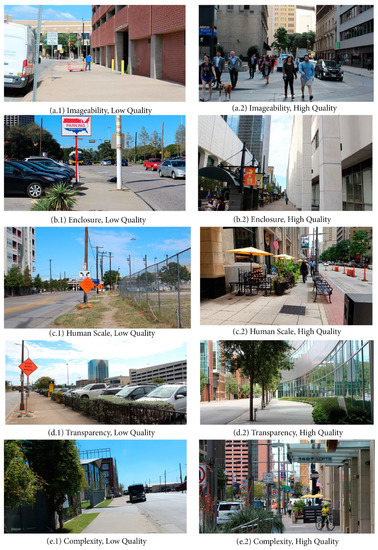
Figure 2.
Examples of High and Low Scored Block Faces for Urban Design Qualities in Study Area.
2.2.2. D variables
We calculated the D variables for a network buffer of quarter mile around each block faces using GIS Network Analysis. A description of the data and their sources is presented in Table 2. To operationalize destination accessibility, we employed the Walk score data extracted from Walk Score, Inc. This website weighs the neighborhoods based on their proximity to amenities within a quarter mile distance and reduces the score as the distances increase to one mile and half, creating scores between 0 to 100. The algorithm weights vary for different amenities; for instance, in comparison to a bookstore, a grocery store weight was three times more, depending on the distance half mile, one mile, and one and half miles.
Table 2.
D Variables included in this study and data sources.
2.2.3. Pedestrian Activity
In this paper, the number of people, walking no the specific street segment, is the dependent variable which have been counted over a period of 30 minutes for each block faces from 4:30 to 7:00 pm, adapted from the ITE Trip Generation Manual [38], accounting for peak versus off-peak hours. A single standing person centered in the middle of a block face recorded the pedestrian counts, using a counter. Individuals who were walking, sitting, standing, running, or biking were included during typical weekdays from Monday through Thursday. Friday, Saturday and Sunday were excluded to have a representation of activity during weekdays. According to the ITE Trip Generation Manual, the trip generation rate on Fridays is generally higher than other weekdays and, therefore, Friday may not represent a typical weekday [38]. Moreover, as recommended by the ITE Trip Generation Manual [38], the scheduled counting days were cancelled when there was an inclement weather forecast. For some block faces, pedestrian counts were zero and some were recorded to have higher pedestrian counts, which can be attributed to the office spaces and DART stations. Figure 3 shows the spatial distribution of pedestrian counts in the study area.
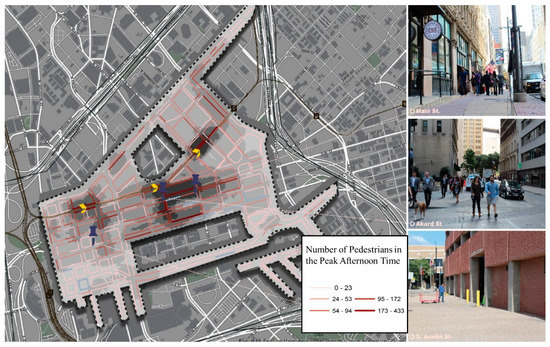
Figure 3.
Spatial Distribution of Pedestrian Counts.
2.2.4. Other Control Variables
In this study, we also developed and included metrics specific to the city of Dallas, including the number of active patios, width of the sidewalk, the number of homeless people and proportion of covered sidewalk (street canopy), employment concentration, and number of parks. We defined the active patio as an outdoor facility that has unfolded chairs and open umbrellas but without any dining capacity. Employment concentration measures the number of jobs within a quarter mile buffer around each block face using the Longitudinal Employer—Household Dynamics (LEHD) data. Finally, we controlled for the number of parks within a quarter mile buffer around each block face.
2.3. Statistical Methods
The key goal of this study is to investigate the relationship between urban design qualities and pedestrian volume (defined as the number of pedestrians counted within a 30-minute time frame) in Downtown Dallas. The pedestrian counts reported for the block faces ranged from very low to high (0 to 433), with a standard deviation of 47.86 and a mean of 38.37.
Since the dependent variable is a non-negative count, negative binomial and Poisson, as two types of generalized linear models, are most often used [39,40]. These two methods have different assumptions regarding the distribution of the dependent variable. Poisson model is used when the variance of the dependent variable and the mean are assumed to be equal, whereas Negative binomial is a preferred method when there exists an over-dispersion, implying that the mean is less than the variance. We calculated the dispersion statistics by dividing the Pearson and chi-square statistics by the degrees of freedom (d.f.), as an over dispersion indicator. If the number is greater than 1.0, we can conclude that the model is over-dispersed [41]. The applicable model for this study is a negative binomial model since we observed over-dispersion (19.77) in the pedestrian counts.
This study also controls for spatial autocorrelation, occurring when a variable’s value observed at one area tends to impact the values in proximate locations [42]. Essentially, pedestrian activity occurring in one segment of the street can be deemed as interrelated to other pedestrian activity observed in proximate segments of the street. To conduct our statistical analyses and account for the spatial correlation to increase the validity of our statistical modeling, we used ‘R’, a statistical software package capable of running spatial statistics.
To test for spatial autocorrelation, we used a widely adopted statistical procedure called Moran’s I spatial statistic. While a Moran’s I statistic ranges from −1 to +1, it indicates the spatial autocorrelation’s strength of a given variable [43]. In this study, the calculated Moran’s I statistic for the data is 0.198; with a p-value of 5.378 × 10⁻⁸ for the residuals of the Negative Binomial regression model. The calculated value shows that a significant and positive spatial relationship exists and should be addressed in the modeling process.
We employed a commonly used technique to address spatial autocorrelation for spatial filtering, which separates the spatial effects of a variable from its non-spatial effects. An appropriate approach to detect and remove spatial autocorrelation from the residuals of generalized linear models is the Moran Eigenvector (ME) filtering function. Using ME function, one eigenvector was added to the negative binomial model. As a result, the significance of Moran’s I statistic decreased with a p-value of 0.001, while the coefficients of independent variables remained intact. This ensured the elimination of the spatial correlation in the model to a great degree, while adding to the validity and predictability power of our model.
3. Results
The results of the Negative Binomial analysis are shown in Table 3. Our finding shows that in most cases built environmental D variables have the expected sign and are significantly associated with pedestrian counts which is consistent with the literature [15]. Buffer Intersection Density and Distance to Transit are the most important correlates of pedestrian volumes.
Table 3.
The Negative Binomial Model with the Fitted Value from Special Filtering.
As shown in Table 3, buffer floor area ratio (far) is significantly related to pedestrian counts. One-unit increase in buffer far increases the number of pedestrians by 0.06 percent. Additionally, block face entropy carries the expected strong, positive relationship to pedestrian numbers, and for every percentage increase in the entropy value, the pedestrian volume increases by 0.63 percent.
Turning to the independent variables of greatest interest, urban design qualities, we found that transparency and imageability positively and significantly influence pedestrian counts. This is consistent with an SLC study in which the same two qualities reported to be significant while partially confirms the NYC study findings that stated only transparency as a significant correlate of walking [13]. Finding similar patterns in Dallas and SLC, but not in New York, is not surprising. New York is the most walkable city with highest walking mode share and is an extreme outlier in terms of walkability while the other two cities are more representative of a typical American city.
As the coefficients show, one-unit increase in transparency increases the pedestrian counts by 0.47 percent and one-unit increase in imageability increases the number of pedestrians by 0.12 percent. Of the other urban design qualities, complexity, and enclosure have the expected positive sign but are not significantly while enclosure approaches the significance level.
Human scale is the only urban design quality with negative unexpected sign and is insignificant. This might be due to the nature of downtown Dallas with tall office buildings that block human sight and also due to the lack of enough planters in most of block faces in the study area. Additionally, two physical features included in the operationalization of this quality overlap with two other qualities, enclosure and transparency (See Table 1). Even though we controlled for multicollinearity, these variables could interact with each other.
Our analysis has several limitations. We only included peak-hour pedestrian counts in this study. The unique nature of downtown area with dominant office use in most buildings affects the number of pedestrians in peak hours versus off-peak hours. Additionally, the field manual borrowed from NYC and SLC studies is relatively subjective in a few cases, which could affect the reliability of our observations. For example, the proportion first floor with windows were subject to observer estimations. Finally, there may be other contextual factors such as morphology, water and vegetation factors, etc. that could influence pedestrians’ use of the space. Our study does not control for these factors, although we have included a number of contextual-related variables such as the proposition of covered sidewalks due to relatively hotter weather and more rainy days in spring and fall in Dallas. Further studies are needed to overcome these limitations and also to provide a broader understanding of people’s perception and preferences of these qualities through surveys and interviews.
4. Discussion and Conclusions
This study seeks to investigate the impacts of urban design qualities and street-level built environmental factors on the number of pedestrians in a less walkable urban area. Compared to neighborhood-level built environmental variables, there is little understanding on how street-level perceptual qualities might affect walkability. Existing studies that focus on measuring the quality of the walking environment are largely designed based on developing audit instruments for measuring sidewalk, architectural, and landscape features associated with walkability [44,45,46,47,48,49,50], while few of them have been systematically validated against the actual walking [46]. More recently, researchers have sought to take advantage of advancement in technology and have used virtual audit tools such as Google Street View [47,48,49,50]. Both field and virtual audit instruments have been widely used by researchers and local governments and provide the most detailed information about the built environmental determinants of walking and physical activity.
However, there still remains a major shortcoming in the literature. Physical features such as building height, street and sidewalk width etc. do not capture the pedestrian’s perception of the walking environment and do not explain much about the actual experience of walking. Perceptual qualities are complex and could have relationships with several physical features presented in walking audits. Much of the literature on people’s perception of walking comes from the survey questionnaire-based studies asking people directly about their perception towards the walking environment [51].
Our extensive search of literature found only one study conducted by Ewing and Clemente (2013) [14] that explored and quantified the relationship between the physical features, which could be obtained through the existing walking audit instruments, and perceptual qualities suggested by the urban design literature [27,28,29]. While their study is pioneering this line of research, there is little empirical evidence on whether, and to what extent, the perceptual qualities developed in their study are associated with the actual walking behavior of pedestrian in the streets. Our study aimed to address this gap and explore the relationship between urban design qualities and pedestrian activity in 402 street segments in Downtown Dallas.
Our findings indicate that imageability and transparency, among five urban design qualities, were significant for walkability. Imageability proved to be significant both in this paper and in Salt Lake City study, as the quality and distinctive features of a place that helps people recognize it. People, signs, identifiers, and strong landmarks can make a street distinctive and memorable, whereas few pedestrians, lack of outdoor dining, and lack of landscape and vistas create low imageability values.
Transparency is the only urban design quality that significantly and positively explains walking in all three cases studies including New York, NY; Salt Lake City, UT; and Dallas, TX. Our measure of transparency incorporates three operational variables: the proportion of first floor façade with windows; the proportion of active uses at street level; and the proportion of street wall along the frontage. Active uses are defined as shops, restaurants, public parks, and other uses are significantly associated with the pedestrian traffic while inactive uses such as blank walls, driveways, parking lots, vacant lots, abandoned buildings, and offices with no apparent activity could discourage walking. Similarly, facades set back by parking or lawn and driveways are not welcoming for pedestrians.
To achieve this broader definition of transparency, codes will need to be restructured in a more fundamental way. What comes immediately to mind are the requirements and restrictions of form-based codes. Many provide for windows, active uses, and street walls. One of the best known and most successful applications of form-based codes is Arlington County’s codes for the Columbia Pike Special Revitalization District. The code requires a minimum of 60 percent of the façades storefronts to allow views into the buildings. Ground floor windows may not be made opaque by window treatments.
Planners and designers could adopt our findings to develop a comprehensive framework for improving pedestrians’ experience particularly with regard to transparency. Our findings urge urban planners and policy makers to pay attention to the design features of sidewalks and streets. Physical features such as public arts, historic elements, inviting street furniture, plaza and landmarks, appealing signage, and even building ornaments make our streets distinctive and memorable (imageable) and hence more inviting for pedestrians. Physical features such as transparent windows and active ground floor are welcoming for pedestrians while reflective widows, arcades, and wide setbacks detract it. Incorporating these policies in site design and transportation planning will lead to higher quality walking experience for pedestrians.
Walking is widely known as a sustainable mode of transportation with many social, environmental, and health benefits to the individuals and the society. Numerous studies have confirmed the role of walking on reducing obesity and other chronic diseases [52], reducing greenhouse gas emissions [53], and increasing social equity and economic vitality [54]. Despite these benefits, walking mode choice is declining in most American Cities and this trend, in large part, has to do with the built environment [55]. Planning for more walkable cities and neighborhoods through changing the land use characteristics of the built environment such as development density, land use diversity, and street network connectivity are very expensive and take a very long time, in most cases decades, to happen. Improving streetscape features and changes in the zoning to facilitate the integration of urban design qualities such as more proportion of windows in the ground floor could significantly increase the walkability, while also bringing economic opportunities to the area. Our findings draw policy makers’ attention to creating more appealing and walkable places through the implementation of these urban design features.
Author Contributions
Conceptualization, S.H.; Methodology, S.H.; Formal Analysis, S.H.; Investigation, S.H.; Writing—Original Draft Preparation, S.H. and S.M.; Writing—Review and Editing, S.H. and S.M.; Visualization, S.M.; Supervision, S.H.; Project Administration, S.H.; Funding Acquisition, S.H.
Funding
This research was funded by the City of Dallas, Department of Economic Development.
Acknowledgments
The authors would like to thank the graduate research team Hamid Hajjafari, Ridvan Kirimli and Shirin Ghorbani, for their assistance in data collection. We are grateful for the support from the Center for Transportation Equity, Decisions and Dollars (CTEDD).
Conflicts of Interest
The authors declare no conflict of interest.
References
- Lee, I.M.; Buchner, D.M. The importance of walking to public health. Med. Sci. Sports Exerc. 2008, 40 (Suppl. 7), 512–518. [Google Scholar] [CrossRef] [PubMed]
- Litman, T. Economic value of walkability. World Transp. Policy Pract. 2004, 10, 5–14. [Google Scholar] [CrossRef]
- Zhu, X.; Yu, C.Y.; Lee, C.; Lu, Z.; Mann, G. A retrospective study on changes in residents’ physical activities, social interactions, and neighborhood cohesion after moving to a walkable community. Prev. Med. 2014, 69, S93–S97. [Google Scholar] [CrossRef] [PubMed]
- Handy, S.; Mokhtarian, P. Growing Cooler: The Evidence on Urban Development and Climate Change: Reid Ewing, Keith Bartholomew, Steve Winkelman, Jerry Walters, and Don Chen; Urban Land Institute: Washington, DC, USA, 2008. [Google Scholar]
- Lee, S.; Talen, E. Measuring walkability: A note on auditing methods. J. Urban Des. 2014, 19, 368–388. [Google Scholar] [CrossRef]
- Florida, R.; The Atlantic. America’s Most Walkable Cities. 2010. Available online: http://www.theatlantic.com/business/archive/2010/12/americas-most-walkable-cities/67988/ (accessed on 10 May 2019).
- AASHTO. The National Report on Commuting Patterns and Trends. Commuting in America. 2015. Available online: http://traveltrends.transportation.org/Pages/default.aspx (accessed on 10 May 2019).
- McGuire, S. Centers for Disease Control and Prevention. State Indicator Report on Physical Activity, 2014. Atlanta, GA: US Department of Health and Human Services; 2014. Adv. Nutr. Int. Rev. J. 2014, 5, 762–763. [Google Scholar] [CrossRef]
- Sundquist, K.; Eriksson, U.; Kawakami, N.; Skog, L.; Ohlsson, H.; Arvidsson, D. Neighborhood walkability, physical activity, and walking behavior: The Swedish Neighborhood and Physical Activity (SNAP) study. Soc. Sci. Med. 2011, 72, 1266–1273. [Google Scholar] [CrossRef]
- Cerin, E.; Leslie, E.; Owen, N. Explaining socio-economic status differences in walking for transport: An ecological analysis of individual, social and environmental factors. Soc. Sci. Med. 2009, 68, 1013–1020. [Google Scholar] [CrossRef]
- Ewing, R.; Cervero, R. Travel and the built environment: A meta-analysis. J. Am. Plan. Assoc. 2010, 76, 265–294. [Google Scholar] [CrossRef]
- Leinberger, C.B.; Lynch, P. Foot Traffic Ahead: Ranking Walkable Urbanism in America’s Largest Metros; Smart Growth America: Washington, DC, USA, 2014. [Google Scholar]
- Hamidi, S. Measuring Metropolitan Form: Remaking Urban Form for Sustainability. Doctoral Dissertation, The University of Utah, Salt Lake City, UT, USA, 2015. [Google Scholar]
- Ewing, R.; Clemente, O. Measuring Urban Design: Metrics for Livable Places; Island Press: Washington, DC, USA, 2013. [Google Scholar]
- Ameli, S.H.; Hamidi, D.; Garfinkel-Castro, A.; Ewing, R. Do better urban design qualities lead to more walking in Salt Lake City, Utah? J. Urban Des. 2015, 20, 393–410. [Google Scholar] [CrossRef]
- Leck, E. The impact of urban form on travel behavior: A meta-analysis. Berkeley Plan. J. 2006, 19, 37–58. [Google Scholar] [CrossRef]
- Cervero, R.; Kockelman, K. Travel demand and the 3Ds: Density, diversity, and design. Transp. Res. Part D Transp. Environ. 1997, 2, 199–219. [Google Scholar] [CrossRef]
- Badoe, D.A.; Miller, E. Transportation–land-use interaction: Empirical findings in North America, and their implications for modeling. Transp. Res. Part D Transp. Environ. 2000, 5, 235–263. [Google Scholar] [CrossRef]
- Crane, R. The influence of urban form on travel: An interpretive review. CPL Bibliogr. 2000, 15, 3–23. [Google Scholar] [CrossRef]
- Ewing, R.; Cervero, R. Travel and the built environment: A synthesis. J. Transp. Res. Board 2001, 1780, 87–114. [Google Scholar] [CrossRef]
- Handy, S. Critical Assessment of the Literature on the Relationships among Transportation, Land Use, and Physical Activity; Resource Paper for TRB Special Report 282; Transportation Research Board; The Institute of Medicine Committee on Physical Activity, Health, Transportation, and Land Use: Davis, CA, USA, 2005. [Google Scholar]
- Heath, G.W.; Brownson, R.C.; Kruger, J.; Miles, R.; Powell, K.E.; Ramsey, L.T. The effectiveness of urban design and land use and transport policies and practices to increase physical activity: A systematic review. J. Phys. Act. Health 2006, 3, S55–S76. [Google Scholar] [CrossRef]
- McMillan, T.E. Urban Form and a Child’s Trip to School: The Current Literature and a Framework for Future Research. J. Plan. Lit. 2005, 19, 440–456. [Google Scholar] [CrossRef]
- Pont, K.; Ziviani, J.; Wadley, D.; Bennett, S.; Abbott, R. Environmental correlates of children’s active transportation: A systematic literature review. Health Place 2009, 15, 849–862. [Google Scholar] [CrossRef]
- Saelens, B.; Sallis, J.F.; Frank, L.D. Environmental correlates of walking and cycling: Findings from the transportation, urban design, and planning literatures. Ann. Behav. Med. 2003, 25, 80–91. [Google Scholar] [CrossRef] [PubMed]
- Saelens, B.; Sallis, J.F.; Black, J.B.; Chen, D. Neighborhood-based differences in physical activity: An environment scale evaluation. Am. J. Public Health 2003, 93, 1552–1558. [Google Scholar] [CrossRef]
- Gehl, J. Life between Buildings: Using Public Space; Island Press: Washington, DC, USA, 2011. [Google Scholar]
- Hedman, R.; Jaszewski, A. Fundamentals of Urban Design; Transportation Research Board: Washington, DC, USA, 1984. [Google Scholar]
- Lynch, K. The Image of the City; MIT Press: Cambridge, MA, USA, 1960. [Google Scholar]
- Kim, S.; Park, S.; Lee, J.S. Meso-or micro-scale? Environmental factors influencing pedestrian satisfaction. Transp. Res. Part D Transp. Environ. 2014, 30, 10–20. [Google Scholar] [CrossRef]
- Black, P.; Street, E. The power of perceptions: Exploring the role of urban design in cycling behaviours and healthy ageing. Transp. Res. Procedia 2014, 4, 68–79. [Google Scholar] [CrossRef]
- Giles-Corti, B.; Donovan, R.J. Relative influences of individual, social environmental, and physical environmental correlates of walking. Am. J. Public Health 2009, 93, 1583–1589. [Google Scholar] [CrossRef]
- Kirtland, K.A.; Porter, D.E.; Addy, C.L.; Neet, M.J.; Williams, J.E.; Sharpe, P.A.; Neff, L.J.; Kimsey, C.D.; Ainsworth, B.E. Environmental measures of physical activity supports: Perception versus reality. Am. J. Prev. Med. 2003, 24, 323–331. [Google Scholar] [CrossRef]
- Lin, L.; Moudon, A.V. Objective versus subjective measures of the built environment, which are most effective in capturing associations with walking? Health Place 2010, 16, 339–348. [Google Scholar] [CrossRef]
- Borst, H.C.; de Vries, S.I.; Graham, J.; Dongen, J.E.F.; Bakker, I.; Miedema, H.M.E. Influence of environmental street characteristics on walking route choice of elderly people. J. Environ. Psychol. 2009, 29, 477–484. [Google Scholar] [CrossRef]
- Boer, R.; Zheng, Y.; Overton, A.; Ridgeway, G.K.; Cohen, D.A. Neighborhood design and walking trips in ten US metropolitan areas. Am. J. Prev. Med. 2007, 32, 298–304. [Google Scholar] [CrossRef] [PubMed]
- Ewing, R.; Handy, S. Measuring the unmeasurable: Urban design qualities related to walkability. J. Urban Des. 2009, 14, 65–84. [Google Scholar] [CrossRef]
- Institute of Transportation Engineers (ITE). Trip Generation Manual, 9th ed.; ITE: Washington, DC, USA, 2012. [Google Scholar]
- Dumbaugh, E.; Rae, R. Safe urban form: Revisiting the relationship between community design and traffic safety. J. Am. Plan. Assoc. 2009, 75, 309–329. [Google Scholar] [CrossRef]
- Marshall, W.E.; Garrick, N.W. Does street network design affect traffic safety? Accid. Anal. Prev. 2001, 43, 769–781. [Google Scholar] [CrossRef]
- Hilbe, J.M. Negative Binomial Regression; Cambridge University Press: Cambridge, UK, 2011. [Google Scholar]
- Anselin, L.; Florax, R.; Rey, D.J. (Eds.) Advances in Spatial Econometrics: Methodology, Tools and Applications; Springer Science & Business Media: Berlin, Germany, 2013. [Google Scholar]
- Dormann, C.; McPherson, J.M.; Araújo, M.B.; Bivand, R.; Bolliger, J.; Carl, G.; Davies, R.G.; Hirzel, A.; Jetz, W.; Kissling, W.D.; et al. Methods to account for spatial autocorrelation in the analysis of species distributional data: A review. Ecography 2007, 30, 609–628. [Google Scholar] [CrossRef]
- Ghekiere, A.; Van Cauwenberg, J.; Mertens, L.; Clarys, P.; de Geus, B.; Cardon, G.; Nasar, J.; Salmon, J.; de Bourdeaudhuij, I.; Deforche, B. Assessing cycling-friendly environments for children: Are micro-environmental factors equally important across different street settings? Int. J. Behav. Nutr. Phys. Act. 2015, 12, 54. [Google Scholar] [CrossRef]
- De Vries, S.; Van Dillen, S.M.; Groenewegen, P.P.; Spreeuwenberg, P. Streetscape greenery and health: Stress, social cohesion and physical activity as mediators. Soc. Sci. Med. 2013, 94, 26–33. [Google Scholar] [CrossRef] [PubMed]
- Boarnet, M.G.; Forsyth, A.; Day, K.; Oakes, J.M. The street level built environment and physical activity and walking: Results of a predictive validity study for the Irvine Minnesota Inventory. Environ. Behav. 2011, 43, 735–775. [Google Scholar] [CrossRef]
- Lu, Y.; Sarkar, C.; Xiao, Y. The effect of street-level greenery on walking behavior: Evidence from Hong Kong. Soc. Sci. Med. 2018, 208, 41–49. [Google Scholar] [CrossRef]
- Lu, Y.; Yang, Y.; Sun, G.; Gou, Z. Associations between overhead-view and eye-level urban greenness and cycling behaviors. Cities 2019, 88, 10–18. [Google Scholar] [CrossRef]
- Goel, R.; Garcia, L.M.; Goodman, A.; Johnson, R.; Aldred, R.; Murugesan, M.; Brage, S.; Bhalla, K.; Woodcock, J. Estimating city-level travel patterns using street imagery: A case study of using Google Street View in Britain. PLoS ONE 2018, 13, e0196521. [Google Scholar] [CrossRef]
- Pliakas, T.; Hawkesworth, S.; Silverwood, R.J.; Nanchahal, K.; Grundy, C.; Armstrong, B.; Casas, J.P.; Morris, R.W.; Wilkinson, P.; Lock, K. Optimising measurement of health-related characteristics of the built environment: Comparing data collected by foot-based street audits, virtual street audits and routine secondary data sources. Health Place 2017, 43, 75–84. [Google Scholar] [CrossRef]
- Koohsari, M.J.; Karakiewicz, J.A.; Kaczynski, A.T. Public open space and walking: The role of proximity, perceptual qualities of the surrounding built environment, and street configuration. Environ. Behav. 2013, 45, 706–736. [Google Scholar] [CrossRef]
- Garfinkel-Castro, A.; Kim, K.; Hamidi, S.; Ewing, R. Obesity and the built environment at different urban scales: Examining the literature. Nutr. Rev. 2017, 75 (Suppl. 1), 51–61. [Google Scholar] [CrossRef]
- Ewing, R.; Hamidi, S. Longitudinal analysis of transit’s land use multiplier in Portland (OR). J. Am. Plan. Assoc. 2014, 80, 123–137. [Google Scholar] [CrossRef][Green Version]
- Zandiatashbar, A.; Hamidi, S. Impacts of transit and walking amenities on robust local knowledge economy. Cities 2018, 81, 161–171. [Google Scholar] [CrossRef]
- Hamidi, S.; Ewing, R.; Preuss, I.; Dodds, A. Measuring sprawl and its impacts: An update. J. Plan. Educ. Res. 2015, 35, 35–50. [Google Scholar] [CrossRef]


© 2019 by the authors. Licensee MDPI, Basel, Switzerland. This article is an open access article distributed under the terms and conditions of the Creative Commons Attribution (CC BY) license (http://creativecommons.org/licenses/by/4.0/).