Characteristics and Environmental Factors of Stoichiometric Homeostasis of Soil Microbial Biomass Carbon, Nitrogen and Phosphorus in China
Abstract
:1. Introduction
2. Materials and Methods
2.1. Data Sources
2.2. Calculation of Homeostatic Coefficients
2.3. Statistical Analysis
3. Results
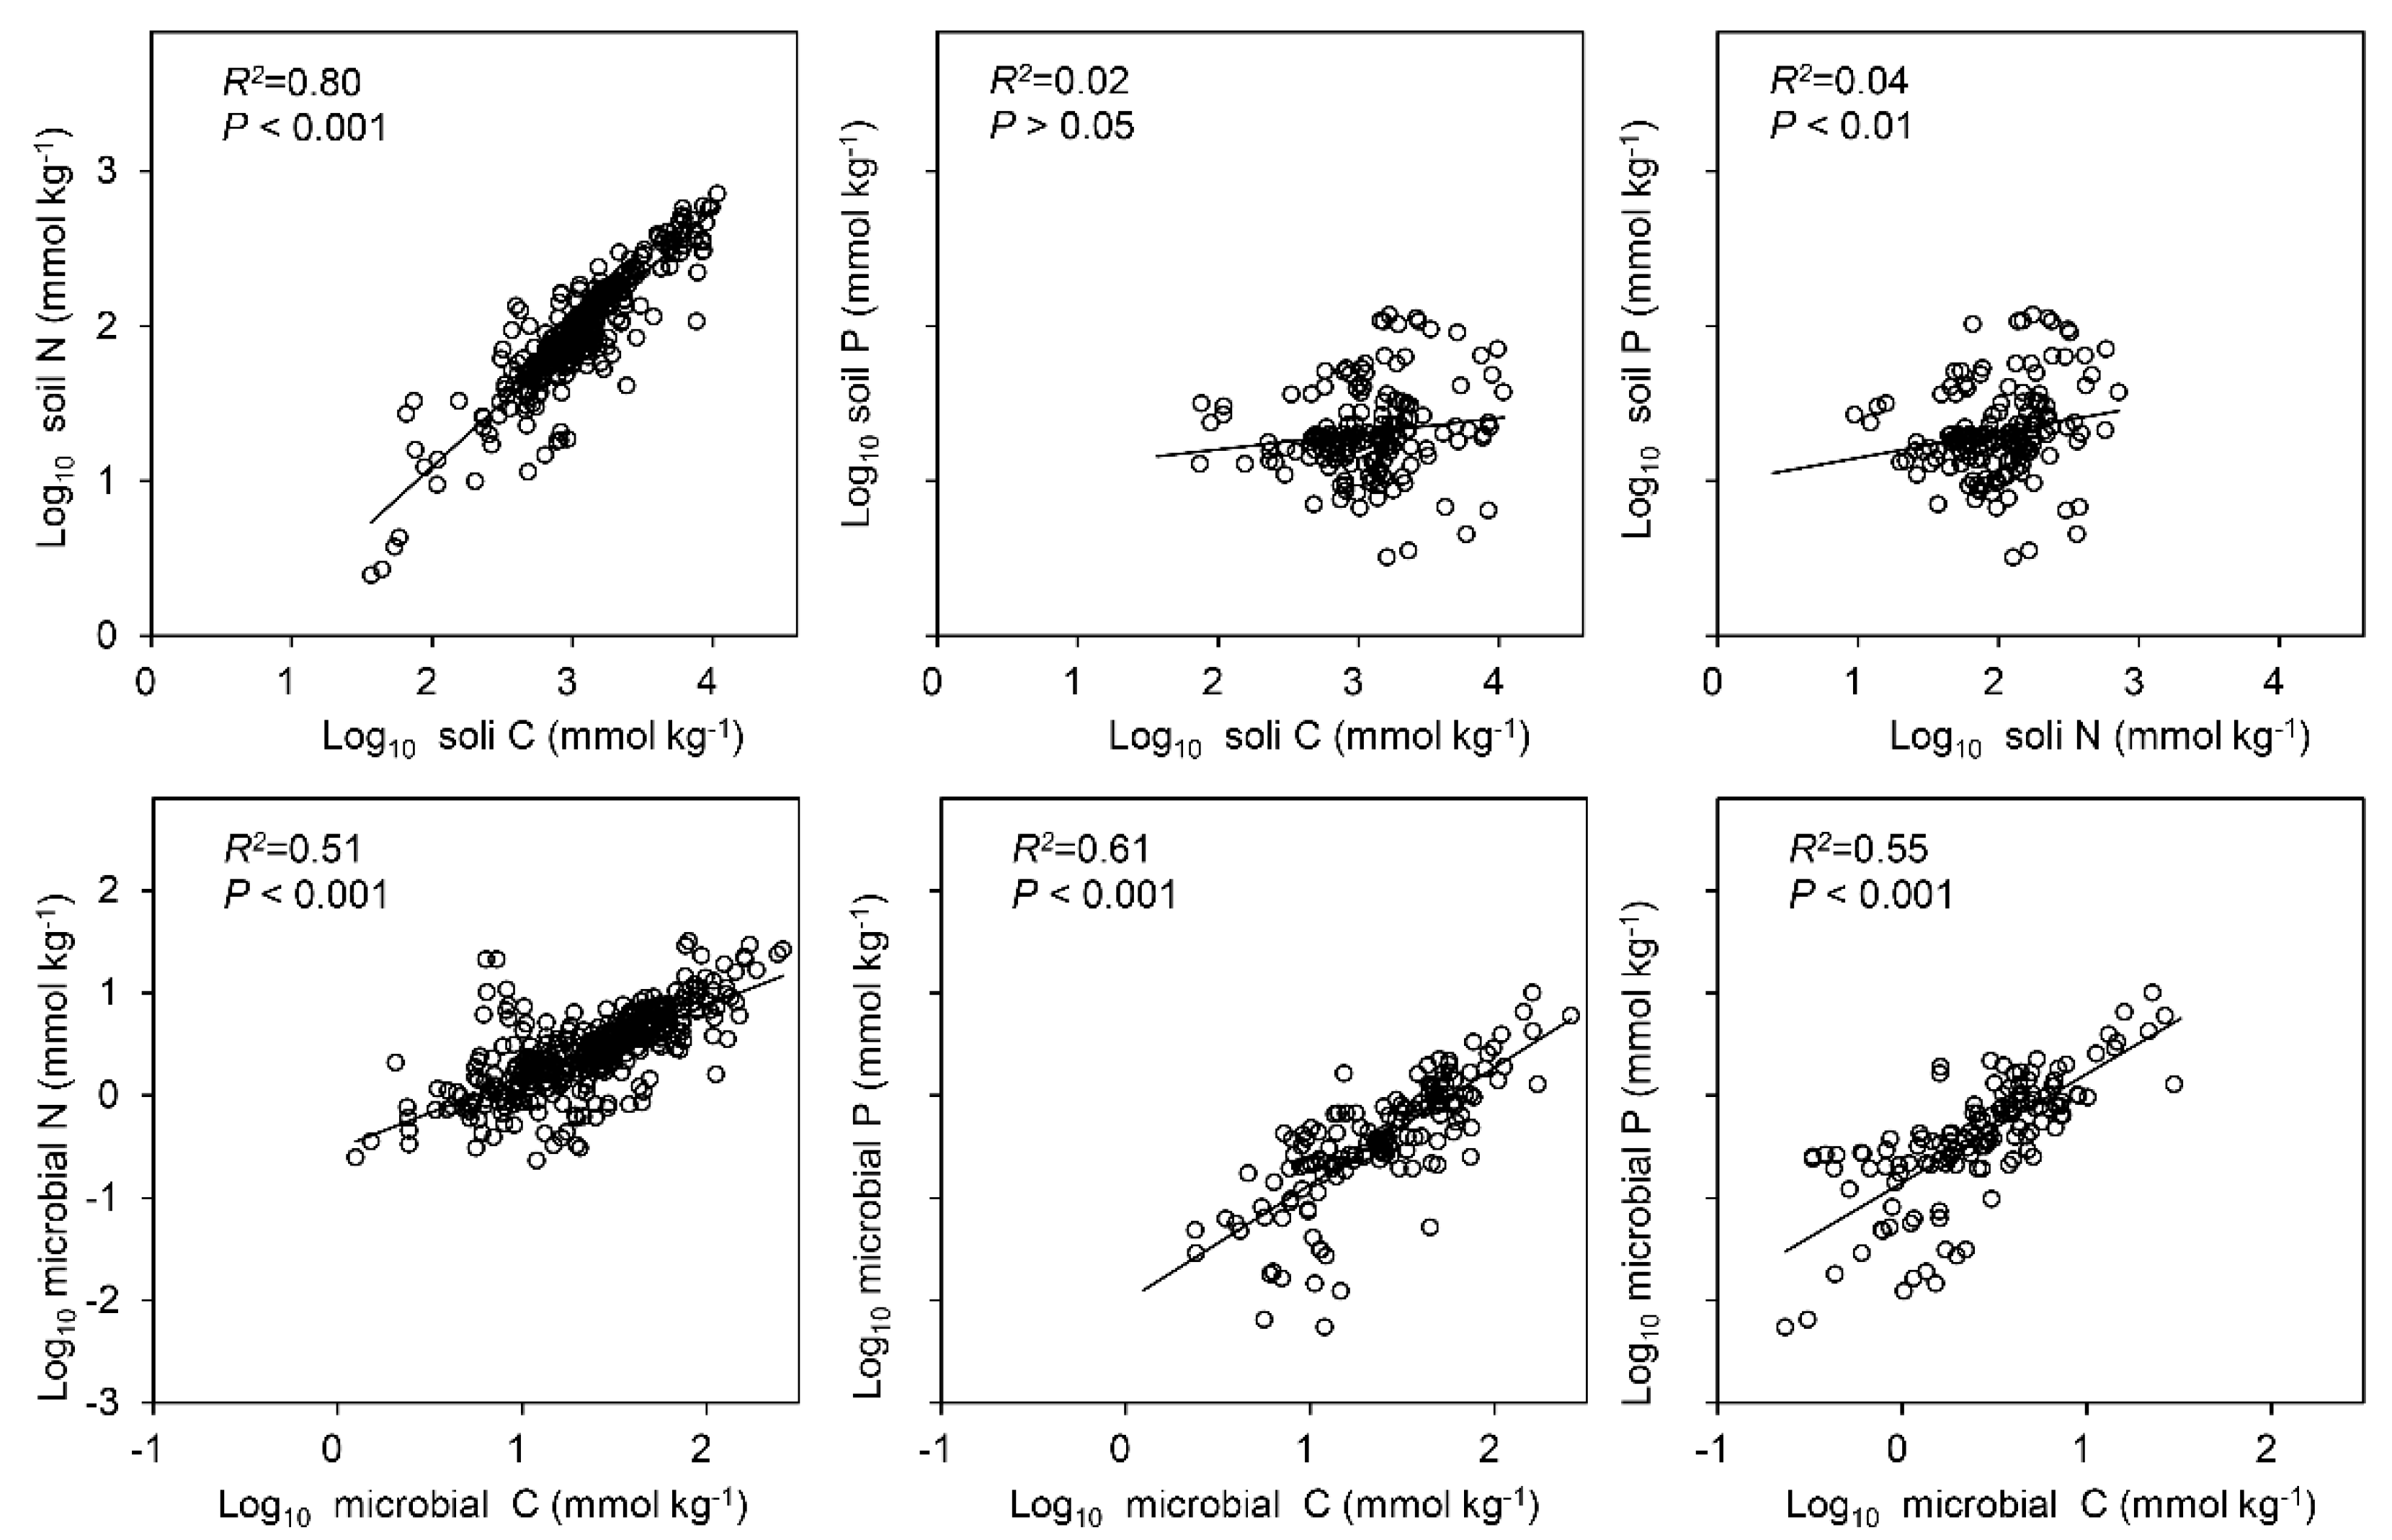
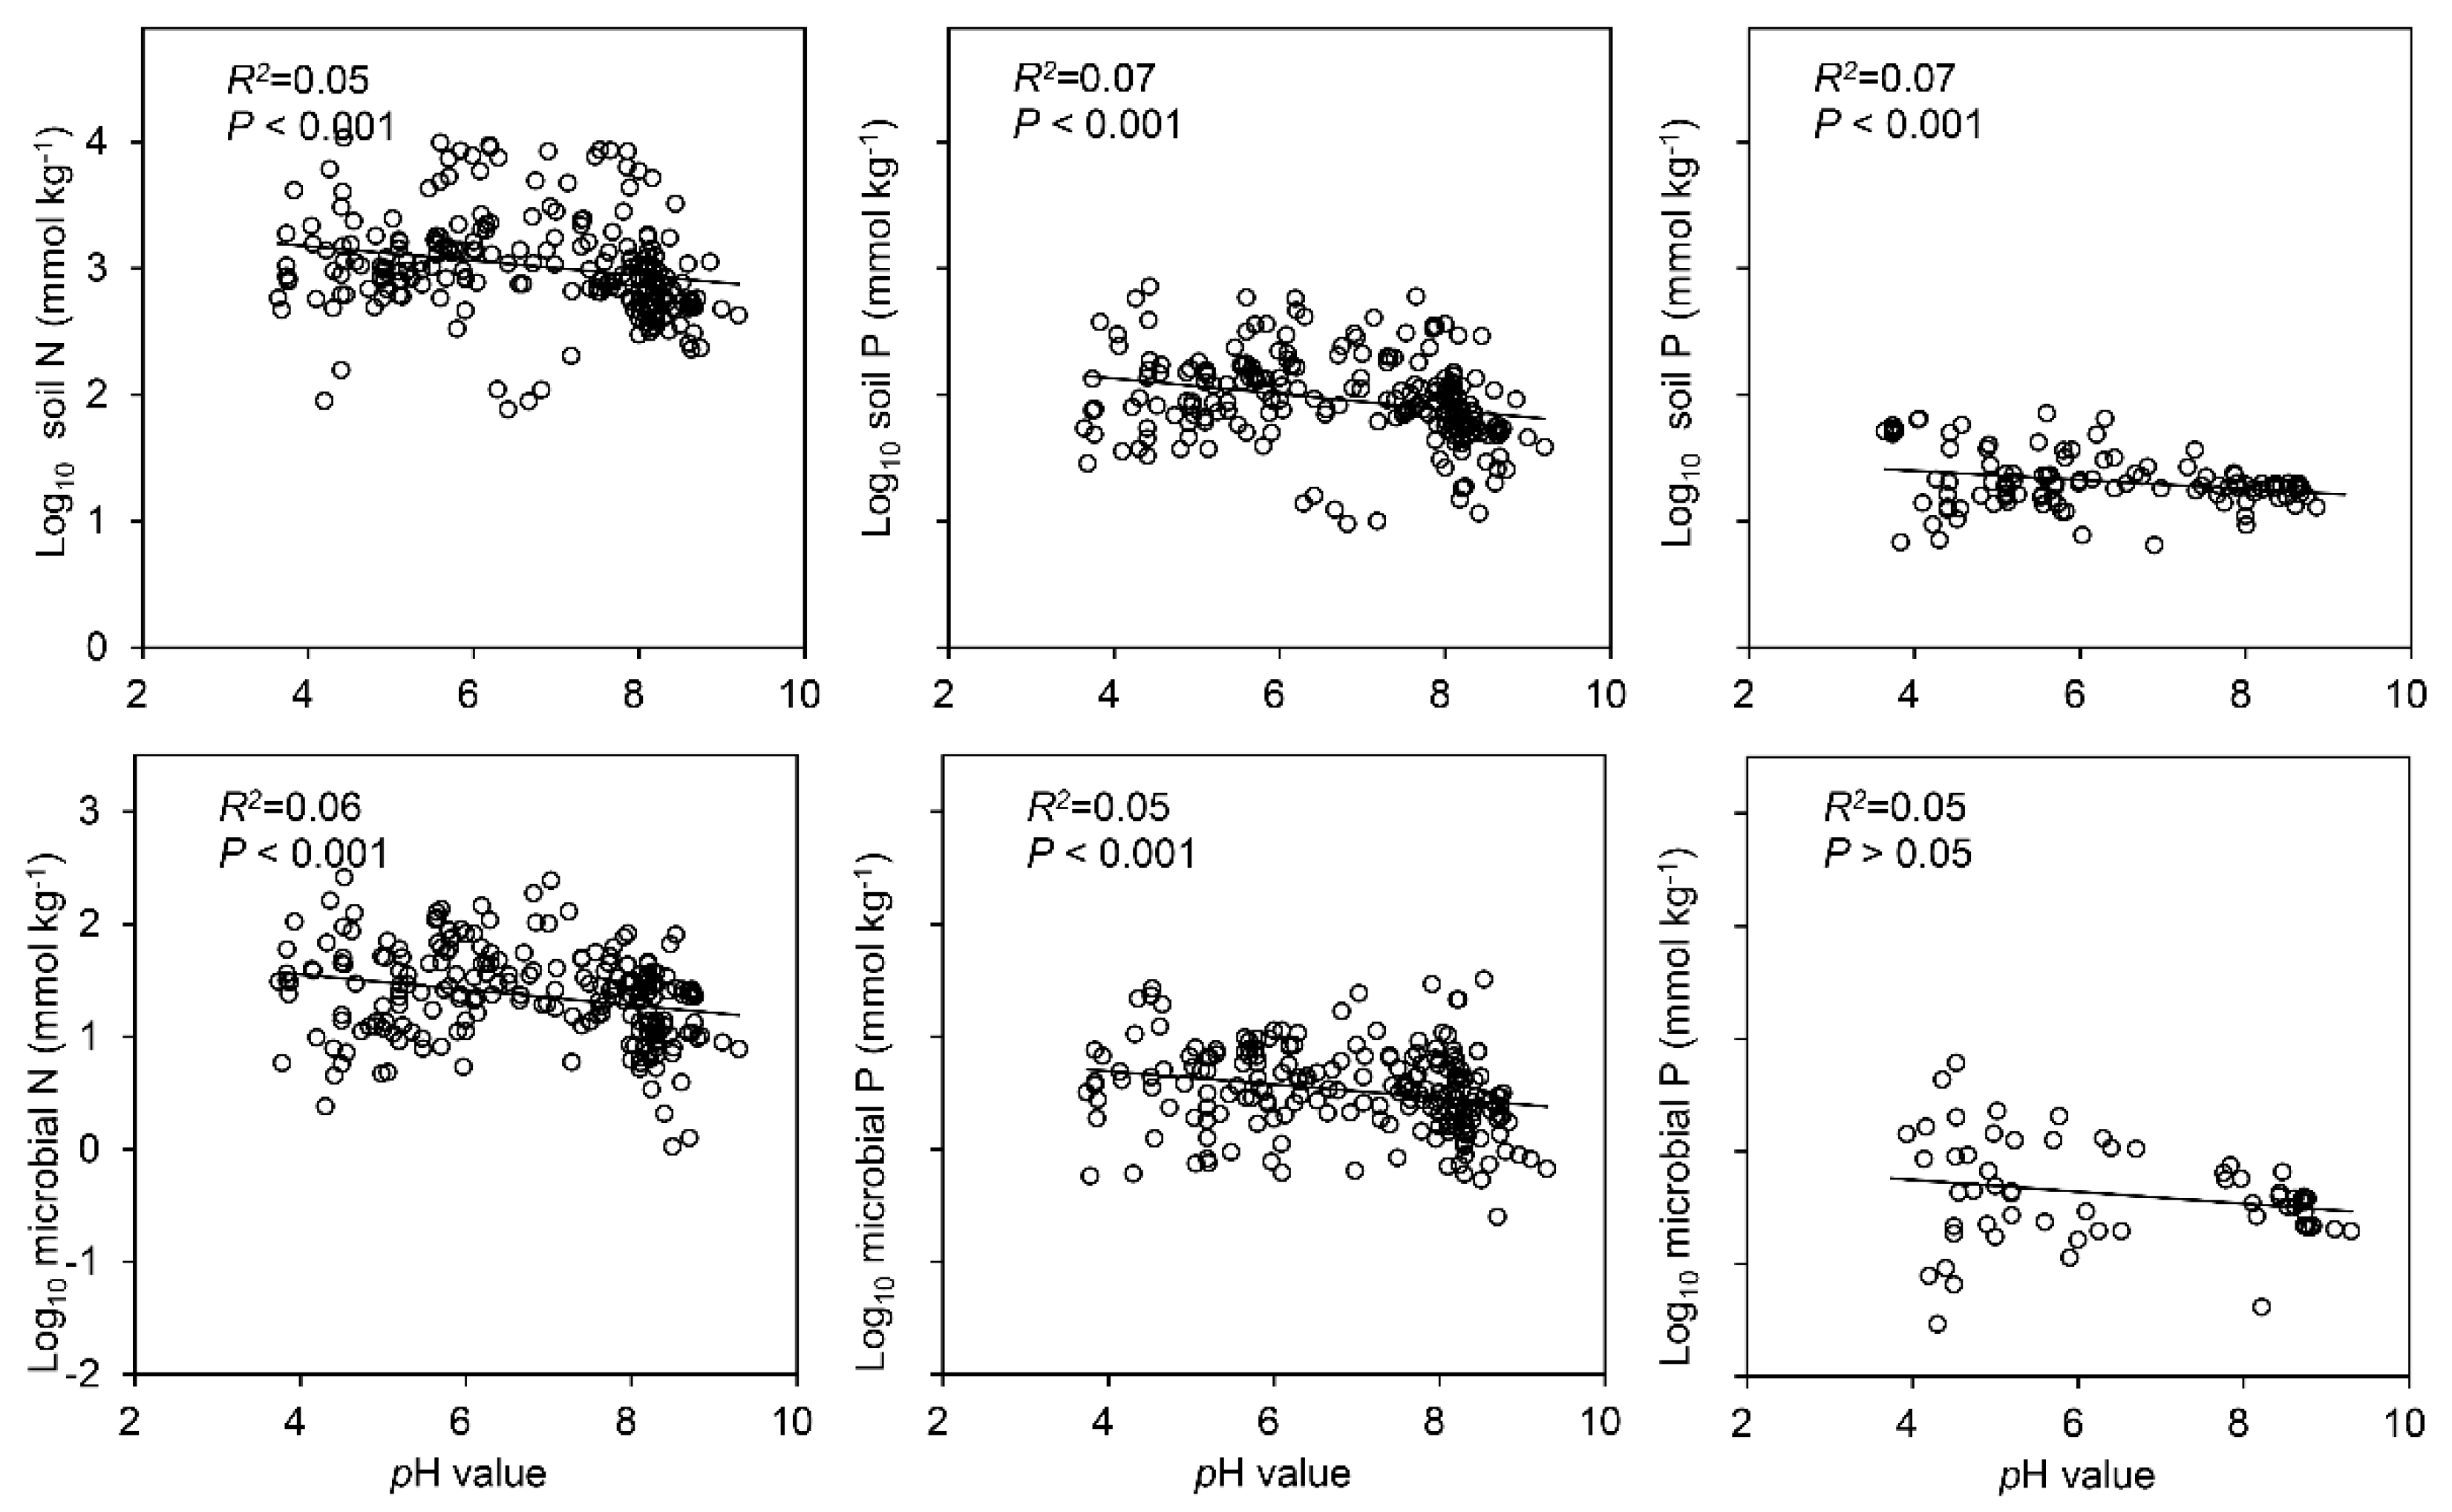
3.1. Concentrations of C, N and P in the Soil and Soil Microbial Biomass
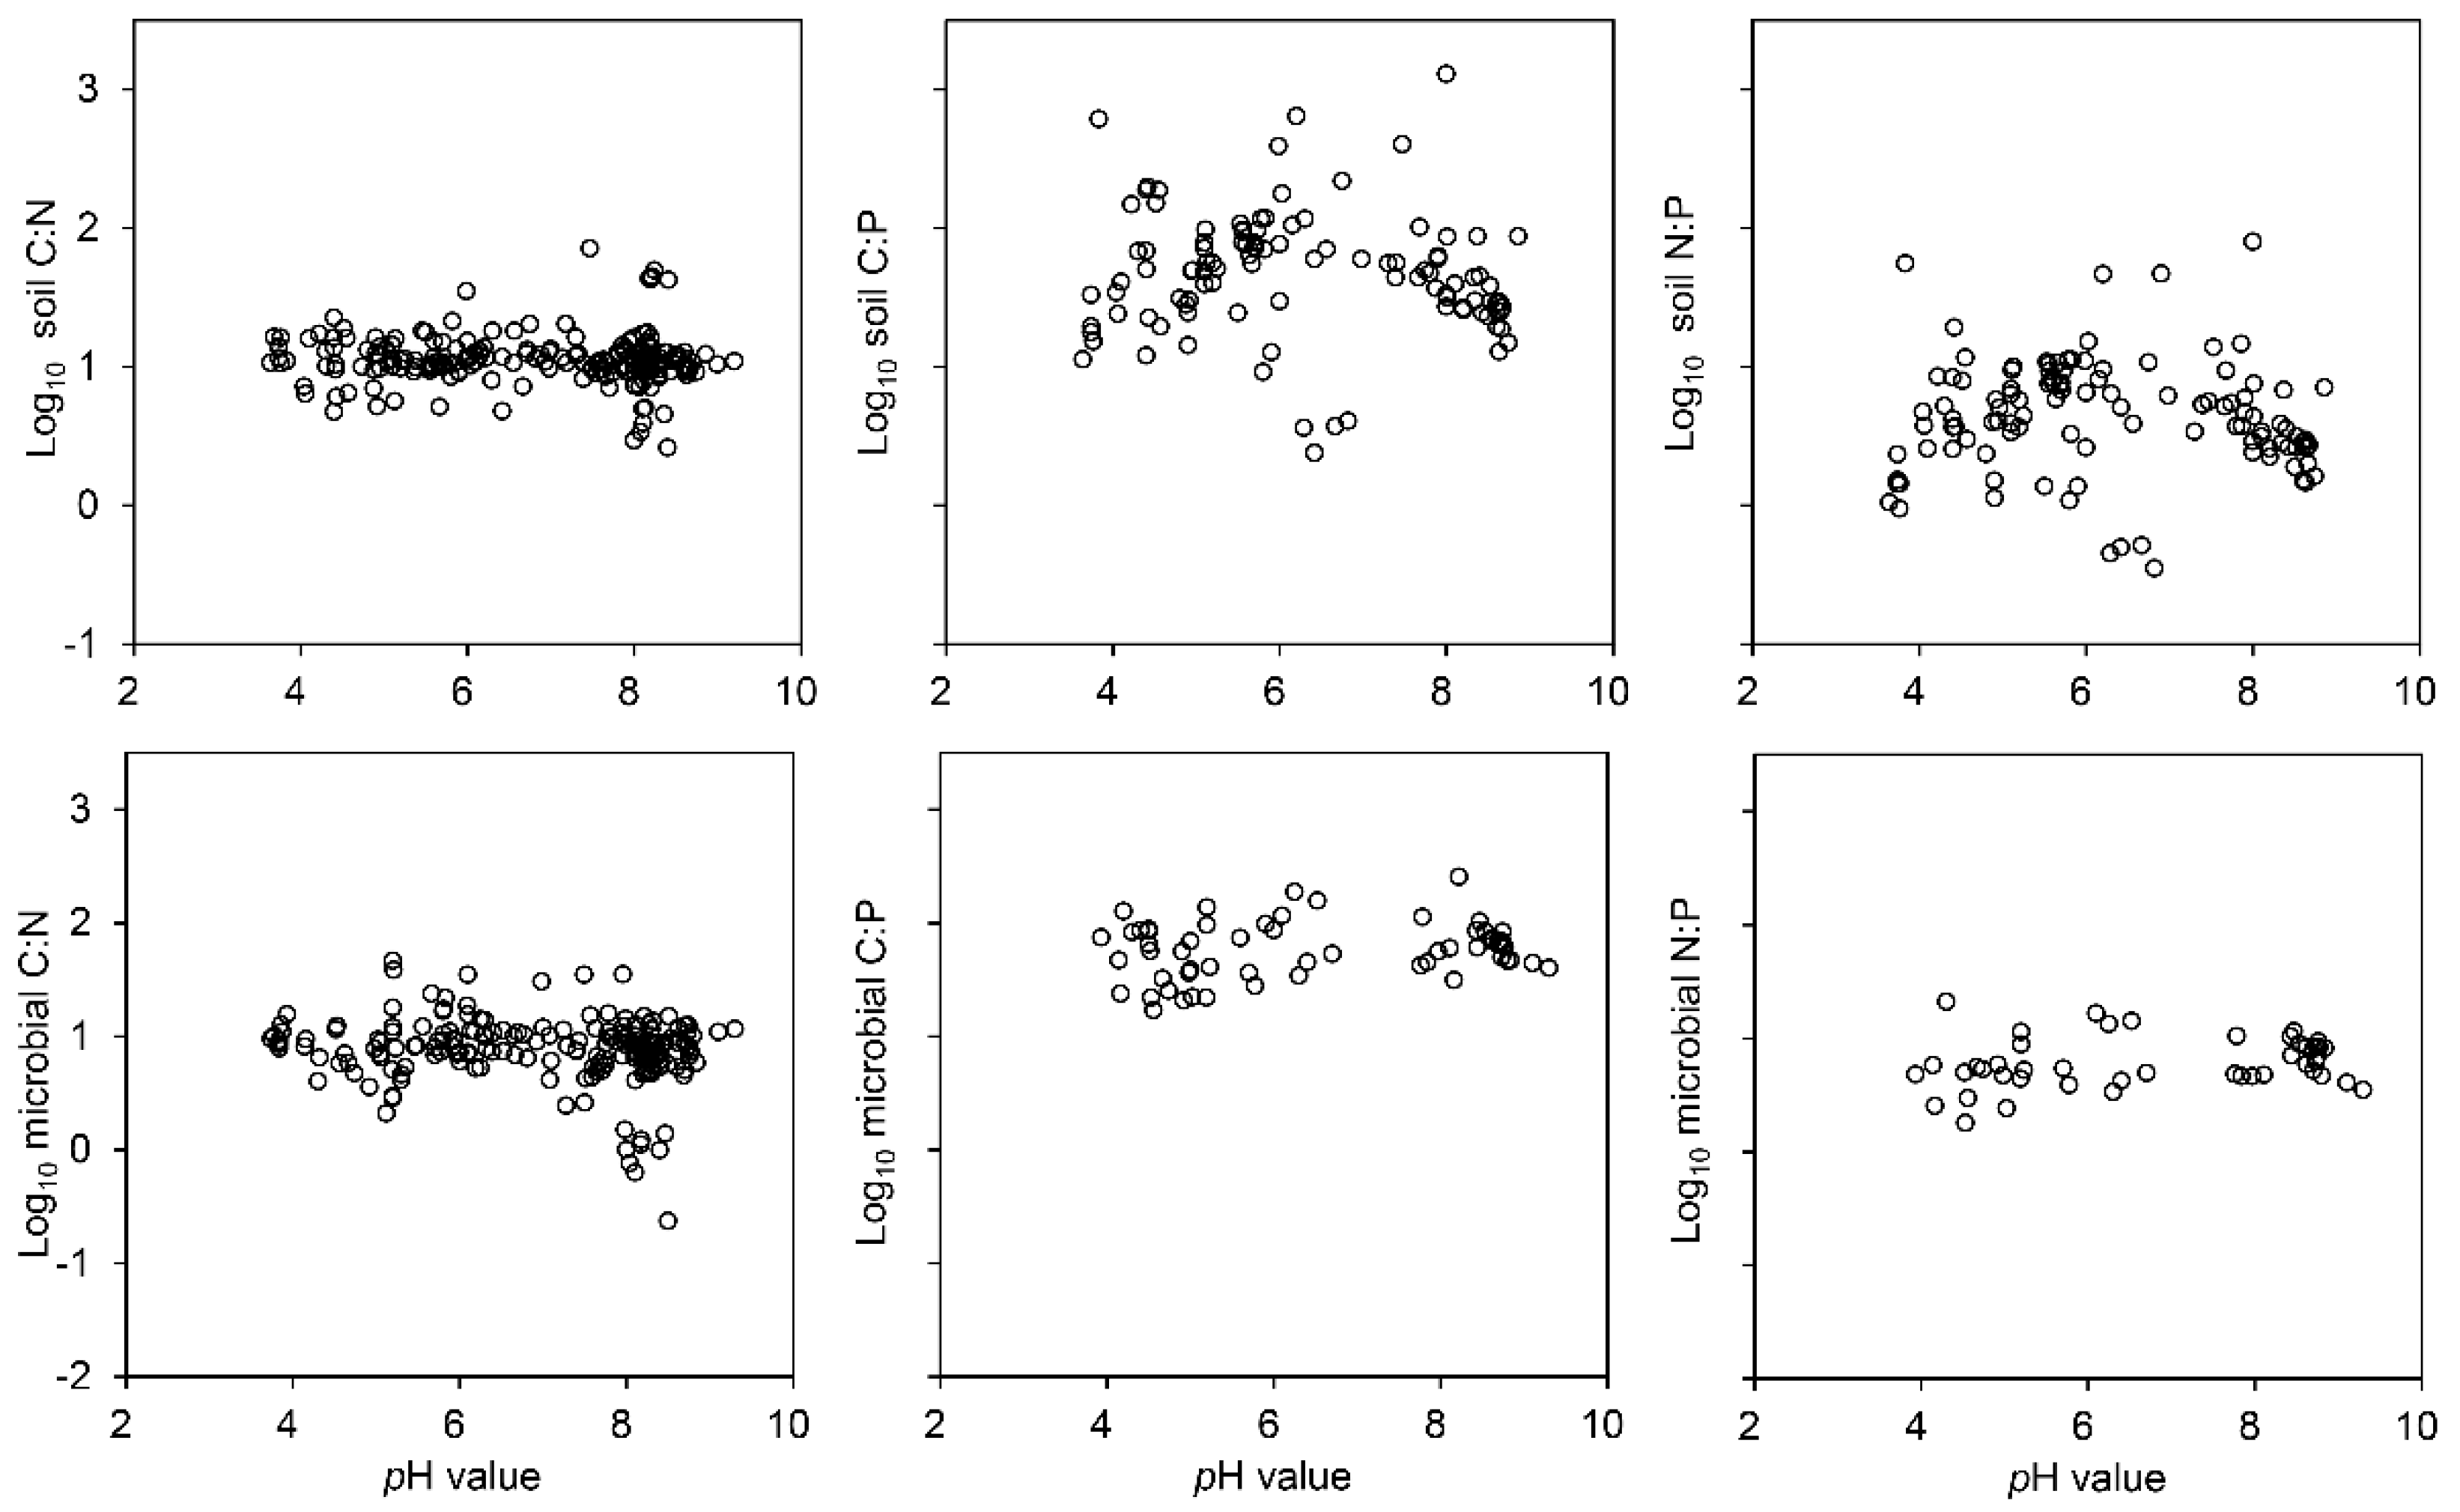
3.2. Ratios of C, N and P in the Soil and Soil Microbial Biomass
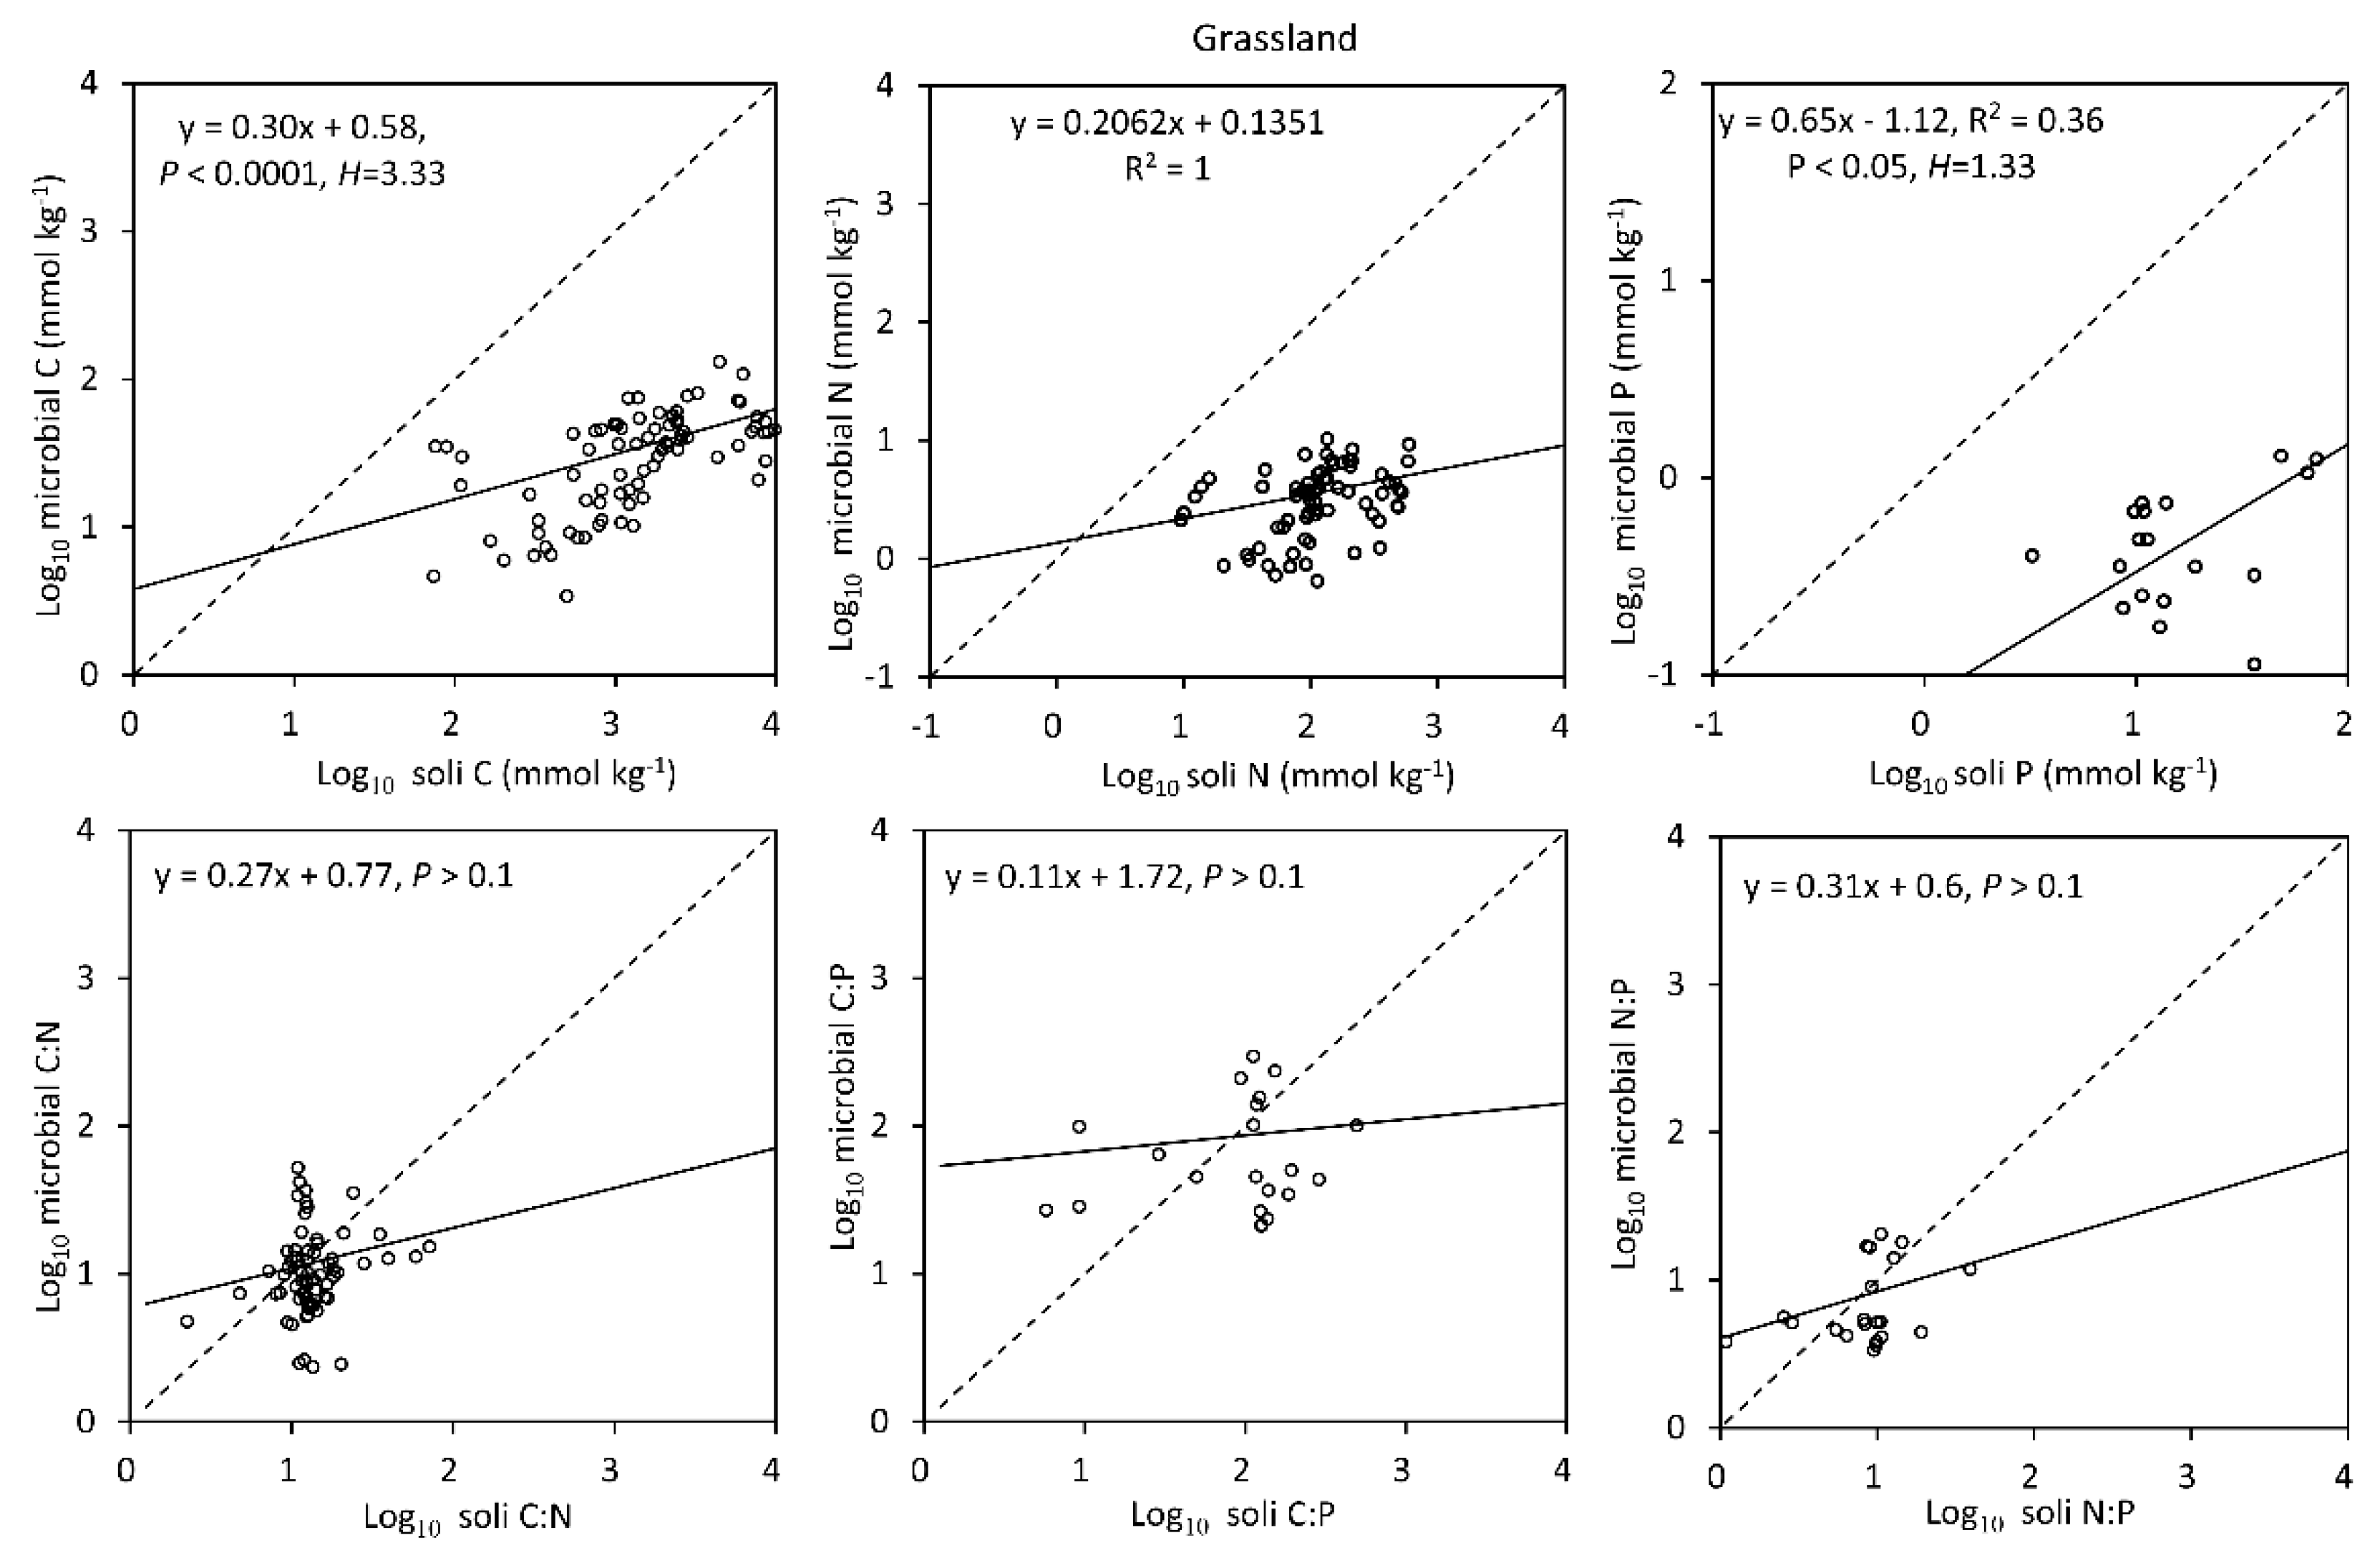
3.3. Homeostasis Characteristics of Soil Microbial Biomass C, N and P
4. Discussion
4.1. The “Redfield-Like” Ratio Exists for Soil C, N and P and Soil Microbial Biomass C, N and P in Terrestrial Ecosystems in China
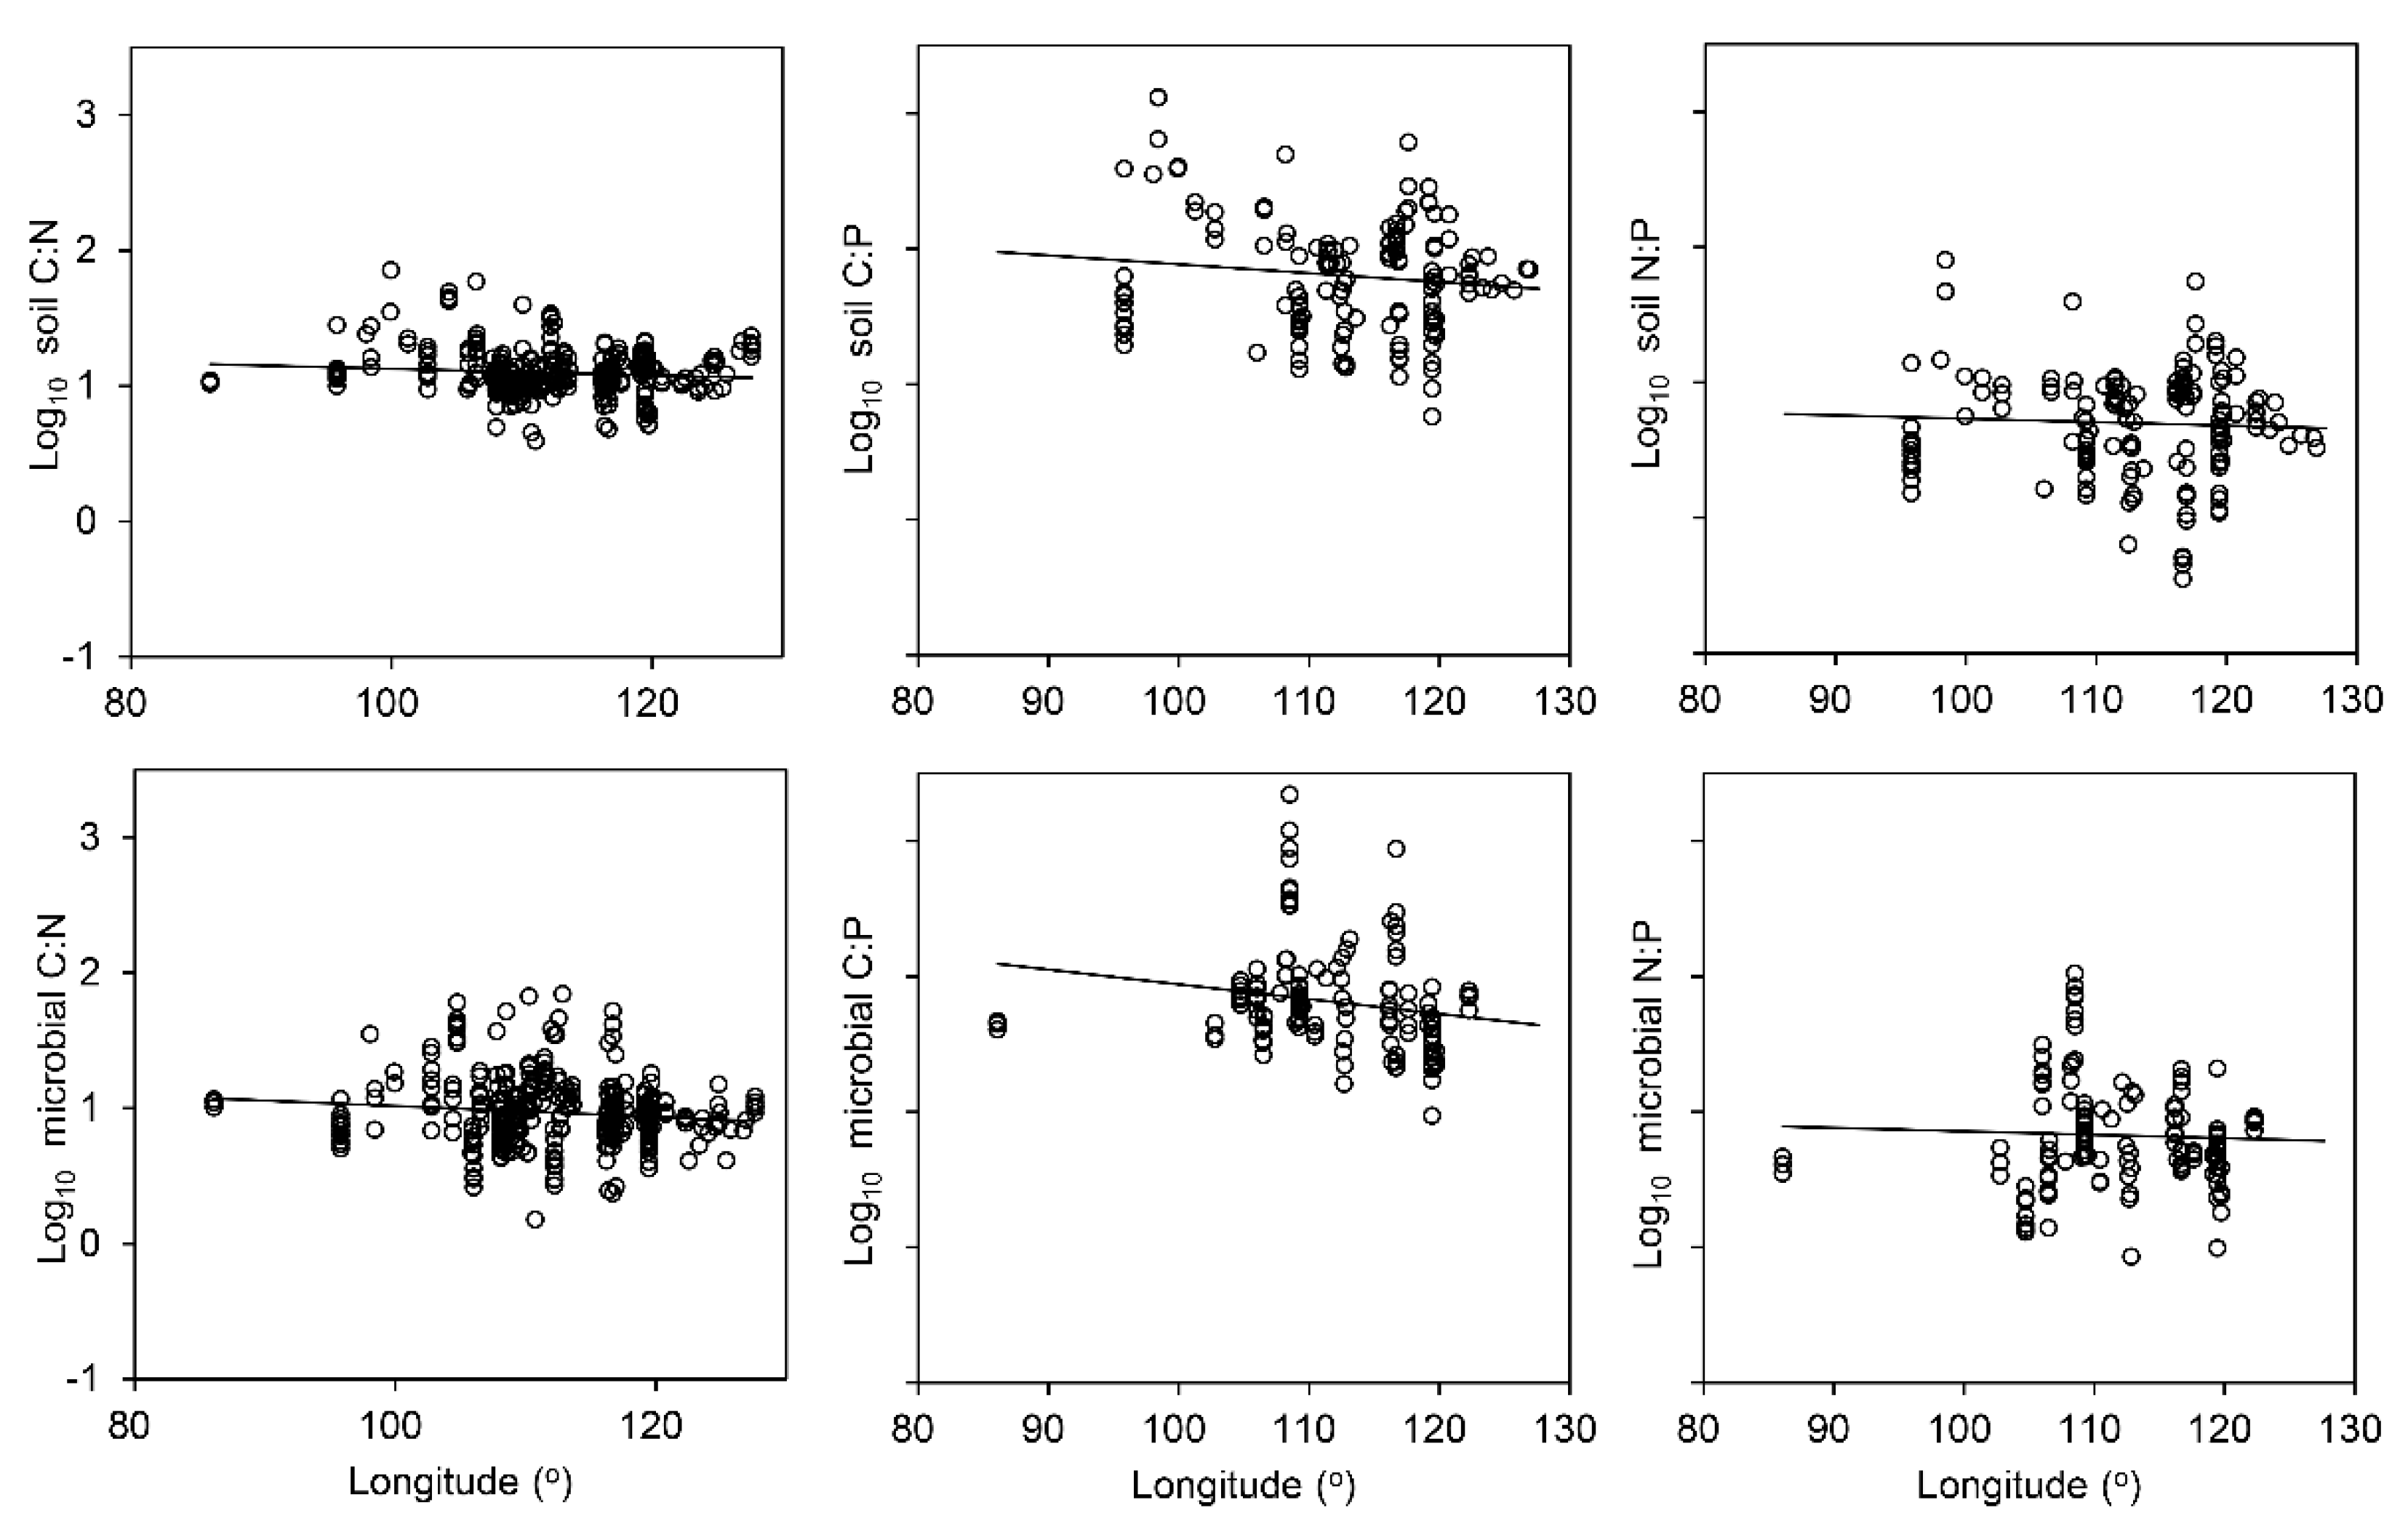
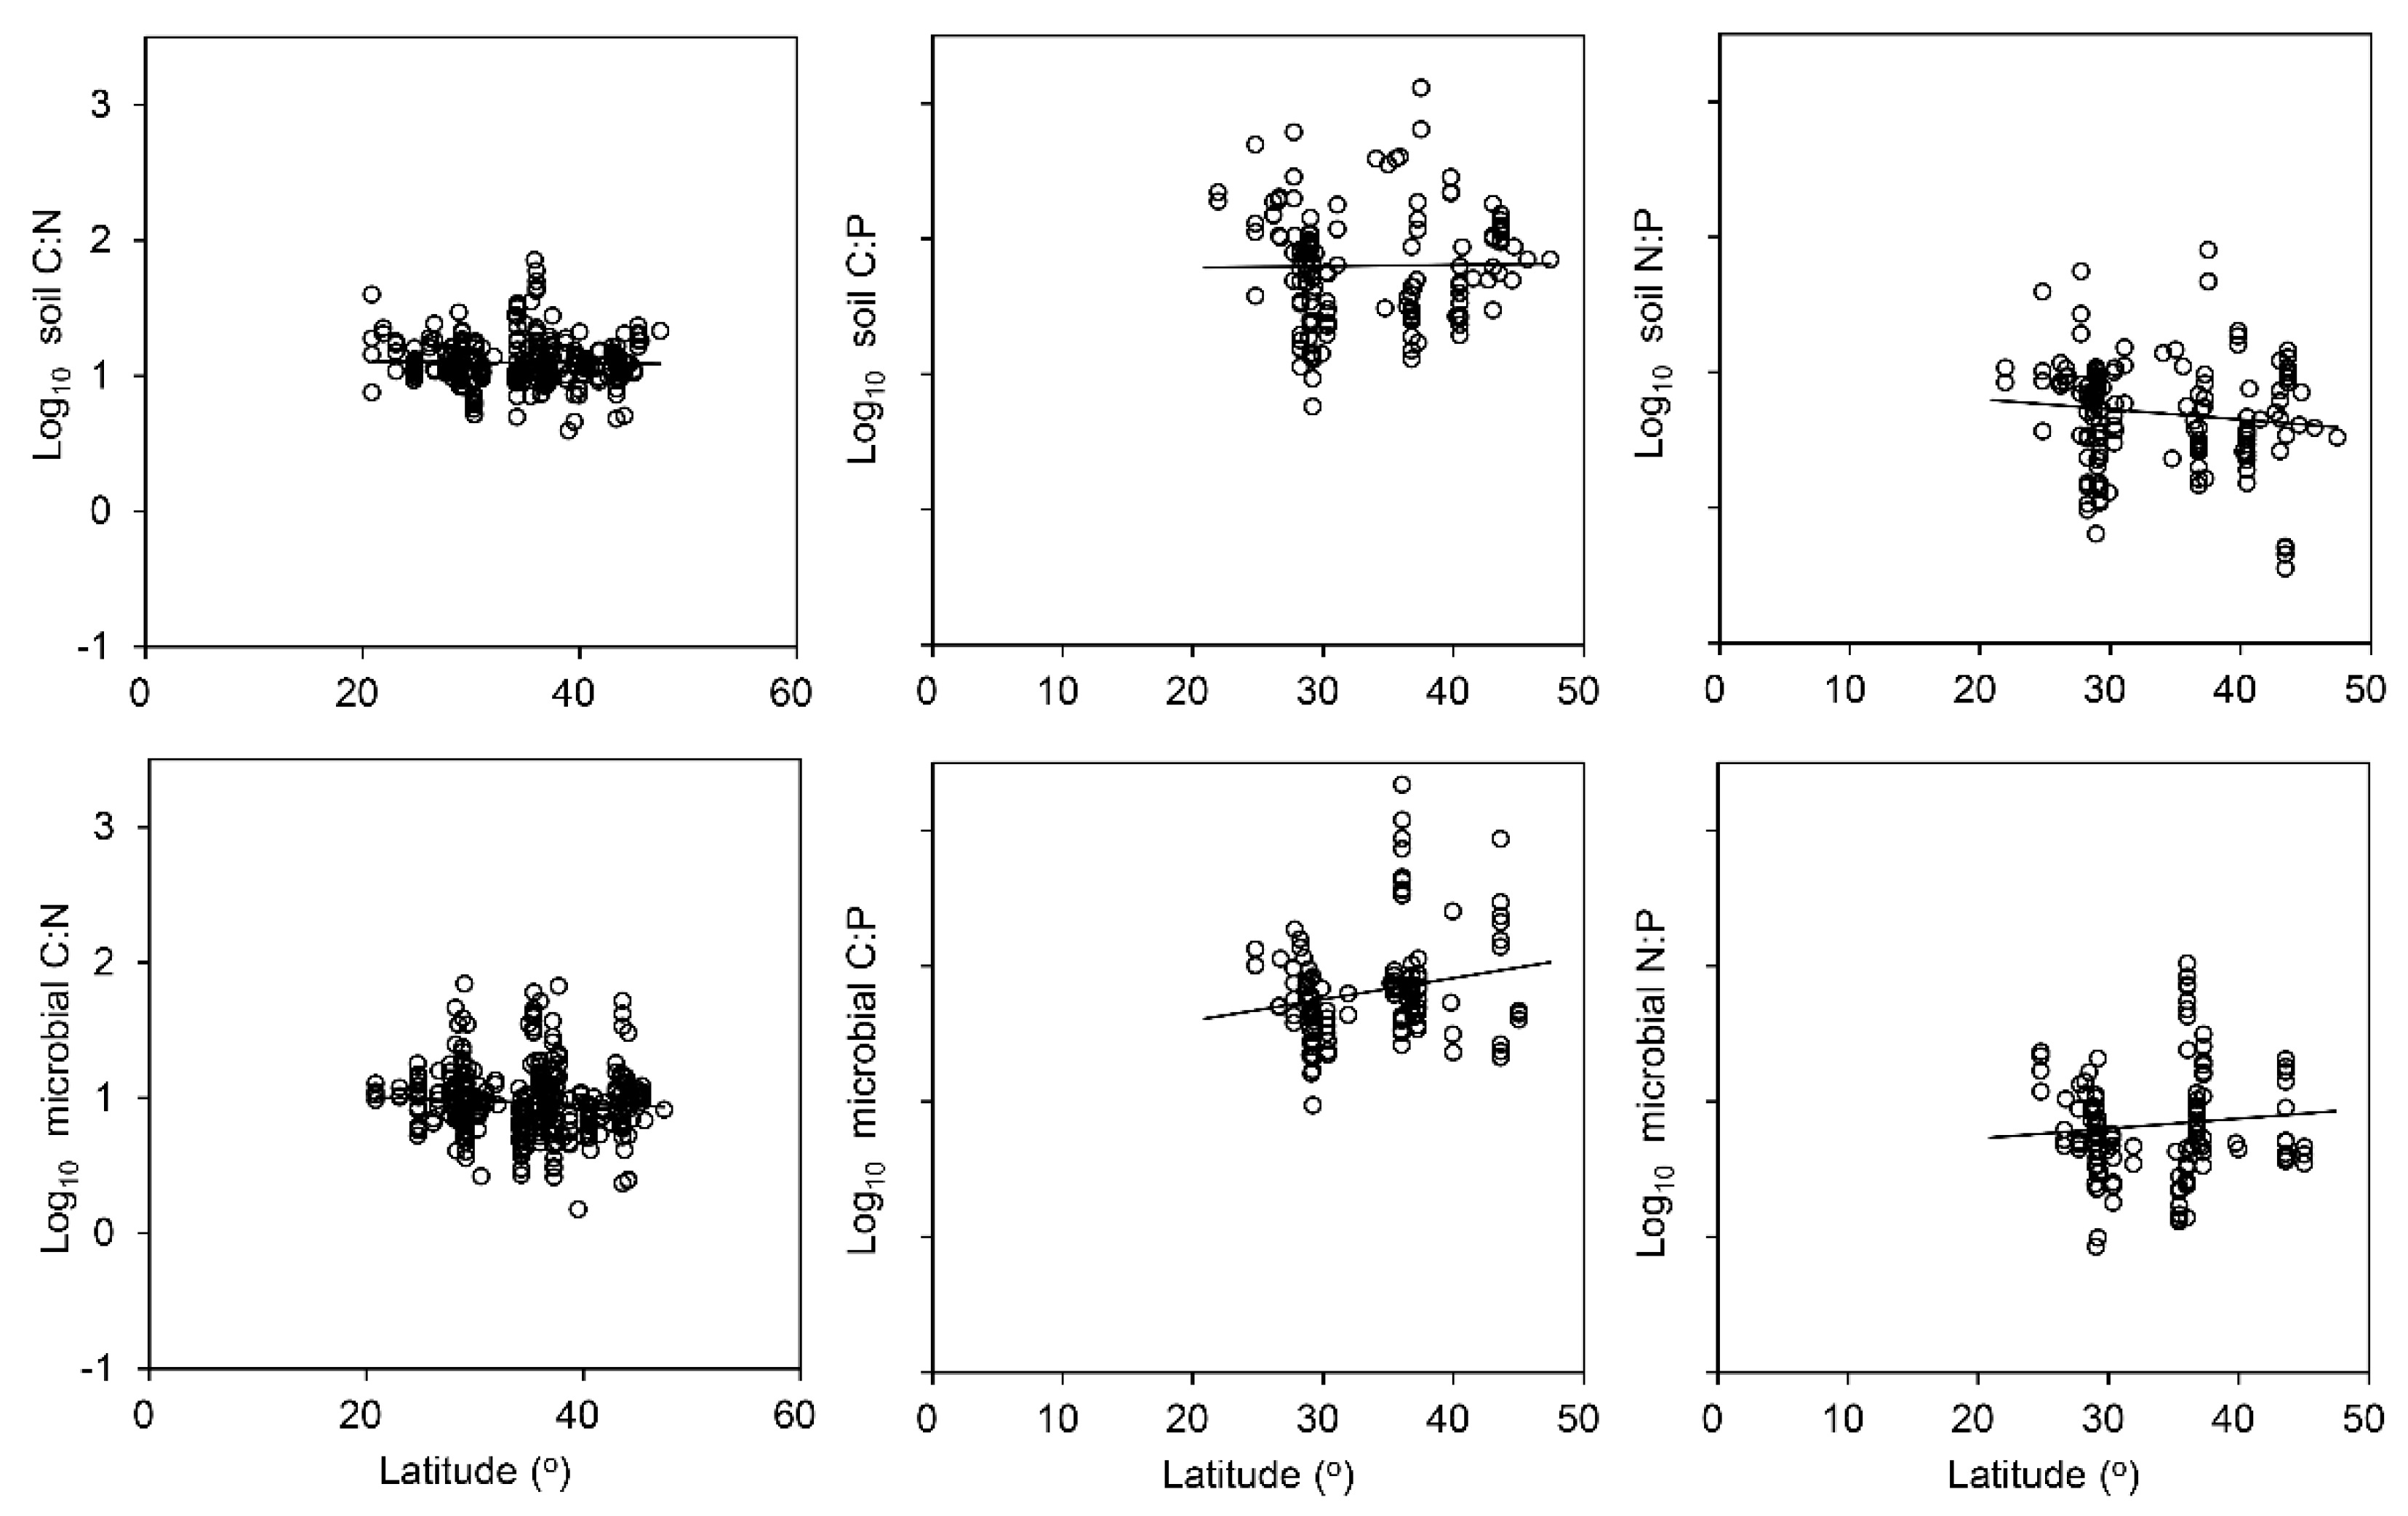
4.2. Factors Influencing C, N and P Ratios in the Soil and Soil Microbial Biomass
4.3. Soil Microbial Biomass N:P Ratio Can Be Used as Nutrient Limitation Indicator
4.4. Evaluation of the Stoichiometric Homeostasis of Soil Microbial Biomass C, N and P in Terrestrial Ecosystems in China
5. Conclusions
Supplementary Materials
Author Contributions
Funding
Acknowledgments
Conflicts of Interest
Appendix A


References
- Redfield, A.C. The biological control of chemical factors in the environment. Am. Sci. 1958, 46, 205–221. [Google Scholar]
- Field, C.B.; Behrenfeld, M.J.; Randerson, J.T.; Falkowski, P. Primary production of the biosphere: Integrating terrestrial and oceanic components. Science 1998, 281, 237–240. [Google Scholar] [CrossRef]
- Sterner, R.W.; Elser, J.J. Ecological Stoichiometry, the Biology of Elements from Molecules to the Biosphere; Princeton University Press: Princeton, NJ, USA, 2002. [Google Scholar]
- Cleveland, C.C.; Liptzin, D. C:N:P stoichiometry in soil, is there a “Redfield ratio” for the microbial biomass? Biogeochemistry 2007, 85, 235–252. [Google Scholar] [CrossRef]
- Tian, H.; Chen, G.; Zhang, C.; Melillo, J.M.; Hall, C.A.S. Pattern and variation of C:N:P ratios in China’s soils, a synthesis of observational data. Biogeochemistry 2010, 98, 139–151. [Google Scholar] [CrossRef]
- Yu, Q.; Elser, J.J.; He, N.; Wu, H.; Chen, Q.; Zhang, G.; Han, X. Stoichiometric homeostasis of vascular plants in the Inner Mongolia grassland. Oecologia 2011, 166, 1–10. [Google Scholar] [CrossRef] [PubMed]
- Xu, X.; Thornton, P.E.; Post, W.M. A global analysis of soil microbial biomass carbon, nitrogen and phosphorus in terrestrial ecosystems. Glob. Ecol. Biogeogr. 2013, 22, 737–749. [Google Scholar] [CrossRef]
- Li, P.; Yang, Y.; Han, W.; Fang, J. Global patterns of soil microbial nitrogen and phosphorus stoichiometry in forest ecosystems. Glob. Ecol. Biogeogr. 2014, 23, 979–987. [Google Scholar] [CrossRef]
- Fanin, N.; Fromin, N.; Barantal, S.; Stephan, H. Stoichiometric plasticity of microbial communities is similar between litter and soil in a tropical rainfores. Sci. Rep. 2017, 7, 12498. [Google Scholar] [CrossRef]
- Wright, C.J.; Coleman, D.C. Cross-site comparison of soil microbial biomass, soil nutrient status, and nematode trophic groups. Pedobiologia 2000, 44, 2–23. [Google Scholar] [CrossRef]
- Hessen, D.O. Too Much Energy? Ecology 2004, 85, 1177–1178. [Google Scholar] [CrossRef]
- Rhee, G.Y. Effects of N, P atomic ratios and nitrate limitation on algal growth, cell composition and nitrate uptake. Limnol. Oceanogr. 1978, 23, 10–25. [Google Scholar] [CrossRef]
- Makino, W.; Cotner, J.B.; Sterner, R.W.; Elser, J.J. Are bacteria more like plants or animals? Growth rate and resource dependence of bacterial C:N:P stoichiometry. Funct. Ecol. 2003, 17, 121–130. [Google Scholar] [CrossRef]
- Karimi, R.; Folt, C.L. Beyond macronutrients: Element variability and multielement stoichiometry in freshwater invertebrates. Ecol. Lett. 2006, 9, 1273–1283. [Google Scholar] [CrossRef] [PubMed]
- Jeyasingh, P.D.; Weider, L.J.; Sterner, R.W. Genetically–based trade–offs in response to stoichiometric food quality influence competition in a keystone aquatic herbivore. Ecol. Lett. 2009, 12, 1229–1237. [Google Scholar] [CrossRef]
- Yu, Q.; Chen, Q.; Elser, J.J.; He, N.; Wu, H.; Zhang, G.; Wu, J.; Bai, Y.; Han, X. Linking stoichiometric homeostasis with ecosystem structure, functioning, and stability. Ecol. Lett. 2010, 13, 1390–1399. [Google Scholar] [CrossRef]
- Demott, W.R.; Pape, B.J. Stoichiometry in an ecological context: Testing for links between Daphnia P–content, growth rate and habitat preference. Oecologia 2005, 142, 20–27. [Google Scholar] [CrossRef]
- Güsewell, S. N:P ratios in terrestrial plants: Variation and functional significance. New Phytol. 2004, 164, 243–266. [Google Scholar] [CrossRef]
- Persson, J.; Fink, P.; Goto, A.; Hood, J.M.; Jonas, J.; Kato, S. To be or not to be what you eat: Regulation of stoichiometric homeostasis among autotrophs and heterotrophs. Oikos 2010, 119, 741–751. [Google Scholar] [CrossRef]
- Yue, K.; Fornara, D.A.; Yang, W.; Peng, Y.; Li, Z.; Wu, F.; Peng, C.H. Effects of three global change drivers on terrestrial C:N:P stoichiometry: A global synthesis. Glob. Chang. Biol. 2017, 23, 2450–2463. [Google Scholar] [CrossRef]
- Walker, T.W.; Adams, A.F.R. Studies on soil organic matter. Soil Sci. 1958, 85, 307–318. [Google Scholar] [CrossRef]
- Vitousek, P.M. Nutrient Cycling and Limitation, Hawai’i as a Model System; Princeton University Press: Princeton, NJ, USA, 2004. [Google Scholar]
- Zhang, C.; Tian, H.; Liu, J.; Wang, S.; Liu, M.; Pan, S.; Shi, X. Pools and distributions of soil phosphorus in China. Glob. Biogeochem. Cycle 2005, 19, GB1020. [Google Scholar] [CrossRef]
- Hu, Y.; Wang, S.; Yan, S. Research advances on the factors influencing the activity and community structure of soil microorganism. Chin. J. Soil Sci. 2006, 37, 170–176, (In Chinese with English Abstract). [Google Scholar]
- Xu, M.; Li, X.; Cai, X.; Gai, J.; Li, X.; Christie, P.; Zhang, J. Soil microbial community structure and activity along a montane elevational gradient on the Tibetan Plateau. Eur. J. Soil Biol. 2014, 64, 6–14. [Google Scholar] [CrossRef]
- Aerts, R.; Chapin, F.S. The mineral nutrition of wild plants revisited, A re–evaluation of processes and patterns. Adv. Ecol. Res. 2000, 30, 1–67. [Google Scholar]
- Cleveland, C.C.; Townsend, A.R.; Schmidt, S.K. Phosphorus limitation of microbial processes in moist tropical forests, evidence from short–term laboratory incubations and field experiments. Ecosystems 2002, 5, 680–691. [Google Scholar] [CrossRef]
- Reich, P.B.; Oleksyn, J. Global patterns of plant leaf N and P in relation to temperature and latitude. Proc. Natl. Acad. Sci. USA 2004, 101, 11001–11006. [Google Scholar] [CrossRef] [Green Version]
- Townsend, A.R.; Cleveland, C.C.; Asner, G.P.; Bustamante, M.M. Controls over foliar N:P ratios in tropical rain forests. Ecology 2007, 88, 107–118. [Google Scholar] [CrossRef]
- Chen, Y.; Han, W.; Tang, L.; Tang, Z.; Fang, J. Leaf nitrogen and phosphorus concentrations of woody plants differ in responses to climate, soil and plant growth form. Ecography 2013, 36, 178–184. [Google Scholar] [CrossRef]
- Sterner, R.W.; Clasen, J.; Lampert, W.; Weisse, T. Carbon:phosphorus stoichiometry and food chain production. Ecol. Lett. 1998, 1, 146–150. [Google Scholar] [CrossRef]
- Shafik, H.M.; Herodek, S.; Presing, M.; Voros, L.; Balogh, K.V. Growth of Cyclotella meneghiniana Kutz. II. Growth and cell composition under different growth rates with different limiting nutrient. Ann. Limnol. Int. J. Liml. 1997, 33, 223–233. [Google Scholar] [CrossRef]


| Biomes | Corg (mmol kg−1) | Ntot (mmol kg−1) | Ptot (mmol kg−1) | Cmic (mmol kg−1) | Nmic (mmol kg−1) | Pmic (mmol kg−1) |
|---|---|---|---|---|---|---|
| Grassland | 1204.2 bc (1007.7–2371.7) | 127.0 b (103.0–151.1) | 20.2 b (14.7–25.7) | 29.1 b (25.4–32.7) | 3.3 b (2.9–3.8) | 0.6 b (0.4–0.9) |
| Forest | 952.7 ab (1161.9–1669.3) | 127.6 b (106.0–150.5) | 18.8 b (15.9–21.6) | 33.6 b (28.9–38.4) | 4.1 b (3.6–4.7) | 0.7 b (0.5–0.9) |
| Cropland | 1021.4 c (963.5–1154.9) | 91.5 c (83.1–100.0) | 22.3 b (20.0–24.5) | 16.8 c (15.2–18.4) | 2.6 c (2.3–3.0) | 0.3 b (0.2–0.5) |
| Desert | 391.8 d (220.9–562.7) | 31.8 d (18.1–45.46) | 11.6 c (7.3–15.9) | 9.8 d (6.7–12.8) | 1.5 d (1.0–2.0) | – |
| Wetland | 2225.6 a (1639.3–2371.7) | 185.6 a (145.1–226.0) | 56.2 a (31.1–81.4) | 65.4 a (42.9–87.9) | 7.4 a (4.2–10.6) | 1.1 a (0.6–1.5) |
| Bare land | 77.4 | 27.12 | – | 2.0 | 0.5 | 0.03 |
| Average | 1046.7 (972.1–1121.4) | 109.8 (100.5–119.2) | 23.0 (20.0–26.1) | 26.3 (24.1–28.6) | 3.4 (3.1–3.6) | 0.6 (0.5–0.7) |
| Biomes | Soil Elements | Soil Microbial Biomass | C:N:P | |||||
|---|---|---|---|---|---|---|---|---|
| C:N | C:P | N:P | CC:N:P | CC:N | CC:P | NN:P | ||
| Grassland | 12.1 a (11.3–12.9) | 78.0 a (47.7–108.3) | 6.5 a (4.7–8.0) | 85:7:1 | 9.5 a (8.4–10.6) | 86.7 a (49.8–123.7) | 8.2 a (5.2–11.2) | 78:8:1 |
| Forest | 13.5 a (12.5–14.5) | 61.3 ab (42.5–80.0) | 4.8 ab (3.8–5.7) | 68:5,1 | 8.3 a (7.8–8.9) | 54.2 a (47.6–60.8) | 6.0 a (5.2–6.8) | 50:6:1 |
| Cropland | 11.2 a (10.8–11.7) | 60.2 ab (52.9–67.5) | 5.4 ab (4.7–6.2) | 60:5:1 | 8.7 a (8.0–9.3) | 65.8 a (56.7–75.0) | 9.4 a (6.4–12.5) | 82:9:1 |
| Desert | 13.0 a (11.7–14.3) | 45.7 b (31.1–60.4) | 4.1 b (2.6–5.5) | 46:4:1 | 8.1 a (6.0–10.2) | – | – | – |
| Wetland | 11.3 a (10.0–12.7) | 68.1 ab (43.5–92.6) | 5.9 ab (3.8–8.0) | 67:6:1 | 8.8 a (6.4–11.1) | 55.6 a (43.9–67.3) | 6.4 a (4.6–8.1) | 56:6:1 |
| Bare land | 2.4 | – | – | – | 4.1 | – | – | – |
| Average | 12.2 (11.7–12.8) | 62.8 (54.8–70.6) | 5.4 (4.8–6.0) | 66:5:1 | 8.7 (8.3–9.1) | 64.0 (56.2–71.9) | 7.6 (6.4–8.7) | 66:8:1 |
| Biomes | HC | HN | HP | HC:N | HC:P | HN:P |
|---|---|---|---|---|---|---|
| Grassland | 3.33 | 5.00 | 1.33 | Strictly H | Strictly H | Strictly H |
| Forest | 1.89 | 1.67 | 1.54 | Strictly H | Strictly H | Strictly H |
| Cropland | 1.01 | 1.23 | 1.29 | Strictly H | 2.27 | Strictly H |
| Wetland | 1.03 | < 1.00 | 2.27 | 1.67 | Strictly H | 2.17 |
| Desert | Strictly H | Strictly H | - | <1.00 | - | - |
| Study Area | C:N | C:P | N:P | C:N:P | References |
|---|---|---|---|---|---|
| Soil | |||||
| Global | 14.3 ± 0.5 * | 186.0 ± 12.9 * | 13.1 ± 0.8 * | 186:13:1 | Cleveland & Liptzin (2007) |
| China | 14.4 ± 0.4* | 136 ± 11 * | 9.3 ± 0.7 * | 134:9:1 | Tian et al. (2010) |
| Global | 16.4 * | 286.5 * | 17.5 * | 287:17:1 | Xu et al. (2013) |
| China | 12.2 | 62.8 | 5.4 | 66:5:1 | This study |
| Microbial biomass | |||||
| Global | 8.6 ± 0.3 | 59.5 ± 3.6 | 6.9 ± 0.4 | 60:7:1 | Cleveland & Liptzin (2007) |
| Global | 7.6 * | 42.4 * | 5.6 * | 42:6:1 | Xu et al. (2013) |
| China | 8.7 | 64.0 | 7.6 | 66:8:1 | This study |
© 2019 by the authors. Licensee MDPI, Basel, Switzerland. This article is an open access article distributed under the terms and conditions of the Creative Commons Attribution (CC BY) license (http://creativecommons.org/licenses/by/4.0/).
Share and Cite
Xue, H.; Lan, X.; Liang, H.; Zhang, Q. Characteristics and Environmental Factors of Stoichiometric Homeostasis of Soil Microbial Biomass Carbon, Nitrogen and Phosphorus in China. Sustainability 2019, 11, 2804. https://doi.org/10.3390/su11102804
Xue H, Lan X, Liang H, Zhang Q. Characteristics and Environmental Factors of Stoichiometric Homeostasis of Soil Microbial Biomass Carbon, Nitrogen and Phosphorus in China. Sustainability. 2019; 11(10):2804. https://doi.org/10.3390/su11102804
Chicago/Turabian StyleXue, Haili, Xiao Lan, Haoguang Liang, and Qin Zhang. 2019. "Characteristics and Environmental Factors of Stoichiometric Homeostasis of Soil Microbial Biomass Carbon, Nitrogen and Phosphorus in China" Sustainability 11, no. 10: 2804. https://doi.org/10.3390/su11102804
APA StyleXue, H., Lan, X., Liang, H., & Zhang, Q. (2019). Characteristics and Environmental Factors of Stoichiometric Homeostasis of Soil Microbial Biomass Carbon, Nitrogen and Phosphorus in China. Sustainability, 11(10), 2804. https://doi.org/10.3390/su11102804


