A System Dynamics Model for CO2 Mitigation Strategies at a Container Seaport
Abstract
1. Introduction
2. Literature Review
2.1. The Integrity and Dynamic Aspects
2.2. The CO2 EmissionsSystem Dynamics Modeling
2.3. Managerial Perspective of CO2 Emissions Estimation
3. Methodology
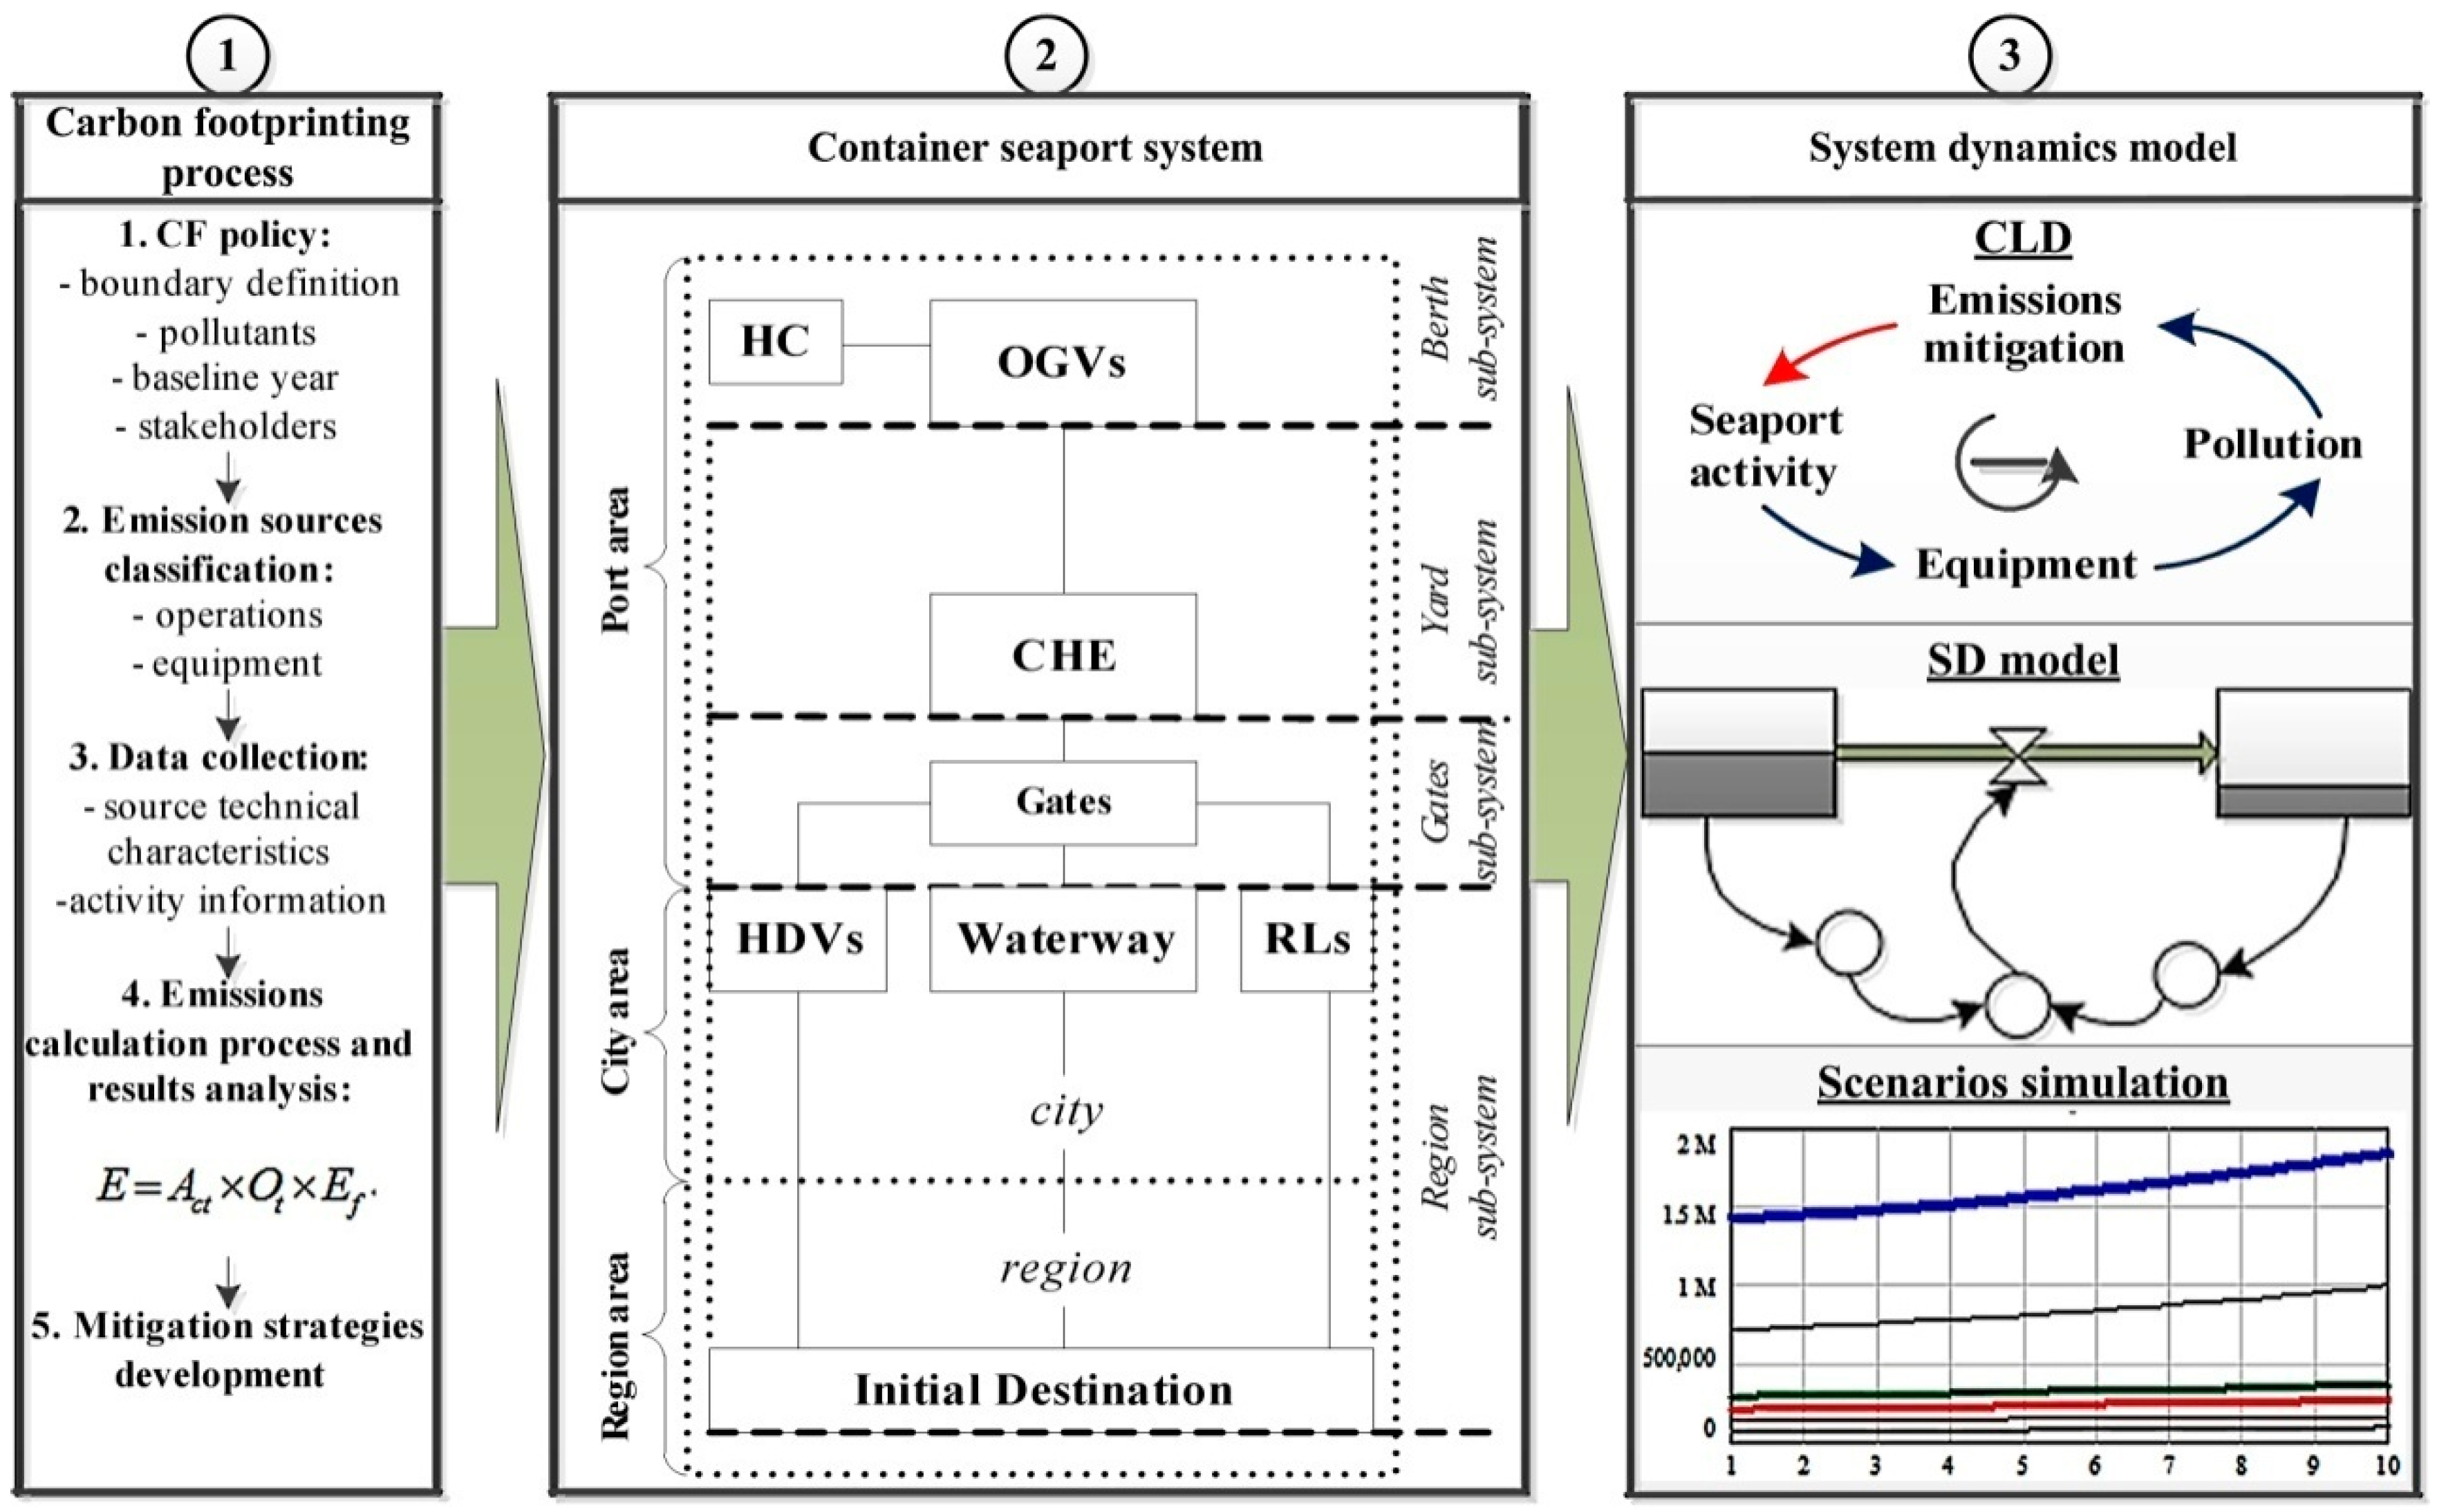
3.1. The Carbon Foot-Printing Process
3.2. The Container Seaport System
3.3. The System Dynamics Method
4. System Dynamics Model
- 1)
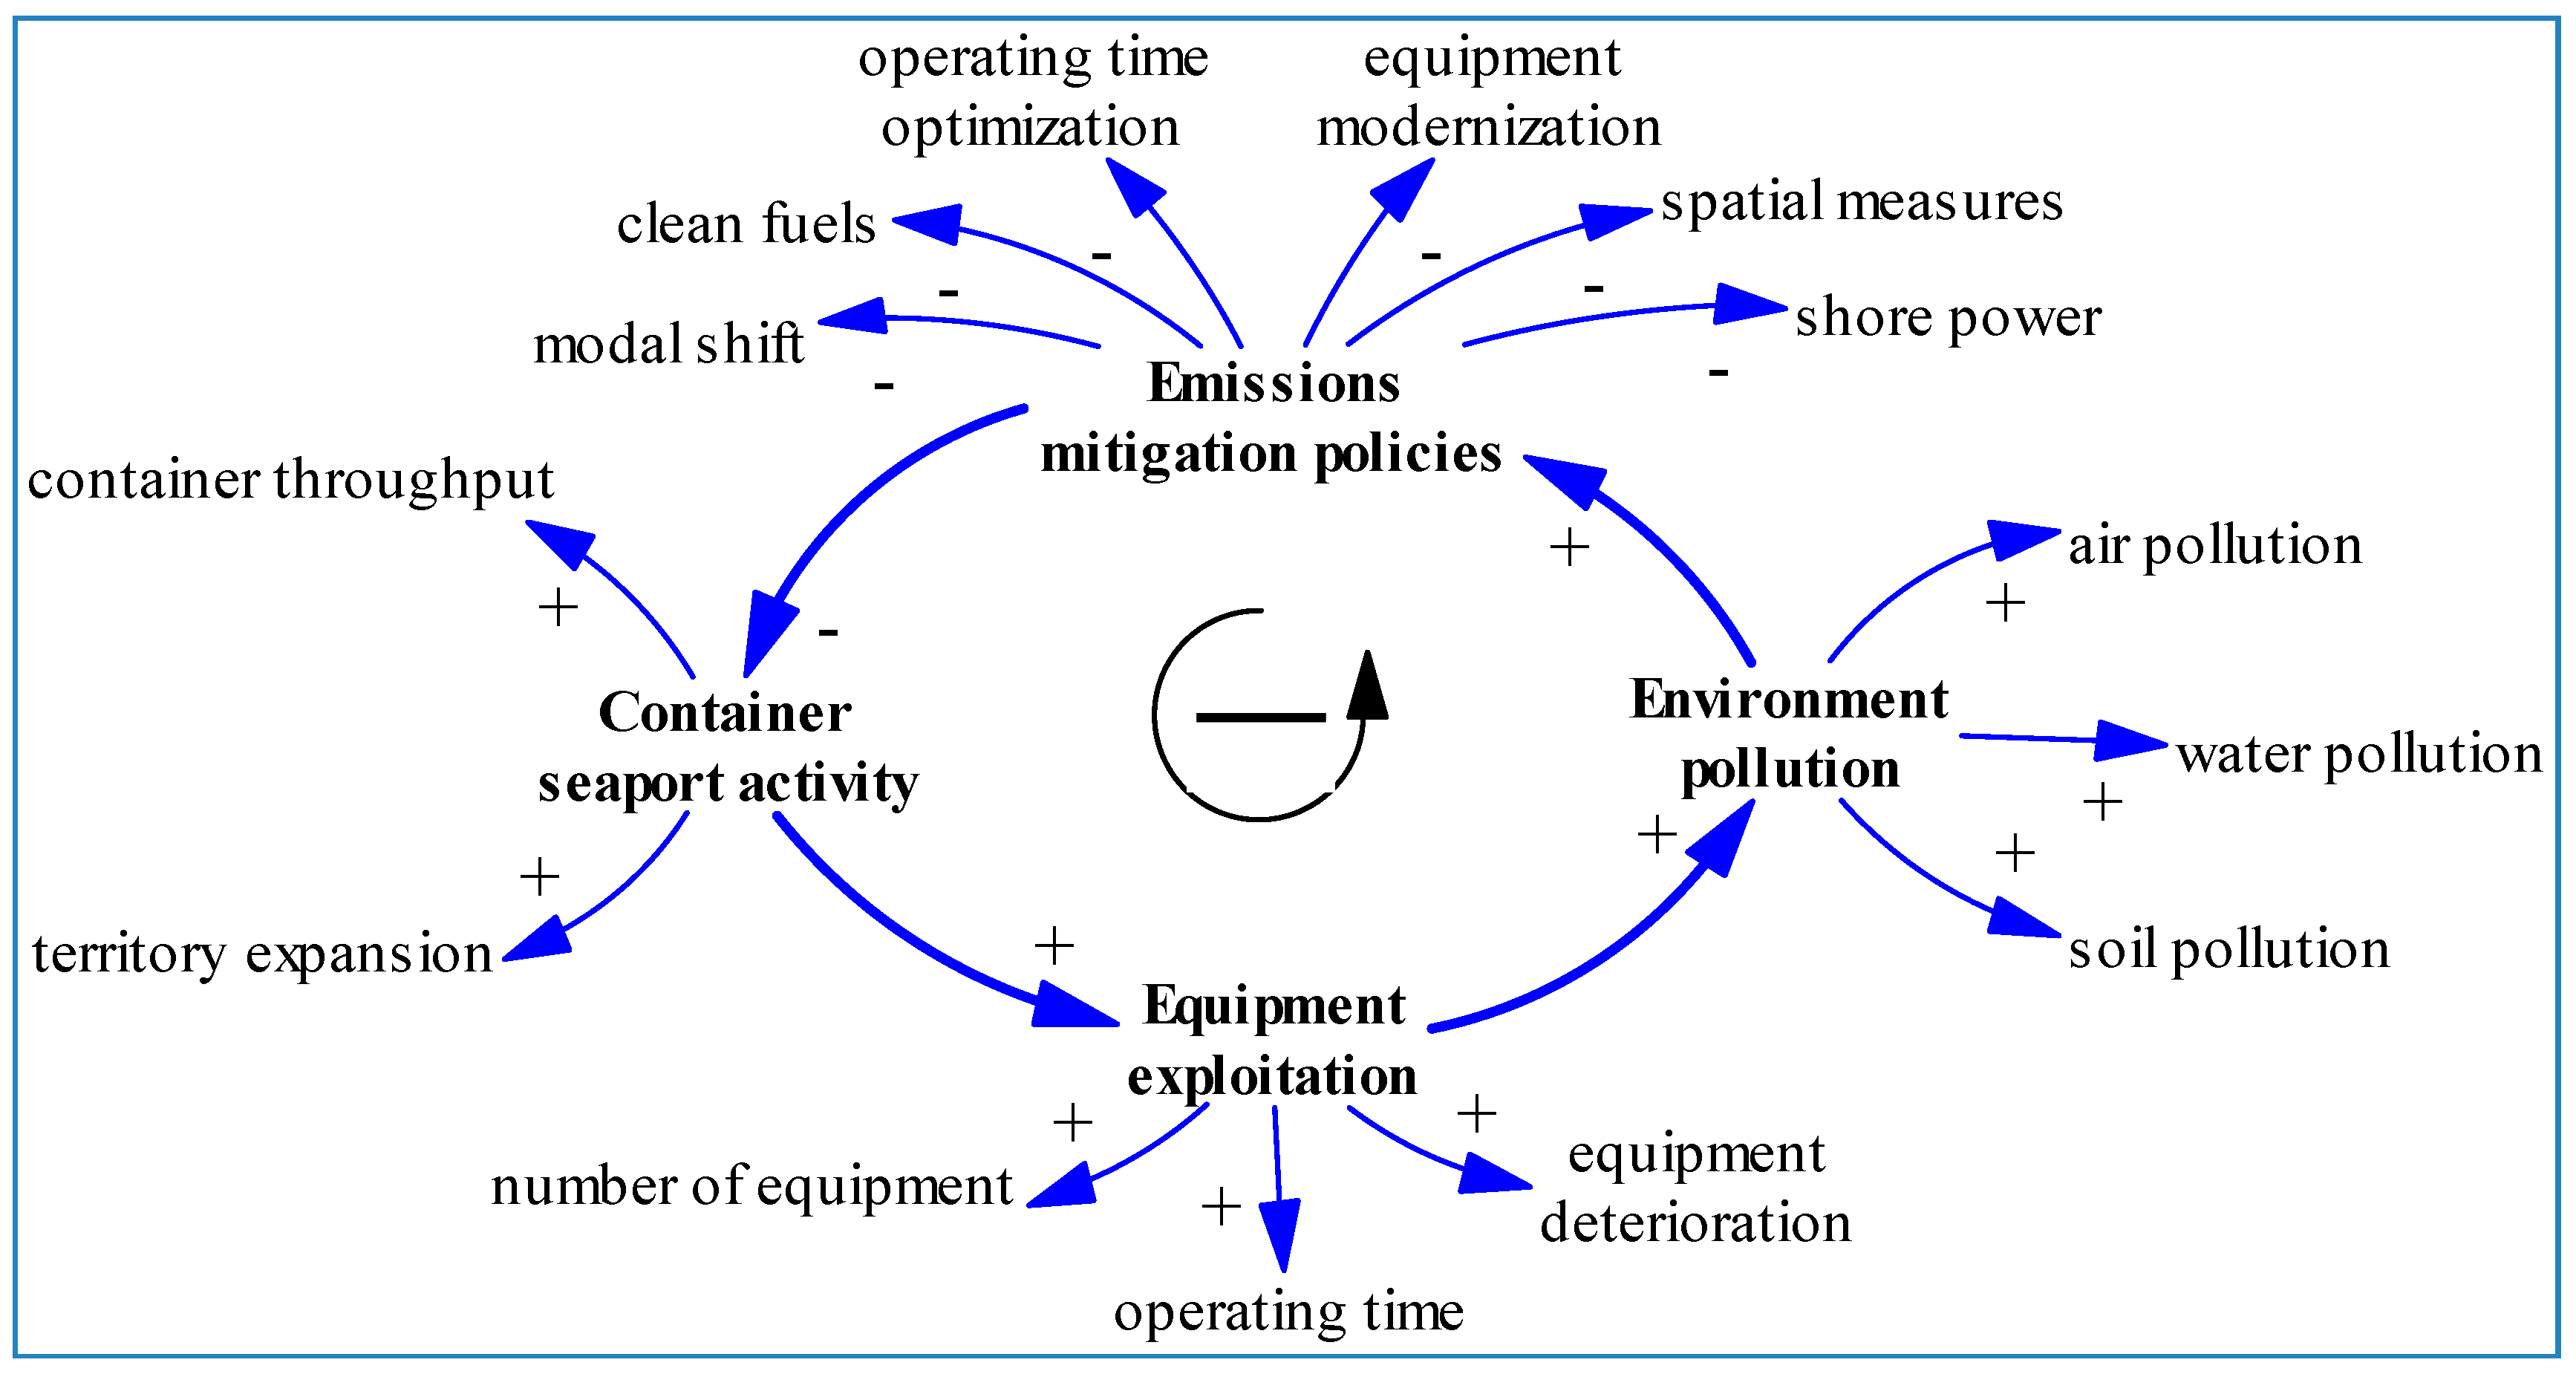
- Taking into consideration international trade growth, container throughput will constantly increase during the next decade. It is not possible to decrease CO2 emissions merely by decreasing container throughput.
- 2)
- Container throughput increases will intensify CS operations such as hoteling, loading, storage, and road and rail transportation. The number of equipment will increase correspondingly.
- 3)
- Container throughput increases also result in territory expansion and the exploitation of the road–rail infrastructure in the region; CS executives will need the additional space for the yard storage and the initial hub location might be changed. CS executives will also plan to develop multimodal transportation by increasing the share of the railway mode.
- 4)
- CS executives will plan to implement several mitigation strategies such as spatial measures, operating time optimization, equipment modernization, and modal shift to decrease CO2 emissions from CS activity.
- 5)
- They will need to evaluate the effectiveness of the mitigation strategies according to the following criteria: the amount of CO2 emissions they decrease; technological and operational availability; and financial estimation. CS executives will need to use some mechanisms to evaluate the mitigation strategies. The suggested model provides the simulation of one criterion—the amount of CO2 emissions.
- 6)
- The amount of CO2 emissions is limited by the CS’s maximum capacity.
- 7)
- CS executives will set the target: to decrease the amount of CO2 emissions up to 20% by the year 2026.
5. Scenarios Simulation
5.1. Qingdao Port Case
5.2. Scenarios’Results and Analysis
6. Results and Discussion
6.1. Academic Implications
6.2. Managerial Implications
6.3. Model Extrapolation and Future Applications
7. Conclusions
Author Contributions
Funding
Conflicts of Interest
Glossary
| CS | Container seaport |
| CF | Carbon foot-printing |
| GHG | Greenhouse gas |
| CO2 | Carbon dioxide |
| CO2E | Carbon dioxide equivalent |
| SD | System dynamics |
| OGV | Ocean going vessel |
| HC | Harbor craft |
| CHE | Cargo-handling equipment |
| HDV | Heavy-duty vehicle |
| RL | Railroad locomotive |
| CLD | Causal loop diagram |
| SDM | System dynamics model |
| TEU | Twenty-foot equivalent unit |
References
- Yang, Z.; Lun, V.; Lagoudis, I.N.; Lee, P.T.W. Container transportation: Resilience and sustainability. Transp. Res. Part D 2018, 61, 420–422. [Google Scholar] [CrossRef]
- Mamatok, Y.; Chun, J. The Influence of Seaport Operations on the Coastal City Environment. Low-Carbon City and New-Type Urbanization. In Environmental Scienceand Engineering; Springer: Berlin, Germany, 2015; pp. 177–193. [Google Scholar] [CrossRef]
- Stechemesser, K.; Guenther, E. Carbon accounting: A systematic literature review. J. Clean. Prod. 2012, 36, 17–38. [Google Scholar] [CrossRef]
- World Ports Climate Initiative. Carbon Footprinting for Ports. Guidance Document. Prepared by Carbon Footprint Working Group, LosAngeles. 2010. Available online: http://wpci.iaphworldports.org/data/docs/carbon-footprinting/PV_DRAFT_WPCI_Carbon_Footprinting_Guidance_Doc-June-30-2010_scg.pdf (accessed on 5 December 2018).
- Portof Los Angeles. Inventory of Air Emissions. Starcrest Consulting Group, Los Angeles. 2016. Available online: https://kentico.portoflosangeles.org/getmedia/644d6f4c-77f7-4eb0-b05b-df4c0fea1295/2016_Air_Emissions_Inventory (accessed on 7 January 2019).
- Portof Rotterdam. Building the Sustainable Future. Portof Rotterdam Authority Annual Report, Rotterdam. 2016. Available online: https://www.portofrotterdam.com/sites/default/files/highlights-annual-report-2016-port-of-rotterdam-authority.pdf?token=ZgdJkJy7 (accessed on 29 January 2019).
- Chang, Y.T.; Song, Y.; Roh, Y. Assessing greenhouse gas emissions from port vessel operations at the Portof Incheon. Transp. Res. Part D 2013, 25, 1–4. [Google Scholar] [CrossRef]
- Yang, Y.C.; Lin, C.L. Performance analysis of cargo-handling equipment from a green container terminal perspective. Transp. Res. Part D 2013, 23, 9–11. [Google Scholar] [CrossRef]
- Carlo, H.J.; Vis, I.F.A.; Roodbergen, K.J. Transport operations in container terminals: Literature overview, trends, research directions and classification scheme. Eur. J. Oper. Res. 2014, 236, 1–13. [Google Scholar] [CrossRef]
- Caballini, C.; Sacone, S.; Siri, S. The port as a system of systems: A System Dynamics simulation approach. In Proceedings of the 2012 7th International Conference on System of Systems Engineering (SoSE), Genova, Italy, 16–19 July 2013; pp. 191–196. [Google Scholar] [CrossRef]
- Mamatok, Y.; Chun, J. An integrated framework for carbon footprinting at container seaports: The case study of a Chinese port. Marit. Policy Manag. 2017, 44, 1–19. [Google Scholar] [CrossRef]
- Vuuren, D.P.V.; Hoogwijk, M.; Barker, T.; Riahi, K.; Boeters, S.; Chateau, J.; Scrieciu, S.; van Vliet, J.; Masui, T.; Blok, K.; et al. Comparison of top-down and bottom-up estimates of sectoral and regional greenhouse gas emission reduction potentials. Energy Policy 2009, 37, 5125–5139. [Google Scholar] [CrossRef]
- Song, D.P.; Xu, J. An operational activity-based method to estimate CO2 emissions from container shipping considering empty container repositioning. Transp. Res. Part D 2012, 17, 91–96. [Google Scholar] [CrossRef]
- Rao, N.; Mcm, A.F.; Martins, F.G.; Siv, S. The activity-based methodology to assess ship emissions—A view. Environ. Pollut. 2017, 231, 87. [Google Scholar] [CrossRef]
- Nunhes, T.V.; Vilamitjana, M.B.; Oliveira, O.J. Guiding principles of integrated management systems: Towards unifying a starting point for researchers and practitioners. J. Clean. Prod. 2018, 210, 977–993. [Google Scholar] [CrossRef]
- Urbaniec, K.; Mikulčić, H.; Wang, Y.; Duić, N. System integration is a necessity for sustainable development. J. Clean. Prod. 2018, 195. [Google Scholar] [CrossRef]
- Cantillo, V. A framework to evaluate particulate matter emissions in bulk material ports: Case study of Colombian coal terminals. Marit. Policy Manag. 2015, 42, 335–361. [Google Scholar] [CrossRef]
- Acciaro, M.; Vanelslander, T.; Sys, C.; Ferrari, C.; Roumboutsos, A.; Giuliano, G.; Siu Lee Jasmine, L.; Kapros, S. Environmental sustainability in seaports: A framework for successful innovation. Marit. Policy Manag. 2014, 41, 480–500. [Google Scholar] [CrossRef]
- Lam, J.S.L.; Notteboom, T. The greening of ports: A comparison of port management tools used by leading ports in Asia and Europe. Transp. Rev. 2014, 34, 169–189. [Google Scholar] [CrossRef]
- Shepherd, S.P. A review of system dynamics models applied in transportation. Transp. B Transp. Dyn. 2014, 2, 83–105. [Google Scholar] [CrossRef]
- Hou, L.; Geerlings, H. Dynamics in sustainable port and hinterland operations: A conceptual framework and simulation of sustainability measures and their effectiveness, based on an application to the Port of Shanghai. J. Clean. Prod. 2016, 135, 449–456. [Google Scholar] [CrossRef]
- Mena-Nieto, A.; Meñaca-Guerrero, C.; Osa, B.R.D.L.; Bellido-Odriozola, M. Application of the System Dynamics Methodology for Modeling and Simulation of the Greenhouse gas Emissions (GHG) in Cartagena de Indias (Colombia); Asociación Española De Ingeniería De ProyectosAeipro: Badajoz, Spain, 2010; pp. 260–277. [Google Scholar]
- Oztanriseven, F.; Pérez-Lespier, L.; Long, S.; Nachtmann, H. A Review of System Dynamics in Maritime Transportation. In Proceedings of the 2014 Industrial and Systems Engineering Research Conference, Montréal, QC, Canada, 31 May–3 June 2014. [Google Scholar]
- Sim, J. A carbon emission evaluation model for a container terminal. J. Clean. Prod. 2018, 186, 526–533. [Google Scholar] [CrossRef]
- Geng, X.; Wen, Y.; Zhou, C.; Xiao, C. Establishment of the Sustainable Ecosystem for the Regional Shipping Industry Based on System Dynamics. Sustainability 2017, 9, 742. [Google Scholar] [CrossRef]
- Di Vaio, A.; Varriale, L.; Trujillo, L. Key performance indicators for developing environmentally sustainable and energy efficient ports: Evidence from Italy. Energy Policy 2018, 122, 229–240. [Google Scholar] [CrossRef]
- Di Vaio, A.; Varriale, L.; Alvino, F. Management Control Systems in port waste management: Evidence fromItaly. Util. Policy 2019, 56, 127–135. [Google Scholar] [CrossRef]
- Di Vaio, A.; Varriale, L. Management Innovation for Environmental Sustainability in Seaports: Managerial Accounting Instruments and Training for Competitive Green Ports beyond the Regulation. Sustainability 2018, 10, 783. [Google Scholar] [CrossRef]
- Abdel-Fattah, A.K.; El-Tawil, A.B.; Harraz, N.A. An Integrated Operational Research and System Dynamics Approach for Planning Decisions in Container Terminals. World Acad. Sci. Eng. Technol. Int. J. Ind. Sci. Eng. 2013, 7, 459–465. [Google Scholar]
- Linton, C.; Grantmuller, S.; Gale, W.F. Approaches and techniques for modelling CO2 emissions from road transport. Transp. Rev. 2015, 35, 533–553. [Google Scholar] [CrossRef]
- Qingdao Qianwan Container Terminal. Safety Environment Management Publications, QQCT Ltd. 2017. Available online: http://en.qqct.com.cn/companyprofile/index.jhtml (accessed on 30 October 2018).
- Kazak, J.K.; Hoof, J.V. Decision Support Systems for a sustainable management of the indoor and built environment. Indoor Built Environ. 2018, 27, 1303–1306. [Google Scholar] [CrossRef]
- Schipper, C.A.; Vreugdenhil, H.; Jong, M.P.C. A sustainability assessment of ports and port-city plans: Comparing ambitions with achievements. Transp. Res. Part D 2017, 57, 84–111. [Google Scholar] [CrossRef]
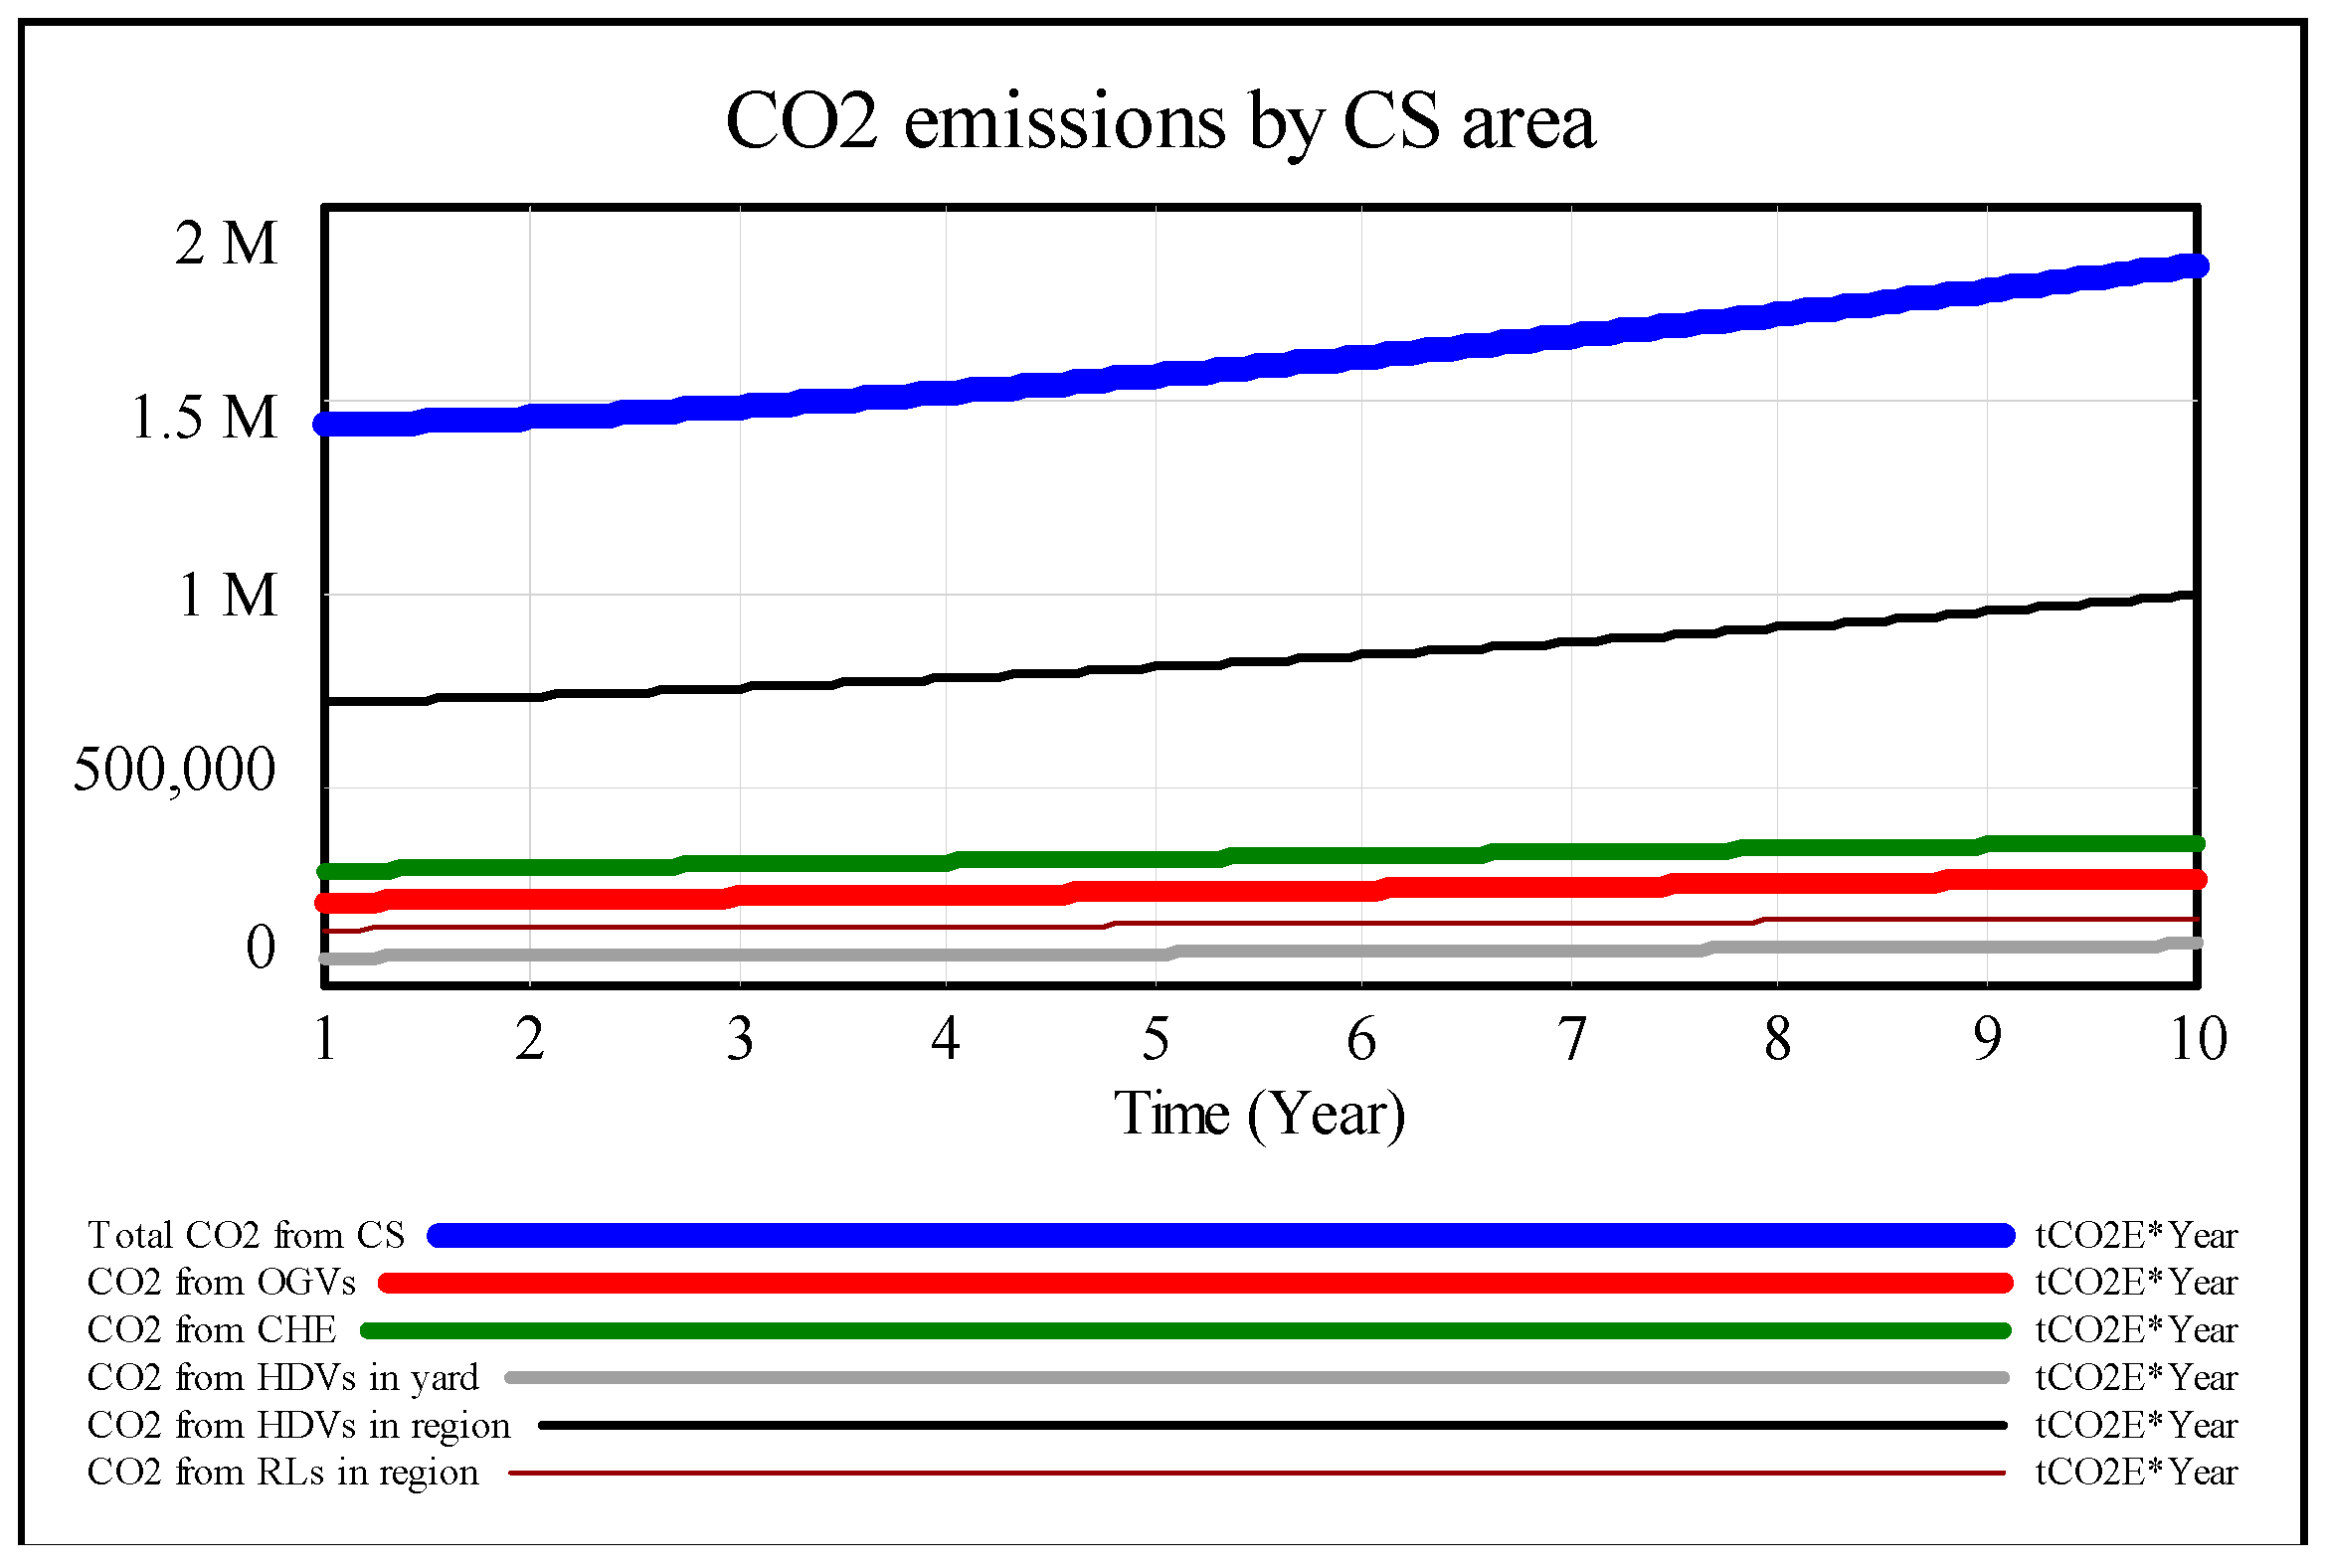
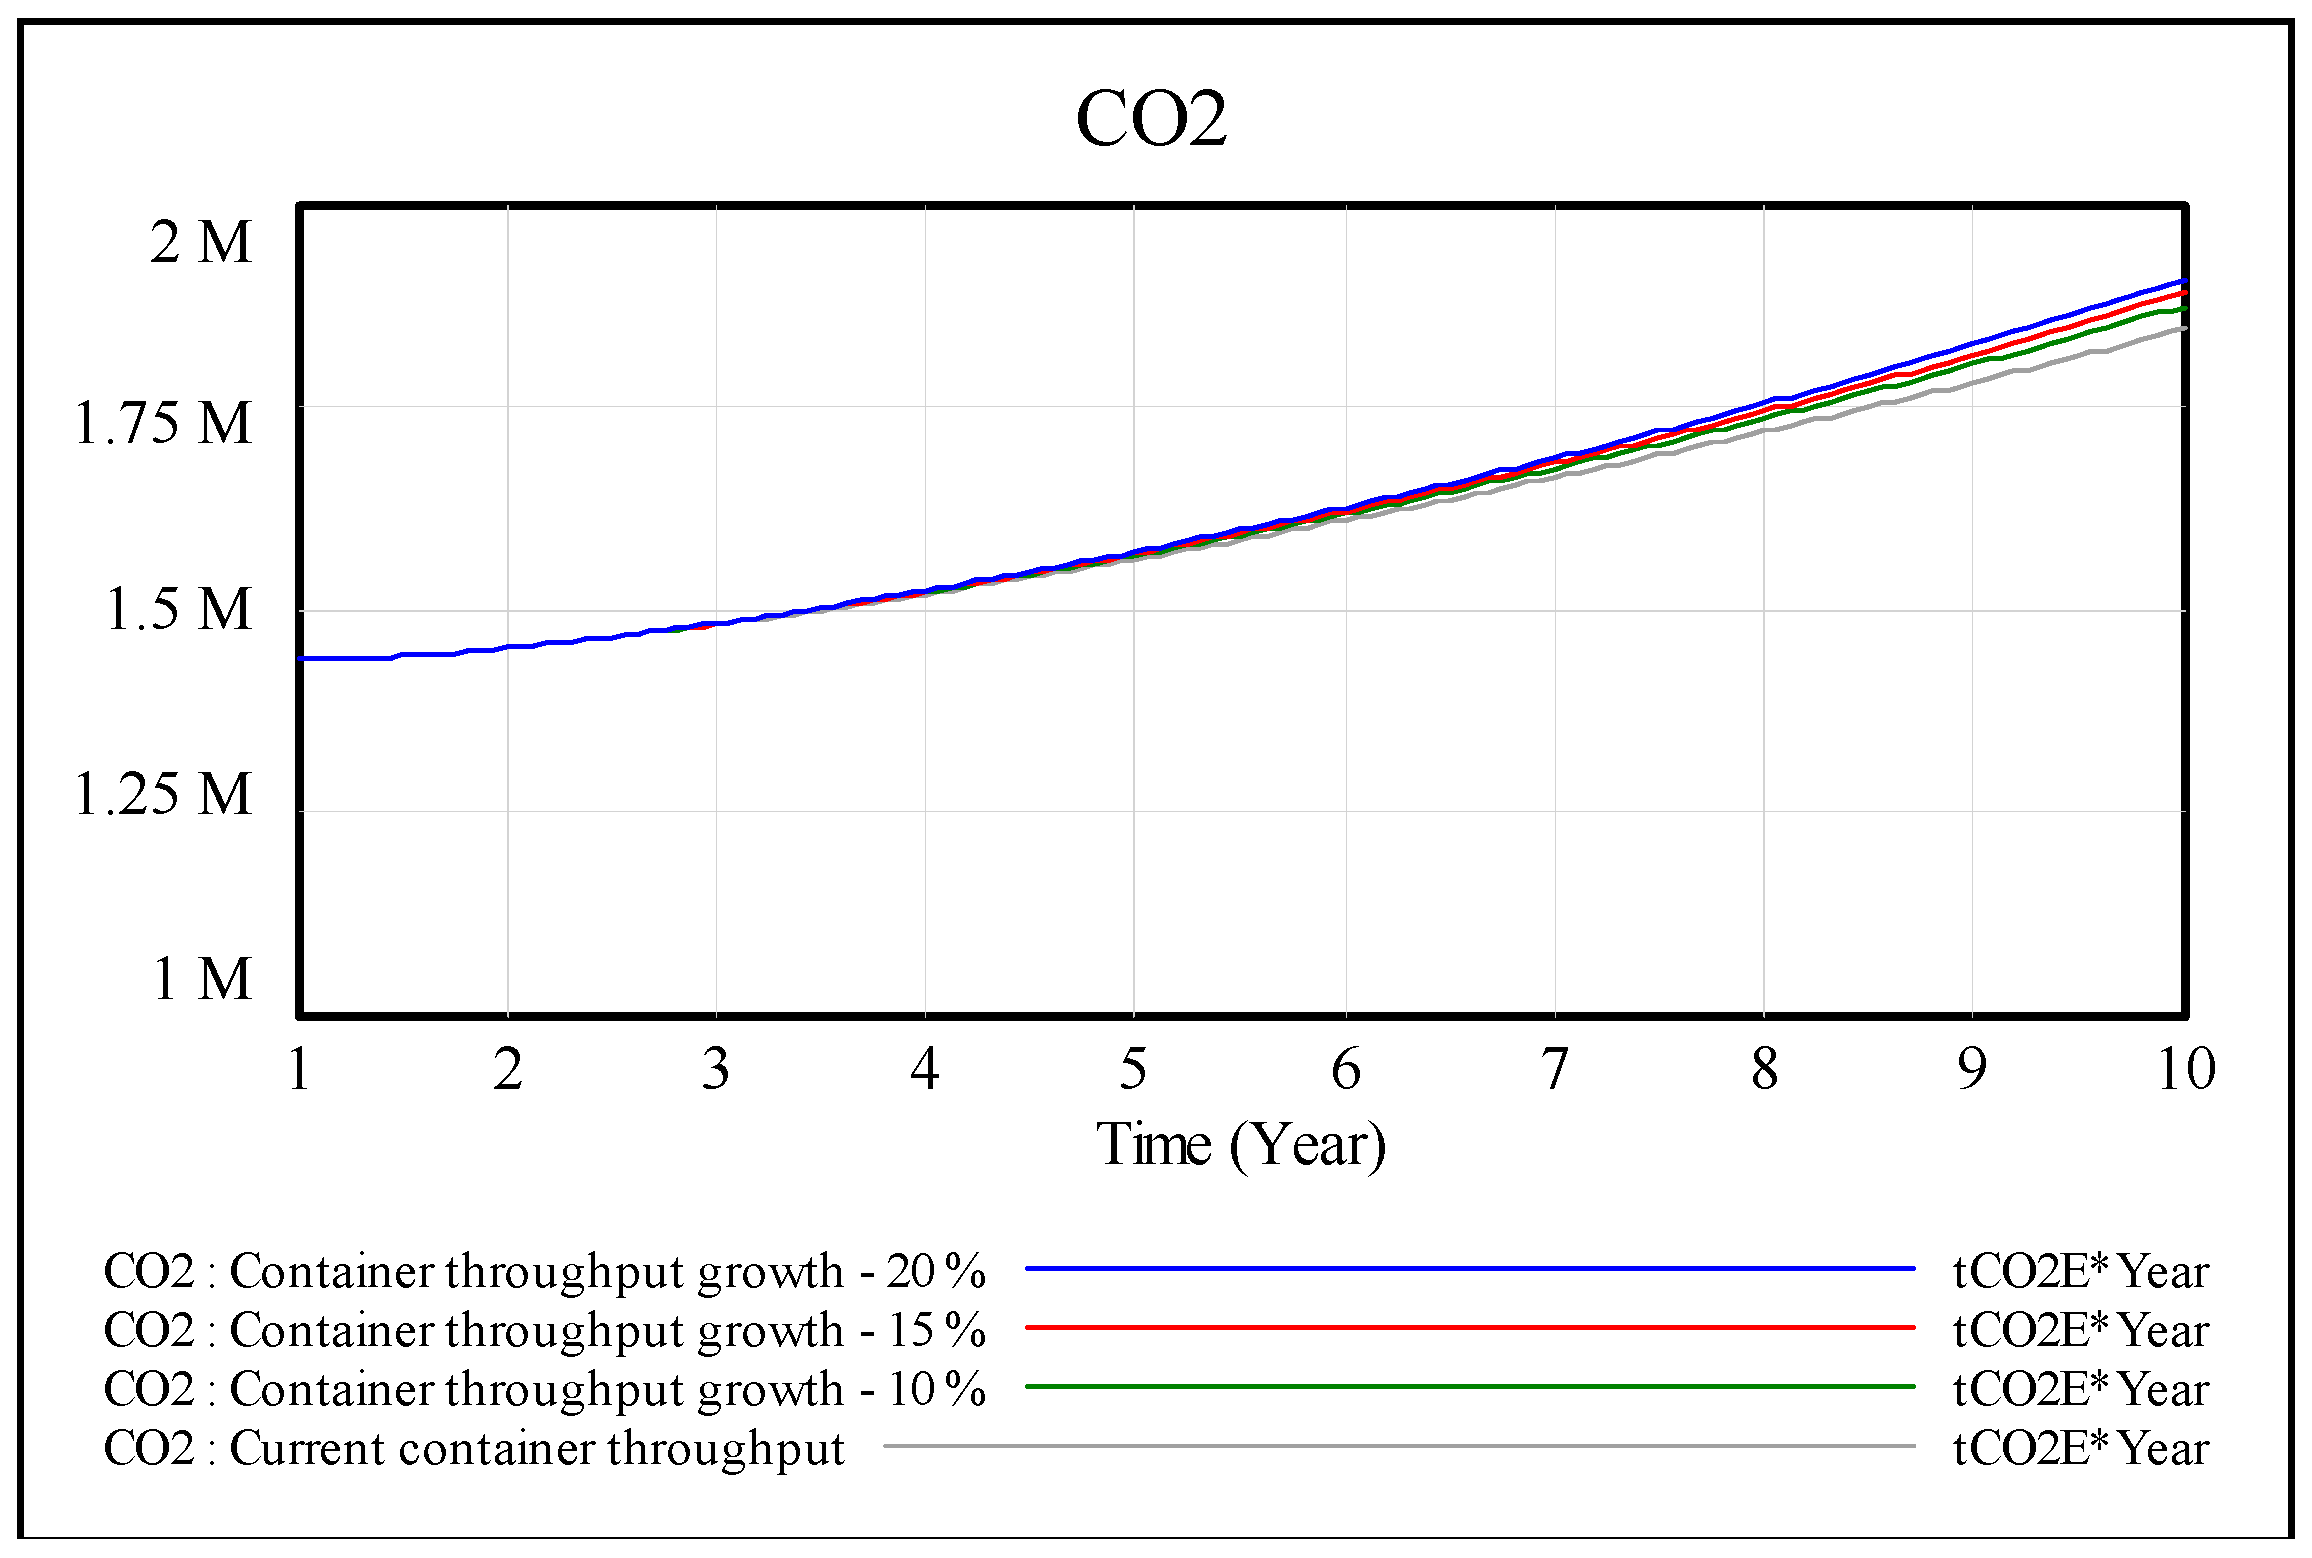

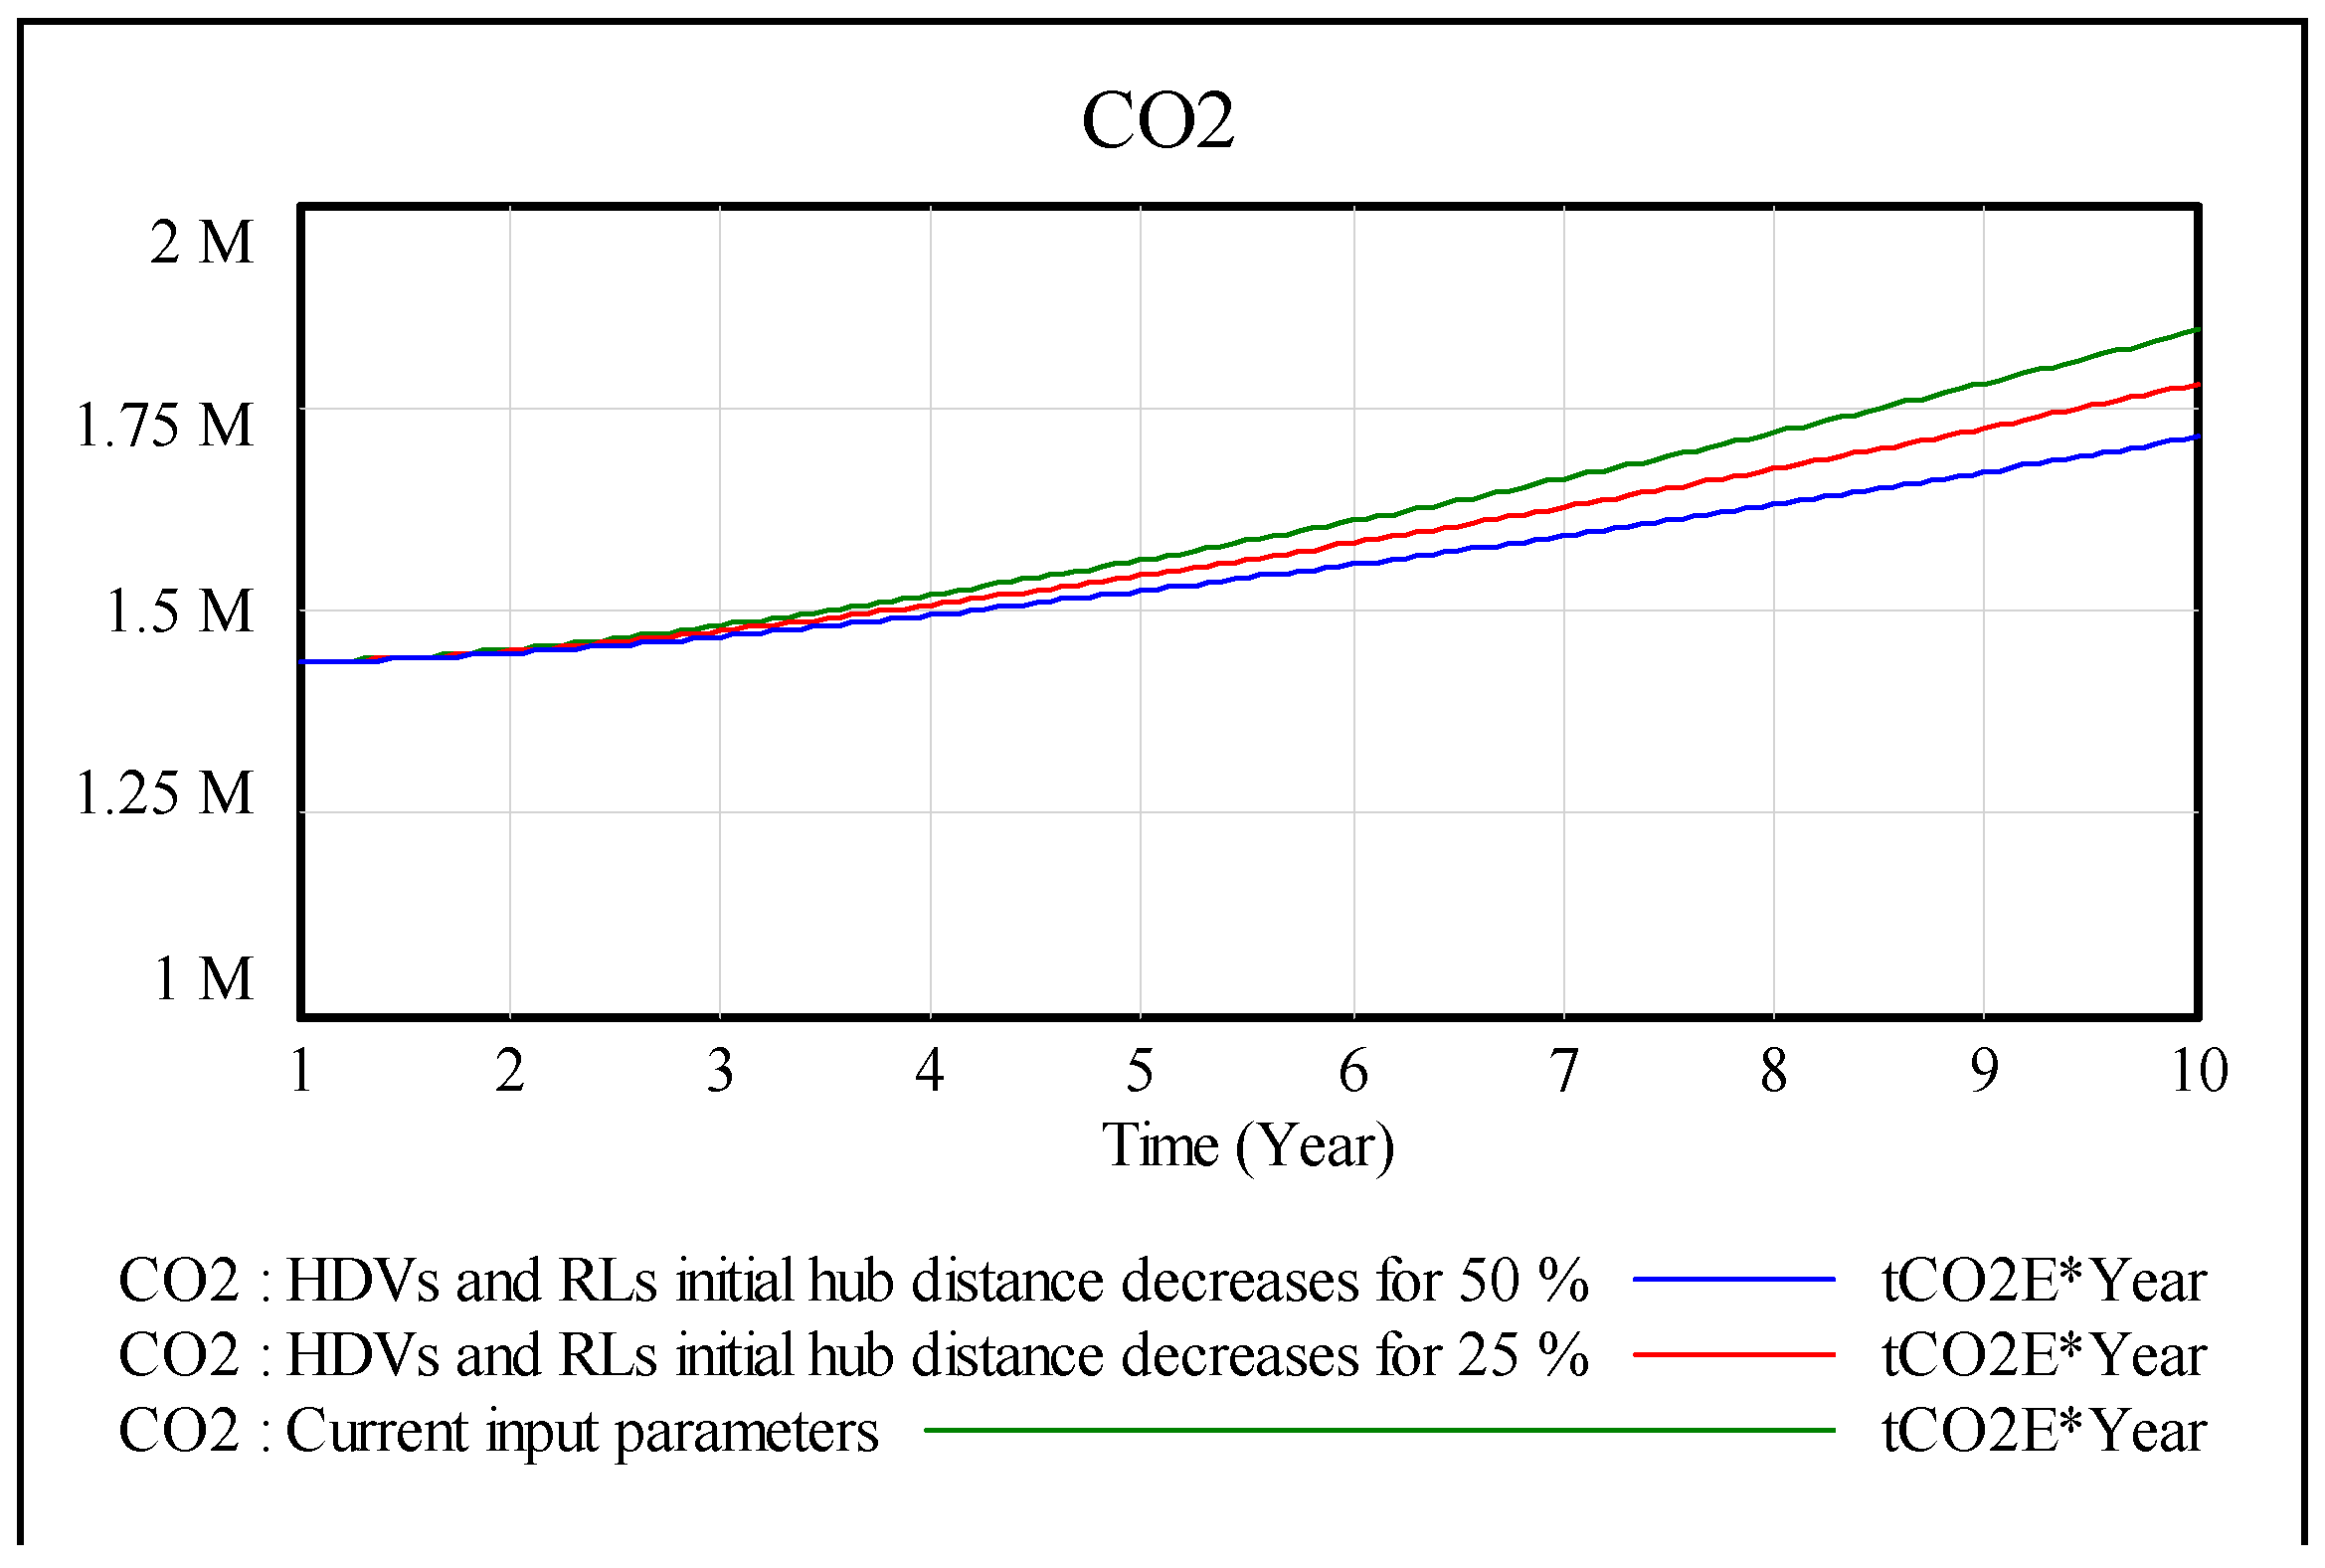
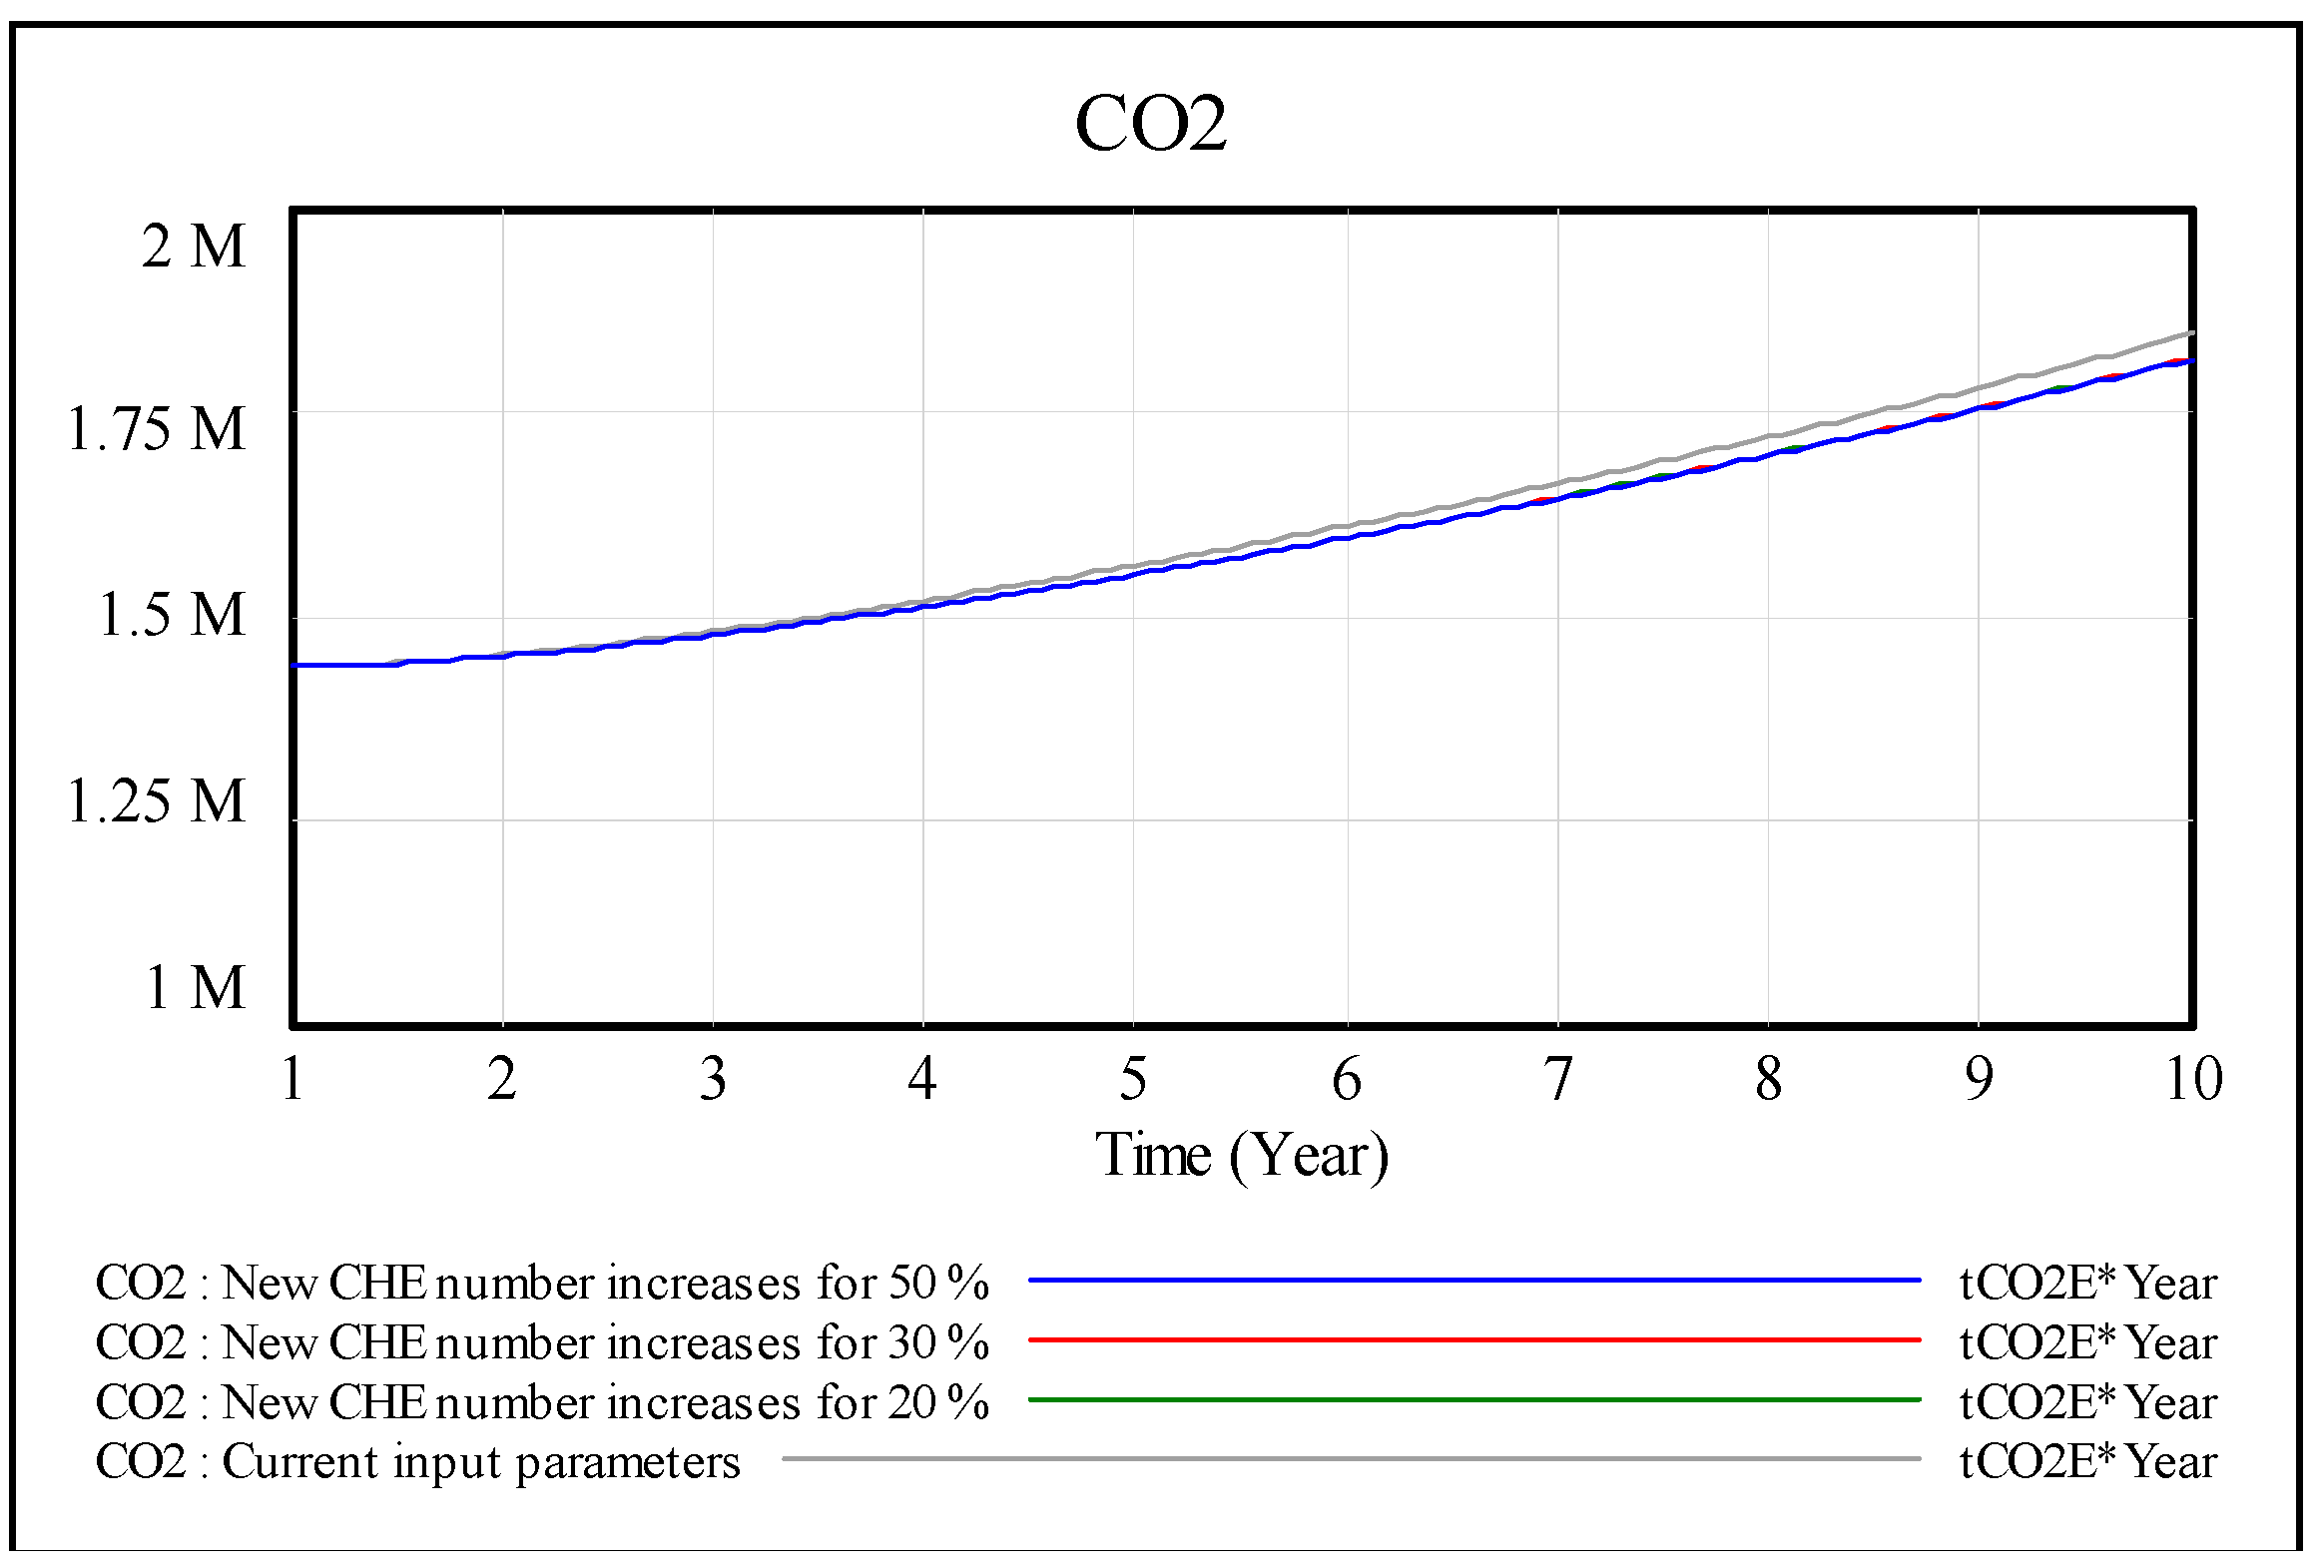
| Model Variable | Variables Interpretation |
|---|---|
| Railroad Locomotives | |
| EfRL | Emission factor of the locomotive engine, gCO2/hp-h |
| RpRL | Rated power for a particular type of locomotive, hp |
| Heavy-Duty Vehicles | |
| Efr | Emission factor in running, gCO2/h |
| Efi | Emission factor in idling, gCO2/h |
| Cargo Handling Equipment | |
| EfCHE | Emission factor of the equipment engine, gCO2/kW-h |
| LfCHE | Load factor, dimensionless |
| RpCHE | Rated power for a particular type of equipment, kW |
| Ocean-Going Vessels | |
| AE | Auxiliary engine |
| AB | Auxiliary boiler |
| EfAE | Emission factor for auxiliary engines system, gCO2/kW-h |
| LfAE | Average auxiliary load at berth for auxiliary engines, kW |
| EfAB | Emission factor for auxiliary boilers system, gCO2/kW-h |
| LfAB | Average auxiliary load at berth for auxiliary boilers, kW |
| State Variables: |
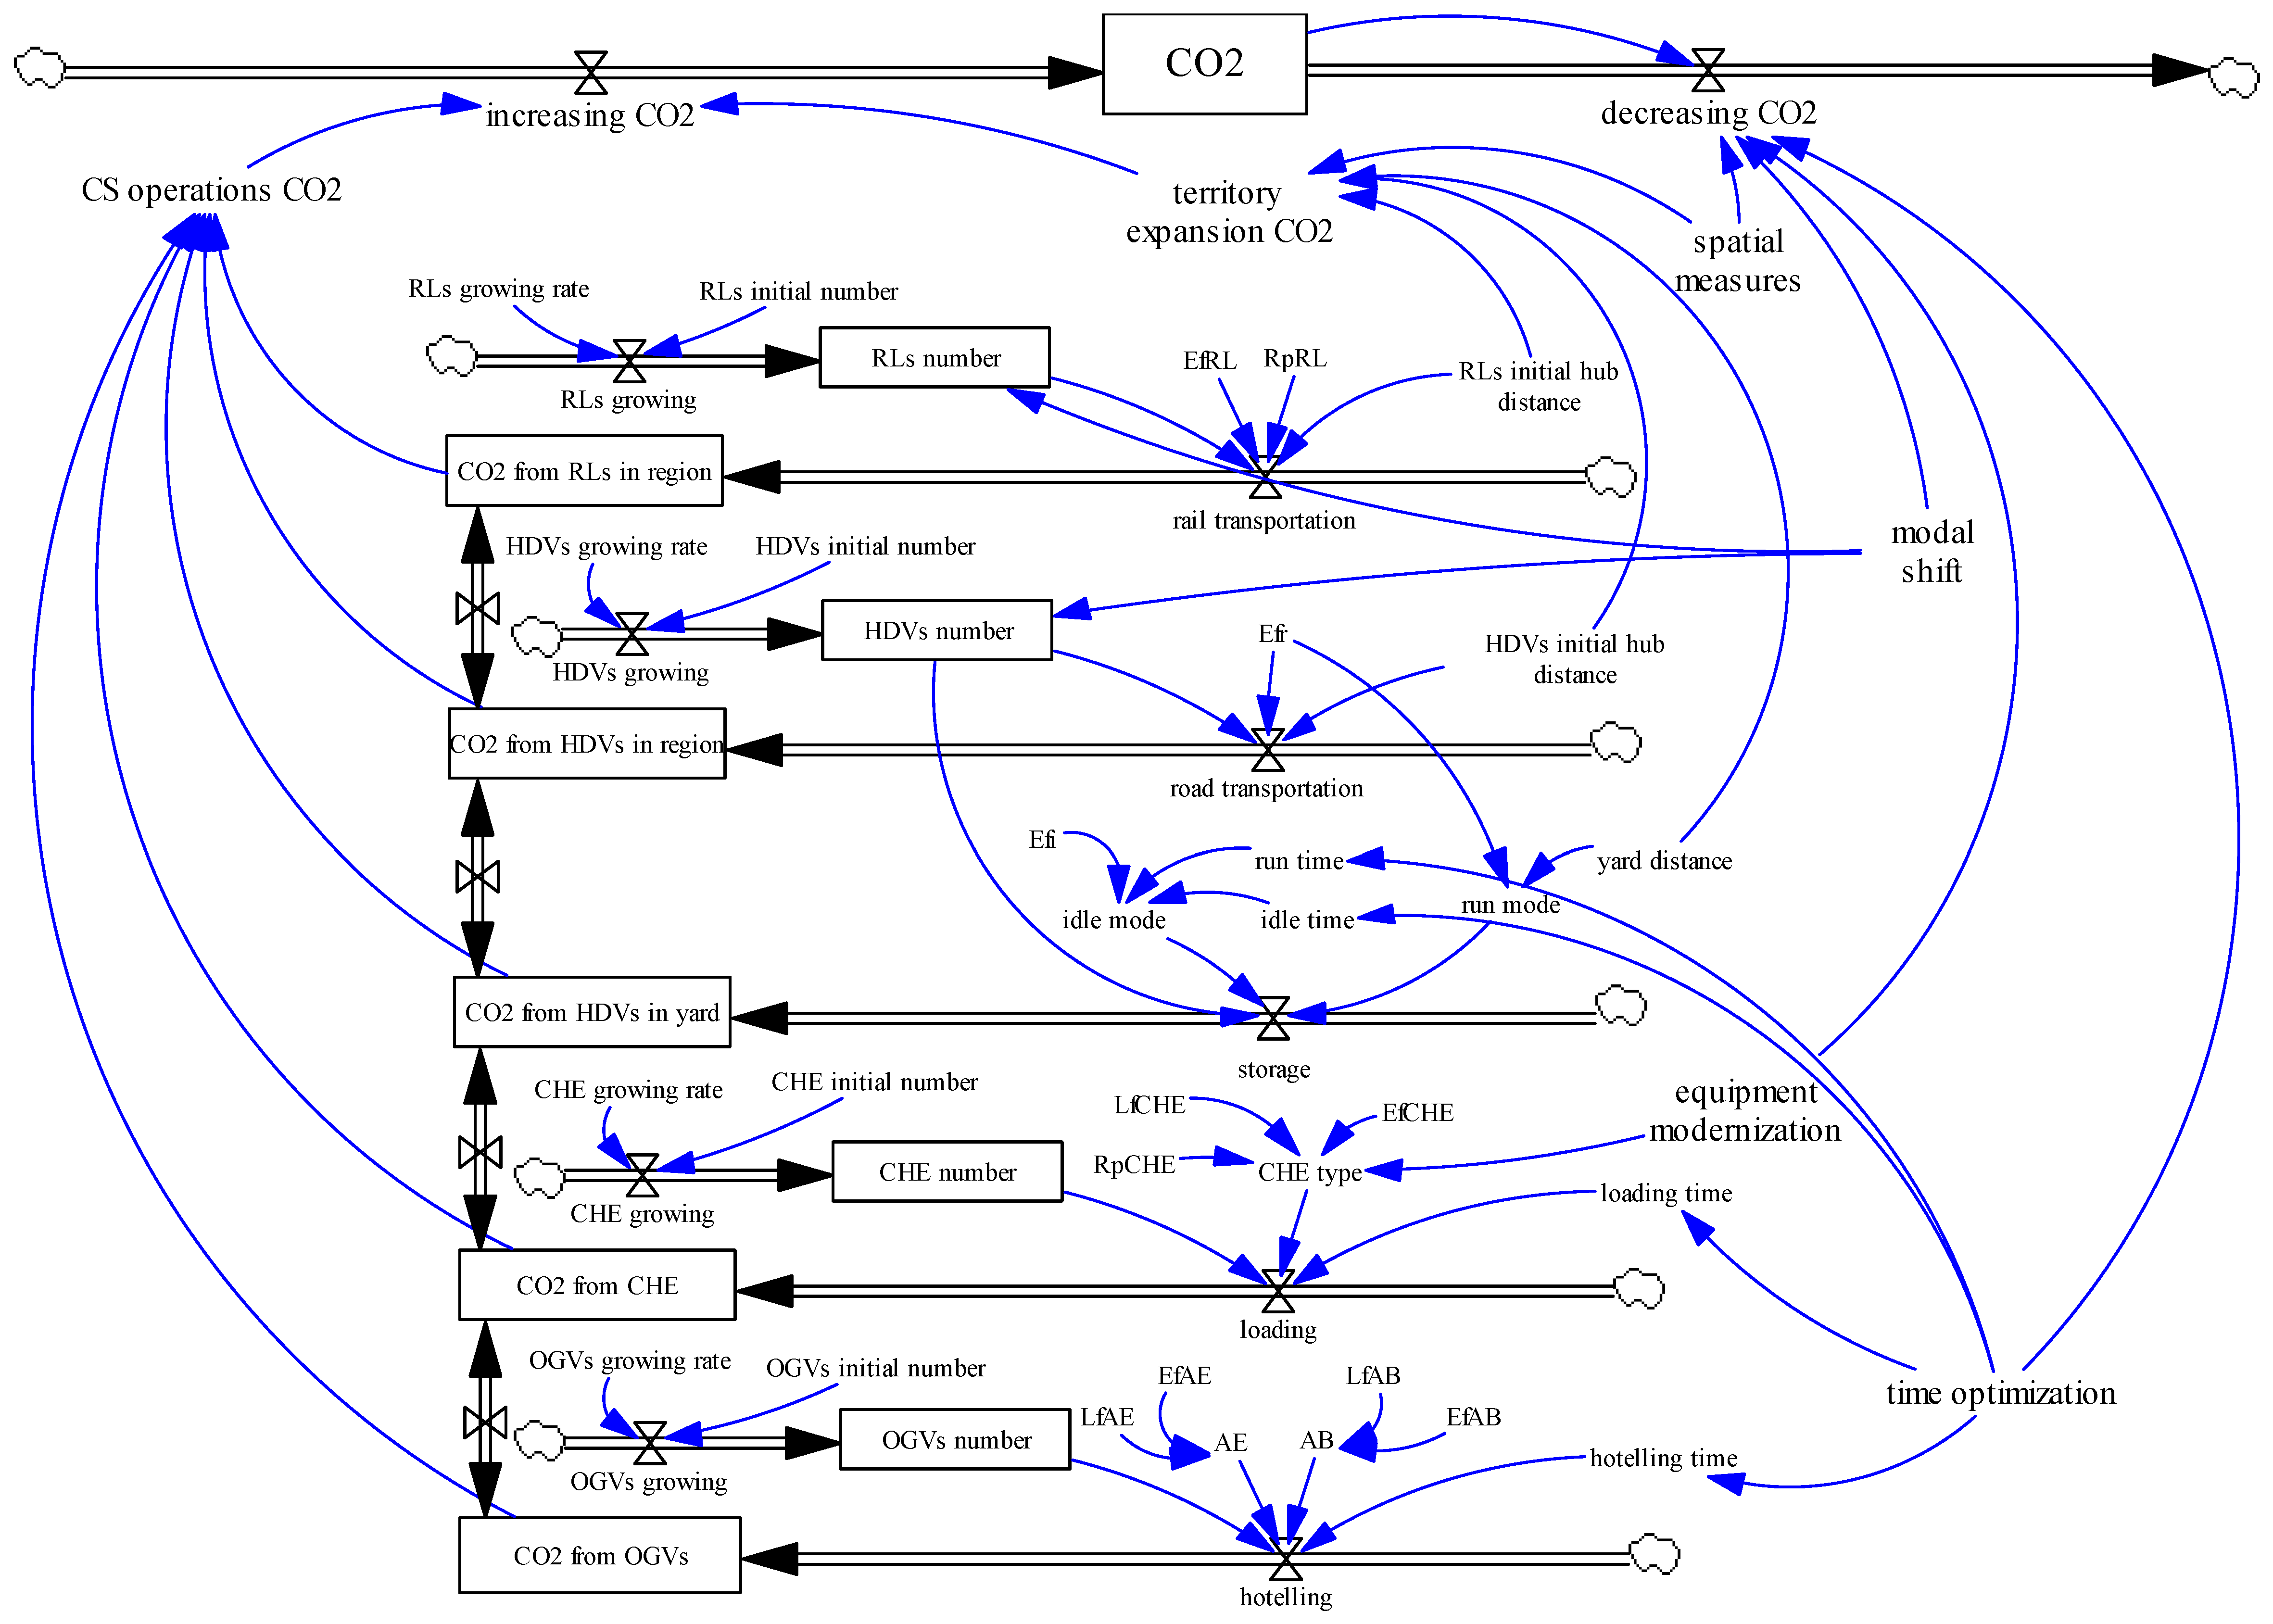
| CO2 = INTEG (+increasing CO2 − decreasing CO2, initial CO2) |
| CO2 from OGVs = INTEG (hoteling, initial CO2 from OGVs) |
| CO2 from CHE = INTEG (loading, initial CO2 from CHE) |
| CO2 from HDVs in yard = INTEG (storage, initial CO2 from HDVs in yard) |
| CO2 from HDVs in region = INTEG (road transportation, initial CO2 from HDVs in region) |
| CO2 from RLs in region = INTEG (rail transportation, initial CO2 from RLs in region) |
| Rate Variables: |
| increasing CO2 = CS operations CO2 + territory expansion CO2 |
| decreasing CO2 = CO2 − (equipment modernization + modal shift + spatial measures + time optimization) |
| hoteling=OGVs number × hoteling time × (AB+AE) |
| loading = CHE number × CHE type × loading time |
| storage = HDVs number × (idle mode + run mode) |
| road transportation = Efr × HDVs number × HDVs initial hub distance |
| rail transportation = RLs number × RpRL × EfRL × RLs initial hub distance |
| Auxiliary Variables: |
| equipment modernization = % × (CHE number × EF × Rp) |
| modal shift = % × HDV number + % × RL number |
| spatial measures = % × territory expansion |
| time optimization = % × (hoteling time + loadingtime + HDV idle time + HDV run time) |
| territory expansion CO2 = spatial measures × (yard distance + HDVs initial hub distance + RLs initial hub distance) |
| CS operations CO2 = CO2fromOGVs + CO2from CHE + CO2 from HDVs in yard + CO2 from HDVs in region + CO2 from RLs in region |
| № | Parameter Name | Parameter Value | Units |
|---|---|---|---|
| Berth Sub-system | |||
| 1. | Initial amount of CO2 from OGVs | 211,530 | tCO2E |
| 2. | OGVs initial number (per year) | 2502 | dmnl |
| 3. | Hoteling time | 1509 | h |
| 4. | EfAB (emission factor for auxiliary boilers system) | 0.000698 | tCO2E/kW-h |
| 5. | LfAB (average auxiliary load at berth for auxiliary boilers) | 477 | kW |
| 6. | EfAE (emission factor for auxiliary engines system) | 0.000995 | tCO2E/kW-h |
| 7. | LfAE (average auxiliary load at berth for auxiliary engines) | 1161 | kW |
| Yard Sub-system | |||
| 1. | Initial amount of CO2 from CHE | 291,960 | tCO2E |
| 2. | CHE initial number | 4844 | dmnl |
| 3. | Loading time | 24,188 | h |
| 4. | EfCHE (emission factor of the equipment engine) | 0.000661 | tCO2E/kW-h |
| 5. | LfCHE (load factor for equipment) | 0.4 | dmnl |
| 6. | RpCHE (rated power for equipment) | 230 | kW |
| Gates Sub-system | |||
| 1. | Initial amount of CO2 from HDVs in yard | 70,435 | tCO2E |
| 2. | HDVs initial number | 9932 | dmnl |
| 3. | HDVs idle time (per one trip) | 0.7 | h |
| 4. | HDVs run time (one vehicle per year) | 572 | h |
| 5. | Yard distance | 2 | km |
| 6. | Efi (emission factor in idling) | 0.004655 | tCO2E/km |
| 7. | Efr (emission factor in running) | 0.001021 | tCO2E/km |
| Region Sub-system | |||
| 1. | Initial amount of CO2 from HDV in region | 721,564 | tCO2E |
| 2. | HDVs initial number | 9932 | dmnl |
| 3. | HDVs initial hub distance | 1600 | km |
| 4. | Initial amount of CO2 from RLs in region | 141,512 | tCO2E |
| 5. | RLs initial number | 1017 | dmnl |
| 6. | RLs initial hub distance | 1995 | km |
| 7. | EfRLs (emission factor of the locomotive engine) | 0.00051 | tCO2E/hp-h |
| 8. | RpRLs (rated power for locomotive) | 2500 | hp |
| Mitigation Strategies | Total CO2, tCO2E | CO2 Reduction, % |
|---|---|---|
| Operating Time Optimization | ||
| no strategies | 1844 | 0 |
| 10% | 1827 | 0.9 |
| 20% | 1811 | 1.8 |
| 30% | 1795 | 2.7 |
| Spatial Measures | ||
| no strategies | 1844 | 0 |
| 20% | 1792 | 2.8 |
| 30% | 1765 | 4.3 |
| 50% | 1713 | 7.1 |
| Equipment Modernization | ||
| no strategies | 1844 | 0 |
| 20% | 1815 | 1.6 |
| 30% | 1815 | 1.6 |
| 50% | 1814 | 1.63 |
| Modal Shift | ||
| no strategies | 1844 | 0 |
| 10% | 1833 | 0.6 |
| 20% | 1822 | 1.2 |
| 30% | 1810 | 1.8 |
| Total maximum effect | 1600 | 13.2 |
| Parameters/Period | POLA Achieved Results in CO2 Mitigation Strategies | QQCT Simulated Results if No Strategies Taken | ||||
|---|---|---|---|---|---|---|
| 2005 | 2015 | Increase/Decrease, % | 2016 | 2026 | Increase/Decrease, % | |
| 1.Container throughput, million TEUs | 7.48 | 8.16 | +9.1 | 18.05 | 21.66 | +20 |
| 2.Emission sources, tCO2E: | ||||||
| OGVs | 288 | 252 | −12.6 | 212 | 273 | +29.2 |
| HC | 57 | 61 | +7.2 | - | - | - |
| CHE | 135 | 171 | +26.8 | 292 | 365 | +24.9 |
| HDVs | 469 | 382 | −18.6 | - | - | - |
| HDVs in yard | - | - | - | 70 | 102 | +45.2 |
| HDVs in region | - | - | - | 722 | 998 | +38.3 |
| RLs | 82 | 68 | −16.7 | 141 | 170 | +20.1 |
| Total | 1031 | 934 | −9.4 | 1437 | 1908 | +28.3 |
© 2019 by the authors. Licensee MDPI, Basel, Switzerland. This article is an open access article distributed under the terms and conditions of the Creative Commons Attribution (CC BY) license (http://creativecommons.org/licenses/by/4.0/).
Share and Cite
Mamatok, Y.; Huang, Y.; Jin, C.; Cheng, X. A System Dynamics Model for CO2 Mitigation Strategies at a Container Seaport. Sustainability 2019, 11, 2806. https://doi.org/10.3390/su11102806
Mamatok Y, Huang Y, Jin C, Cheng X. A System Dynamics Model for CO2 Mitigation Strategies at a Container Seaport. Sustainability. 2019; 11(10):2806. https://doi.org/10.3390/su11102806
Chicago/Turabian StyleMamatok, Yuliya, Yingyi Huang, Chun Jin, and Xingqun Cheng. 2019. "A System Dynamics Model for CO2 Mitigation Strategies at a Container Seaport" Sustainability 11, no. 10: 2806. https://doi.org/10.3390/su11102806
APA StyleMamatok, Y., Huang, Y., Jin, C., & Cheng, X. (2019). A System Dynamics Model for CO2 Mitigation Strategies at a Container Seaport. Sustainability, 11(10), 2806. https://doi.org/10.3390/su11102806


