Abstract
A new adjustment strategy (controlling temperature, pH, inoculum dose, and liquid supernatant replacement in different digestion stages) was used to relieve volatile fatty acid (VFA) inhibition during anaerobic codigestion of FW and CM. Three digestion stages and groups were designed: initial stage (on days 1–5 the temperature was 45 °C), the second stage (on days 6–10 the temperature was 35 °C and inoculum was supplied), and the third stage (on days 11–50 the temperature was 35 °C and liquid supernatant was replaced). Groups A, B, and C had initial inoculums of 0, 100, and 200 mL and were supplied inoculums of 200, 100, and 0 mL, respectively. Results showed that in the initial stage, Group A had the highest VFA concentration (876.54 mg/L) and the lowest pH (3.6). In the second and third stages, pH (~5.5 and ~7.5) and VFA concentrations showed no significant differences in all groups. The highest VFA concentration (3248 mg/L), volatile solid (VS) removal rate (49.72%), and total methane production (TMP) (10,959 mL), the shortest λ (19.92 d), and the T90% (39.25 d) were obtained in Group B (pH 8.5). Group C had the highest chemical oxygen demand (COD) removal rate (96.91%). Group A obtained the maximal TBP of 25,626 mL (pH 8.0).
1. Introduction
About 2.2 billion tons of food waste (FW) will be generated in the world by 2025, and total food loss will be about 310 billion tons in developing countries (like China) [1]. Therefore, FW pollution has gradually become a global problem [2]. It is worth noting that FW contains rich organic matter (35.5%–69% sugar and 4%–22% protein) [3,4], high moisture content (74%–90%), and low pH, and is more biodegradable than other organic wastes. So, FW has been regarded as the most promising anaerobic substrate [2] and has great potential for methane production.
However, the inhibition process caused by volatile fatty acid (VFA) accumulation is a common phenomenon for anaerobic digestion (AD) of FW [5,6,7,8,9], which inhibits the growth of microorganisms [10] and the digestion process. Anaerobic codigestion of FW with other wastes, such as piggery wastewater [11], wastewater, sewage sludge, green waste [4], and cow manure (CM) [9], could balance system stablity by offering toxicity dilution, synergism, divers, a robust microbiome, etc. [1,4,12]. Biogas production compared to different digestion conditions is summarized in Table 1.

Table 1.
Summary of anaerobic digestion (AD) and biogas/methane yield of food waste (FW).
On the other hand, to ease VFA tocxity many inhibitors have been controlled such as temperature [5], C:N ratio [4], hydraulic retention time [10], substrate to inoculum ratio (SIR) [1], pH [9], and substrate ratio [3]. This proved that controlling temperature, SIR, and pH were more effective methods. The solution was that these studies focused on controlling these factors at the initial stage of AD; however, AD process can be divided into four stages: hydrolysis, acidogenesis, acetogenesis, and methanogenesis [14]. So, adjusting these factors at different stages might efficiently ease VFA tocxity.
In the present study, we attempted to control these factors (temperature, SIR, and pH) in different digestion stages to ease VFA tocxity. Several studies proved that an optimum SIR can effectively decrease the digestion period, offer approriate microbes, accelerate startup, and buffer the capacity of the system, thus significantly improving methane prodcution [1]. It will be controlled during hydrolysis and acidogenesis stages by adding different doses of inoculum. Optimum conditions accelerate the metabolic rate and alter the hydrolysis kinetics and solubility of the substrate [1]. Thermophilic conditions can enhance the hydrolysis of FW, though the organic conversion rate to methane is slower [1,15]. Mesophilic conditions are more stable for methane production [16]. So, thermophilic conditions will be investigated during hydrolysis and acidogenesis stages, while mesophilic conditions will be investigated during acetogenesis and methanogenesis stages. pH has an important influence on the AD system, and it is the key control factor because there are different optimum pH ranges for microoganisms [2,16,17]. The optimum pH range for hydrolysis and acidogenic microoganisms is 5.5–6.5 [18]. FW digestion decreases system pH (3.6–4.5 in this study), which could meet the pH level for hydrolysis and acidogenic microoganisms. Thus, in the intial stage, it would not be necessary to adjust pH. However, the optimal pH for methanogens is about 7.0 [1,16]. Thus, pH adjustment after acidogenesis is essential. In additon, liquid supernate replacement using fresh inoculum when no biogas is produced (methanogenesis stage) could ease VFA tocxity, though no studies have been done in this area; this will be investigated in the present study. Considering these controlling methods, we named this strategy as a new adjusting strategy to relieve the inhibition process caused by VFA accumulation in anaerobic codigestion of FW and CM.
Kinetics have been widely used to reflect digestion characteristics during the anaerobic digestion process and to predict the digestion potential and microbial activity. The modified Gompertz model is an important kinetic model to assess the ability of microorganisms to adapt to anaerobic reaction conditions, evaluate digestion time, and predict the biogas production rate potential. Thus, it has been widely used in the anaerobic digestion process [13,19] and in the digestion of FW [1,12,20]. So, it was also used to further represent digestion efficiency and to assess digestion time and potential in the present study.
We hypothesized that adjusting inoculum additions, temperature, pH, and supernatant liquid replacement at different digestion stages would significantly improve the codigestion efficiency of FW and CM. Therefore, in the present study, we focused on (1) the effects of adjusting these factors at different digestion stages on the performance and biogas/methane production of FW, and (2) optimizing the adjusting strategy for improving AD efficiency of FW. To evaluate these points, organic biodegradation, process stability, biogas/methane production, and kinetic characteristics were investigated.
2. Materials and Methods
2.1. Feedstock and Inoculum
FW was collected from a canteen at Northwest A&F University, Yangling, China. Before the batch experiments, FW was ground into 5 mm pieces using a food grinder to ensure homogeneity, and then it was stored at 4 °C. The fresh CM was collected from a local village in Yangling, China. The digestion inoculum was obtained from a well-digested household biogas digester in the same village. The main characteristics (average data plus standard errors in duplicate tests) of FW, CM, and inoculum are shown in Table 2. FW was characterized by high volatile solid (VS) content (94.48%, total solid (TS) basis), which indicated rich, biodegradable organic content. However, the pH value (5.3) was much lower than CM (7.3) and the inoculum (7.8); therefore, acid inhibition easily occurred during the anaerobic digestion process and, consequently, influenced digestion performance. Neutral pH values of 7.3 and 7.8 were found for CM and the inoculum, respectively, which were helpful for balancing the pH level and improving the self-buffering capacity of the codigestion system with FW. Thus anaerobic codigestion of FW and CM was essential.
Table 2.
Characteristics of food waste (FW), cow manure (CM), and inoculum.
2.2. Anaerobic Digestion (AD) Experiments
A laboratory-scale AD system was used for all experiments as described in [19]. FW and CM were used as cosubstrates with a mixing ratio of 1:1 (wet weight basis). The total digester volume was 1 L with 700 mL working volume, including the total inoculum and substrate. According to the daily biogas production rate, all experimental periods (50 d) were divided into three different stages as follows:
The initial stage: the digestion duration was 1–5 d. The first daily biogas production peak was obtained on the fifth day, the digestion temperature was controlled at 45 °C to enhance the biodegradation rate of the substrate, which has been proven to be an optimal temperature for FW biodegradation [14].
The second stage: the digestion duration was 6–10 d. The second daily biogas production peak was obtained on the 10th day, the digestion temperature was controlled at 35 °C, which was more suitable for microbial activity and process stability [21], and the pH value of all experiments was adjusted to 7.0, 7.5, 8.0, and 8.5 using 4.5 mol/L Ca(OH)2.
The third stage: the digestion duration was 11–50 d. Daily biogas was produced steadily after the 10th day, the digestion temperature was controlled at 35 °C, and the 200 mL supernatant of digestion liquid was replaced by 200 mL fresh inoculum, once no biogas was produced, until the end of the experiment. This could thoroughly relieve organic acid inhibition in the digestion process.
Furthermore, to clearly investigate the effects of these operational conditions, three experimental groups were determined, namely Group A, Group B, and Group C, based on the inoculum dose and addition time.
- Group A: in the initial stage, no inoculum was added. In the second stage, 200 mL inoculum was supplied. In the third stage, no inoculum was added.
- Group B: in the initial stage, 100 mL inoculum was added. In the second stage, 100 mL inoculum was supplied. In the third stage, no inoculum was added.
- Group C: in the initial stage, 200 mL inoculum was added. In the second stage and the third stage, no inoculum was supplied. Detailed information on the experimental design is shown in Table 3.
Table 3. Detailed information on the experimental design.
The TS content of each digester was 8% according to our previous studies, in which TS = 8% proved to be an optimum value for AD performance [22,23]. All experiments were conducted in triplicate.
2.3. Kinetic Model
The duration of the lag phase (λ) was predicted by the modified Gompertz model (MGE) according to a previous study [22], shown as Equation (1). Accordingly, the digestion period (T100%, the time to produce the total biogas production, TBP) was also predicted.
where M(t) is the accumulative biogas production (mL) at an anaerobic digestion time t (d), P is the biogas production potential (mL), Rm is the maximum biogas production rate (mL), λ is the duration of lag phase (d), and e = 2.7183.
2.4. Analytical Methods
TS, VS, C, N, and VFAs were determined according to the standard methods of the American Public Health Association (APHA, 1998). Chemical oxygen demand (COD) was analyzed by Multi-Parameter Testers (ET99718). Daily biogas production was measured using a water displacement method. A biogas analyzer (Gasboard-3200p) was used to analyze the methane content in biogas and pH value during the digestion process. The pH value and VFA concentration were determined every five days, and the methane content was measured every day.
2.5. Statistical Analyses
To test for differences in biogas/methane production and process parameters (pH, VFAs, VS, and COD removal rate) of each treatment in relation to operational conditions, one-way ANOVA and Duncan's multiple range test (DMRT) were used to analyze variance of means using SPSS 20.0. λ was calculated by fitting the kinetic model based on accumulated biogas production using SPSS 20.0.
3. Results and Discussion
3.1. Biogas Production and Methane Content
3.1.1. Effect of Initial Inoculum Addition on Biogas and Methane Production
Daily biogas production and methane content of each group with different inoculum doses are shown in Figure 1. In the initial stage, daily biogas production in all groups rapidly increased. For Groups A (Figure 1A) and B (Figure 1B), the first biogas production peak appeared after the first two days, and it decreased sharply to zero after the third day. For Group C, the first biogas production peak was achieved on the fourth day. The main reason could be the different SIR ratios. Previous studies proved that SIR was one important factor that influenced biogas production, especially for FW [1,24]. When the SIR < 2, digesters operated efficiently with a high methane recovery rate [1,24]. In the initial stage, the SIRs of Group B and Group C were 2.17 and 1.08, respectively. For Group A, no inoculum was added; therefore, the time to obtain the first daily biogas production peak was delayed for Group C. However, the methane content was almost zero for all experiments, as shown in Figure 1. This was similar to the results from a previous study [10] in which rapid, increased daily biogas production was achieved on the first day with a low methane concentration (18.7%) and a high CO2 concentration (67.4%). The main reason was acidogenesis during this period [10,25]. Additionally, 45 °C accelerated the acidification of the substrate caused by faster reaction rates than the mesophilic temperatures of approximately 35 °C [14]. Furthermore, the rapidly decreased pH value (shown in Figure 2) also indicated acidogenesis in the initial stage. As a result, initial inoculum additions showed no significant influences on biogas/methane production in the initial stage. Compared to the total biogas production (TBP) in this period, the highest average value of 2535 mL was obtained from Group C, which was significantly higher than Group B (44.8%) and Group C (53%) (p < 0.05). This could be thoroughly explained by the suitable SIR in Group C; however, each substrate had its own optimum SIR ratio, and, consequently, the results of each study were different.
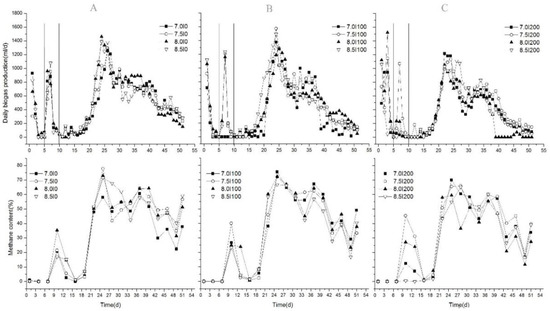
Figure 1.
Variations in daily biogas production and methane content. A, group A, B, group B, C, group C
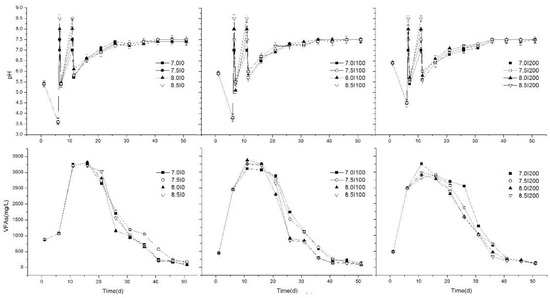
Figure 2.
Variations of pH and VFA concentrations during the anaerobic digestion process.
3.1.2. Effects of Inoculum Supplement and pH Adjustment on Biogas/Methane Production
In the second stage, each sample held the same amount of inoculum after adding the rest of the inoculum into Groups A and B to achieve a total volume of 200 mL. Then, the pH was adjusted to 7.0, 7.5, 8.0, and 8.5. From Figure 1, shows that biogas generation rapidly recovered and peaked on the seventh day for each treatment, and then it decreased rapidly along with the methane content. The order of the peak value was B (1210 mL/d) > C (1017 mL/d) > A (955 mL/d). Maximal TBPs were obtained at pH 7.5 (2330 mL), 8.5 (2136 mL), and 8.0 (1728 mL) for Groups B, A, and C, respectively. Although maximal TBP was obtained in Group C in the initial stage, it was obtained in Group B in the second stage. Therefore, we hypothesized that low inoculum additions (100 mL in Group B) in both stages could be an alternative method to improve biogas production. No inoculum addition (0 mL in Group A) or high inoculum addition (200 mL in Group C) in the initial stage could both result in deterioration. Biogas generation in Groups A and B during these days could be affected by both the supply of microbes and the change of alkalinity in the digestion system; the microbe activities were different in Groups A and B. For Group A, inoculum was added until the sixth day, and the microbial population was the least, which was only supplied by the cosubstrate. Although inoculum was supplied up to 200 mL, a lower pH and buffer capacity could result in a delayed recovery process, so a higher pH was needed. As a result, the maximum TBP was achieved when pH was adjusted to 8.5 for Group A. We also found that a slight alkali pH (> 7.0) adjustment when the pH value of the AD system dropped to a very low level (3.6–4.5 (Figure 2) in the present study) could be suitable for anaerobic codigestion of FW and CM, which could improve the self-buffering capacity and recovery process of the system. These findings were different from the results obtained from [10], in which a higher biogas production was found at pH 7.0 using NaHCO3 and NaOH adjustments. Zhou [26] also found that neutral pH control (6.8–7.2) in the AD process of pig manure improved biogas production. The main reason could be the differences in the substrate.
3.1.3. Effect of Supernatant Liquid Replacement on Biogas/Methane Production
At the end of the second stage, biogas production of all treatments dropped significantly by the 10th day, and almost no biogas was produced by the 11th day (Figure 1), which could correspond to the maximum VFA concentration; however, after replacing the supernatant liquid using the same volume of fresh inoculum, biogas production increased slowly until achieving the peak value. Thus, in the third stage, daily biogas production and methane content increased steadily. However, no similar study was done, except for our present study. On the one hand, fresh inoculum enhanced the consumption of VFAs to generate biogas by supplementing microorganisms, and the inhibition of VFAs was relieved. On the other hand, it reduced VFA concentrations directly, which also relieved the inhibition of VFAs. For methane production, in the early stages of rising biogas production, biogas production rose rapidly to the maximum value, which indicated abundant methanogens in the new inoculum. Thereafter, methane content decreased with little fluctuation. Ignoring the effects of pH, the average methane contents were 40.4%, 40.4%, and 35.9% for Groups A, B, and C, respectively, while maximum methane contents were obtained at pH adjustments of 8.0, 8.0, and 7.5 in Groups A, B, and C, respectively. The average methane content ranged from 36% to 41%, which was lower than 58.7%–61.8% obtained from the previous study [27]. The reason was the higher FW content in the substrate in this study (50%) compared to 32% and 48% in [27]; thus, the inhibition process was caused by VFAs [10]. Additionally, removal of supernatant liquid could reduce VFA content directly, thereby decreasing biogas/methane production. So, it was important that the supernatant liquid was replaced using fresh inoculum to recover the AD process. These results were different with the results of [10], in which the AD process was inhibited when the FW content in the substrate increased. Above all, this kind of adjusting strategy could improve biogas/methane production effectively.
3.2. Variations of pH and Volatile Fatty Acids (VFAs)
3.2.1. Effect of Initial Inoculum Addition on pH and VFAs
VFA concentration and pH level during anaerobic digestion of FW have been widely used as an indicator of stability and self-buffering capacity [3,28,29]. Variations in pH and VFA concentration during the AD process at different stages are shown in Figure 2. Results revealed that, in the initial stage, Group C had the highest initial pH (6.4), followed by Group B (5.9), and then Group A (5.4). The main reason was the high inoculum dose in Group C, which could balance the pH level of the AD system as a buffer agent [12]. Then, pH values of all treatments decreased to their lowest values as a result of the acidification of organic matter [30], which was analyzed in Section 3.1.1. The lowest pH values were A (3.6) < B (3.8) < C (4.5), which further illustrated the significant effects of different inoculum volumes. Therefore, 200 mL inoculum addition in Group C improved the self-buffering capacity in the initial stage. Also, although acidogenesis microorganisms can tolerate a wide pH range (4.0–8.5), the optimal pH range for hydrolysis and acidogenesis was 5.5–6.5; therefore, pH adjustment in the second stage was necessary and created a more favorable environment for the AD process.
VFAs are the important process indicators during the AD process, especially for FW. Numerous studies proved that accumulation of VFAs negatively affected pH [31], which resulted in process inhibition and consequent biogas production. Variations in VFA concentrations in all groups are shown in Figure 2. The initial concentrations of Groups B (442.68 mg/L) and C (479.72 mg/L) were significantly lower than that achieved in Group A (876.54 mg/L) (p < 0.05). The reason might be that the consumption rate of VFAs producing biogas/methane was high in the former two groups. In this stage, VFA concentration rapidly increased as a result of hydrolysis and acidification. However, on the fifth day, VFA concentrations of Groups B and C were 2.29 and 2.32 times higher than Group A, respectively. This phenomenon showed that inoculum additions in the initial stage allowed a faster organic biodegradation rate and VFA production rate from the microorganism supply [13].
3.2.2. Effects of Inoculum Supply and pH Adjustment on pH and VFAs
In the second stage, although the remaining inoculum was supplied and pH was adjusted to 7.0, 7.5, 8.0, and 8.5 for all groups, the pH decreased rapidly, and the average pH values of Groups A, B, and C were about 5.4, 5.4, and 5.5, which was caused by a rapidly increased VFA concentration. However, along with AD progression, the pH of all treatments showed a slow increasing trend and rose to 7.0 on the 10th day. This was considered appropriate for the methanogenesis process [32], in which the optimum pH range of 6.5–8.2 for methanogenesis in the anaerobic digestion process was found. So, daily biogas/methane showed an obvious peak (Figure 1). Furthermore, no significant differences (p > 0.05) of pH between each group were found in this stage. The reason might be the similar adjustment strategy of pH, while the inoculum supplement showed a significant effect on the pH of the AD system compared to pH adjustment.
VFA concentrations of all treatments reached maximal values on day 10 and 11, and the maximal average VFA concentrations of Groups A, B, and C were 3209, 3248, and 2990 mg/L, respectively. No significant differences were found, which further revealed similar stabilities indicated by pH. This may be attributed to the supplied inoculum added to Groups A and B that provided more hydrolytic and acidification bacteria. However, significant differences (p < 0.05) were found after the pH was adjusted, and the maximal VFA concentration was obtained at pH 8.0 in Group B (3374 mg/L). A previous study indicated that toxic effects caused by VFAs could be eased by increasing the consumption rate or the electrodigestion process. In this study, pH adjustment ensured an optimal pH level for methanogenesis, thus, the conversion rate of VFAs to biogas was enhanced. Differently, in our previous study [12], although the pH was adjusted at the initial stage, the VFA concentration was more than 3440 mg/L and caused inhibition. Contrarily, in the present study, the pH was adjusted after hydrolysis and acidification stages (initial stage), and a lower VFA was produced, which was preferable for biogas/methane production.
3.2.3. Effect of Supernatant Liquid Replacement on pH and VFAs
In the third stage, the pH variations of all treatments were similar after the supernatant was replaced. They all rose to ~7.0 after 10 d, and reached their stable values of ~7.5 after 25 d (Figure 2). These final pH values were harmonious with the normal growth of anaerobic microorganisms [33]. With the recovery of biogas production, VFA concentrations of all treatments fell dramatically by day 15 as a result of methane conversion. The duration times of high VFA concentrations were shorter compared to the previous study [12], in which the VFA concentrations fell dramatically by day 30, and pH was only adjusted initially. Therefore, it could be speculated that in this stage, although VFA accumulation inhibited methane production, supernatant liquid replacement using fresh inoculum when no biogas was produced could efficiently ease VFA inhibition and create a stable environment for methanogens. Thus, the methane conversion rate of VFAs was improved, and the duration time of high VFAs decreased. This could be indicated by stable biogas/methane production and pH level. As the process of digestion continued, VFAs concentrations decreased slowly to 78–173 mg/L at the end of anaerobic digestion, which was in accordance with previous research [34,35]. The lowest VFA concentrations of Groups A, B, and C were obtained at pH 8.0 (74 mg/L), 8.0 (77 mg/L), and 7.5 (108 mg/L), respectively, and the maximal reduction rate of VFA concentration was 97.7% at pH 8.0 for Group B in the last 40 days, which was similar with TBP.
3.3. Removal Rate of Volatile Solid (VS) and Soluble Chemical Oxygen Demand (COD)
At the end of the AD process, the removal rates of VS and COD were investigated. It is well known that biogas/methane generation is accompanied by the degradation of organic components in substrates. Thus, reductions of VS and COD are useful parameters for evaluating the efficiency in AD [10,32]. As shown in Table 4, the average VS removal rates were 44.82% (Group B) > 40.90% (Group C) > 38.62% (Group A), which was similar with the TBP. The average VS removal rates for pH 7.0, 7.5, 8.0, and 8.5 were 39.11%, 40.13%, 42.98%, and 43.85%, respectively. It increased with an increased pH value. This can be explained as higher pH adjustments were beneficial in improving environmental conditions for microorganism digestion, so degradation of substrates was enhanced. The highest removal rate of VS was obtained at pH 8.5 (49.72%) in Group B, which was lower than 54.01% as reported in [36]. The main reason would be the higher frequency of pH adjustments, which was proven by Li et al. [36].
Table 4.
Degradation rate of VS and soluble chemical oxygen demand (COD).
The average removal rates of soluble COD for Groups A, B, and C were 92.64%, 93.46%, and 96.91%, respectively. It increased as the inoculum dose increased in initial stages, since the higher the inoculum dose, the earlier the substrate capacity was degraded. The average COD removal rates for pH 7.0, 7.5, 8.0, and 8.5 were 93.12%, 92.34%, 96.33%, and 88.88%, respectively. Notably, pH 8.0 was optimum for COD degradation. Therefore, considering all operational conditions, pH adjustment could be an efficient method for improving organic biodegradability and biogas production.
3.4. Total Biogas and Methane Production
As shown in Figure 3, both TBP and total methane production (TMP) showed a decreasing trend from Group A to C, and the average values of Groups A and B were significantly higher than Group C (p < 0.05). Therefore, supplying inoculum after hydrolysis and acidification stages could be an effective method for enhancing the organic conversion rate to biogas/methane and relieving the inhibition caused by VFA accumulation. Previous reports showed that the SIR determined the correct operation of the AD process, and an optimum SIR was beneficial to biogas production [37]. In this study, with the same number of substrates, different initial inoculum doses and similar total inoculum doses meant different initial SIRs and similar total SIRs. The results of the study demonstrated that the initial SIR can also affect the AD process, including biogas/methane production, but the method needed to be further improved. A previous study also found that methane yields increased with the reduction of SIR [26], which might be a reason for the higher methane yield that was achieved in Group B instead of Group C.
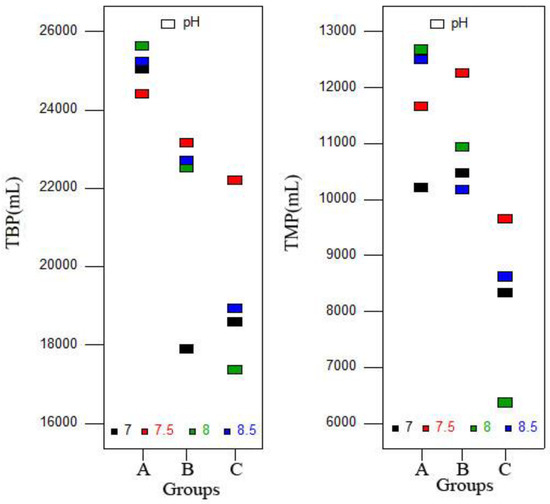
Figure 3.
Total biogas production (TBP) and total methane production (TMP) obtained from different groups.
The highest TBP for Group A was obtained at pH 8.0 (25,626 mL), which was significantly higher than others (p < 0.05). For Groups B and C, the highest TBPs of 23,156 and 22,203 mL were achieved at pH 7.5, respectively, and were significantly higher than other pH (p < 0.05). The TMP showed a similar trend. The highest VS removal rate was achieved in Group B when pH was adjusted to 8.5. The reason would be that alkaline digestion conditions (pH 8.5) improved the hydrolysis rate and substrate conversion to intermediate products, but it also caused inhibition, which inhibited methanogenic activity and decreased methane production [37]. Thus, pH adjustment ranged from 7.5–8.0 could be the recommended range for codigestion of FW and CM.
3.5. Lag Phase and Digestion Period
The predicated lag phase (λ/d) obtained from the MGE and digestion period (T/d) are shown in Figure 4. This indicated that methane production was well-fitted by MGE with high fitting coefficients R2 ranging from 0.994–0.999. The maximum λ of 20.5, 19.9, and 19.5 d were found at pH 7.0 for Group A (Figure 4a) and Group B (Figure 4a), and pH 8.5 for Group C (Figure 4c), respectively, and it was significantly high than other pH (p < 0.05). λ was a key parameter used to indicate the ability of microorganisms to adapt to the reaction system, the system recovery time as it began to generate biogas [1,21], and the startup time (the time before stable biogas/methane was produced) of the AD system. Therefore, high inoculum doses in the initial stage (Group C) could enhance the ability of the microorganisms to adapt to the reaction system and recover capacity. Thus, biogas was generated in a shorter time compared to Groups A and B, and the highest TBP was obtained in the initial stage; however, the startup time for the AD system was prolonged because of a high VFA accumulation and a low self-buffering capacity (shown in Figure 2 as the variations of pH and VFAs). The TBP and TMP at the end of the whole digestion period for all experiments showed no significant differences. Thus, we concluded that inoculum supplements, pH adjustment, and replacing the liquid supernatant played important roles in improving AD system recovering rate.
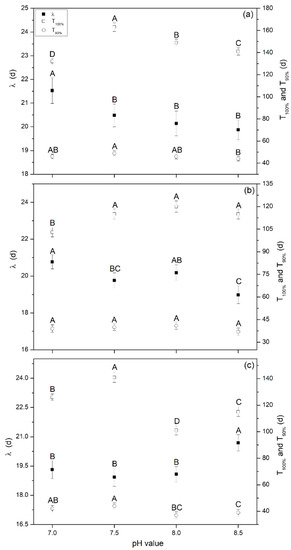
Figure 4.
Lag phase and digestion period at different pH levels obtained from the modified Gompertz model, (a) Group A, (b) Group B, and (c) Group C. Note: λ is the lag phase; T100% is the time for producing the TBP; and T90% is the time for producing 90% of TBP.
The digestion period, T100% (the time for producing the final TBP) and T90% (the time for producing 90% of TBP) were also calculated (Figure 4). For Group A, the values of T100% ranged from 132 to 163 d, and the maximum value was achieved at pH 7.5, which was significantly higher than others (p < 0.05). For Groups B and C, these values ranged from 103 to 120 d and from 101 to 141 d, respectively, which were lower than Group A. Maximum values were obtained at pH 8.0 and 7.5, respectively. The values obtained for T90% showed the same trend as T100%. The main reason was that the high inoculum dose in the initial stage prolonged the lag phase, while the VFA biogas conversion rate, stability, and TBP/TMP showed no significant differences compared to other groups. Therefore, the time to produce the same TBP (T100%) was prolonged. Comprehensively, it can be concluded that the little amounts of inoculum resulted in higher hydrolysis and acidification rates and a higher biogas/methane production, but it also resulted in a longer lag phase and digestion period. Thus, cost inputs such as energy, economy, and human resources increased. This should be fully considered in practical engineering applications, and further studies are needed. Furthermore, neutral pH adjustment (7.0) could be a useful method for relieving inhibition, enhancing adaption of microorganisms to digestion conditions, and decreasing the digestion period.
4. Conclusions
The results showed that this new operating strategy, by controlling temperature, inoculum dose, and pH, and replacing the supernatant liquid at different digestion times based on daily biogas production rates significantly influenced the performance of FW and CM anaerobic codigestion. It was concluded that (1) different initial inoculums in the initial stage affected substrate biodegradability (VFA concentration), which consequently affected the self-buffering capacity and stability (pH). Group A saw higher initial inoculum doses, lower stability, more serious VFA inhibition, and a longer lag phase and digestion period. (2) Inoculum supplementation and pH adjustment in the second stage played important roles in balancing the pH of the AD system and, thus, improving the self-buffering capacity. (3) Liquid supernatant replacement using fresh inoculum showed an efficient positive effect on enhancing system stability, which could be indicated by the final pH, the VFA conversion rate to biogas, VS and COD removal rates, and TBP and TMP with no significant differences between each group. (4) Lower inoculum doses in the initial stage (Groups A and B), adjusting the pH to 7.0, and supernatant liquid replacement could significantly improve digestion efficiency. Therefore, adjusting different operational conditions at different stages could be an appropriate method for relieving inhibition. However, for all treatments, the lag phase and digestion period were prolonged, which increased energy input. Therefore, further studies are still needed. The results could offer an important basis for improving treatment efficiency of FW.
Author Contributions
G.-X.R. was the major writer for the first manuscript; N.-N.Z. and C.-L.M. articulated on core arguments and wrote the Introduction and Conclusion sections; X.-J.W., G.-H.Y., Z.-C.L., and B.-R.W. worked on revision and resubmission.
Funding
This work was supported by the basic work of science and technology special project: Natural Science Foundation of Shaanxi Province and Rural Energy Construction Project in 2017; The budget project of the ministry agriculture department (091721301262491003); National Natural Science Foundation of China (51508467); Natural Science Foundation of Province (2016JQ4007); and Postdoctoral Science Foundation of China (2016T90950, 2015M582708).
Acknowledgments
We thank Yanbo Wang and Yanzi Wang who gave important suggestions for improving the manuscript quality.
Conflicts of Interest
The authors declare no conflict of interest.
References
- Mehariya, S.; Patel, A.K.; Obulisamy, P.K.; Punniyakotti, E.; Wong, J.W.C. Co-digestion of food waste and sewage sludge for methane production: Current status and perspective. Bioresour. Technol. 2018, 265, 519–531. [Google Scholar] [CrossRef] [PubMed]
- Ren, Y.; Yu, M.; Wu, C.; Wang, Q.; Gao, M.; Huang, Q.; Liu, Y. A comprehensive review on food waste anaerobic digestion: Research updates and tendencies. Bioresour. Technol. 2018, 247, 1069–1076. [Google Scholar] [CrossRef] [PubMed]
- Arelli, V.; Begum, S.; Anupoju, G.R.; Kuruti, K.; Shailaja, S. Dry anaerobic co-digestion of food waste and cattle manure: Impact of total solids, substrate ratio and thermal pre treatment on methane yield and quality of biomanure. Bioresour. Technol. 2018, 253, 273–280. [Google Scholar] [CrossRef] [PubMed]
- Zhang, C.; Su, H.; Baeyens, J.; Tan, T. Reviewing the anaerobic digestion of food waste for biogas production. Renew. Sustain. Energy Rev. 2014, 38, 383–392. [Google Scholar] [CrossRef]
- Li, Y.; Zhang, R.; Liu, X.; Chen, C.; Xiao, X.; Feng, L.; He, Y.; Liu, G. Evaluating Methane Production from Anaerobic Mono- and Codigestion of Kitchen Waste, Corn Stover, and Chicken Manure. Energy Fuels 2013, 27, 2085–2091. [Google Scholar] [CrossRef]
- Cassendra, P.; Li, Y.; Chew, T.; Ji, J.; Chin, S.; Wai, S. The characterisation and treatment of food waste for improvement of biogas production during anaerobic digestion—A review. J. Clean. Prod. 2018, 172, 1545–1558. [Google Scholar]
- Mézes, L.; Bai, A.; Nagy, D.; Cinka, I.; Gabnai, Z. Optimization of Raw Material Composition in an Agricultural Biogas Plant. Trends Renew. Energy 2017, 3, 61–75. [Google Scholar] [CrossRef]
- Zhai, N.; Zhang, T.; Yin, D.; Yang, G.; Wang, X.; Ren, G.; Feng, Y. Effect of initial pH on anaerobic co-digestion of kitchen waste and cow manure. Waste Manag. 2015, 38, 126–131. [Google Scholar] [CrossRef]
- Ye, J.; Li, D.; Sun, Y.; Wang, G.; Yuan, Z.; Zhen, F.; Wang, Y. Improved biogas production from rice straw by co-digestion with kitchen waste and pig manure. Waste Manag. 2013, 33, 2653–2658. [Google Scholar] [CrossRef] [PubMed]
- Zhang, L.; Lee, Y.-W.; Jahng, D. Anaerobic co-digestion of food waste and piggery wastewater: Focusing on the role of trace elements. Bioresour. Technol. 2011, 102, 5048–5059. [Google Scholar] [CrossRef]
- Zhao, M.-X.; Ruan, W.-Q. Biogas performance from co-digestion of Taihu algae and kitchen wastes. Energy Convers. Manag. 2013, 75, 21–24. [Google Scholar] [CrossRef]
- Kim, J.K.; Oh, B.R.; Chun, Y.N.; Kim, S.W. Effects of temperature and hydraulic retention time on anaerobic digestion of food waste. J. Biosci. Bioeng. 2006, 102, 328–332. [Google Scholar] [CrossRef]
- Li, Y.; Jin, Y.; Li, H.; Borrion, A.; Yu, Z.; Li, J. Kinetic studies on organic degradation and its impacts on improving methane production during anaerobic digestion of food waste. Appl. Energy 2018, 213, 136–147. [Google Scholar] [CrossRef]
- Hagos, K.; Zong, J.; Li, D.; Liu, C.; Lu, X. Anaerobic co-digestion process for biogas production: Progress, challenges and perspectives. Renew. Sustain. Energy Rev. 2017, 76, 1485–1496. [Google Scholar] [CrossRef]
- Obulisamy, P.K.; Chakraborty, D.; Selvam, A.; Wong, J.W.C. Anaerobic co-digestion of food waste and chemically enhanced primary-treated sludge under mesophilic and thermophilic conditions. Environ. Technol. 2016, 37, 3200–3207. [Google Scholar] [CrossRef] [PubMed]
- Siddique, M.N.I.; Wahid, Z.A. Achievements and perspectives of anaerobic co-digestion: A review. J. Clean. Prod. 2018, 194, 359–371. [Google Scholar] [CrossRef]
- Lu, X.; Jin, W.; Xue, S.; Wang, X. Effects of waste sources on performance of anaerobic co-digestion of complex organic wastes: Taking food waste as an example. Sci. Rep. 2017, 7, 15702. [Google Scholar] [CrossRef]
- Kusch, S.; Schumacher, B.; Oechsner, H.; Schafer, W. Methane yield of oat husks. Biomass Bioenergy 2011, 35, 2627–2633. [Google Scholar] [CrossRef]
- Mao, C.; Wang, X.; Xi, J.; Feng, Y.; Ren, G. Linkage of kinetic parameters with process parameters and operational conditions during anaerobic digestion. Energy 2017, 135, 352–360. [Google Scholar] [CrossRef]
- Liao, X.; Zhu, S.; Zhong, D.; Zhu, J.; Liao, L. Anaerobic co-digestion of food waste and landfill leachate in single-phase batch reactors. Waste Manag. 2014, 34, 2278–2284. [Google Scholar] [CrossRef] [PubMed]
- Wang, X.; Lu, X.; Li, F.; Yang, G. Effects of temperature and carbon-nitrogen (C/N) ratio on the performance of anaerobic co-digestion of dairy manure, chicken manure and rice straw: Focusing on ammonia inhibition. PLoS ONE 2014, 9, e97265. [Google Scholar] [CrossRef]
- Zhang, T.; Mao, C.; Zhai, N.; Wang, X.; Yang, G. Influence of initial pH on thermophilic anaerobic co-digestion of swine manure and maize stalk. Waste Manag. 2015, 35, 119–126. [Google Scholar] [CrossRef]
- Li, Y.; Jin, Y.; Borrion, A.; Li, J. Influence of feed/inoculum ratios and waste cooking oil content on the mesophilic anaerobic digestion of food waste. Waste Manag. 2018, 73, 156–164. [Google Scholar] [CrossRef]
- Yin, D.; Liu, W.; Zhai, N.; Wang, Y.; Ren, C.; Yang, G. Regional differentiation of rural household biogas development and related driving factors in China. Renew. Sustain. Energy Rev. 2017, 67, 1008–1018. [Google Scholar] [CrossRef]
- Zhou, J.; Zhang, R.; Liu, F.; Yong, X.; Wu, X.; Zheng, T.; Jiang, M.; Jia, H. Biogas production and microbial community shift through neutral pH control during the anaerobic digestion of pig manure. Bioresour. Technol 2016, 217, 44–49. [Google Scholar] [CrossRef]
- Zhang, R.; El-Mashad, H.M.; Hartman, K.; Wang, F.; Liu, G.; Choate, C.; Gamble, P. Characterization of food waste as feedstock for anaerobic digestion. Bioresour. Technol. 2007, 98, 929–935. [Google Scholar] [CrossRef] [PubMed]
- Li, L.; Peng, X.; Wang, X.; Wu, D. Anaerobic digestion of food waste: A review focusing on process stability. Bioresour. Technol. 2018, 248 Pt A, 20–28. [Google Scholar] [CrossRef]
- Capson-Tojo, G.; Moscoviz, R.; Ruiz, D.; Santa-Catalina, G.; Trably, E.; Rouez, M.; Crest, M.; Steyer, J.P.; Bernet, N.; Delgenes, J.P.; et al. Addition of granular activated carbon and trace elements to favor volatile fatty acid consumption during anaerobic digestion of food waste. Bioresour. Technol. 2018, 260, 157–168. [Google Scholar] [CrossRef]
- Yang, Y.Q.; Shen, D.S.; Li, N.; Xu, D.; Long, Y.Y.; Lu, X.Y. Co-digestion of kitchen waste and fruit-vegetable waste by two-phase anaerobic digestion. Environ. Sci. Pollut. Res. Int. 2013, 20, 2162–2171. [Google Scholar] [CrossRef] [PubMed]
- González-Fernández, C.; García-Encina, P.A. Impact of substrate to inoculum ratio in anaerobic digestion of swine slurry. Biomass Bioenergy 2009, 33, 1065–1069. [Google Scholar] [CrossRef]
- Lee, D.H.; Behera, S.K.; Kim, J.W.; Park, H.S. Methane production potential of leachate generated from Korean food waste recycling facilities: A lab-scale study. Waste Manag. 2009, 29, 876–882. [Google Scholar] [CrossRef]
- Zhong, W.; Zhang, Z.; Luo, Y.; Qiao, W.; Xiao, M.; Zhang, M. Biogas productivity by co-digesting Taihu blue algae with corn straw as an external carbon source. Bioresour. Technol. 2012, 114, 281–286. [Google Scholar] [CrossRef] [PubMed]
- Yuan, X.; Shi, X.; Zhang, D.; Qiu, Y.; Guo, R.; Wang, L. Biogas production and microcystin biodegradation in anaerobic digestion of blue algae. Energy Environ. Sci. 2011, 4, 1511. [Google Scholar] [CrossRef]
- Misi, S.N.; Forster, C.F. Batch Co-Digestion of Two-Component Mixtures of Agro-Wastes. Process Saf. Environ. Prot. 2001, 79, 365–371. [Google Scholar] [CrossRef]
- Wang, Y.; Zang, B.; Li, G.; Liu, Y. Evaluation the anaerobic hydrolysis acidification stage of kitchen waste by pH regulation. Waste Manag. 2016, 53, 62–67. [Google Scholar] [CrossRef]
- Elreedy, A.; Fujii, M.; Tawfik, A. Factors affecting on hythane bio-generation via anaerobic digestion of mono-ethylene glycol contaminated wastewater: Inoculum-to-substrate ratio, nitrogen-to-phosphorus ratio and pH. Bioresour. Technol. 2017, 223, 10–19. [Google Scholar] [CrossRef] [PubMed]
- Montañés, R.; Pérez, M.; Solera, R. Anaerobic mesophilic co-digestion of sewage sludge and sugar beet pulp lixiviation in batch reactors: Effect of pH control. Chem. Eng. J. 2014, 255, 492–499. [Google Scholar] [CrossRef]


© 2019 by the authors. Licensee MDPI, Basel, Switzerland. This article is an open access article distributed under the terms and conditions of the Creative Commons Attribution (CC BY) license (http://creativecommons.org/licenses/by/4.0/).