Abstract
Traffic flow patterns severely impact vehicle carbon emissions. A field test was conducted in this study to obtain fuel consumption and traffic volume data under various traffic flow patterns and to explore the relationship between traffic flow patterns and vehicle carbon emissions. Carbon emission data were obtained via the indirect carbon emission accounting method proposed by the Intergovernmental Panel on Climate Change. Carbon emission prediction models for diesel trucks and gasoline passenger cars were established respectively with volume to capacity ratio as an explanatory variable. The results show that carbon emissions are highest under the congested flow conditions, followed by unstable flow, free flow, and steady flow. The relationship between the volume to capacity ratio and carbon emissions is a cubic curve function. The carbon emissions of trucks and passenger cars with a volume to capacity ratio of 0.4 to 0.5 are relatively small. The proposed carbon emissions models effectively quantify the carbon emissions of vehicles under different traffic flow patterns. The results of this study may provide data to support and a workable reference for expressway operation management and future low-carbon expressway expansion construction projects.
1. Introduction
Traffic flow patterns affect the operating conditions of individual vehicles. Vehicle operating conditions, in turn, are closely related to fuel consumption and carbon emissions [1,2,3,4]. Carbon emissions contribute to global warming. To this effect, there is an important relationship between traffic flow conditions and carbon emissions. Scholars dedicated to this subject have established various micro carbon emission models including Mobile Source Emission Factor Model (MOBILE) [5], Comprehensive Modal Emissions Model (CMEM) [6], and Motor Vehicle Emission Simulator (MOVES) [7] designed to reflect the real-time operating conditions of vehicles.
Fuel consumption is closely related to CO2 emissions. Research on the effects of traffic flow patterns on vehicle operating conditions has revealed a close relationship between traffic flow conditions and fuel consumption [1,2,3]. Vlieger et al. [1] conducted a field test to find that traffic flow patterns across various roads have significant effects on vehicle operating conditions, fuel consumption, and exhaust emissions. The carbon emissions of vehicles in congested traffic flow were 10–200% higher than those in free-flow traffic conditions. Choudhary et al. [2] measured instantaneous speed, acceleration, travel time, fuel consumption, and exhaust emissions in a field test to find that fuel consumption depends largely on traffic flow patterns and the way they affect the vehicle’s operating conditions. Fuel consumption under congested flow conditions was higher than under free flow conditions due to the frequency of operations such as acceleration, deceleration, and “stop-and-go” driving. Researchers have sought to define the rule of partial exhaust emissions (CO, HO, NOX) in congested traffic conditions, but have made no quantitative analysis of carbon emissions to date despite the fact that fuel consumption is indeed closely related to traffic flow [1,2].
Hemmerle [3] observed traffic flow and fuel consumption data in an oversaturated urban traffic scenario to determine the fuel consumption rule between synchronized flow patterns (SP) and sequences of moving queue patterns (MQ). SP was defined by Kerner’s three-phase theory of highway traffic [8,9] and MQ corresponding to the classical theory of city traffic [10,11,12]. For a given mean speed, vehicle fuel consumption in MQ is greater than that in traverse SP because the traffic signals in MQ impose more frequent accelerations and decelerations. Fuel consumption is also sensitive to changes in traffic flow conditions over time. The emissions of carbon dioxide, the key product of the vehicle fuel combustion mechanism, can be indirectly measured based on traffic flow patterns. Barth et al. [13] used driving data from the CMEM database [6] to model the relationship between average speed (i.e., traffic flow patterns) and carbon emissions. Their results clearly indicated that traffic congestion has a significant impact on vehicle carbon emissions.
Zhu [14] used critical density and delay time as indicators to split traffic flow into stable flow patterns and unstable flow patterns. The rule of carbon emissions from gasoline vehicles with a consideration of slope was defined, based on Bando’s optimal velocity model and Li’s carbon emissions model of urban road intersections [4]. The carbon emissions model has numerous explanatory variables including second-by-second speed, travel time, travel distance, velocity fluctuation, safety distance, road gradient, and delay time. There are steady changes in carbon emissions when traffic density is less than 0.2 veh/m or more than 0.5 veh/m. When the density is more than 0.5 veh/m, the total carbon emission rate increases as density increases.
Li [15] used the dimensionless delay time as an indicator to classify mixed traffic flow into three patterns, namely free traffic flow, normal flow and congested flows. The carbon emissions rates of different types of gasoline vehicles also were determined based on Bando’s optimal velocity model and Li’s road-intersection carbon emissions model [4]. Explanatory variables in this model include instantaneous velocity, average safety distance, travel distance, travel time, and delay time. Average maximum speed and average delay time have the greatest impact on carbon emission rate. Carbon emissions can be reduced by controlling the level of traffic congestion. Carbon emissions decrease as the average headway distance increases, so the most direct approach to reducing emissions is to reduce traffic density and traffic volume. Li’s aforementioned model [4] was developed based on the traffic light control model and Oguchi’s vehicle carbon emissions model [16]. Oguchi [16] obtained fuel consumption data based on the operating conditions of a single vehicle traversing city roads in Tokyo. Fuel consumption is in proportion to CO2 emissions. The CO2 emission model was established by employing vehicle kinematics and thermal model of engine. The main factors affecting carbon emissions are travel time, distance, and speed fluctuations. The extant models [14,15] are not readily applicable as they require a large amount of instantaneous data be gathered as the vehicle moves. There is no model verification based on field test data, either, so it is not possible to fully confirm the model’s accuracy. The default parameters in these models [14,15] are based on Oguchi’s model, which is specific to Tokyo. Different fuel qualities, road types, altitudes, weather conditions, and vehicle types can affect fuel consumption and carbon emissions—in other words, the extant models [14,15] are not directly applicable to the Chinese context.
Previous researchers have revealed the effects of traffic flow patterns on the carbon emissions, mostly based on models built from the microscopic perspective encompassing vehicle operating conditions [4,13,14,15]. Traffic flow patterns are generally divided by certain indicators related to traffic flow (speed, time, density) to analyze the relationship between traffic flow and carbon emissions. The multiple explanatory variables in these models necessitate a large amount of instantaneous, raw data which is difficult to obtain, which makes the models difficult to actually apply; they cannot be used directly to guide or plan traffic flows. There is no fully practical model which reflects the relationship between carbon emissions and traffic flow patterns with easily accessed variables. In the present study, the readily accessible ratio (index v/C) of the maximum service traffic volume (v) to the basic traffic capacity (C) on the expressway was used to directly identify traffic flow patterns as per their relationship to carbon emissions. China yet lacks a unified quantitative model for carbon emissions. Performance varies considerably by vehicle and fuel usage varies considerably by region, so the default parameters of carbon emissions models used in other countries do not fully apply to China. Diesel trucks and gasoline passenger vehicles were selected for analysis of carbon emission data in proportion to fuel consumption observed via a field test. The results were used to establish a carbon emissions model suitable for China.
The remainder of this paper is organized as follows. Section 2 introduces the methodology employed in this study. Section 3 presents the field test data and quantifies the carbon emissions of passenger cars and diesel trucks under various traffic flow patterns. Section 4 presents an analysis of the results alongside a discussion on the limitations of this work and prospective research directions.
2. Methodology
China does not currently have well-established direct carbon emission measurement specifications for field trials, so the United Nations Intergovernmental Panel on Climate Change (IPCC) carbon emissions indirect accounting method was selected for the purposes of this study. IPCC parameters were localized as an indirect accounting method for carbon emissions that is applicable to China’s vehicle fuel quality. To analyze carbon emission rules under different traffic flow conditions, the traffic flow characteristic index v/C was used to clearly divide the traffic flow conditions into applicable categories. Differences in vehicle performance and fuel quality in various countries render the default parameter values of models like MOVES and MOBILE, which were developed by U.S. researchers, are not fully applicable to China. A field test was designed for enhanced accuracy and credibility of the relevant data that needed to collect.
2.1. Conversion Between Fuel Consumption and Carbon Emission
Methods for measuring vehicle carbon emissions may be direct or indirect. There are two main methods for directly measuring carbon emissions: chassis dynamometer testing and portable emission measurement system (PEMS) testing. Chassis dynamometer tests are mainly deployed in the laboratory and cannot fully reflect the engine’s emissions during the actual driving process [17]. PEMS sensors exhibit varying sensitivity to uniformly nucleated volatile particles. Vehicle exhaust gas concentrations are highly dependent on sampling and dilution conditions which can cause certain measurement errors [18]. Chinese researchers mainly use PEMS for engine bench tests, and thus cannot truly work under actual driving conditions. There is currently no bench test available for heavy-duty vehicles.
Carbon dioxide emissions data can be obtained indirectly by measuring the vehicle’s fuel consumption and then calculating it theoretically. The carbon accounting method proposed by the IPCC currently has international recognition. The IPCC indicates that vehicle fuel consumption is strongly related to carbon emissions and specifies the conversion calculation [19] as follows:
where F is the fuel carbon emissions factor (tCO2/TJ), C indicates carbon emissions produced by per unit calorific of fuel (tC/TJ), B is the carbon oxidation rate, K is the carbon conversion coefficient (44/12), E denotes the carbon emissions generated from fuel combustion (kgCO2/kg), A is the average low calorific value generated by per unit fuel combustion (TJ/Gg), M is fuel consumption (t), p is the density of vehicle fuel, and V is vehicle fuel volume (L).
F = C × B × K
E = A × F × M × 10−3
E = A × F × p × V × 10−3
Data relevant to the extant vehicle fuel usage in China can be found in the “National Communication on Climate Change of China” [20,21,22]. The quality indicators of diesel are Ad = 43.33 TJ/Gg, Cd = 20.2 tC/TJ, Bd = 98% and those of gasoline are Ag = 43.07 TJ/Gg, Cg = 18.9 tC/TJ, Bg = 99%. The carbon emissions of Chinese vehicles on the road today were defined based on the quantization method given by IPCC and the latest vehicle fuel combustion calorific value published by the Chinese government. The values of Fd = 72.585 tCO2/TJ for diesel and Fg = 68.607 tCO2/TJ for gasoline were calculated via Equation (1). Integrating Equations (1) and (2) provided the carbon emissions of per-kilogram fuel, Ed = 3.145 kgCO2 and Eg = 2.955 kgCO2, respectively.
In recent years, gas stations in China have supplied 93# gasoline to common and economical passenger cars, 0# diesel to trucks throughout the year, and -10# diesel to trucks in winter months (during which time low temperatures can cause the engine oil circuit to be obstructed, preventing the truck from starting normally, and decrease the overall engine power). The densities of 93# gasoline, 0# diesel, and -10# diesel are p93# = 0.75 kg/L, p0# = 0.835 kg/L, and p−10# = 0.84 kg/L, respectively. Using Equations (1) to (3), the carbon emission equations of 93# gasoline, 0# diesel, and -10# diesel are as follows:
E93# = 2.2162 × V,
E0# = 2.6262 × V,
E-10# = 2.6419 × V.
2.2. Division of Traffic Flow Patterns
Traffic flow patterns are usually categorized by service level [23]. Carbon emissions are, as discussed above, highly dependent on traffic flow. The service level is a measure thus closely related to carbon emissions. The Highway Capacity Manual (HCM) [23] published by the U.S. Transportation Research Board can be utilized to define different traffic flow patterns. It uses three indicators to describe the operational characteristics of expressway: density, average speed, and v/C. HCM uses density as an indicator of service level and defines six different service levels represented by the letters A through F. The “Technical Standard of Highway Engineering” of China stipulates v/C as an indicator of the degree of road congestion and the road service level; v/C, as mentioned above, is the ratio of the maximum service traffic volume to the basic traffic capacity. The basic traffic capacity is the maximum hourly traffic volume corresponding to level-of-service 5. Details regarding the six road service levels are shown in Table 1 [24]. China’s expressway service levels 1 to 6 are equivalent to U.S. expressway service levels A to F [25].

Table 1.
Service levels of Chinese expressways.
Carbon emissions are strictly related to speed and density. Certain advanced methodologies such as recent studies based on Network Fundamental Diagrams [26] are available to measure traffic flow variables (speed, density, flow). The purpose of this study was to secure a practical, quantitative model of carbon emissions under various traffic flow patterns. Policy decisions in terms of low-carbon expressway operation management and expressway expansion involve empirical comparisons among several road sections. There are important differences in the design speed, number of lanes, traffic composition, and other factors of said road sections. The “v” in v/C is an objective reflection of actual traffic flow, while “C” accounts for modifications of the above factors [25]. The ratio v/C can reflect the traffic capacity and workload under various road conditions. It is relatively easy to obtain traffic volume data via existing traffic flow observation and monitoring technologies, and the calculation process for actual traffic capacity is relatively straightforward; in short, v/C is simple and convenient to calculate. In this study, v/C was used to characterize the traffic flow patterns.
There are four traffic flow conditions that can be defined with v/C as the evaluation index based on the Chinese expressway service levels shown in Table 2. Grade-1 service level corresponds to the free-flow condition, under which vehicles do not interfere with each other and may travel at relatively high speeds with random acceleration and deceleration options. Grade-2 and grade-3 service levels correspond to steady flow condition, where individual vehicle speeds may be disturbed by other vehicles; traffic flow is generally continuous. In the event of a traffic accident, driving conditions are disturbed and vehicle speeds are reduced. In severe cases, traffic flow presents the form of shock waves. The grade-4 service level corresponds to the unstable flow condition, wherein vehicles interfere severely with each other and driving freedom is extremely limited. Grade-5 and grade-6 service levels correspond to the congestion flow condition, under which any traffic accident can lead to serious obstruction and queuing and vehicle velocity variations form “stop-and-go” waves.
Table 2.
Correspondence between v/C and traffic flow patterns.
2.3. Field Test
China’s fuel quality, road design standards, driver behavior habits, and other aspects of its traffic conditions differ notably from those of other countries. The default parameters in the existing carbon emission models developed by researchers from other countries are inconsistent with China’s specific conditions. Appropriate real-world measurements can reflect vehicle carbon emissions under actual road conditions, traffic flow conditions, driver behavioral conditions, and environmental factors. A field test was conducted in this study to obtain relevant data.
The field test was designed to measure traffic volume, speed, and fuel consumption under different traffic flow patterns on some typical Chinese expressways. Fuel consumption data were then converted to carbon emissions data using the IPCC method; the influence of traffic flow patterns on carbon emissions was determined accordingly. To ensure sufficiently comparable test data, the carbon emissions are represented as vehicle 100-km carbon emissions values.
2.3.1. Test Instrument
According to the purpose of the test, the independent variable in the test is the traffic flow pattern and the dependent variable was vehicle fuel consumption. An AxleLightRLU11 vehicle classification statistical instrument was selected to conduct in-field traffic flow measurements via laser technology. The fuel consumption and travel time of passenger cars were measured with an FX-1120 gasoline fuel consumption instrument (Ono, Japan). The instantaneous speed of passenger cars was measured with a five-wheel instrument (Shengwei, Tianjin). The fuel consumption, instantaneous speed and travel time of trucks were measured with a JDSZ-EP-1-1D diesel fuel consumption instrument (Shenzhou, Shanghai) as shown in Figure 1, Figure 2 and Figure 3.
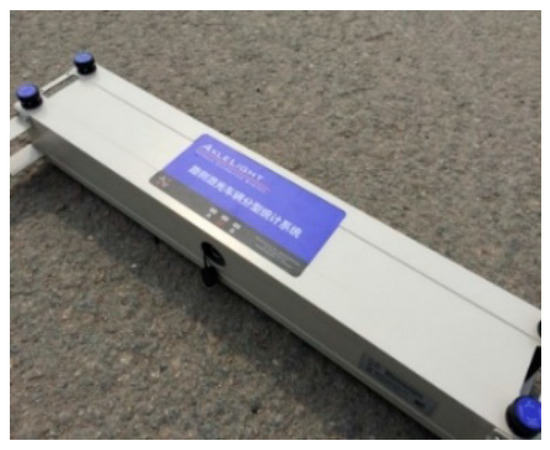
Figure 1.
Vehicle classification statistical instrument.
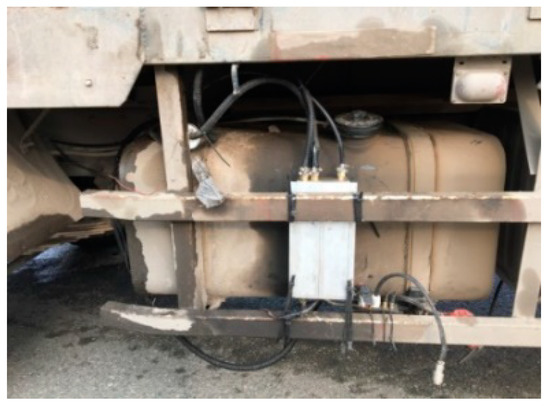
Figure 2.
Diesel consumption instrument.
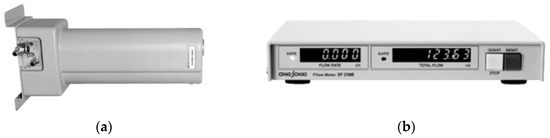
Figure 3.
Gasoline consumption instrument. (a) The flow sensor of the gasoline consumption instrument; (b) The display of the gasoline consumption instrument.
2.3.2. Route Selection
In order to ensure the singular influence of traffic flow conditions on vehicle carbon emissions, it is necessary to avoid other interference factors such as environmental conditions, road geometry alignment, and emergency scenarios. Test sections should reflect the basic road sections of the expressway (apart from special sections such as toll stations, expressway exits and entrances, tunnels, or bridges). The route alignment should be a flat line or a flat large-radius curve. There should be no traffic accidents during the test. The road surface should be dry and undamaged, and the weather should be clear.
The test section is selected from the Qujiang to Hechizhai section of the Xi’an beltway with a total length of 17.1 km, design speed of 120 km/h, and six lanes. The geometric design of the test route is mostly a flat line. The minimum radius of the flat curve is 1900 m and the maximum longitudinal slope is 1.5%. The weather was fair during the test.
2.3.3. Test Vehicle
The vehicle classification statistical instrument was placed on the test section prior to the test to calibrate for the truck and car, respectively, with a large traffic volume. Based on the traffic volume data on the test road and the development prospects of vehicles, three-axle trucks and passenger cars were selected as dominant vehicle types. The Jiefang heavy truck was selected as the test truck (type CA1180P62K1L4E5, Jilin, China) at approximately 86 kg/kW. The Volkswagen Lavida was selected as the test car (type 2014 1.4T SI DSG Sport, Shanghai, China) at approximately 16 kg/kW.
2.3.4. Driver Selection
Driver performance varies depending on personal driving preferences and experience, so drivers were screened before the field test to ensure they were sufficiently experienced and familiar with the road. Each driver was given 10 days of training and testing to prevent any incorrect driving operations from affecting the test results. The driver was required to drive normally, avoid any aggressive driving behavior, and maintain a safe distance from the vehicle in front of them. Ten male drivers between 15–20 years of driving experience passed the test. Five drivers were assigned to test passenger cars and the remaining five to test trucks.
2.3.5. Other Factors
The main objective of this study was to observe the relationship between carbon emissions and traffic flow patterns, so several measures were taken to prevent interference from other factors. In the field test, the carbon emissions of test vehicles on different traffic flow patterns were measured under controlled conditions in which the traffic flow pattern was changed while other factors such as vehicle load, driver’s skills, vehicle age distribution, and climatic conditions remained fixed. The detailed conditions of the field test are listed in Table 3.
Table 3.
Field test conditions.
3. Results
Tests were repeated under different traffic flow conditions (free flow, steady flow, unstable flow, and congested flow) during peak and off-peak periods to gather the 100 km carbon emissions of trucks and passenger cars (also referred to below as simply “CT” and “CC”, respectively) as shown in Figure 4 and Figure 5.
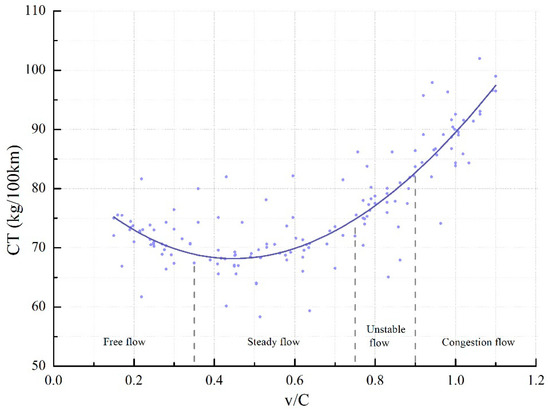
Figure 4.
Field test data (truck).
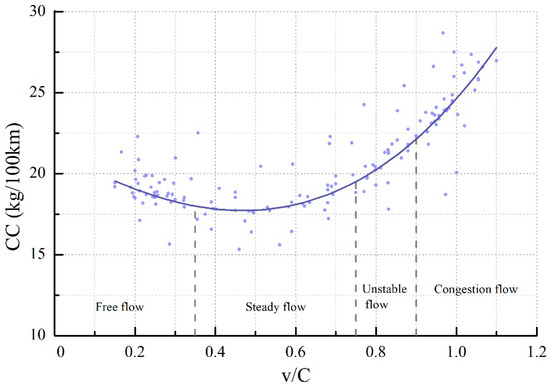
Figure 5.
Field test data (passenger car).
As shown in Figure 4 and Figure 5, the carbon emissions profile form of trucks and passenger cars is approximated by a polynomial function or an exponential function with v/C values ranging between 0.15 and 1.1. CE first slightly decreases as v/C increases, then sharply increases. As expected, vehicle carbon emissions were highest under congested flow conditions followed by unstable flow conditions, free flow conditions, and steady flow conditions. From the steady flow patterns to the unstable flow patterns, the carbon emissions increase slowly. From the unstable flow conditions to the congestion flow conditions, the carbon emissions increase sharply. The traffic flow patterns have a significant impact on the carbon emissions of both trucks and passenger cars. The carbon emissions of trucks are 3.5–4 times higher than those of passenger cars.
The minimum carbon emissions rate, which is the lowest point of the carbon emissions regression curve, did not emerge with the smallest v/C. As shown in Figure 4 and Figure 5, the carbon emissions of trucks and passenger cars with v/C between 0.4 and 0.5 were relatively small. As v/C increases beyond 0.5, the road becomes more congested and interference between vehicles becomes more serious. The frequent accelerations, decelerations, and stop-and-go behavior cause an increase in carbon emissions. When v/C falls below 0.4, the degree of congestion of the road is reduced—drivers are freer to move and to move at higher speeds, which introduces higher specific power and engine load [27,28]. As engine load increases, fuel consumption increases as does carbon emissions. When v/C is greater than 0.5, the road congestion caused by increased traffic volumes causes a sharp increase in carbon emissions. When v/C is less than 0.4, the smaller traffic volume leads to greater driving freedom which results in a gradual increase in carbon emissions as well.
SPSS was used to analyze the field test data. Pearson’s correlation coefficient was used to assess the correlation of carbon emissions with the index we used. Significant correlations between carbon emissions and v/C were observed for both trucks and passenger cars (Table 4 and Table 5). It is necessary to establish the specific quantitative relationship models between v/C and the carbon emissions of vehicles (trucks and passenger cars, respectively).
Table 4.
Correlations between v/C and carbon emissions (truck).
Table 5.
Correlations between v/C and carbon emissions (passenger car).
A cubic equation model was used to represent the carbon emission rule with v/C as the explanatory variable and carbon emissions as the dependent variable (significance level of 0.05). The F-test value for the carbon emissions prediction models of truck and passenger car were 150.221 and 159.790, respectively. The significance probability (P) of the regression models were both 0.000 < 0.05, which reveals a confidence interval higher than 95%. The t-values of each coefficient in the regression equations were greater than 1.960 (where 1.960 is the two-tailed interval value of the t distribution corresponding to the significance level of 0.05), and the p-values corresponding to each coefficient in the regression equations were less than 0.05; these t-test results together indicate a significant relationship between v/C and vehicle carbon emissions. The coefficients of determination R2 for the carbon emissions prediction models of truck and passenger car were 0.745 and 0.759, respectively. The statistical test results imply that the proposed models have strong interpretation ability. Carbon emission prediction models of the diesel truck and passenger car under different v/C values were attained based on cubic regression analysis results as Equations (7) and (8).
where CT indicates the predicted carbon emissions of diesel truck (kg/100 km), CC indicates the predicted carbon emissions of gasoline passenger car (kg/100 km), and the range of v/C is 0.15 to 1.1.
CT = 84.447 − 74.985 × (v/C) + 91.357 × (v/C)2 − 11.297 × (v/C)3,
CC = 21.428 − 14.122 × (v/C) + 9.687 × (v/C)2 + 7.643 × (v/C)3,
The models presented above can quantify the carbon emissions of the typical vehicles in China under different traffic flow patterns, and only apply to v/C in the range of 0.15 to 1.1. The diesel truck appears to produce the lowest amount of carbon emissions and at the lowest emissions rate when v/C = 0.448. Passenger car emissions are the lowest and are produced at the lowest rate when v/C = 0.469. In this case, the road is at the secondary service level and the carbon emission rate is minimal. This conclusion may provide a workable reference for the control and management of actual traffic flows in the road operation stage from the perspective of environmental protection.
The above results suggest that the free flow pattern is not the most suitable for low-carbon traffic flow control and management, but rather the steady flow pattern with v/C control float around 0.45 and is optimal. Vehicles on the road in congested or unstable flow pattern are dispersed to the road section unlike the free-flow pattern, which is not only conducive to reducing traffic congestion but also eliminates the excess traffic capacity of the road section in a free-flow pattern. When a section of the expressway is congested over the long-term to the point that traffic dispersion measures cannot alleviate the congestion, it is necessary to expand pre-built expressway sections, fundamentally resolve the excessive traffic volume problem, and alleviate the environmental pressure caused by vehicle carbon emissions.
4. Discussion
In the carbon emission models established in this study, v/C directly indicates traffic flow patterns; the prediction model requires only the v/C as input data, which is easily accessed and thus highly practical. Time and cost limitations required that field test data be gathered under intermittent v/C values—the v/C range was 0.15–1.1, while data outside of this range were not detected. There are limitations to the use of the v/C indicator to estimate carbon emissions. The ratio v/C does not allow the measurement of real speed and density variables under unstable or congested conditions. By using v/C to characterize the traffic flow patterns, it is impossible to propose a real-time evacuation scheme for road congestion at the link or network level as network fundamental diagrams [26] do. The focus of this study was to obtain a practical quantitative model of carbon emissions under different traffic flow conditions, so v/C was used to characterize the traffic flow patterns. The real-time micro-control of the traffic flow at the link and network level yet merits further research using a broader set of traffic data in consideration of factors such as speed and density.
The Jiefang heavy truck and Volkswagen Lavida passenger car were selected as test vehicles in this study. They do not represent the carbon emissions of all vehicles nor the carbon emissions rule of passing vehicles on an actual expressway. The carbon emission quantification models of the typical trucks and passenger cars were the focus of this study. Models for other types of vehicles may be established in the future based on the carbon emissions rules proposed in this paper. Similarly, future research focused on the quantification of carbon emissions should encompass the effects of other factors (e.g., highway geometry features and vehicle loads). The combined influences of these factors under special situations also merit further research.
This study was conducted to explore the carbon emissions rules of Chinese typical vehicles under different traffic flow patterns on a typical expressway, and conducted under consideration of factors such as vehicle characteristics and fuel characteristics in China. The results of this study are applicable to the typical vehicles on Chinese expressways. In this study, field test data were analyzed to confirm that carbon emissions are highest under congested traffic flow conditions followed by unstable flow, free flow, and steady flow conditions. When v/C is greater than 0.5, an increase in v/C leads to a sharp increase in carbon emissions. The carbon emissions of vehicles with v/C between 0.4 and 0.5 are relatively small. When v/C is less than 0.4, the decrease in v/C leads to a gradual increase in carbon emissions. Specific carbon emissions models were established for trucks and passenger cars based on different traffic flow conditions accordingly with v/C as an explanatory variable. The rule of vehicle carbon emissions was consistent with the cubic fitting equation function. The results support a close relationship between carbon emissions and traffic flow patterns.
The carbon emission models established in this paper can be used to quantify the adverse environmental effects of vehicle operation on the expressway, and thus may serve as a workable basis for expressway management practices centered on emissions reduction. The proposed models are also applicable to vehicle fuel consumption prediction based on the strong relationship between fuel consumption and CO2 emissions. There are many pre-built highways that urgently need to be expanded to alleviate congestion problems, the results presented in this paper may represent objective and scientific data to support this work.
Author Contributions
Conceptualization, Y.D.; data curation, Y.D., X.L. and Z.D.; formal analysis, Y.D. and H.R.; funding acquisition, J.X.; methodology, Y.D. and Z.D.; project administration, J.X.; supervision, C.G. and X.L.; validation, C.G. and H.R.; writing—original draft, Y.D.; writing—review and editing, J.X.
Funding
This research was funded by the National Key Research and Development Program of China (Grant no. 2016YFC0802208), the Key Transport Technology Projects of China Transport Ministry (Grant no. 2018-ZD1-001,2018-MS1-001), and the Transport Technology Project of Shandong Province (Grant no. 2017B50).
Conflicts of Interest
The authors declare no conflict of interest.
References
- Vlieger, I.D.; Keukeleere, D.D.; Kretzschmar, J.G. Environmental effects of driving behaviour and congestion related to passenger cars. Atmos. Environ. 2000, 34, 4649–4655. [Google Scholar] [CrossRef]
- Choudhary, A.; Gokhale, S. Urban real-world driving traffic emissions during interruption and congestion. Transp. Res. Part D 2016, 43, 59–70. [Google Scholar] [CrossRef]
- Hemmerle, P.; Koller, M.; Rehborn, H.; Kerner, B.S.; Schreckenberg, M. Fuel consumption in empirical synchronised flow in urban traffic. Iet Intell. Transp. Syst. 2016, 10, 122–129. [Google Scholar] [CrossRef]
- Li, C.; Shimamoto, S. An Open Traffic Light Control Model for Reducing Vehicles’ CO2 Emissions Based on ETC Vehicles. IEEE Trans. Veh. Technol. 2012, 61, 97–110. [Google Scholar] [CrossRef]
- Harrington, W.; Mcconnell, V.D.; Cannon, M. A Behavioral Analysis of EPA’s MOBILE Emission Factor Model. Discuss. Pap. 1998. Available online: https://ageconsearch.umn.edu/record/10676/ (accessed on 17 May 2019).
- Barth, M.; An, F.; Younglove, T.; Scora, G.; Levine, C.; Ross, M.; Wenzel, T. NCHRP Web-Only Document 122: The Development of a Comprehensive Modal Emissions Model; Final Report; Transportation Research Board of the National Academies: Washington, DC, USA, 2008. [Google Scholar]
- Abou-Senna, H.; Radwan, E.; Westerlund, K. Using a traffic simulation model (VISSIM) with an emissions model (MOVES) to predict emissions from vehicles on a limited-access highway. J. Air Waste Manag. Assoc. 2013, 63, 819–831. [Google Scholar] [CrossRef] [PubMed]
- Kerner, B.S.; Lieu, H. The Physics of Traffic: Empirical Freeway Pattern Features, Engineering Applications, and Theory. Phys. Today 2005, 58, 54–56. [Google Scholar]
- Kerner, B.S. Introduction to Modern Traffic Flow Theory and Control: The Long Road to Three-Phase Traffic Theory; Springer: Berlin, Germany, 2009. [Google Scholar]
- Gartner, N.H.; Stamatiadis, C. Traffic Networks, Optimization and Control of Urban. Encyclopedia of Complexity and System Science; Springer: New York, NY, USA, 2009. [Google Scholar]
- Dion, F.; Rakha, H.; Kang, Y.S. Comparison of delay estimates at under-saturated and over-saturated pre-timed signalized intersections. Transp. Res. Part B 2004, 38, 99–122. [Google Scholar] [CrossRef]
- Geroliminis, N.; Skabardonis, A. Identification and Analysis of Queue Spillovers in City Street Networks. IEEE Trans. Intell. Trans. Syst. 2011, 12, 1107–1115. [Google Scholar] [CrossRef]
- Barth, M.; Boriboonsomsin, K. Real-world carbon dioxide impacts of traffic congestion. Transp. Res. Rec. 2008, 2058, 163–171. [Google Scholar] [CrossRef]
- Zhu, W. Analysis of CO2 emission in traffic flow and numerical tests. Phys. A Stat. Mech. Its Appl. 2013, 392, 4787–4792. [Google Scholar] [CrossRef]
- Li, Z.; Chen, L.; Xu, S. Analytical studies of CO2 emission in a mixed traffic flow with different vehicles. Phys. A Stat. Mech. Its Appl. 2014, 413, 320–328. [Google Scholar]
- Oguchi, T.; Katakura, M.; Taniguchi, M. Carbon dioxide emission model in actual urban road vehicular traffic conditions. JSCE J. 2002, 1, 125–136. [Google Scholar]
- May, J.; Favre, C.; Bosteels, D. On-Road Testing and PEMS Data Analysis for two Euro 6 Diesel Vehicles. SAE Int. J. Fuels Lubr. 2014, 7, 919–934. [Google Scholar]
- Mamakos, A.; Bonnel, P.; Perujo, A. Assessment of portable emission measurement systems (PEMS) for heavy-duty diesel engines with respect to particulate matte. J. Aerosol Sci. 2013, 57, 54–70. [Google Scholar] [CrossRef]
- IPCC (Intergovernmental Panel on Climate Change). Guidelines for National Greenhouse Gas Inventories; Prepared by the National Greenhouse Gas Inventories Program; Egglestone, H.S., Buendia, L., Miwa, K., Ngara, T., Tanabe, K., Eds.; IGES: Tsukuba, Japan, 2006; Volume 2. [Google Scholar]
- National Development and Reform Commission, Climate Change Division. Second National Communications on Climate Change in the People’s Republic of China; China Economic Publishing House: Beijing, China, 2013. [Google Scholar]
- Chinese Government. The First Two-Year Update Report on Climate Change in the People’s Republic of China. Available online: http://www.webcitation.org/75mAIC7ah (accessed on 28 January 2019).
- National Development and Reform Commission, Department of Climate Change. Land Transport Companies’ Greenhouse Gas Emissions Accounting Methods and Reporting Guidelines (Trial); NDRC: Beijing, China, 2015. Available online: http://www.ndrc.gov.cn/zcfb/zcfbtz/201511/W020151111537500754764.pdf (accessed on 16 May 2019).
- Transportation Research Board (TRB). Highway Capacity Manual; Special Report 87; National Research Council: Washington, DC, USA, 2000. [Google Scholar]
- Technical Standards for Highway Engineering (JTG B01-2014); China Standard Press: Beijing, China, 2014.
- Editorial Board of China Highway Society. Handbook of Traffic Engineering; People’s Communications Press: Beijing, China, 2001. [Google Scholar]
- Alonso, B.; Portilla, A.L.; Musolino, G.; Rindone, C.; Vitetta, A. Network Fundamental Diagram (NFD) and traffic signal control: First empirical evidences from the city of Santander. Transp. Res. Proced. 2017, 27, 27–34. [Google Scholar] [CrossRef]
- Song, G.; Yu, L. Estimation of Fuel Efficiency of Road Traffic by Characterization of Vehicle-Specific Power and Speed Based on Floating Car Data. Transp. Res. Rec. J. Transp. Res. Board 2009, 2139, 11–20. [Google Scholar] [CrossRef]
- Zhai, H.; Frey, H.C.; Rouphail, N.M. A Vehicle-Specific Power Approach to Speed- and Facility-Specific Emissions Estimates for Diesel Transit Buses. Environ. Sci. Technol. 2008, 42, 7985–7991. [Google Scholar] [CrossRef] [PubMed]


© 2019 by the authors. Licensee MDPI, Basel, Switzerland. This article is an open access article distributed under the terms and conditions of the Creative Commons Attribution (CC BY) license (http://creativecommons.org/licenses/by/4.0/).