Do Analysts Fully Reflect Information in Patents about Future Earnings?


Abstract
:1. Introduction
2. Background and Hypotheses
2.1. Patent Citations and Business Performance
2.2. Patent Citations and the Information Environment
2.3. Analysts’ Forecasting Activities and Patent Citations
3. Research Design and Sample Description
3.1. A Test of Patent Citations and Business Performance
- = Earnings per share in year t + 1;
- = Consensus of analyst forecasts for earnings per share for year issued in year t;
- (EPS consensus − Actual EPS)/Actual EPS;
- Natural log of the patent stock in year t, the total number of patents granted thus far in year t;
- Natural log of the citation stock in year t, the total number of citations that a firm’s patent stock received thus far (year t) from other firms’ patents.
3.2. A Test of Patent Citations and Information Environment
- The number of analysts covering a firm in year t;
- Ln (total assets);
- Total liabilities/Total assets;
- Net income/Total assets;
- (Debt financing + Equity financing)/Total assets.
- See Equation (1) for other variable definitions.
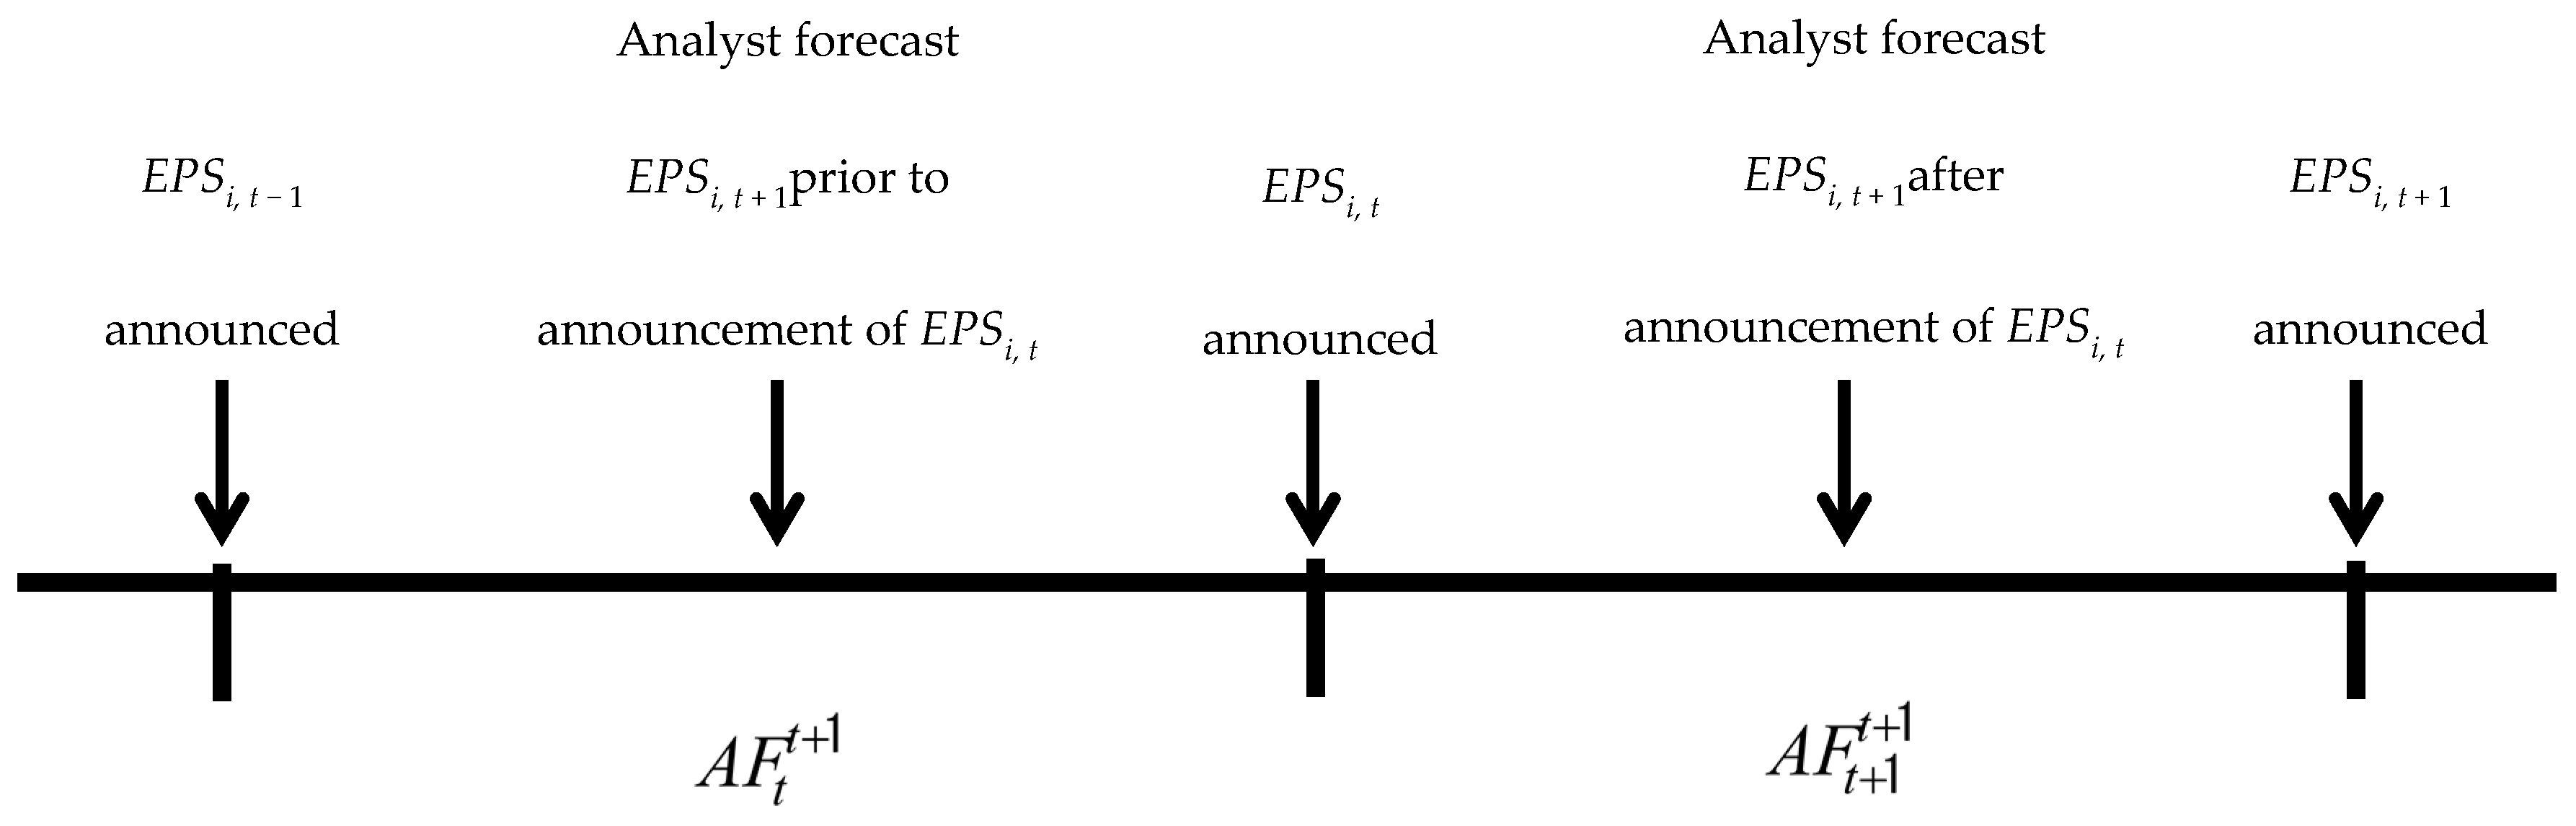
3.3. A Test of Analysts’ Forecasting Activities on Patent Citations
- Consensus of analyst forecasts for EPS for year t + 1 issued in year t + 1.
- See Equation (1) for other variable definitions.
- = Consensus of analyst forecasts for earnings per share for year t + 1 issued in year t;
- Consensus of analyst forecasts for earnings per share for year t + 1 issued in year t + 1;
- Actual earnings per share for year t;
- (EPS consensus − Actual EPS)/Actual EPS;
- Natural log of the patent stock at t, the total number of patents granted thus far, in year t;
- Natural log of the citation stock in year t, the total number of citations of a firm’s patent stock thus far (year t) from other firms’ patents.
3.4. Sample Selection
4. Empirical Results
4.1. A Univariate Test
4.2. Main Results
4.3. Long-Term Forecasting Window
5. A Summary and Conclusions
Author Contributions
Funding
Conflicts of Interest
References
- Deng, Z.; Lev, B.; Narin, F. Science and technology as predictors of stock performance. Financ. Anal. J. 1999, 55, 20–32. [Google Scholar] [CrossRef]
- Lanjouw, J.; Schankerman, M. Characteristics of patent litigation: A window on competition. J. Econ. 2001, 32, 129–151. [Google Scholar] [CrossRef]
- Trajtenberg, M. The welfare analysis of product innovations with an application to computed tomography scanners. J. Political Econ. 1989, 97, 445–479. [Google Scholar] [CrossRef]
- Trajtenberg, M. A penny for your quotes: Patent citations and the value of innovations. Rand J. Econ. 1990, 21, 172–187. [Google Scholar] [CrossRef]
- Hall, H.B.; Jaffe, A.; Trajtenberg, M. Market value and patent citations. Rand J. Econ. 2005, 36, 16–38. [Google Scholar]
- Hirshleifer, D.; Hsu, P.H.; Li, D. Innovative efficiency and stock returns. J. Financ. Econ. 2013, 107, 632–654. [Google Scholar] [CrossRef] [Green Version]
- Nelson, R.R.; Winter, S.G. An Evolutionary Theory of Economic Change; Belknap Press of Harvard University Press: Cambridge, MA, USA, 1982. [Google Scholar]
- Brown, J.R.; Petersen, B.C. Why has the investment-cash flow sensitivity declined so sharply? Rising R&D and equity market developments. J. Bank. Financ. 2009, 33, 971–984. [Google Scholar]
- Amir, E.; Lev, B. Value-relevance of nonfinancial information: The wireless communication industry. J. Account. Econ. 1996, 22, 3–30. [Google Scholar] [CrossRef]
- Behn, B.K. Value implications of unfilled order backlogs. Adv. Account. 1996, 14, 61–84. [Google Scholar]
- Ittner, C.; Larcker, D. Are nonfinancial measures leading indicators of financial performance? An analysis of customer satisfaction. J. Account. Res. 1998, 36, 1–36. [Google Scholar] [CrossRef]
- Trueman, B.; Wong, F.; Zhang, X. The eyeballs have it: Searching for the value in internet stocks. J. Account. Res. 2001, 38, 137–162. [Google Scholar] [CrossRef]
- Rajgopal, S.; Venkatachalam, M.; Kotha, S. The value relevance of network advantages: The case of e-commerce firms. J. Account. Res. 2003, 41, 135–162. [Google Scholar] [CrossRef]
- Rajgopal, S.; Venkatachalam, M.; Kotha, S. Managerial actions stock returns and accounting earnings: The case of business-to-business internet firms. J. Account. Res. 2002, 40, 529–556. [Google Scholar] [CrossRef]
- Cockburn, I.; Griliches, Z. Industry effects and appropriability measures in the stock market’s valuation of R&D and patents. Am. Econ. Rev. 1988, 78, 419–423. [Google Scholar]
- Acs, Z.J.; Audretsch, D.B. Patents as a measure of innovative activity. Kyklos 1989, 42, 171–180. [Google Scholar] [CrossRef]
- Napolitano, G.; Sirilli, G. The patent system and the exploitation of inventions: Results of a statistical survey conducted in Italy. Technovation 1990, 10, 5–16. [Google Scholar] [CrossRef]
- Cantwell John, A.; Hodson, C. Global R&D and UK competitiveness. Global Research Strategy and International Competitiveness; Basil Blackwell: Oxford, UK, 1991. [Google Scholar]
- Patel, P.; Pavitt, K. Patterns of technological activity: Their measurement and interpretation. In Handbook of the Economics of Innovations and Technological Change; Stoneman, P., Ed.; Blackwell: Cambridge, MA, USA, 1995; pp. 14–51. [Google Scholar]
- Freeman, C.; Soete, L. The Economics of Industrial Innovation, 3rd ed.; MIT Press: Cambridge, MA, USA, 1997. [Google Scholar]
- Griliches, Z. Patent Statistics as Economic Indicators: A Survey; University of Chicago Press: Chicago, IL, USA, 1998; pp. 287–343. [Google Scholar]
- Bresman, J.; Birkinshaw, J.; Nobel, R. Knowledge transfer in international acquisitions. J. Int. Bus. Stud. 1999, 30, 439–462. [Google Scholar] [CrossRef]
- Cohen, W.M.; Levin, R. Empirical studies of innovation and market structure. In Handbook of Industrial Organization; Schmalensee, R., Willig, R., Eds.; Elsevier: Amsterdam, The Netherlands, 1989. [Google Scholar]
- Dosi, G. Technological paradigms and technological trajectories. Res. Policy 1982, 11, 147–162. [Google Scholar] [CrossRef]
- Archibugi, D. Patenting as an indicator of technological innovation: A review. Sci. Public Policy 1992, 19, 357–368. [Google Scholar]
- Harhoff, D.; Narin, F.; Scherer, F.M.; Vopel, K. Citation frequency and the value of patented inventions. Rev. Econ. Stat. 1999, 81, 511–515. [Google Scholar] [CrossRef]
- Scherer, F.M. Corporate inventive output profits, and growth. J. Political Econ. 1965, 73, 290–297. [Google Scholar] [CrossRef]
- Hu, D.; Chen, H.; Huang, Z.; Roco, M.C. Longitudinal study on patent citations to academic research articles in nanotechnology (1997–2004). J. Nanoparticle Res. 2007, 9, 529–542. [Google Scholar] [CrossRef]
- Criscuoloa, P.; Verspagen, B. Does it matter where patent citations come from? Inventor vs. examiner citations in European patents. Res. Policy 2008, 37, 1892–1908. [Google Scholar] [CrossRef]
- Ribeiro, L.C.; Ruiz, R.M.; Bernardes, A.T.; Albuquerque, E.M. Matrices of science and technology interactions and patterns of structured growth: Implications for development. Scientometrics 2010, 83, 55–75. [Google Scholar] [CrossRef]
- Callaert, J.; Grouwels, J.; Looy, B.V. Delineating the scientific footprint in technology: Identifying scientific publications within non-patent references. Scientometrics 2012, 91, 383–398. [Google Scholar] [CrossRef]
- Albert, M.B.; Avery, D.; Narin, F.; McAllister, P. Direct validation of citation counts as indicators of industrially important patents. Res. Policy 1991, 20, 251–259. [Google Scholar] [CrossRef]
- Bresnahan, T. Post-entry competition in the plain paper copier market. Am. Econ. Rev. 1985, 75, 15–19. [Google Scholar]
- Narin, F.; Noma, E.; Perry, R. Patents as indicators of corporate technological strength. Res. Policy 1987, 16, 143–155. [Google Scholar] [CrossRef]
- Gu, F. Innovation future earnings, and market efficiency. J. Account. Audit. Financ. 2005, 20, 385–418. [Google Scholar] [CrossRef]
- Han, S.; Jin, T.K.; Lobo, G. Managerial ownership and financial analysts’ information environment. J. Bus. Financ. Account. 2014, 41, 328–362. [Google Scholar] [CrossRef]
- Bhushan, R. Firm characteristics and analyst following. J. Account. Econ. 1989, 11, 255–274. [Google Scholar] [CrossRef]
- Bhushan, R.; O’Brien, P.C. Analyst following and institutional ownership. J. Account. Res. 1990, 28, 55–76. [Google Scholar]
- Lang, M.; Lundholm, R. Corporate disclosure policy and analyst behavior. Account. Rev. 1996, 71, 467–492. [Google Scholar]
- Bushman, R.; Piotroski, J.; Smith, A. What determines corporate transparency? J. Account. Res. 2004, 42, 207–252. [Google Scholar] [CrossRef]
- Niehaus, G.; Zhang, D.H. The impact of sell-side analyst research coverage on an affiliated broker’s market share of trading volume. SSRN Electron. J. 2010, 34, 776–787. [Google Scholar] [CrossRef]
- McNichols, M.; O’Brien, P.C. Self-selection and analyst coverage. J. Account. Res. 1997, 35, 167–199. [Google Scholar] [CrossRef]
- Penman, S.H. An evaluation of accounting rates-of-return. J. Account. Audit. Financ. 1991, 6, 233–255. [Google Scholar] [CrossRef]
- Penman, S.H. Financial Statement Analysis and Security Valuation, 4th ed.; McGraw-Hill Irwin: New York, NY, USA, 2010. [Google Scholar]
- Ajinkya, B.; Gift, M. Dispersion of financial analysts’ earnings forecasts and the (option model) implied standard deviations of stock returns. J. Financ. 1985, 40, 1353–1365. [Google Scholar] [CrossRef]
- Barth, E.M.; Kasznik, R.; McNichols, M.F. Analyst coverage and intangible assets. J. Account. Res. 2001, 39, 1–34. [Google Scholar] [CrossRef]
- Barron, O.E.; Byard, C.K.; Riedl, E.J. High-technology intangibles and analysts’ forecasts. J. Account. Res. 2002, 40, 289–312. [Google Scholar] [CrossRef]
- Ciftci, M.; Darrough, M. What explains the valuation difference between intangible-intensive profit and loss firms? J. Bus. Financ. Account. 2015, 42, 138–166. [Google Scholar] [CrossRef]
- Datta, S.; Iskandar-Datta, M.; Sharma, V. Product market pricing power industry concentration and analysts’ earnings forecasts. J. Bank. Financ. 2011, 35, 1352–1366. [Google Scholar] [CrossRef]
- Palmon, D.; Yezegel, A. R&D intensity and the value of analysts’ recommendations. Contemp. Account. Res. 2012, 29, 621–654. [Google Scholar]
- Cohen, L.; Diether, K.; Malloy, C. Misvaluing innovation. Rev. Financ. Stud. 2013, 26, 635–666. [Google Scholar] [CrossRef]
- Hirshleifer, D.A.; Hsu, P.H.; Li, D. Innovative originality profitability, and stock returns. Rev. Financ. Stud. 2018, 31, 2553–2605. [Google Scholar] [CrossRef]
- Sloan, R.G. Do stock prices fully reflect information in accruals and cash flows? Account. Rev. 1996, 71, 289–315. [Google Scholar]
- Xie, H. The mispricing of abnormal accruals. Account. Rev. 2001, 76, 357–373. [Google Scholar] [CrossRef]
- Stober, T. Summary financial statement measures and analysts’ forecast of earnings. J. Account. Econ. 1992, 15, 347–372. [Google Scholar] [CrossRef]
- Abarbanell, J.; Bushee, B. Fundamental analysis future earnings, and stock price. J. Account. Res. 1997, 35, 1–24. [Google Scholar] [CrossRef]
- O’Brien, P. Analysts forecasts as earnings expectations. J. Account. Econ. 1988, 10, 53–83. [Google Scholar] [CrossRef]
- Ali, A.; Klein, A.; Rosenfeld, J. Analysts’ use of information about permanent and transitory earnings components in forecasting annual EPS. Account. Rev. 1992, 67, 183–198. [Google Scholar]
- Amir, E.; Lev, B.; Sougiannis, T. Do financial analysts get intangibles? Eur. Account. Rev. 2003, 12, 635–659. [Google Scholar] [CrossRef]
- Gu, F.; Wang, W. Intangible assets information complexity, and analysts’ earnings forecasts. J. Bus. Financ. Account. 2005, 32, 1673–1702. [Google Scholar] [CrossRef]
- Lys, T.; Sohn, S. The association between revisions of financial analysts’ earnings forecasts and security-price changes. J. Account. Econ. 1990, 13, 341–363. [Google Scholar] [CrossRef]
- Abarbanell, J.S. Do analysts’ earnings forecasts incorporate information in prior stock price changes? J. Account. Econ. 1991, 14, 147–165. [Google Scholar] [CrossRef]
- Griliches, Z. Market value R&D and patents. Econ. Lett. 1981, 7, 183–187. [Google Scholar]
- Lev, B. Intangibles: Management Measurement, and Reporting; Brookings Institution Press: Washington, DC, USA, 2001. [Google Scholar]
- Lev, B.; Sougiannis, T. The capitalization amortization, and value–relevance of R&D. J. Account. Econ. 1996, 21, 107–138. [Google Scholar]
- Jones, D. Voluntary disclosure in R&D-intensive industries. Contemp. Account. Res. 2007, 24, 489–522. [Google Scholar]
- Bhattacharya, S.; Ritter, J.R. Innovation and communication: Signaling with partial disclosure. Rev. Econ. Stud. 1983, 50, 331–346. [Google Scholar] [CrossRef]
- Anton, J.J.; Yao, D.A. The sale of ideas: Strategic disclosure property rights, and contracting. Rev. Econ. Stud. 2002, 69, 513–531. [Google Scholar] [CrossRef]
- Brown, S.; Hillegeist, S. How disclosure quality affects the level of information asymmetry. Rev. Account. Stud. 2007, 12, 443–477. [Google Scholar] [CrossRef]
- Pertersen, M.A. Estimating Standard Errors in Finance Panel Data Sets: Comparing Approaches. The Rev. of Fin. Stud. 2009, 22, 435–480. [Google Scholar] [CrossRef]
- Mishkin, F. A Rational Expectations Approach to Macroeconometrics: Testing Policy Effectiveness and Efficient-Market Models; University of Chicago Press: Chicago, IL, USA, 2007. [Google Scholar]
- Kasznik, R.; McNichols, M.F. Does meeting earnings expectations matter? Evidence from analyst forecast revisions and share prices. J. Account. Res. 2002, 40, 727–759. [Google Scholar] [CrossRef]
- Yu, F. Analyst coverage and earnings management. J. Financ. Econ. 2008, 88, 245–271. [Google Scholar] [CrossRef]
- Kasznik, R. On the association between voluntary disclosure and earnings management. J. Account. Res. 1999, 37, 57–81. [Google Scholar] [CrossRef]
- Dechow, M.P.; Dichev, I. The quality of accruals and earnings: The role of accrual estimation errors. Account. Rev. 2002, 77, 35–59. [Google Scholar] [CrossRef]
- Irvine, P.J. Do analysts generate trade for their firms? Evidence from the Toronto stock exchange. J. Account. Econ. 2001, 30, 209–226. [Google Scholar] [CrossRef]
- Eddy, A.; Seifert, B. An examination of hypotheses concerning earnings forecast errors. Q. J. Bus. Econ. 1992, 31, 22–37. [Google Scholar]
- Lobo, G.J.; Song, M.; Stanford, M. Accruals quality and analyst coverage. J. Bank. Financ. 2012, 36, 497–508. [Google Scholar] [CrossRef]
- Barth, M.; Hutton, A. Analyst earnings forecast revisions and the pricing of accruals. Rev. Account. Stud. 2004, 9, 59–96. [Google Scholar] [CrossRef]
- Dugar, A.; Nathan, S. The effect of investment banking relationship on financial analysts’ earnings forecasts and investment recommendations. Contemp. Account. Res. 1995, 12, 131–160. [Google Scholar] [CrossRef]
- Lee, C.Y. A theory of firm growth: Learning capability knowledge threshold, and patterns of growth. Res. Policy 2010, 39, 278–289. [Google Scholar] [CrossRef]
- Frankel, R.; Li, X. Characteristics of a firm’s information environment and the information asymmetry between insiders and outsiders. J. Account. Econ. 2004, 37, 229–259. [Google Scholar] [CrossRef]
- Hirst, D.E.; Koonce, L.; Simko, P.J. Investor reactions to financial analysts’ research reports. J. Account. Res. 1995, 33, 335–351. [Google Scholar] [CrossRef]
- Givoly, D.; Lakonishok, J. The information content of financial analysts’ forecasts of earnings: Some evidence on semi-strong inefficiency. J. Account. Econ. 1979, 1, 165–185. [Google Scholar] [CrossRef]
- Francis, J.; Schipper, K.; Vincent, L. Earnings announcements and competing information. J. Account. Econ. 2002, 33, 313–342. [Google Scholar] [CrossRef]
- Chang, M.; Ng, J.; Yu, K. The influence of analyst and management forecasts on investors’ decision making: An experimental approach. Aust. J. Manag. 2008, 33, 47–67. [Google Scholar] [CrossRef]


| Variables | Mean | STD | MIN | Median | MAX |
|---|---|---|---|---|---|
| 1.569 | 1.058 | 0.020 | 1.355 | 5.391 | |
| 1.415 | 1.112 | −0.681 | 1.190 | 5.599 | |
| 1.369 | 1.198 | −1.360 | 1.160 | 5.910 | |
| 1.267 | 0.874 | 0.000 | 1.386 | 3.091 | |
| 0.097 | 1.526 | −12.294 | −0.001 | 48.868 | |
| 0.917 | 2.098 | 0.000 | 0.083 | 12.007 | |
| 5.775 | 2.991 | 0.000 | 6.009 | 11.804 | |
| 7.488 | 1.593 | 4.309 | 7.392 | 11.477 | |
| 0.544 | 0.171 | 0.144 | 0.551 | 0.929 | |
| 0.057 | 0.065 | −0.182 | 0.057 | 0.225 | |
| −0.019 | 0.092 | −0.279 | −0.025 | 0.305 |
| Variables | Coeff. | t-Stat. | |
|---|---|---|---|
| Intercept | −0.187 | −4.53 | *** |
| 0.866 | 52.52 | *** | |
| −0.032 | −4.48 | *** | |
| −0.008 | −1.47 | ||
| 0.016 | 3.51 | *** | |
| 0.048 | 5.76 | *** | |
| Industry Dummy | Included | ||
| Adjusted | 0.61 | ||
| F-stat. | 327.75 *** | ||
| Number of observations | 4,789 | ||
| Variables | Pred. Sign | Coeff. | t-Stat. | |
|---|---|---|---|---|
| Intercept | +/− | −0.457 | −5.04 | *** |
| +/− | 0.013 | 1.75 | * | |
| +/− | 0.012 | 2.04 | ** | |
| + | 0.279 | 23.07 | *** | |
| − | −0.600 | −7.15 | *** | |
| +/− | 0.327 | 1.54 | ||
| − | −0.283 | −2.11 | ** | |
| +/− | −0.043 | −4.85 | ** | |
| Industry Dummy | N/A | Included | ||
| Adjusted | 0.28 | |||
| F-stat. | 328.12 *** | |||
| Number of observations | 4,091 | |||
| Variables | Coeff. | t-Stat. | |
|---|---|---|---|
| Intercept | −0.140 | −4.58 | *** |
| 0.902 | 74.58 | *** | |
| −0.026 | −4.02 | *** | |
| −0.005 | −1.26 | ||
| 0.008 | 2.51 | ** | |
| 0.037 | 6.50 | *** | |
| Industry Dummy | Included | ||
| Adjusted | 0.75 | ||
| F-stat. | 932.29 *** | ||
| Number of observations | 4,789 | ||
| Variables | (Forecasting Equation) | (Earnings Equation) | Difference | ||||
|---|---|---|---|---|---|---|---|
| Coeff. | t-Stat. | Coeff. | t-Stat. | ||||
| Intercept | −0.140 | −3.51 | *** | −0.186 | −3.46 | *** | |
| 0.902 | 114.57 | *** | 0.866 | 81.12 | *** | ||
| −0.026 | −5.00 | *** | −0.032 | −4.56 | *** | ||
| −0.005 | −1.16 | −0.008 | −1.35 | 1.56 | |||
| 0.008 | 2.42 | ** | 0.016 | 3.34 | *** | 15.64 *** | |
| 0.037 | 5.90 | *** | 0.048 | 5.68 | *** | ||
| 0.75 | 0.61 | ||||||
| F-stat. | 408.28 *** | 372.41 *** | |||||
| Number of observations | 4,789 | 4,789 | |||||
| Panel A. H1 | |||||
| Variables | Coeff. | t-Stat. | |||
| Intercept | −0.141 | −3.19 *** | |||
| PATENTt | −0.005 | −1.21 | |||
| CITEt | 0.014 | 3.19 *** | |||
| Controls | Included | ||||
| Adjusted R2 | 0.65 | ||||
| F-stat. | 298.66 *** | ||||
| Observations | 4,155 | ||||
| Panel B. H2 | |||||
| Variables | Coeff. | t-Stat. | |||
| Intercept | −0.571 | −5.72 | |||
| PATENTt | −0.004 | −0.48 | |||
| CITEt | 0.011 | 1.73 * | |||
| Controls | Included | ||||
| Adjusted R2 | 0.27 | ||||
| F-stat. | 106.4 *** | ||||
| Observations | 3,588 | ||||
| Panel C. H3a | |||||
| Variables | Coeff. | t-Stat. | |||
| Intercept | −0.117 | −3.59 *** | |||
| PATENTt | −0.003 | −0.98 | |||
| CITEt | 0.008 | 2.33 ** | |||
| Controls | Included | ||||
| Adjusted R2 | 0.76 | ||||
| F-stat. | 559.62 *** | ||||
| Observations | 4,155 | ||||
| Panel D. H3b | |||||
| Variables | Coeff. | t-Stat. | Coeff. | t-Stat. | Difference |
| Intercept | −0.117 | −2.72 *** | −0.141 | −2.44 ** | |
| PATENTt | −0.003 | −0.91 | −0.005 | −1.10 | 1.19 |
| CITEt | 0.008 | 2.18 ** | 0.014 | 2.92 *** | 11.34 *** |
| Controls | Included | Included | |||
| Adjusted R2 | 0.76 | 0.62 | |||
| F-stat. | 376.07 *** | 193.48 *** | |||
| Observations | 4,155 | 4,155 | |||
© 2019 by the authors. Licensee MDPI, Basel, Switzerland. This article is an open access article distributed under the terms and conditions of the Creative Commons Attribution (CC BY) license (http://creativecommons.org/licenses/by/4.0/).
Share and Cite
Goh, J.; Lee, J.; Hur, W.; Ju, Y. Do Analysts Fully Reflect Information in Patents about Future Earnings? Sustainability 2019, 11, 2869. https://doi.org/10.3390/su11102869
Goh J, Lee J, Hur W, Ju Y. Do Analysts Fully Reflect Information in Patents about Future Earnings? Sustainability. 2019; 11(10):2869. https://doi.org/10.3390/su11102869
Chicago/Turabian StyleGoh, Jaimin, Jaehong Lee, Wonchang Hur, and Yunchang Ju. 2019. "Do Analysts Fully Reflect Information in Patents about Future Earnings?" Sustainability 11, no. 10: 2869. https://doi.org/10.3390/su11102869