Article

Revealing the Predominance of Culture over the Ecological Abundance of Resources in Shaping Local People’s Forest and Tree Species Use Behavior: The Case of the Vhavenda People, South Africa

by
Mulugheta G. Araia
* and
Paxie W. Chirwa
Forest Science Postgraduate Programme, Department of Plant and Soil Sciences, University of Pretoria, Pretoria, Hatfield 0028, South Africa
*
Author to whom correspondence should be addressed.
Sustainability 2019, 11(11), 3143; https://doi.org/10.3390/su11113143
Submission received: 1 May 2019 / Revised: 29 May 2019 / Accepted: 3 June 2019 / Published: 4 June 2019

Abstract

:
The resurrection of the traditional socio-ecological knowledge system as a complimentary biodiversity conservation tool for poorly performing protected areas has fueled a new debate on what drives resource use behavior in forest landscapes. Using ecological assessment and ethno-botanical techniques, we tested whether culture or the ecological abundance of resources can sufficiently explain the use behavior of traditional society for various livelihood-related utilities. Data were analyzed using parametric and non-parametric tests. The two communities of the Vhavenda people had homogenous cultural values, despite the fact that they reside in different forest conditions. The use value of habitats increases along the land use intensity gradient, as defined by cultural norms and taboos. However, despite the presumed strictness of rules related to state-protected indigenous forest, it had the same use value as with open access resource use zones. Almost no resource harvesting from culturally protected (sacred) forests was reported. Species abundance did not sufficiently explain their use value. Generally, the findings show that culture plays a predominant role in explaining use behavior. Neither is resource use decision random nor is the concept of protected areas a new concept to traditional society. Hence, capitalizing on the benefits of cultural assets in conservation action, through genuine partnership and the empowerment of local people, will ensure the sustainability of global biodiversity initiatives.

1. Introduction

The protected area approach to biodiversity conservation has been claimed to be an efficient and effective strategy under the scenario of limited conservation resources. However, the sustainability of its outcome in biodiversity conservation has generated polarized scientific opinion [1]. Different global assessments of the performance of protected areas have suggested that the majority of strictly protected areas are a failure—both in terms of ecological and social output [2]. The challenge for the sustainability and effectiveness of the protected area approach, in part, lies in its management strategy that often tries to solve biodiversity conservation challenges as purely an ecological problem [3]. It fails to address competing social demands [2] and often considers local people as part of the problem of biodiversity loss, not part of the solution [4]. This contravenes the long-held belief that people have used traditional socio-ecological knowledge in managing landscapes since time immemorial.
Traditional socio-ecological knowledge (TSEK) is an adaptive and complex system of experiential knowledge, practices, and beliefs of local people, governing relationships among themselves and with their surrounding ecosystems. Using this complex set of TSEK, local people have been making various land-use management decisions to obtain multiple benefits in their landscape. These include the delimitation of areas of the common resource use zone, culturally protected areas/sacred forests, the protection of rare species and the rotational resource/successional management of vegetation [5]. By doing so, local people have been reconciling their livelihood demands with biodiversity protection, sustainably. The knowledge, innovation and practices of such communities have been co-evolving to adapt to the changing environmental, political and socio-economic changes [5,6], through trial and error over time [5]. The legacy of pro-environmental cultural values and traditional conservation practices still exists in many parts of the world [7]. Nonetheless, there has been disagreement surrounding the validity of such claims.
For instance, Low [8] highlighted that local people’s resource use behavior is ecologically driven, based on an abundance of resources. It does not correlate with attitudes involving compliance with sacred protection. According to Low [8,9], the low impact on their environment is often not a result of a collective conscious effort to conserve their natural resources. Local people do not willingly sacrifice short-term benefits with the expectation of a greater common good in the long run. The low impact is purely due to a combination of low population density, inefficient extraction technology, and a lack of profitable markets for extracting products. With their recent meta-analysis, Gonçalves et al. [10] appear to partly support Low [8] in that there exists a correlation between the abundance of a species and the overall use values of the species. The correlation between the use value of a species and the specific category of utility was inconsistent. The utilities included fuel wood, construction materials, livestock grazing and browsing, wild food, and traditional medicines, factors which are important for the maintenance of rural livelihood.
Contrary to Low [8] and Gonçalves et al. [10], the recent study by Soares et al. [11] suggests that cultural factors play a predominant role over ecological factors in driving plant use and knowledge. The abundance of a species or the relative ecological importance of a species does not correlate to use value. One of the possible explanations for the lack of consistent conformity of abundance as a driver for human use behavior in Gonçalves et al. [10] could be due to the mismatch of the theoretical basis of most of the studies to actual human behavior. Most of the ethnobotanical studies were conducted using the “ecological appearance hypothesis”, which was formulated by Fenny [12] and Rhoades and Cates [13] for a different ecological question. The original intention of the hypothesis was to test if plant species that are visible and abundant are more susceptible to herbivory [14]. Unlike free grazing in herbivory, local communities design cultural institutions and social norms (e.g., traditional bylaws, rituals, and ceremonies) to regulate access and to sanction appropriate corrective measures when contravention to the governing rules of common resources is detected [7].
The above disagreement hints at the complexity of human behavior in managing relations among themselves and with surrounding ecosystems. The inherent assumption of the ecological appearance hypothesis is that individuals in society are rational and efficient in their choice of a species for various utilities [15]. This assumption is too simplistic to predict the human use behavior of communal resources. Human behavior is also influenced by cultural institutions and social norms [7]. Those cultural institutions and norms do not only govern the behavior of individuals towards a specific species (e.g., species-related taboos and totems); they also govern collective behavior towards the whole biodiversity of a landscape by using a complex set of TSEK and habitat-related taboos. However, the question of how these cultural institutions and norms determine the spatial distribution of land use intensity across different spatial hierarchies of a landscape has not been adequately researched [16]. Land use intensity has been suggested to be a good predictor to explore the relationship between culture and biodiversity, since it is often reciprocally affected by both over space and time [17].
Moreover, all people have culture that governs their relationship with their surrounding ecosystems. It is often easier to grasp the influence of different people’s cultures on environmental behavior when the lifestyles of groups are markedly distinct from each other [18]. At the same time, every landscape has a peculiar spatial heterogeneity of ecological resources, which has been shaped either by natural forces, cultural disturbance, or both [19]. Jointly, the aforementioned arguments imply that there is a need to study individuals and communities from a homogenous cultural group who reside in different forest landscapes in order to determine the factors that play a predominate role in use behavior. Thus, the central question of this study was to test if culture and ecological abundance have equal power to explain forest and tree use behavior in local communities. To the best of our knowledge, there has not been any research to that effect. The findings from our study may provide knowledge to promote the sustainable and collaborative conservation of forest landscapes that work both for biodiversity and for local people [20]. Based on the above arguments, we formulated and tested the following hypotheses:
  • Homogeneity of cultural value: communities from the same cultural group, but residing in different forest landscape conditions, demonstrate similar use behavior towards similar habitats (land use intensity), as specified by cultural institutions and social norms.
  • The use value gradient in the multifunctional landscape: the total use value of land use regimes in the multifunctional landscape increases with the increase of the socially perceived land use intensity gradient, both at a cultural group and household level.
  • Ecological appearance hypothesis: local people depend highly on the most abundant species in their landscape for various utilities [21].

2. Research Methodology

2.1. Study Area

This study was undertaken at two research sites in the Vhembe Biosphere Reserve (VBR) of South Africa: Thathe Vondo and Mafhela Forest Reserve Areas. The two Forest Reserve Areas (FR) belong to the eastern part of the Soutpansberg Mountain Forest complex that stretches from Louis Trichardt to Thohoyandou, and they are in proximity to each other. Thathe Vondo (TVFR) and Mafhela Forest Reserves (MFR) are located at 22°52′ S, 30°20′ E and 23°01′ S, 30°30.36 E, respectively (Figure 1). Both Forest Reserves retain some of the remaining moist forest cover in South Africa [22]. The region is known as a center for plant endemic species in the southern African region [23], and is dominated by the Vhavenda people.
The Vhavenda people are known to have rich traditional ecological knowledge and social norms to govern their landscape for multifunctional purposes. The traditional ecological knowledge has co-evolved alongside many environmental and institutional reforms [24,25]. For instance, parts of the landscape (sacred forests) that used to be governed by tribal authorities for centuries were replaced by commercial plantations due to forced displacement, according to the 1936 Native Trust and Land Act No. 18. [26]. While the displacement in MFR occurred in 1979 [27], the displacement in TVFR occurred in 1947 [26]. In both cases, the government also established a few fragmented indigenous forest patches within the parameter of the commercial plantation—which is still under stricter protection purely for conservation reasons.
In the location where local people relocated, there are still remnants of forest patches, including culturally protected areas (sacred forests) under the custody of traditional leaders. A recent inventory of useful plants by Magwede and van Wyk [28] revealed that the Vhavenda people still rely on about 189 species of trees and shrubs for various utilities including fuelwood, construction materials, livestock grazing and browsing, wild food, and traditional medicines. However, whether the legacy of their culture or the ecology (abundance) of remnant forest and tree species plays a predominant role in user behavior is unknown.
For this study, the existing land use regimes were classified, in consultation with traditional leaders, based on the TSEK and social norms: the configuration of trees, their typical cultural land use, protection gradient, and their management system. The existing tree-based traditional land use regimes of the two Forest Reserves of the biosphere were grouped into two major groups as follows:
(a)
Human modified landscape (HMFL): consisting of three tree-based traditional land use regimes, under the custody of traditional authorities and the local community. These are:
  • Trees along streams and rivers (TATR): local community members are not allowed to harvest live trees, but they occasionally use the area for livestock grazing, watering, and shading (relatively intermediately disturbed);
  • Common resource use zone (CRUZ): an open access area for the harvesting of wild food, construction materials, livestock browsing, and grazing, and traditional medicines (highly disturbed);
  • Culturally protected forest areas (CPA): includes sacred/holly forests that are protected by royal families for cultural values, and are only accessible to them (minimally disturbed).
(b)
State-protected indigenous forests (SIF): they are fragmented forest patches, presumably with minimal to nil human disturbance and legally protected by government conservation agencies.

2.2. Data Collection and Analysis

2.2.1. Ecological Assessment and Analysis

Each Forest Reserve (FR) consisted of three land use regimes of the HMFLs (CRUZ, TATR, and CPA) and SIF. The identification and location of land use regimes within the forest reserves was executed with the guidance of local informants. A similar approach was used for the identification of atypical land use regimes, involving local informants. It is believed to be appropriate to capture the local people’s perception and tree management practices in rural landscapes [29]. In each land use regime, five transects (Tr) were established (except the number of transects at TATR in Mafhela Forest Reserve, which was only three (3)). Each transect was 50 m long, and transects were separated from each other by at least 200 m. In each transect, three (3) 20 m × 10 m rectangular plots (P) were established and spaced 10 m apart along a linear transect.
All perennial woody plants with a diameter at breast height (dbh) ≥2 cm and a height of ≥2 m were considered as trees and enumerated. The scientific and vernacular names of observed tree species in each plot were recorded. Local informants who had substantive knowledge of tree identification in their local names were also used in the study. In instances where tree species identification was not possible in the field, tree voucher specimens were collected and later identified at the Thohoyandou Botanical Garden (Thohoyandou, South Africa) and Herbarium. Finally, the information was input into an abundance-based species sample matrix.
The effectiveness of the sampling effort on the species observed (Sob), for the whole study area and each reserve, was evaluated using a species accumulation curve based on Bootstrap estimators in Primer-E [30]. Our sampling effort was 88.70% of the whole study and about 88.00% for each FR. A sampling effort that captures ≥80% of the estimated species richness can be considered effective [31]. The similarity in species composition between the two FRs was calculated using the Jaccard similarity coefficient. To compare the similarity in species abundance between the two FRs, a two-way similarity percentage (SIMPER) analysis was used (Cut-off = 70%). SIMPER also provides an output on the contribution of a species to intra-group (within forest reserves) similarity, by taking the average contribution of the ith species (Av. Sim) of overall pairs of sample plots within a group (j, k), for a species in the Bray–Curtis similarity formula (Equation (1)).
S j k ( i ) = 200 · min ( y i k ) / i = 1 p ( y i j + y i k )
where Sjk(i) represents the similarity between the jth and kth sample, yij represents the entry in the ith row, and j the column of the abundance data matrix, that is the abundance for the ith species in the jth sample (i = 1, 2, …, p, j = 1, 2, …, n).
The more abundant a species within a group, the more it will contribute to intra-group similarity [30].

2.2.2. Ethnobotanical Assessment and Analysis

In this study, a sequentially mixed sampling technique was used to select villages and sample populations [32]. First, four villages from Thatho Vondo Forest Reserve (TVFR) and Mafhela Forest Reserve (MFR) were purposefully chosen, as these villages were located within the perimeter of the Forest reserves. Tshidzive and Tshilungwi in Thathe Vondo Forest Reserve have 312 and 253 households respectively; while Belemu and Tshiema in Mafhela Forest Reserve have 99 and 113 households, respectively (Figure 1).
This was then followed by determining the sample size of respondents (n) required out of the total population (N = 770), using the Jeff (2001) equation as stated below:
n = P ( 1 P ) A 2 z 2 + P ( 1 P ) N R
where n = sample size required, N = number of people in the population, P = estimated variance of population, as a decimal, A = precision desired, as expressed in decimal, Z = based on confidence level, and R = estimated response rate, as a decimal. Consequently, the required sample size (n) was calculated with an estimated variance in population (P) of 30%, an estimated precision of 5%, and a confidence level of 95% (Z = 1.96), with an estimated response rate of 95%. Accordingly, the required sample size was approximately 78 households representing a sampling intensity (n/N) of 10.13%. However, this was increased to 20% when 135 households were interviewed, thereby decreasing the sampling error and increasing the reliability of the sample statistic to estimate the population parameter [33]. The actual households for the interviews were selected using systematic random sampling, constituting every 5th household, from the list of residents provided by local chiefs. Where interviews with household heads were not possible, a person above 21 years, available in the household during the interview, was considered with their consent.

Household Surveys

Both structured and free-listing [34] questionnaires were developed, based on a preliminary analysis of the relevant literature, interviews with the forestry sector officials, and field observations of the livelihood activities of community members in the study area. The information collected included household characteristics (gender, household size, age, marital status, and educational status), and the kind of forest utility for their livelihood all along the land use intensity gradient. The category of utilities was predetermined based on our preliminary analysis. The utilities included fuelwood, construction materials, livestock grazing and browsing, wild food, and traditional medicine. Table 1 shows the household characteristics of the respondents. The questionnaire was then translated into the local language and pretested on six households in Belemu.

Data Analysis

First, four different ethnobotanical importance indices were calculated. For household use value for a specific land use regime, the data were coded as one (1) for those who affirmed use and zero (0) for those who did not use a particular land use regime for a specific utility. This was then followed by calculating the total use value of a specific land use regime by summing the number of utilities a household uses divided by the total number of utilities. The fidelity level of a given land use regime was then calculated by dividing the number of informants who affirmed a specific land use by the total numbers of informants involved in the interviews, in percentiles. The percentage of fidelity reflects the informant consensus on the extent of the importance of a particular item for a specific utility [34]. Finally, the use value of a species for a specific utility was calculated by dividing the number of informants who cited a species for a specific use by the total number of informants [34,35]. The total use value of a particular species was then calculated by summing the use values of a particular species for all utilities [34].

The Homogeneity of Cultural Values

The homogeneity of cultural values between the two communities was analyzed using the Mann–Whitney U test for significant difference, using the Statistical Package for Social Sciences (SPSS) version 20 [36]. We used the household use value as the proxy for cultural values, with the assumption that local communities with the same culture would have the same extent of use of forest and tree species products for the same land use gradient, as defined by cultural institutions and social norms. This will happen despite the difference in forest landscape conditions of their residence. When a significant difference was detected in the Mann–Whitney U test, the effect size (r) was calculated by dividing the standard mean rank (Z) by the square root of population size (r = Z/√N) [37]. The effect size (r) is considered smaller (r = |0.10|), medium (r = |0.30|), larger (r = |0.50|) and very large (r ≥ |0.70|). The result was considered significant at p = 0.05.

The Use Value Gradient in Multifunctional Landscapes

To investigate the consistency of use value along a land use intensity gradient, the analysis was carried out both at cultural group and household levels. Because the Mann–Whitney U test showed a homogeneity of cultural value between the two forest reserves, first, a contingency table of the fidelity value of each land use was developed for the whole study area as one cultural group. This was crucial to determine which forest land use was most popular and for what utility. This was then followed by a Friedman rank test to determine if there was a significant difference in the mean total use value (sum of all utilities) of households among land use regimes. When a significant difference from the Friedman rank test was spotted, the Wilcoxon rank test was used to test the significant difference of mean total use value between different pairs of land use gradient [37]. Secondly, to determine if household characteristics (gender, household size, and marital status) affect the mean total use value in each land use regime, we used a Mann–Whitney U test (for gender and marital status).

The Use Value of Species and the Ecological Appearance Hypothesis

To describe the number of useful species for each utility category, all species (for at least one use) per FR that were cited by participants were enumerated. This was then turned into a percentage out of the total species encountered during our field inventory. The number of species cited for the specific utility was enumerated and turned into a percentage of all useful species cited in each FR. This study only reports the top useful species based on their order of total use value. The mean use value of a species for each utility was calculated using the summary statistics routine in Premier-E (V7) software.
To test for the significant difference of ecological appearance hypothesis, the average abundance of species from the forest inventory results, the species use value for a specific utility, and the species use value for all utilities were subjected to a Spearman correlation test. The Spearman correlation test was chosen as our data did not conform to the normal distribution required for the parametric test. In this analysis, we only correlate those species that were cited during the forest inventory [38]. This was done separately for the two Forest reserves, because the relationship between usefulness and appearance might be specific to the area of influence [39,40].

3. Result

3.1. Ecological Assessment

The study recorded 2125 individual trees and 110 tree species in total in the area. The total number of species encountered in MFR and TVFR was 72 and 88, respectively. The two forest reserves are dissimilar in their species composition (55.5%) and contain distinct local assemblages in terms of species abundance (Av. Dis = 91%). The mean number of trees per plot for MFR and TVFR was 8.62 and 10.52, respectively. The SIMPER analysis output (Table 2) revealed that MFR was dominated by seven tree species, which contributed about 70% of the total abundance of tree species for the whole landscape, out of which Englerophytum maglismontanum, Bridelia micrantha, and Psidium guajava accounted for 50% of the total abundance of trees. In TVFR, the local assemblage was relatively diverse and 12 tree species dominated and contributed about 70% of the total abundance, out of which Syzygium gerrardii, Xymalos monospora, Englerophytum maglismontanum, Aphloia theiformis, Podocarpus falcatus, and Cassine eucleiformis accounted for 50% of the total abundance of trees in the landscape. Table 2 shows the average abundance of the dominant species and their contribution to the similarity of species distribution within each forest reserve.

3.2. The Homogeneity of Cultural Values

Forty-five (45) respondents in MFR and ninety (90) in TVFR were interviewed in the study. All of the respondents extracted at least one forest utility from their landscape to sustain their livelihood. A Mann–Whitney U test between the mean ranks of total use value of forest utilities for a rural livelihood from MFR SIF (66.81) and TVFR SIF (68.81) revealed no significant difference (U = 2098; p = 0.727). Although there was a statistically significant difference between the mean ranks of total use value of MFR CRUZ (55.89) and TVFR CRUZ (74.06) (U = 2570; p = 0.01), the difference in mean ranks for the two land use regimes in total use value was very weak (r = 0.21). There was no significant difference in the mean ranks of the total use value between MFR TATR (70.19) and TVFR TATR (66.91) (U = 1926; p = 0.60). Similarly, there was no significant difference in the mean ranks between MFR CPA (66.78) and TVFR CPA (66.81) (U = 2080; p = 0.737), in total use value.

3.3. Use Value along the Land Use Intensity Gradient

The contingency table for the fidelity values (Table 3) shows that local people relied on forest landscapes for various forest utilities to sustain their rural livelihood. The most popular utilities were wild food, followed by fuelwood, livestock grazing and browsing, wood for construction materials, and traditional medicine, in descending order. As predicted in our hypothesis, the total use value of a land use regime increases with the increase in land use intensity gradient in the human modified part of the landscape, with the exception of SIF. The total use value in the human modified landscape increased for CPA, TATR, and CRUZ, respectively. However, despite the presumed strict protection in SIF, it had almost the same total use value as CRUZ for all utilities followed by TATR and CPA.
A Friedman rank test for total use value among land use regimes confirmed that there was a significant difference among the mean ranks of land use in their total use value (χ2 = 136.84; df = 3; p = 0.001). A Wilcoxon test with Bonferroni correction (Comparison wise alpha = 0.017) showed that all land use regimes differ from each other in their total use values, except CRUZ and SIF (Table 4). In both cases, the low ranks imply that local people attach equally high total use value to both CRUZ (3.09) and SIF (2.97), followed by TATR (2.17) and CPA (1.77). The effect size analysis (Table 4) showed that there was no difference between SIF and CPA, the difference between TATR and CPA was medium, while the differences for the other land use regime pairs were large or larger than expected in behavioral studies.
At household level (Table 5), the Mann–Whitney U test on the effect of gender on forest use harvest showed that there were no significant differences in mean ranks of total use value among all land use regimes (p ≥ 0.05). Marital status also did not affect the total use value of land use regimes (p ≥ 0.05), except for the mean ranks of total use value in SIF. The mean ranks of married women (76) and other groups (62.15) were significantly different (U = 1767; p = 0.05; r = 0.17). The effect of household size on total use value showed a significant difference only in CRUZ and SIF. In CRUZ, the mean rank of small size households (82) was significantly different from the mean rank of large size households (64) (U = 1053, p = 0.04, r = 0.17). In SIF, the mean rank of small size households (49.50) was significantly lower than the mean rank (72.40) (U = 937, p = 0.00, r = −0.23).

3.4. The Use Value of Species and the Ecological Appearance Hypothesis

3.4.1. The Use Value of Tree Species

Overall, local people cited sixty-eight (68) useful species out of the one hundred ten (110) species found during the field inventory. Twenty-eight (28) species and forty-two (42) species were cited in MFR and TVFR, respectively. Table 6 shows that the overall percentage of useful species for MFR was roughly 39% of the total species enumerated in the forest reserve. People in MFR cited the highest number of useful species for fuelwood and grazing, followed by construction materials, traditional medicine, and wild food, in descending order. The overall mean use value of a species was 0.35. In terms of the top ten useful species and their use values, Bridelia micrantha was the most important multipurpose species while Aphlocia theiformis was the least important (Table 7).
In TVFR, the overall percentage of useful species for TVFR was 47.72%. People in TVFR cited more numbers of useful species than people in MFR. People cited the highest number of useful species for fuelwood, followed by traditional medicine, construction materials, livestock grazing, and wild food, in descending order (Table 6). The overall mean use value of a species was 0.39. In terms of the top ten useful species and their use values, Parinari curatellifolia was the most important multipurpose species while Syzygium cordatum was the least (Table 8).

3.4.2. Appearance Hypothesis

In MFR, it has been observed that the abundance of a species had a positive and moderate correlation with the overall use value of a species (rs = 0.44, p = 0.00). Similarly, the abundance of a species showed a positive moderate correlation with the use values of a species for all the five utilities, namely, fuelwood (r = 0.31, p = 0.008), construction material (rs = 0.35, p = 0.002), wild food (rs = 0.46, p = 0.000), livestock (rs = 0.53, p = 0.000) and traditional medicine (rs = 0.33, p = 0.000).
In TVFR, the correlation for the abundance of a species was positive and moderately correlated with the use value of a species (rs = 0.37, p = 0.00). Except for a moderate correlation between the average abundance and the use value of a species for fuelwood (rs = 0.43, p = 0.00) and construction material (rs = 0.44, p = 0.00), there was no correlation between the abundance of species for livestock browsing and grazing, wild food, and traditional medicine (p ≥ 0.05).

4. Discussion

Considering (i) the skepticism surrounding the sustainability and effectiveness of the existing global protected areas to safeguard tropical biodiversity [2] and (ii) doubts about the conservation behavior of traditional society towards their surrounding ecosystem, on which they rely directly or indirectly rely for the maintenance of their lifestyle [8,
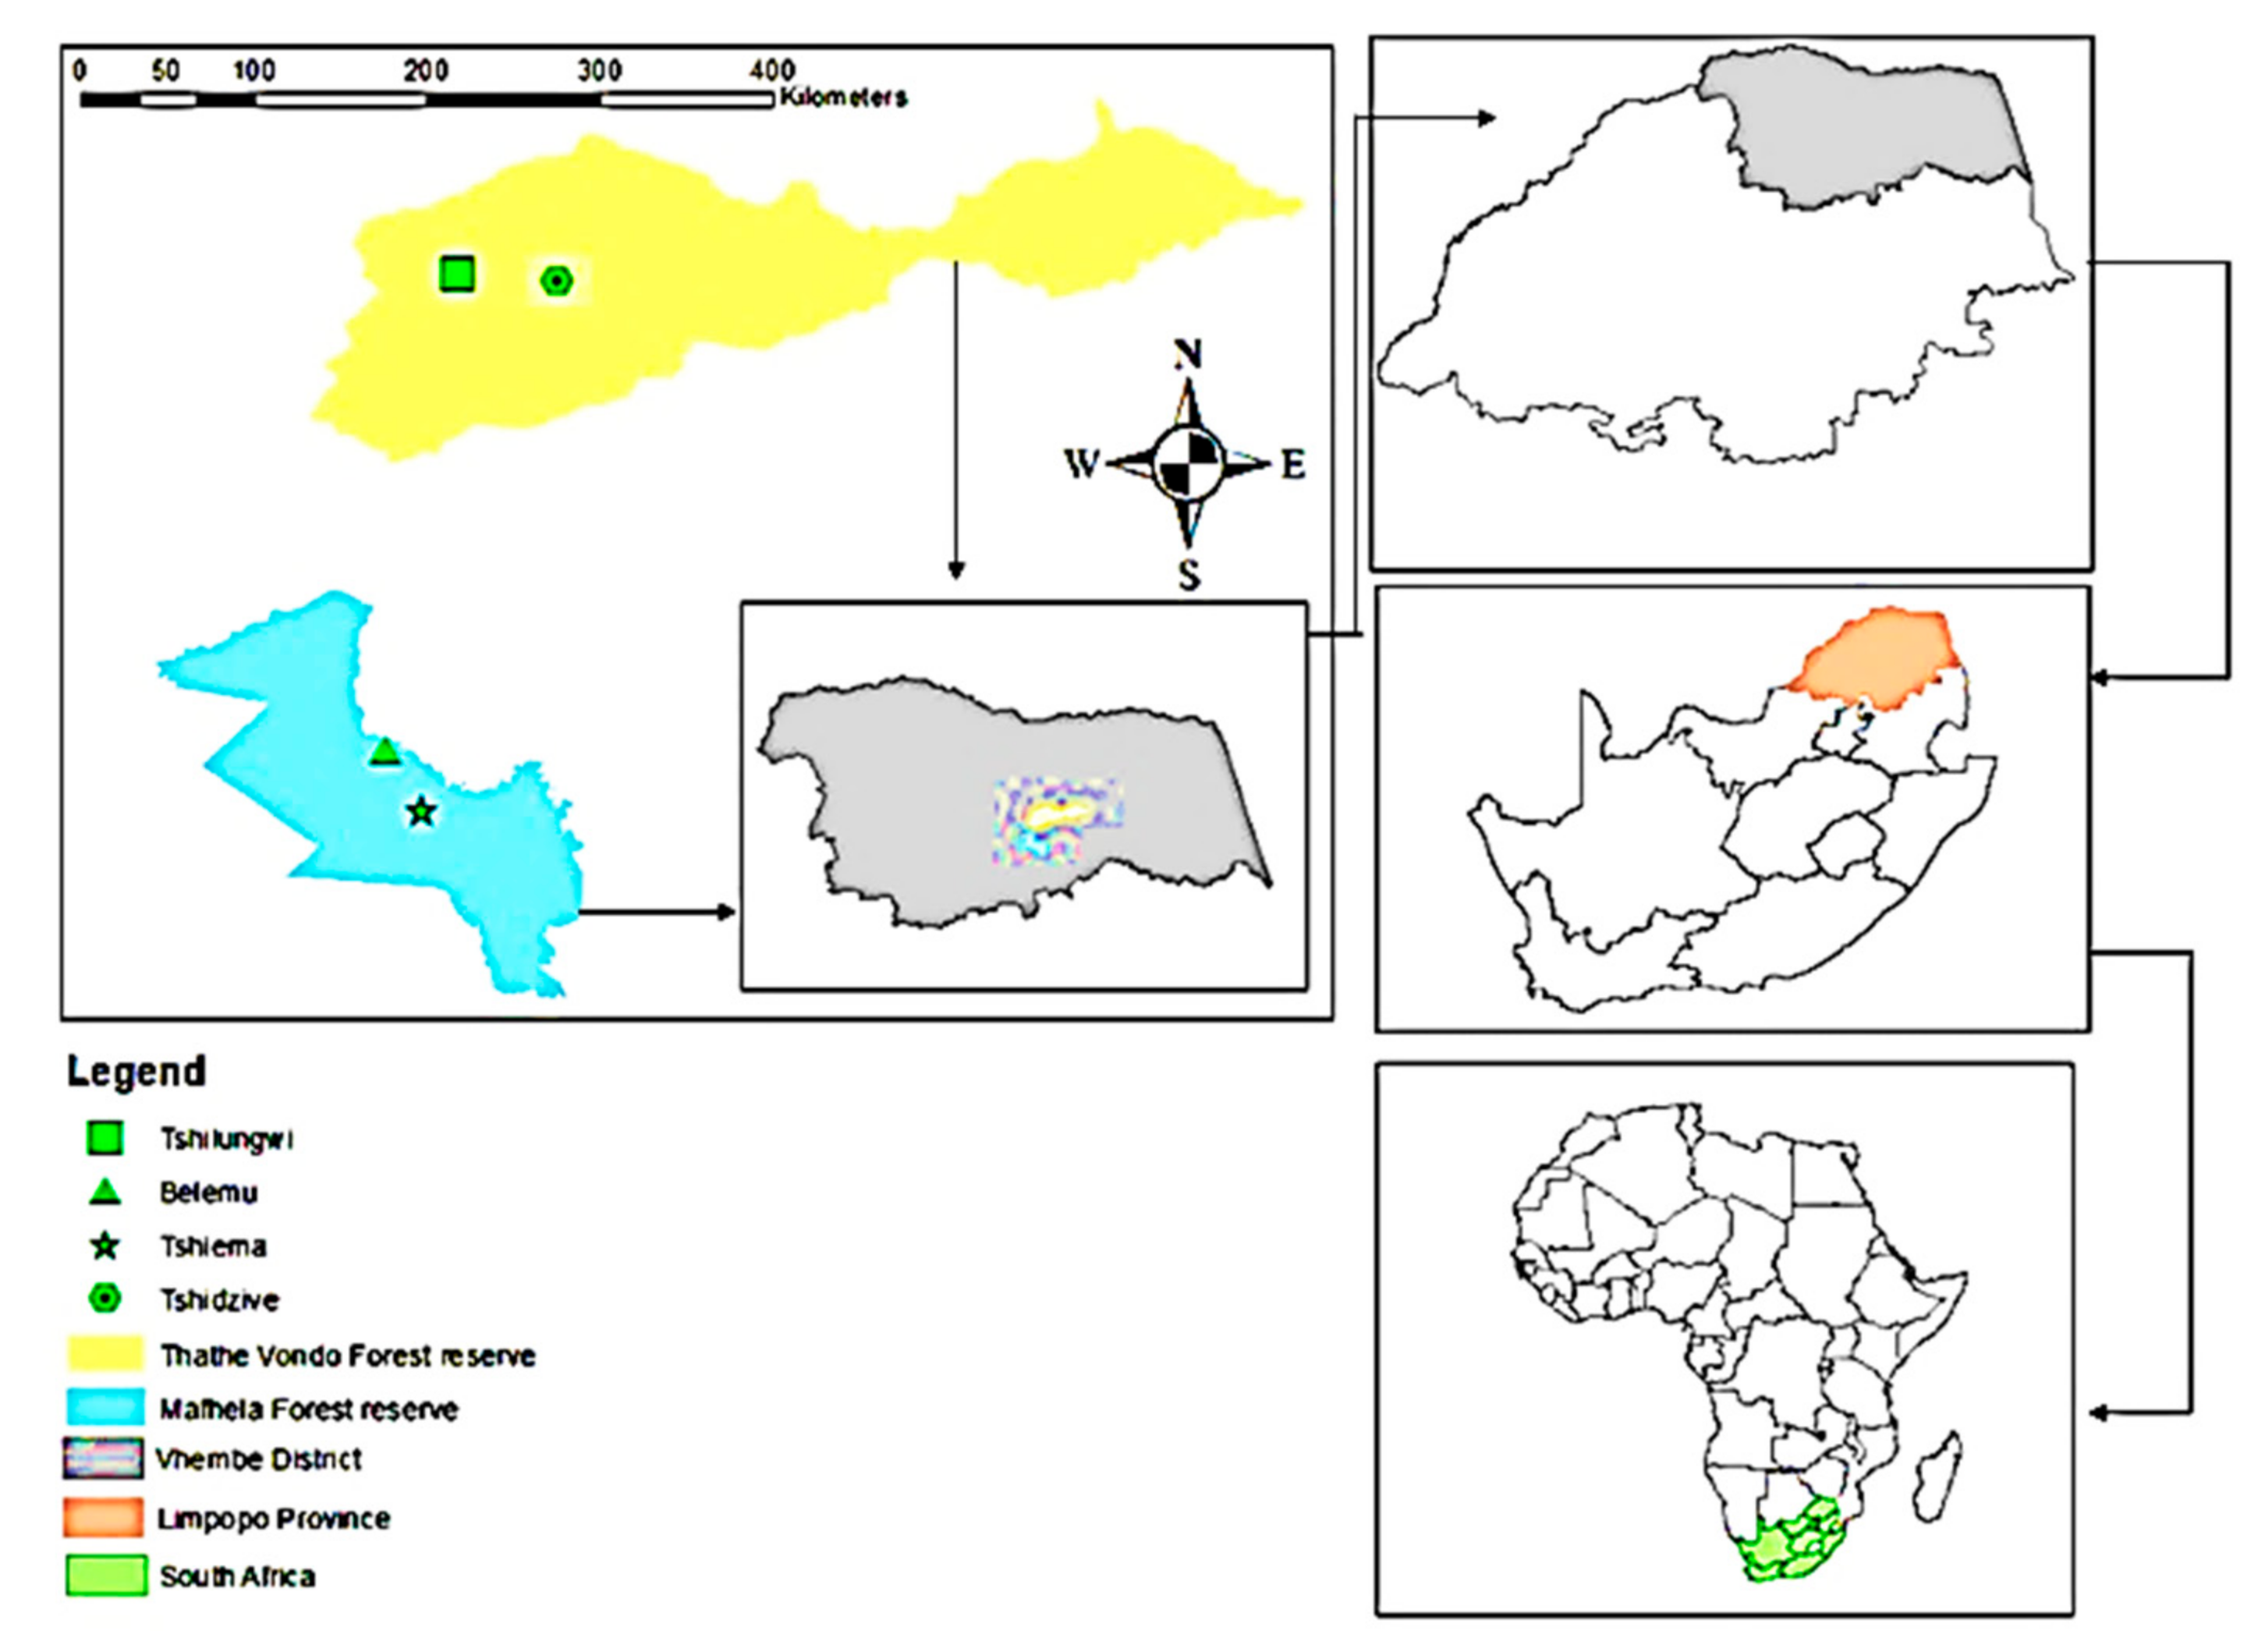
9], empirical evidence on the drivers of natural resource use behavior are crucial. The current uncertainty about the predictive capacity of the ecological appearance hypothesis implies that the ecological resource use behavior of local people is far more complex than an exclusive association with an abundance of ecological resources. In this case study, we examine the predominance of culture in shaping forest and tree use behaviors of traditional society in human-modified forest landscapes, and we discuss their implications for the conservation of biodiversity. Our case study was performed in two Vhavenda communities who share the same culture. However, the two communities reside in forest landscapes that markedly differ in their ecological conditions (species richness, identity, and abundance) (Section 3.1, Table 2).

4.1. Homogeneity of Cultural Values Related to Similar Land Use Regimes in Different Ecological Conditions

The significance of culture is often easier to grasp when the lifestyles of groups are markedly distinct from each other [18]. In hindsight, our findings on the homogeneity of use values related to similar land use regimes/habitats of local people who reside in two distinct forest landscape conditions imply that forest condition does not play a primary role in local people’s forest use behavior. Instead, considering that the two Vhavenda communities share the same culture, it highlights that the shared values and norms (a complex set of knowledge, beliefs, and practices) play a predominant role in the active use and management of their forest landscape, rather than the conditions of forest resources.
Our interpretation may appear to be at odds with the recent global assessment by Aswani et al. [41], who highlighted that the forced displacement or significant reduction of access to cultural resources and institutional reforms are some of the critical drivers of global loss of traditional socio-ecological knowledge. Notwithstanding, the complete loss of traditional socio-ecological knowledge or a substantive shift in culturally shared values can only happen in areas where there has been a significant shift in lifestyle due to large-scale ecological devastation or the complete integration of traditional society into a market economy [42], in an unsustainable manner. In the case of our study, although the two Vhavenda people were forcefully displaced from their landscapes like many of the historically disadvantaged communities in South Africa [43], they still reside within the parameters of their cultural landscapes. The remaining forest and tree resources used by Vhavenda people are still intertwined into their livelihood, and into the cultural, emotional, spiritual and symbolic values of their lifestyle [24,25,28]. This is not to argue that forced displacement or institutional reforms in traditional society do not affect the cultural assets or traditional socio-ecological knowledge. Instead, it is to emphasize the dynamic and adaptive nature of cultural values. Acquiring new knowledge through consistent trial and error to fit the changing social and bio-physical environment has been part of human evolutionary history [44]. Within the range of normal cultural change [18], a shift in cultural value proceeds incrementally and follows a predictable manner. The complete replacement of one set of cultural values in individuals, or in society, by another set of new values does not occur [42].

4.2. Use Value Gradient Is Consistent with a Socially Perceived Land Use Intensity Gradient

Overall, our study found that the forest landscape is locally popular as a source of wild food, fuelwood, livestock grazing and browsing, construction materials, and traditional medicines, in descending order. Consistent with our hypothesis, the use value of a land use regime for those products depends on a culturally defined land use intensity gradient, with the exception of SIF, which is also embedded within the same landscapes. In conformity with traditional rules, local people largely depend on open access common resource use zones for most of the utilities to sustain their livelihood. Few individuals meet their livelihood demands for relatively less destructive resource obtainment (grazing and wild food harvesting) from trees along rivers and streams. Local people extract almost no use from traditional protected areas. In contrast, strictly state-protected indigenous forests appear to provide almost equal use value compared to the open access common resource use zones.
The case of state-protected indigenous forests may imply that the superior protection of state indigenous forests most likely enhanced the ecological abundance of resources important for rural livelihoods. Local people may not extract a large amount of forest products from state indigenous forests due to a fear of retribution in comparison with common resource use zones. However, the total use value compared with the human-modified landscapes of common resource use zones implies that its effectiveness to protect areas of high ecological importance (e.g., the abundance of species, population, or ecosystems) may not be sustained in isolation. This is not surprising considering the challenge of the enforcement of protection rules in most forest reserves in South Africa [45].
The prevalence of the use value gradient alongside the socially perceived land use intensity gradient, in contrast with state-protected indigenous forests, suggests that tree-based traditional land use decisions or forest extractions are culturally bound and non-random. At least in the case of our study, the lower use value of trees along rivers and streams and those in culturally protected areas is a testimony against Low’s [8] assertion that there is a lack of correlation between forest and tree species extraction and attitude (including compliance with sacred protection). Similar to our findings, Mutshinaylo and Siebert [25] claim that in most parts where the Vhavenda people reside, certain species and components of forest ecosystems (e.g., streams and rivers) are still culturally protected due to rituals, mythical beliefs, and totems. Many studies have showed that culturally protected sites create habitats for rare and threatened species [46]. The comparable total use value of state-protected indigenous forest with open access common resource use zones may imply neither a lack of conservation attitude on the part of local people nor the pre-dominance of abundance in governing their use behavior. Instead, it highlights that the imposition of strict protection measures based on the abundance of ecological resources, without considering the cultural values of local people, may not deter local people from breaching conservation rules.
A culturally bound society does not imply that all members of society are homogenous [46] and have similar knowledge and attitudes towards forest and tree species uses. Still, difference in household characteristics can affect their use behavior (e.g., [11,15]). For instance, our study found that, while common resource use zones are accessible for use to all members of society, it was the small size households who depended more on them rather than the large size households, regardless of their gender and marital status. However, it was the reverse when it came to state-protected indigenous forests. The first case may imply that small size households may have a relatively small demand, which can easily be satisfied from the nearest common resource zone. In contrast, the married and larger households may have higher demands and larger manpower to collect forest and tree species products, even from relatively far state-protected indigenous forests. However, none of the household characteristics affect use behavior related to trees along rivers and streams and in culturally protected areas. The fact that the effect of household characteristics only manifested in common resource use zones and state-protected indigenous forests highlights that even these factors generate difference within the bounds of cultural influence. Common resource use zones are culturally considered as open access for every individual member of society, while harvesting forest products from state-protected areas is a new norm, not an exception.

4.3. The Use Value of Species and Ecological Appearance Hypothesis

Although the residents of the two forest reserves share the same culture, the overall number of useful species and their percentage out of total species richness per landscape was higher in TVFR than in MFR. This could imply that the difference in resource availability between the two forests (e.g., [39,40]) may have provided a different extent of knowledge base on potential uses of species, through lived experience.
Nonetheless, the mean total use value of a species and the mean use value for a specific utility remained similar in both areas (Table 4). The most likely explanation could be that, despite the overall difference in species richness and abundance, the actual user preference for a species is not exclusively determined by the abundance of the species. For instance, the Vhavenda communities in MFR and TVFR still share five highly preferred species out of the top ten most useful tree species found in the study area (Table 5 and Table 6). These are Parinari curatellifolia, Englerophytum magalismontanum, Syzygium cordatum, Combretum molle, and Mimutops obovata. This implies that through traditional knowledge, there is convergence on the species preference of local people for actual use, through the different social processes. These processes include knowledge sharing through oral tradition, clan gathering, initiation schools, and apprenticeship by traditional healers [47]. Over time, this kind of knowledge intertwines into people’s cultural and symbolic identities (cultural keystone species) [15]. Hence, the keystone species do persist as preferred species, regardless of their abundance. For instance, despite Parinari curatellifolia and Englerophytum magalismontanum having lower abundance in TVFR than in MFR (Table 2), the two species are still cited as among the most important. The same popularity was also observed for Combretum molle and Mimutops obovate—which are rare species in both forest reserves (Table 4 and Table 5). However, this does not imply that people solely rely on keystone species for their survival. Local people still use other potentially useful species depending on the local ecological conditions (e.g., seasonal availability) [39]. Equally, even if some species are abundantly available for potential use, actual use can still be constrained by species-specific taboos [41]. Hence, the similarity of results in terms of the correlation between species abundance and a species’ use value among the two Forest reserves is not surprising.
There was a very weak to moderate correlation (rs = 0.30–0.50) between the local abundance of a species and the use value, both for the overall and specific utility of a species, both in MFR and TVFR. The only exception was that there was no correlation between the abundance of a species with its use value for grazing and browsing, wild food, and medicine in TVFR. Similar to our findings, many studies, for example Gonçalves et al. [10], have reported on the inconsistent power of ecological abundance to explain human use behavior in relation to overall forest utilities or specific utilities. In some recent studies, for instance Soares et al. [11], it has been shown that ecological abundance does not explain use behavior at all.

5. Conclusions

The response to the question of whether local people consciously manage forests and tree species diversity in their landscape relies on our understanding of how culture and ecological abundance influence resource use behavior. Based on our findings, at least in the case of the Vhavenda people, culture plays a predominant role in explaining use behavior. Abundance may play a secondary role, subject to cultural context. Our findings have serious implications for the design of conservation interventions that work both for people and for biodiversity.
Unlike the exclusionary protected area approach to preserve a particular biodiversity hotspot, traditional society manages the sustainability of local biodiversity as a socio-ecological system, on which their livelihood and their cultural, emotional, spiritual and symbolic lifestyle values depend. In a forest landscape, neither land use nor resource use decisions are random decisions, nor is the concept of protected areas new to traditional society. Traditional society applies dynamic and adaptive socio-ecological knowledge systems (beliefs, knowledge, and practices) relating to a particular habitat or species as an integral part of managing the delicate balance of “use–protection” regimes, at a landscape level. The protection of sacred forests and habitats and species-related taboos are typical examples of how traditional society still consciously manages landscape multifunctional purposes. Hence, the adherence to social norms and taboos, combined with the resilience of traditional socio-ecological knowledge in human-modified landscapes, presents potential tools to complement the state and conservation agency-led protected areas. Global biodiversity conservation efforts can capitalize on the benefits of the cultural assets of local people through genuine partnership and empowerment, which can play a significant role in averting a biodiversity crisis.

Author Contributions

M.G.A. designed the research, collected data and analyzed under the supervision of P.W.C. The 1st draft manuscript was written by M.G.A. and P.W.C. made a significant contribution in the revisions.

Funding

This research was funded by the Forest Programme at the University of Pretoria in South Africa through the South African Forest Company limited (SAFCOL) Forest Chair.

Acknowledgments

We sincerely appreciate the Forest Programme at the University of Pretoria in South Africa through SAFCOL Forest Chair for sponsoring this study. We also appreciate the local leaders and local communities who partook in this study for valuable contribution and hospitality. Nonetheless, the opinions expressed and the conclusions argued in this report are solely of the authors.

Conflicts of Interest

The authors declare no conflict of interest.

References

  1. Doak, D.F.; Bakker, V.J.; Goldstein, B.E.; Hale, B. What is the future of conservation? In Protecting the Wild; Wuerthner, G., Crist, E., Butler, T., Eds.; Island Press: Washington, DC, USA, 2015; pp. 27–35. [Google Scholar]
  2. Oldekop, J.A.; Holmes, G.; Harris, W.E.; Evans, K.L. A global assessment of the social and conservation outcomes of protected areas. Conserv. Biol. 2016, 30, 133–141. [Google Scholar] [CrossRef] [PubMed]
  3. Cumming, G.S.; Allen, C.R. Protected areas as social-ecological systems: Perspectives from resilience and social-ecological systems theory. Ecol. Appl. 2017, 27, 1709–1717. [Google Scholar] [CrossRef] [PubMed]
  4. De Pourcq, K.; Thomas, E.; Arts, B.; Vranckx, A.; Léon-Sicard, T.; Van Damme, P. Conflict in protected areas: Who says co-management does not work? PLoS ONE 2015, 10, e0144943. [Google Scholar] [CrossRef] [PubMed]
  5. Berkes, F.; Folke, C. Linking Social and Ecological Systems: Management Practices and Social Mechanisms for Building Resilience; Cambridge University Press: Cambridge, UK, 1998; ISBN 0521785626. [Google Scholar]
  6. Gómez-Baggethun, E.; Corbera, E.; Reyes-García, V. Traditional ecological knowledge and global environmental change: Research findings and policy implications. Ecol. Soc. 2013, 184, 72. [Google Scholar] [CrossRef] [PubMed]
  7. Ruiz-Mallén, I.; Corbera, E. Community-based conservation and traditional ecological knowledge: Implications for social-ecological resilience. Ecol. Soc. 2013, 18, 12. [Google Scholar] [CrossRef]
  8. Low, B.S. Behavioral ecology of conservation in traditional societies. Hum. Nat. 1996, 7, 353–379. [Google Scholar] [CrossRef] [PubMed] [Green Version]
  9. Low, B.S. The behavioral ecology of resource consumption: Why being green is so hard. Hum. Ethol. Bull. 2014, 29, 3–26. [Google Scholar]
  10. Gonçalves, P.H.; Albuquerque, U.P.; Medeiros, P.M. The most commonly available woody plant species are the most useful for human populations: A meta-analysis. Ecol. Appl. 2016, 26, 2238–2253. [Google Scholar] [CrossRef]
  11. Soares, D.T.; Sfair, J.C.; Reyes-García, V.; Baldauf, C. Plant knowledge and current uses of woody flora in three cultural groups of the Brazilian semiarid region: Does culture matter? Econ. Bot. 2017, 71, 314–329. [Google Scholar] [CrossRef]
  12. Feeny, P. Plant apparency and chemical defense. In Biochemical Interaction between Plants and Insects; Wallace, J.W., Mansell, R.L., Eds.; Springer: Boston, MA, USA, 1976; pp. 1–40. [Google Scholar]
  13. Rhoades, D.F.; Cates, R.G. Toward a general theory of plant antiherbivore chemistry. In Biochemical Interactions between Plants and Insects. Recent Advances in Phytochemistry; Wallace, J.W., Nansel, R.L., Eds.; Plenum Press: New York, NY, USA, 1976; pp. 169–213. [Google Scholar]
  14. De Albuquerque, U.P.; Farias, P.; de Lucena, R. Can apparency affect the use of plants by local people in tropical forests? Interciencia 2005, 30, 506–510. [Google Scholar]
  15. Gaoue, O.G.; Coe, M.A.; Bond, M.; Hart, G.; Seyler, B.C.; McMillen, H. Theories and major hypotheses in ethnobotany. Econ. Bot. 2017, 71, 269–287. [Google Scholar] [CrossRef]
  16. Pásková, M.; Dowling, R.K. The usage of local and indigenous knowledge in the management of geotourism destinations. In Proceedings of the SGEM Conference, Albena, Bulgaria, 17–26 June 2014. [Google Scholar]
  17. Bürgi, M.; Li, L.; Kizos, T. Exploring links between culture and biodiversity: Studying land use intensity from the plot to the landscape level. Biodivers. Conserv. 2015, 24, 3285–3303. [Google Scholar] [CrossRef]
  18. Head, L.; Trigger, D.; Mulcock, J. Culture as concept and influence in environmental research and management. Conserv. Soc. 2005, 3, 251–264. [Google Scholar]
  19. Pickett, S.T.; Cadenasso, M.L. Landscape ecology: Spatial heterogeneity in ecological systems. Science 1995, 269, 331–334. [Google Scholar] [CrossRef] [PubMed]
  20. Kremen, C.; Merenlender, A.M. Landscapes that work for biodiversity and people. Science 2018, 362, eaau6020. [Google Scholar] [CrossRef] [PubMed] [Green Version]
  21. Phillips, O.; Gentry, A.H. The useful plants of Tambopata, Peru: I. Statistical hypotheses tests with a new quantitative technique. Econ. Bot. 1993, 47, 15–32. [Google Scholar] [CrossRef]
  22. Symes, C.T.; Olaf, W.J.; Downs, C.T.; Louette, M. Species richness and seasonality of forest avifauna in three South African afromontane forests. Ostrich 2002, 73, 106–113. [Google Scholar] [CrossRef]
  23. Hahn, N. Floristic Diversity of the Soutpansberg Limpopo Province. Ph.D. Thesis, University of Pretoria, Pretoria, South Africa, 2006. [Google Scholar]
  24. Khorommbi, K.C. The Role of Venda Culture in Conservation: A Case Study of the Inhabitants of the Tshivhase Area. Master’s Thesis, Nelson Mandela Metropolitan University, Port Elizabeth, South Africa, 2002. [Google Scholar]
  25. Siebert, S.J.; Mutshinyalo, T.T. Myth as a biodiversity conservation strategy for the Vhavenda, South Africa. Indilinga Afr. J. Indig. Knowl. Syst. 2010, 9, 151–171. [Google Scholar]
  26. Von Maltitz, G.P.; Shackleton, S.E. Use and management of forests and woodlands in South Africa: Stakeholders, institutions and processes from past to present. In Indigenous Forests and Woodlands in South Africa: Policy, People and Practice; University of KwaZulu-Natal Press: Pietermaritzburg, South Africa, 2004; pp. 109–135. [Google Scholar]
  27. Kabanda, T.A.; Munyati, C. Anthropogenic-induced climate change and the resulting tendency towards land conflict: The case of the Soutpansberg region, South Africa. Climate change and Natural Resources Conflicts in Africa. Monograph 2010, 170, 139–155. [Google Scholar]
  28. Magwede, K.; Van Wyk, B.E.; Van Wyk, A.E. An inventory of Vhavenḓa useful plants. S. Afr. J. Bot. 2018, 122. [Google Scholar] [CrossRef]
  29. Sheil, D.; Puri, R.; Wan, M.; Basuki, I.; van Heist, M.; Liswanti, N.; Rachmatika, I.; Samsoedin, I. Recognizing local people’s priorities for tropical forest biodiversity. AMBIO J. Hum. Environ. 2006, 35, 17–24. [Google Scholar] [CrossRef] [PubMed]
  30. Clarke, K.R.; Gorley, R.N.; Somerfield, P.J.; Warwick, R.M. Change in Marine Communities: An Approach to Statistical Analysis and Interpretation, 3rd ed.; Primer-E Ltd.: Plymouth, UK, 2014. [Google Scholar]
  31. Foggo, A.; Attrill, M.J.; Frost, M.T.; Rowden, A.A. Estimating marine species richness: An evaluation of six extrapolative techniques. Mar. Ecol. Prog. Ser. 2003, 248, 15–26. [Google Scholar] [CrossRef]
  32. Onwuegbuzie, A.J.; Collins, K.M. A typology of mixed methods sampling designs in social science research. Qual. Rep. 2007, 12, 281–316. [Google Scholar]
  33. Bhattacherjee, A. Social Science Research Principles, Methods and Practices, 2nd ed.; Textbooks Collection 3; University of Southern Florida: Tampa, FL, USA, 2012. [Google Scholar]
  34. Silva, T.C.; Cruz, M.P.; Araújo, T.A.S.; Schwarz, M.L. Methods in research of environmental perception. In Methods and Techniques in Ethnobiology and Ethnoecology; Cunha, L.V.F.C., Lucena, R.F.P., Alves, R.R.N., Albuquerque, U.P., Eds.; Springer: New York, NY, USA, 2014; pp. 99–110. [Google Scholar]
  35. Rossato, S.C.; De LeitãO-Filho, H.F.; Begossi, A. Ethnobotany of caiçaras of the Atlantic Forest coast (Brazil). Econ. Bot. 1999, 53, 387–395. [Google Scholar] [CrossRef]
  36. Spss II. IBM SPSS Statistics for Windows, Version 20.0; IBM Corp: New York, NY, USA, 2011. [Google Scholar]
  37. Barrett, K.C.; Morgan, G.A.; Leech, N.L.; Gloeckner, G.W. IBM SPSS for Introductory Statistics: Use and Interpretation, 5th ed.; Routledge: Abington, UK, 2013. [Google Scholar]
  38. Ribeiro, J.P.D.O.; Carvalho, T.K.N.; Ribeiro, J.E.D.S.; Sousa, R.F.D.; Lima, J.R.D.F.; Oliveira, R.S.D.; Alves, C.A.B.; Jardim, J.G.; Lucena, R.F.P.D. Can ecological apparency explain the use of plant species in the semi-arid depression of Northeastern Brazil? Acta Bot. Bras. 2014, 28, 476–483. [Google Scholar] [CrossRef] [Green Version]
  39. Macía, M.J. Woody plants diversity, floristic composition and land use history in the Amazonian rain forests of Madidi National Park, Bolivia. Biodivers. Conserv. 2008, 17, 2671–2690. [Google Scholar] [CrossRef]
  40. Guèze, M.; Luz, A.C.; Paneque-Gálvez, J.; Macía, M.J.; Orta-Martínez, M.; Pino, J.; Reyes-García, V. Are ecologically important tree species the most useful? A case study from indigenous people in the Bolivian Amazon. Econ. Bot. 2014, 68, 1–5. [Google Scholar]
  41. Aswani, S.; Lemahieu, A.; Sauer, W.H. Global trends of local ecological knowledge and future implications. PLoS ONE 2018, 13, e0195440. [Google Scholar] [CrossRef] [PubMed]
  42. Manfredo, M.J.; Bruskotter, J.T.; Teel, T.L.; Fulton, D.; Schwartz, S.H.; Arlinghaus, R.; Oishi, S.; Uskul, A.K.; Redford, K.; Kitayama, S.; et al. Why social values cannot be changed for the sake of conservation. Conserv. Biol. 2017, 31, 772–780. [Google Scholar] [CrossRef] [PubMed]
  43. Tshidzumba, R.P.; Chirwa, P.W.; Babalola, F.D. Are communities benefiting from land reform models? Investigating forest-based public-private partnerships in selected beneficiary communities in South Africa. Int. For. Rev. 2018, 20, 220–235. [Google Scholar] [CrossRef]
  44. Reyes-García, V.; Fernández-Llamazares, Á.; Guèze, M.; Garcés, A.; Mallo, M.; Vila-Gómez, M.; Vilaseca, M. Local indicators of climate change: The potential contribution of local knowledge to climate research. Wiley Interdiscip. Rev. Clim. Chang. 2016, 7, 109–124. [Google Scholar] [CrossRef] [PubMed]
  45. Shackleton, C. Will the real custodian of natural resource management please stand up. S. Afr. J. Sci. 2009, 105, 91–93. [Google Scholar] [CrossRef]
  46. Schneider, H. What role for culture in conservation? Oryx 2018, 52, 199–200. [Google Scholar] [CrossRef] [Green Version]
  47. Constant, N.L.; Tshisikhawe, M.P. Hierarchies of knowledge: Ethnobotanical knowledge, practices and beliefs of the Vhavenda in South Africa for biodiversity conservation. J. Ethnobiol. Ethnomed. 2018, 14, 56. [Google Scholar] [CrossRef] [PubMed]
Figure 1. Location of the study area in the Vhembe Biosphere Reserve in Limpopo Province.
Sustainability 11 03143 g001
Table 1. Household characteristics of participants in the study areas.
HouseholdCategoryNo%HouseholdCategoryNo%
GenderFemale8260.70Marital statusMarried5742.23
Male5339.30Single and other *7857.77
Household sizeSmall (1–3)2619.30AgeYoung adult (21–40)2518.52
Large (≥4)10980.70Middle aged (40–60)2720.00
Old (≥60)8361.48
EducationNo education2820.70
Primary school4734.80
≥Secondary school6044.4
Single and other * includes household respondents who are not married, divorced or widowed.
Table 2. Average abundance (Av. Abu) of tree species and their contribution (% Con) to the similarity of species distribution in forest reserves.
Scientific NameMafhela Forest Reserve (MFR)Scientific NameThathe Vondo Forest Reserve (TVFR)
Av. AbuSim/SD% ConAv. AbuSim/SD% Cont
Englerophytum maglismontanum3.060.6739.13Syzygium gerrardii1.150.3810.31
Parinari curatellifolia1.440.253.83Cassine euceiformis1.020.425.37
Psidium guajava1.090.275.99Aphloia theiformis1.000.417.72
Bridelia micrantha1.000.366.4Xymalos monospora0.970.529.99
Annona senegalensis0.930.284.13Englerophytum maglismontanum0.850.486.91
Aphloia theiformis0.670.365.24Eugenia natalitia0.830.343.92
Ficus capensis0.650.283.87Parinari curatellifolia0.810.244.83
Podocarpus falcatus0.750.36.11
Schefflera umbelifera0.750.354.26
Olea capensis0.680.334.4
Mimusops obovata0.660.366.45
Av. Abu = average abundance, Sim/SD = Similarity/SD, and % Con = Percent contribution of a species.
Table 3. The fidelity values of land use regimes and forest reserves.
Utility CategoryFidelity Value of Land Use RegimesLS FVtot for Specific Utility
SIFCRUZTATRCPA
Fuelwood60.0051.8514.814.44131.1
Construction material34.8136.305.933.7080.74
Grazing and browsing50.3743.7028.150122.22
Wild food53.3350.3723.7020.74148.14
Traditional medicine33.3330.375.192.2271.11
LU FVtot for all utilities231.85212.5977.7831.11553.31
SIF = State-protected indigenous forests; CRUZ = Common resource use zone, TATR = Trees along rivers and streams, and CPA = Culturally protected forests, LS FVtot = Landscape total fidelity value, and LU FVtot = Total fidelity value of a land use.
Table 4. Wilcoxon rank test results among pairs of land use regimes for their total use value.
Pairs of Land Use RegimesMean RanksP (Probability Value)Effect Size (r)
(CRUZ, SIF)(3.09, 2.97)0.2780.09
(CRUZ, TATR)(3.09, 2.17)0.000.62
(CRUZ, CPA)(3.09, 1.77)0.000.71
(SIF, TATR)(2.97, 2.17)0.000.57
(SIF, CPA)(2.97, 1.77)0.000.68
(TATR, CPA)(2.17, 1.77)0.000.42
Table 5. The effect of household characteristics on the total use value among land use regimes.
Land UseGenderMarital StatusHousehold Size
Mean RanksUpMean RanksUpMean RanksUp
MaleFemaleMarriedNotSmallLarge
CRUZ69.3667.1221010.7464.7770.3620390.40826410530.04
SIF71.4165.819930.4076.0062.1517670.0449.5672.409370.00
TATR73.9364.1618580.1068.4267.6921990.9062.1369.4012640.34
CPA73.9064.1918600.0669.4766.9221390.6260.9269.6912330.18
CRUZ = Common resource use zone, SIF = State-protected indigenous forests, TATR = Trees along rivers and streams, CPA = Culturally protected areas, U = Mann–Whitney U test statistic, and p = Probability.
Table 6. Number and percentage of useful species per each utility group.
Utility CategoryMafhela Forest ReserveThathe Vondo Forest Reserve
S% SӮRangeS% SӮRange
Fuelwood20710.120–0.593173.800.180–1.00
Construction1760.710.040–0.242047.620.040–0.35
Grazing and browsing20710.040–0.361945.240.090–0.95
Wild food1553.570.090–0.631842.850.050–0.62
Traditional medicine1760.710.050–0.282969.040.030–0.31
Total2839%0.350.02–1.594247%0.390–1.65
S = number of useful species, % S = Percentage of species for a specific utility, Ӯ = Mean use value.
Table 7. The top ten most important species in Mafhela Forest reserve and their use values.
Scientific NameFWCONG&BWFTMTotal
Bridelia micrantha0.530.240.360.350.111.59
Parinari curatellifolia0.590.000.160.180.281.21
Englerophytum magalismontanum0.170.0250.040.630.000.87
Celtis Africana0.350.230.040.0650.0250.71
Brachylaena rotundata0.380.1850.080.000.020.665
Syzygium cordatum0.110.0650.040.270.0850.57
Nuxia floribunda0.270.1150.020.040.050.5
Combretum molle0.260.020.0200.1650.465
Mimutops obovata0.000.000.020.3250.040.385
Aphlocia theiformis0.230.090.040.000.0250.385
Table 8. The top ten most important species in Thathe Vondo Forest reserve and their use values.
Scientific NameFWCONG&BWFTMTotal
Parinari curatellifolia1.000.090.260.210.091.65
Englerophytum magalismontanum0.460.000.050.950.011.48
Enterspermum rhodensiacum0.860.350.030.000.031.27
Oleao capensis0.890.270.000.000.041.20
Syzygium gerradi0.560.030.020.570.011.19
Combretum molle0.560.070.060.000.311.00
Oleo Africana0.680.170.010.120.000.98
Albizia adainthifola0.320.020.620.010.000.98
Mimutops obovata0.230.050.000.670.010.97
Syzygium cordatum0.430.060.010.180.010.70
FW = Fuelwood, CON = Construction material, G&B = Grazing and browsing, WF = Wild food and TM = Traditional medicine.

