Mapping the ESG Behavior of European Companies. A Holistic Kohonen Approach

 ,
,
Abstract
:1. Introduction
2. Literature Review
2.1. Connecting Sustainability–CSR–ESG. ESG Reporting
2.2. Unravelling ESG Behavior
2.3. ESG Clusterization
3. Research Data and Methodology
- The three ESG pillar scores (Environmental—ENV_S, Social—SOC_S and Corporate Governance—GOV_S)—for mapping the total ESG performance in European companies, as a general composite picture of its three main dimensions;
- Eight out of ten ESG categories scores (Resource Use, Emissions, Environmental Innovation, Workforce, Human Rights, Community, Product Responsibility and CSR Strategy)—for representing a theme-based European ESG behavior;
- A set of scores reflecting various ESG approaches that we computed based on the ten Thomson Reuters ESG themes (as explained in Table 3)—for drawing a panoply of innovative views on the ESG conduct at European level.
- ESG Stakeholder View—Identifying the main groups of beneficiaries targeted by the responsible actions of the companies for finding the favorite corporate orientation in terms of stakeholders;
- ESG Perspective View—Recognizing the preference for internal or external ESG-related actions as a strategic valuation of the measures considered to render the highest positive corporate results;
- ESG Management Level View—Categorizing the sustainable efforts of the companies giving the hierarchical levels involved for seizing the corporate preference for specific actions when managerial structuring is considered; and
- ESG Focus View—Highlighting the ESG-related priorities of the companies from a functional point of view, by identifying the corporate prevalence for applying ESG in technological processes based on innovation, in human relationships developed with various interest groups or in communication processes based on image creation.
4. Results and Discussion
- The total ESG performance clustering result—0.321;
- The thematic ESG performance grouping solution—0.227;
- The four topologies of the various approaches on the ESG performance: Stakeholder View—0.264; Perspective View—0.403; Management Level View—0.329; and Focus View—0.293.
- A three-cluster solution revealing statistically significant dissimilar sustainability performances for the European ESG reporting companies. This result reflects that the firms in our sample pertain to one of the following typologies in terms of the average (mean and median) sustainable behavior: Lower ESG performance, Middle ESG performance or Higher ESG performance. This finding reflects the cohesion of corporate sustainability patterns at European level and the tendency of the investigated companies to influence each other when it comes to the ESG integration. Assuming that ESG reporting is a proxy for sustainability involvement, all the investigated companies are eventually good performers in terms of ESG behaviors when compared with the majority of non-reporting business organizations within the economic sectors; however, the clustering solution is based on the relative ESG performances that each group records against the others.
- A statistically significant upward trend in the medians of the inputs for each model from the lowest to the highest grouping result in terms of disclosed sustainability accomplishments. Specifically, the JT for ordered alternatives test ascertains these findings and the pairwise comparison analysis confirms the results at the level of each pair of clusters.
- A statistically significant upward trend in the medians for the ESG and ESG Combined scores among the three formed clusters, discovered through the JT for ordered alternatives test. The ESG and ESG Combined scores reflect the corporate sustainable performance and, respectively, the controversies discounted ESG performance.
- A statistically significant descending trend in the medians of the ordinal ESG controversies related variable (from no exposure to higher exposure to ESG risks) with respect to the upward evolution of the ESG behavior, excluding the pairwise comparison of the Lower and Middle clusters within the ESG Focus View analysis. These patterns are also confirmed with the JT for the ordered alternatives test. Overall, this result is quite intriguing, suggesting a probably inverse relationship between the ESG performance and the controversies related performance. This finding should be interpreted with due caution from at least two standpoints, where the high ESG performance is both an effect and a cause of the high ESG related controversies. On the one hand, an increased emphasis of certain business organizations on their ESG performance and reporting outcomes may occur as a measure to counteract the higher ESG controversies recently related to them on the market. On the other hand, the same result could be perceived as an augmented societal scrutiny and intransigence with regards to the leading ESG reporting companies, because the stakeholders’ claims are higher concerning the entities with proven sustainability potential.
- A statistically significant differentiation among the formed clusters from the viewpoint of the Shareholders ESG category, except for the thematic ESG analysis, reflected by the overall effect of the omnibus non-parametric tests. However, the pairwise comparison analysis displays no statistically meaningful dissimilarities among one pair of clusters: between the Middle and the Higher ESG clusters for the ESG total analysis and three of the ESG Approaches (Stakeholder View, Perspective View and Focus View) and among the Lower and the Middle ESG clusters (for Management Level View). Thus, we conclude that in terms of the achieved shareholders’ performance related to ESG, the companies from the analyzed sample are rather similar.
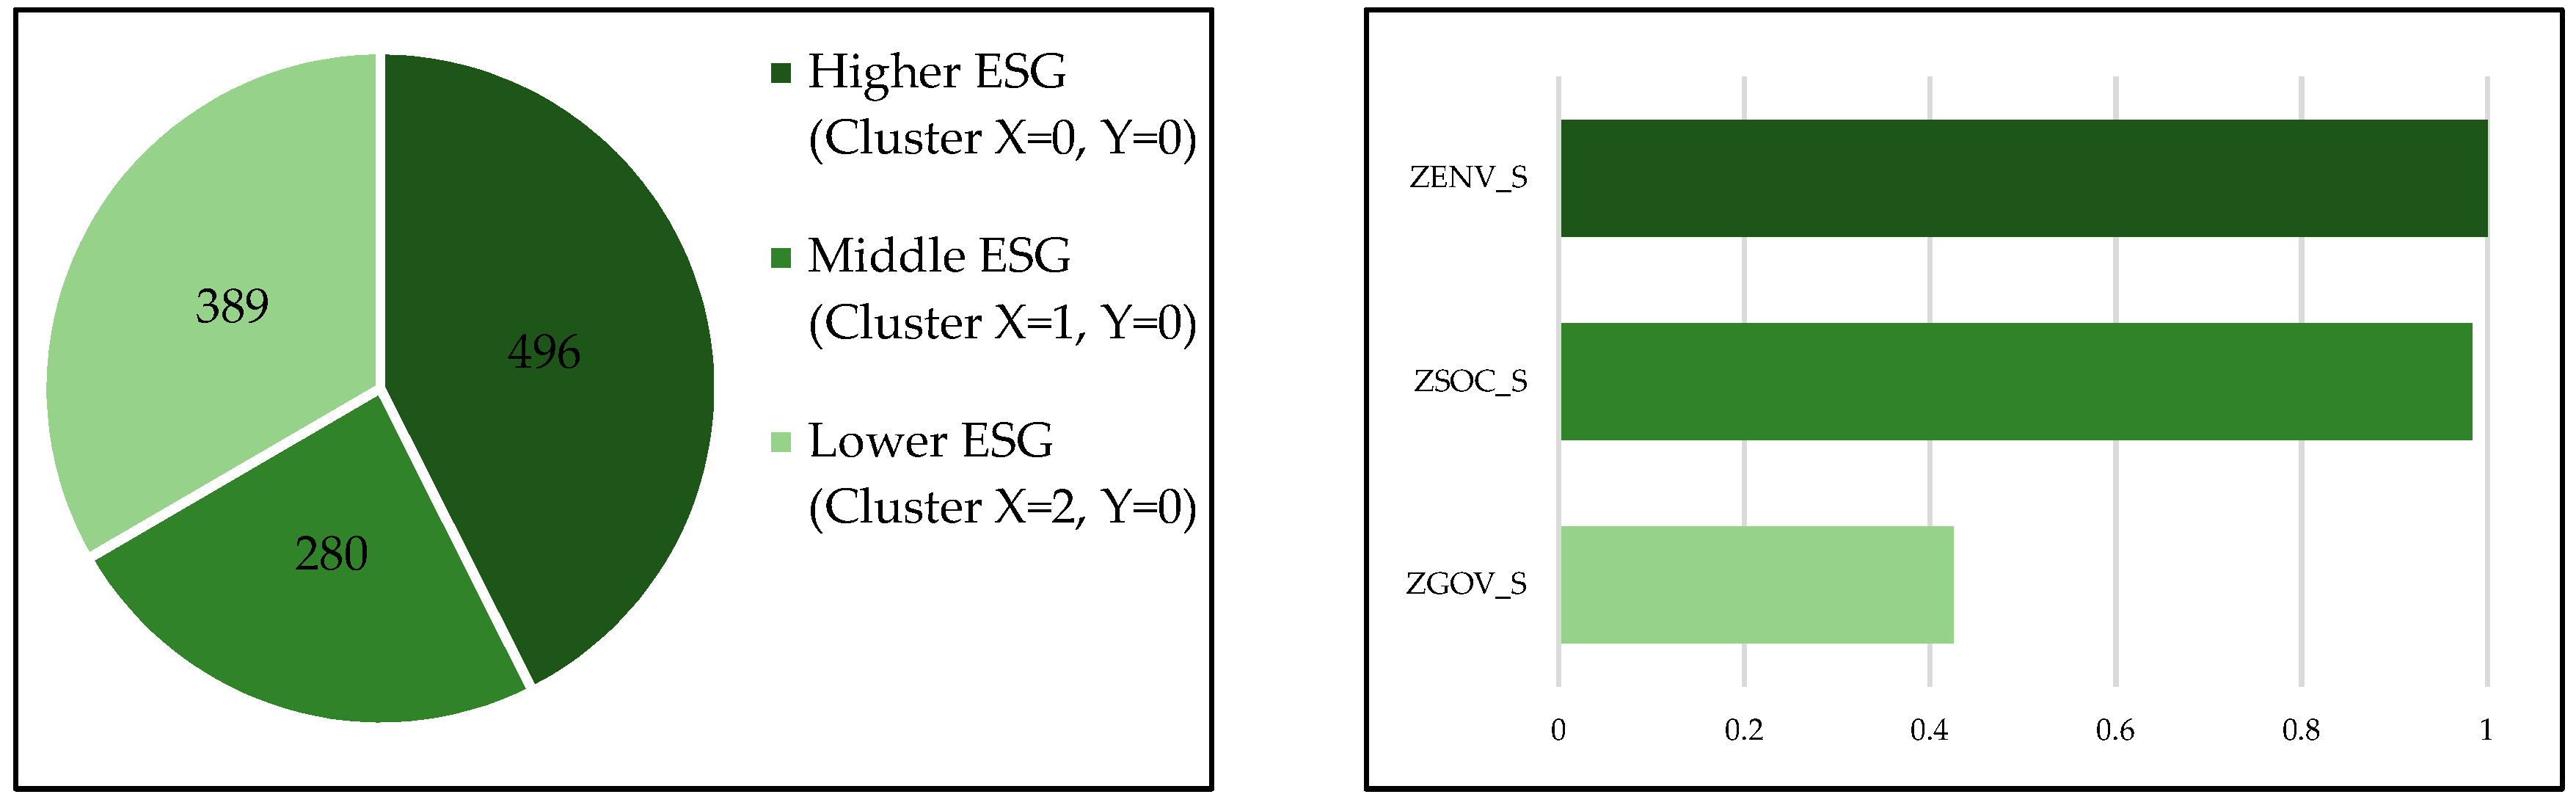
4.1. Mapping the Total ESG Performance for the European Companies
- The lower ESG companies achieve environmental, social and governance performances below the 25th percentile of the sample, except for the ESG Combined Scores. All the medians are below the 2nd quartile.
- The middle ESG companies perform lower on all three dimensions (below the median) than the entire sample, while the values of the ESG Combined Scores exhibit a different behavior. All the medians of the middle cluster are above the 1st quartile and below the 3rd quartile.
- The higher ESG European businesses exhibit higher values than the 75th percentile of the sample on the environmental and social pillars, but lower on the corporate governance one. The medians of the ESG and ESG Combined Scores are also higher than the 3rd quartile.
- At the level of the lower ESG group, the sustainable performance is found to be statistically diverse across the three pillars.
- At the level of the middle ESG group, the pairwise analysis stressed the statistically significant characteristic of the corporate sustainable engagement between two pairs of the sustainable performances. This result shows a rather homogenous median performance of the sustainability ‘traditional’ pillars (E and S) for the middle ESG Kohonen cluster.
- At the level of the higher ESG group, the sustainable performance is found to be statistically diverse across the three pillars.
- At the level of the lower ESG group, an increase in the average-combined ESG performance (when accounting for the controversies layer) was recorded for 321 companies, while a decrease was recorded for 68 companies. Specifically, a significant median increase in ESG performance of 6.87 was acknowledged when considering the controversies impact across the three-pillar based ESG performance (with a median of 42.96) and the average-combined overall ESG performance (with a median of 48.44).
- At the level of the middle ESG group, an increase in the average-combined ESG performance (when accounting for the controversies layer) was recorded for 99 companies, while a decrease was recorded for 181 companies. Specifically, a significant median decrease in ESG performance of 1.16 was acknowledged when considering the controversies impact across the three-pillar based ESG performance (with a median of 59.28) and the average-combined overall ESG performance (with a median of 58.25).
- At the level of the higher ESG group, an increase in the average-combined ESG performance (when accounting for the controversies layer) was recorded only for 3 companies, while a decrease was recorded for 493 companies. Specifically, a significant median decrease in ESG performance of 12.17 was acknowledged when considering the controversies impact across the three-pillar based ESG performance (with a median of 73.00) and the average-combined overall ESG performance (with a median of 61.71).
- There are three large groups of companies that follow the binomial relations between ‘no ESG risk exposure’–‘direct correspondence between ESG Combined and ESG performances’.
- A large number of companies with lower exposure to ESG risks are found in the Higher and Lower ESG clusters, while the Middle ESG cluster contains only two companies of this kind.
- There is a large number of companies in the Higher ESG cluster with high exposure to ESG risks.
- All three clusters contain a significant number of companies with high exposure to ESG risks that are subsequently penalized in terms of overall ESG performance. However, more companies from the Higher ESG cluster seem to exhibit lower performance, which confirms that companies with high ESG scores also have more related controversies.
- For the countries/territories with a very small/small number of ESG reporting companies and/or an allocation of the companies in only one cluster (Cyprus, Czech Republic, Gibraltar, Hungary, Isle of Man, Jersey, Malta, Portugal, and Ukraine), the KW test could not be run or it revealed no statistically significant difference between ESG scores across clusters for the respective countries.
- For a second group of countries/territories (Belgium, Greece, Guernsey, Ireland, Luxembourg and Norway), a statistically significant difference among the mean ranks was identified only for two clusters (Lower ESG–Higher ESG).
- A third group of countries exhibited different ESG behaviors among a pair of clusters:
- ○
- Higher ESG–Middle ESG and Higher ESG–Lower ESG (Austria, Denmark, Spain, Finland, France, Netherlands and Sweden);
- ○
- Higher ESG–Lower ESG and Middle ESG–Lower ESG (Poland and Russia).
- There was also a fourth group of countries for which the pairwise comparisons reflected that the mean ranks of ESG_S proved to be statistically dissimilar across all clusters (Switzerland, Germany, United Kingdom and Italy).
- The median social (SOC_S) performances in the Higher ESG cluster are statistically dissimilar across three economic sectors.
- The median environmental (ENV_S) performances in the Higher ESG cluster are statistically different across four economic sectors.
- In the Middle ESG cluster, the median ESG.Combined_S and the median ESG.Combined_A are statistically different for some economic sectors.
4.2. Mapping the Thematic ESG Performance for the European Companies
- In the lower ESG group, companies achieve median thematic ESG performances below the 25th percentile of the sample, except for the Environmental Innovation, Product Responsibility and Management scores.
- The middle ESG companies perform lower than the median of the entire sample on all nine thematic ESG dimensions. All the medians of the Middle ESG cluster are above the 1st quartile.
- The higher ESG European businesses have higher values than the 75th percentile of the sample only for Resource Use and Community scores.
- No differentiation across groups: This is the case of Management_S, which seems to have a homogenous sustainable performance across the three clusters for BMT, CNC, TEC, TEL and UTL. These five market-based economic sectors have in common the focus of their companies on rather providing goods and infrastructure for the ‘hard’ industries than services for the ‘soft’ industries. As a result, the involved firms are slightly approaching the managerial issues in a common or standardized way, since they are not perceived as a competitive differentiation on the market.
- Differentiation in the ESG thematic scores for one pair of clusters: When solely discriminating between bottom and top sustainability performers, one topic from each ESG component stands out—Environmental Innovation (Environmental performance), Workforce (Social performance) and CSR Strategy (Governance performance). The economic sectors (e.g., BMT, HLC, TEL, UTL) that differentiate in this case have a broad impact on all stakeholders and communities. This finding restates the increased scrutiny of the public when societal welfare issues are addressed by renowned sustainable companies.
- Differentiation in the ESG thematic scores for two pairs of clusters, exhibiting heterogeneity of sustainable behaviors adopted by the European companies: This finding shows that top ESG performers appear to distinguish themselves from their peers in consumer-oriented business sectors with fierce price competition (e.g., CNC, HLC, TEC), where the buyers choose between vendors also based on additional criteria (like remarkable sustainability performance).
- Differentiation in the ESG thematic scores for all three pairs of clusters, highlighting the grouping of companies according to the three levels of sustainability performances: In this situation, three economic sectors (CCS, FIN and IND) lead the ESG differentiation from one cluster to another. This stems from an increased corporate answer to stakeholders’ requests within very competitive and diverse economic sectors.
4.3. Mapping Different Approaches of the ESG Performance for the European Companies
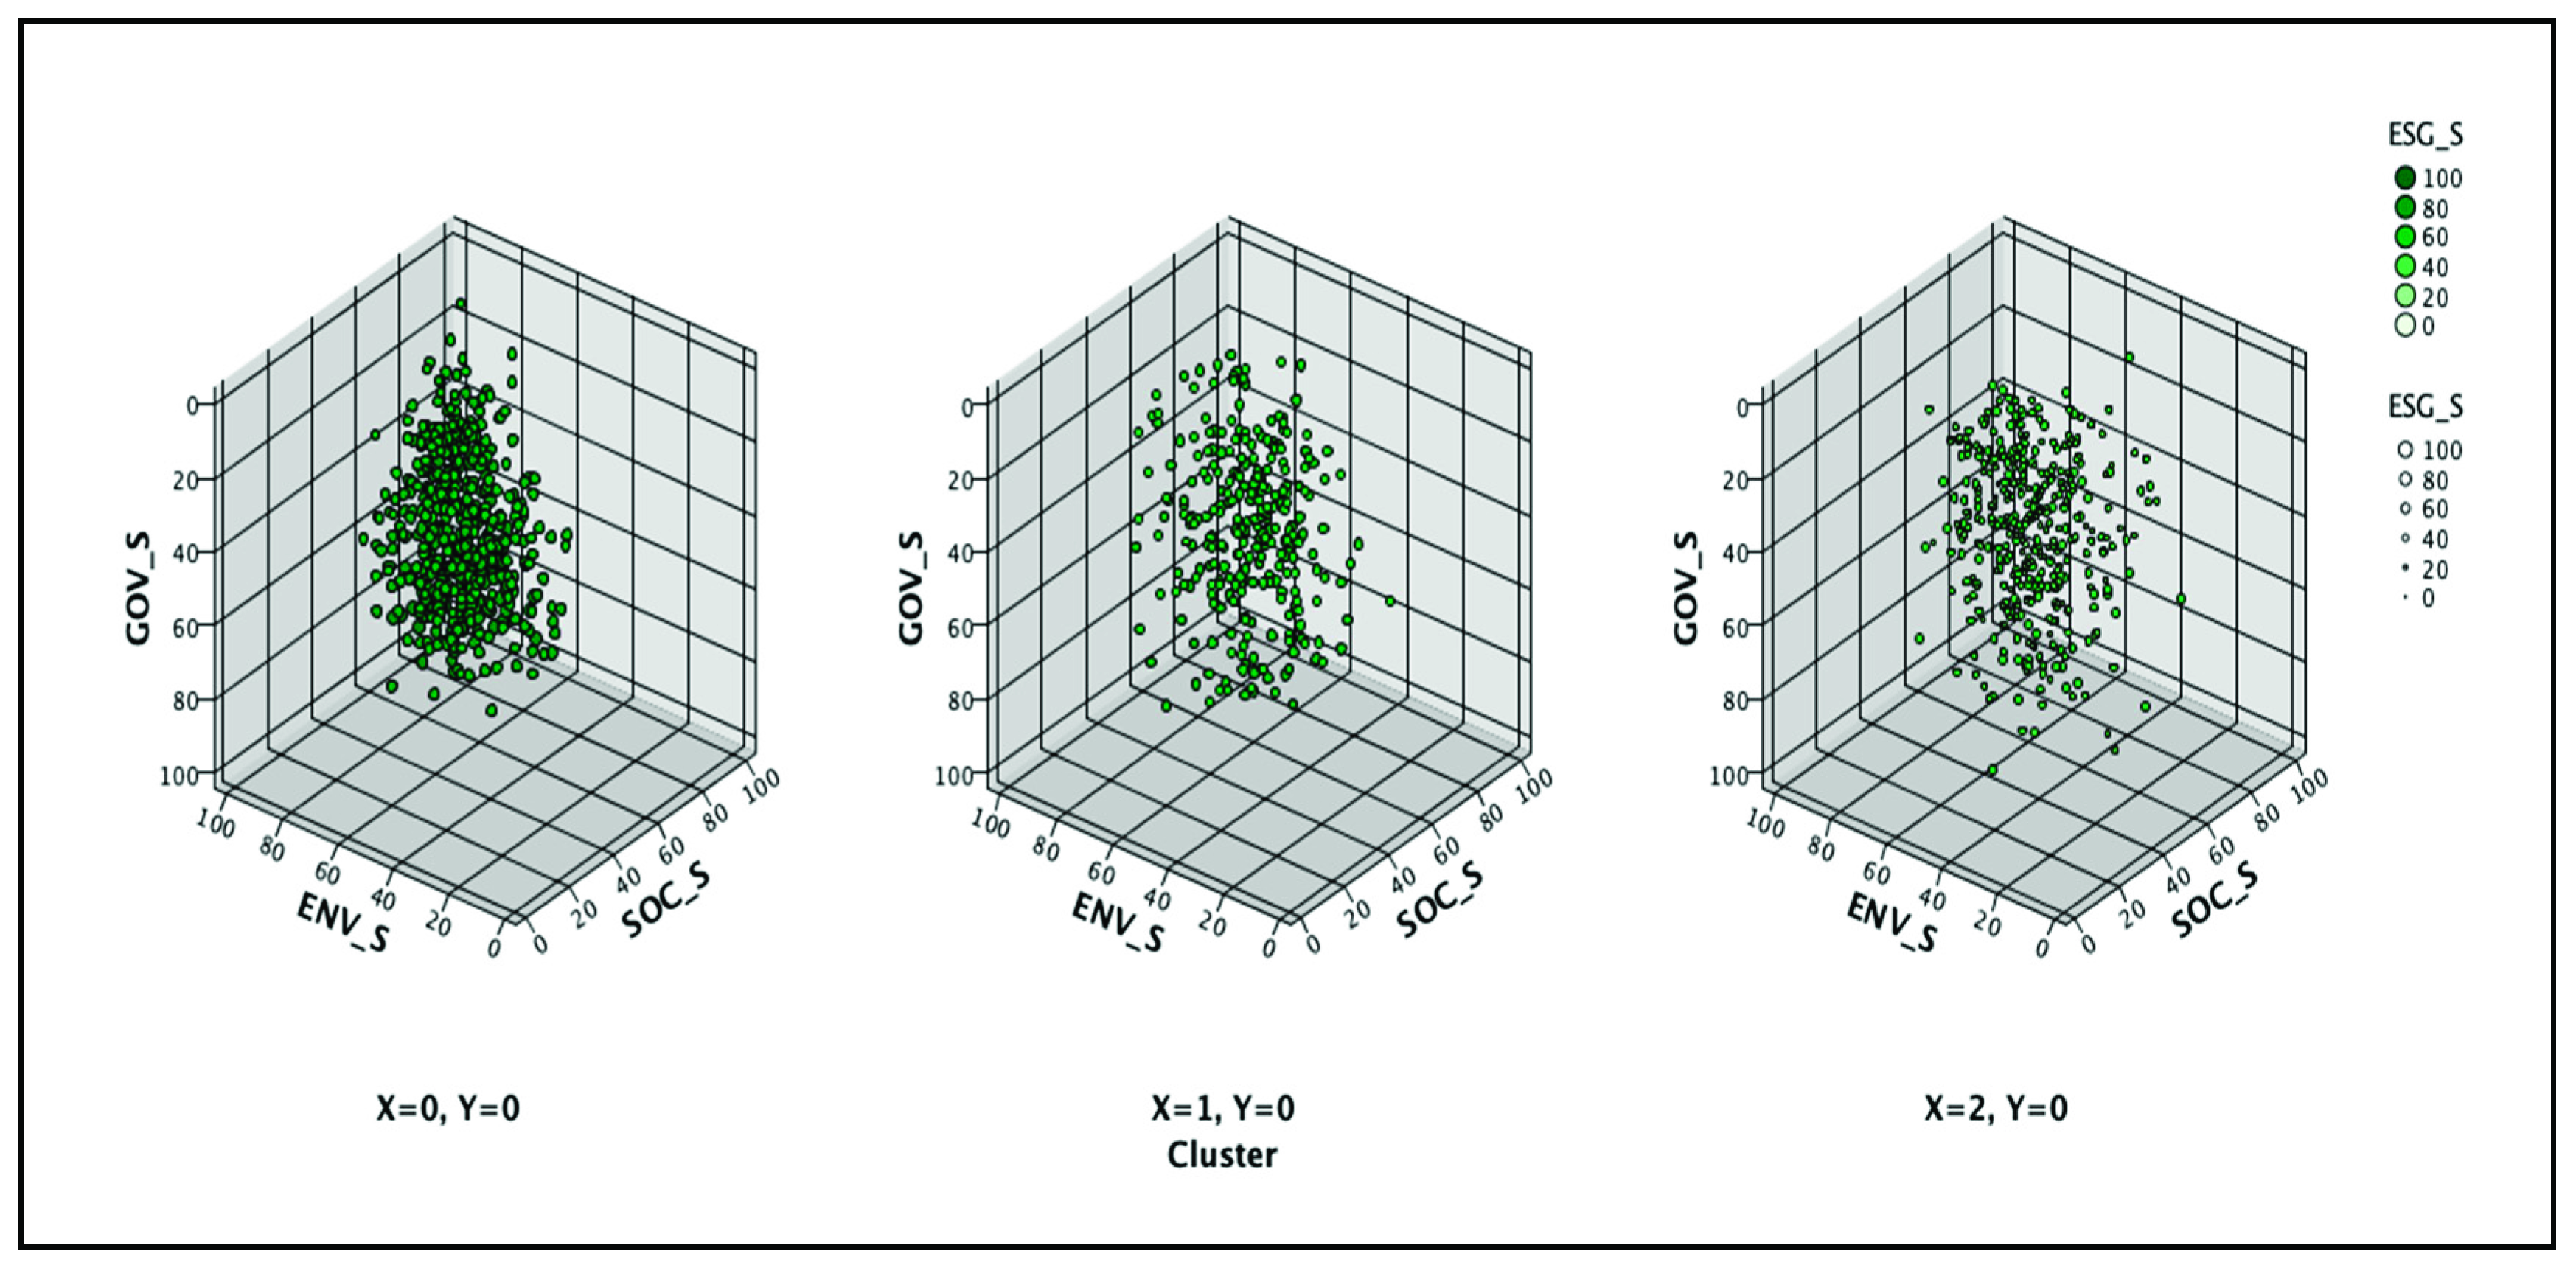
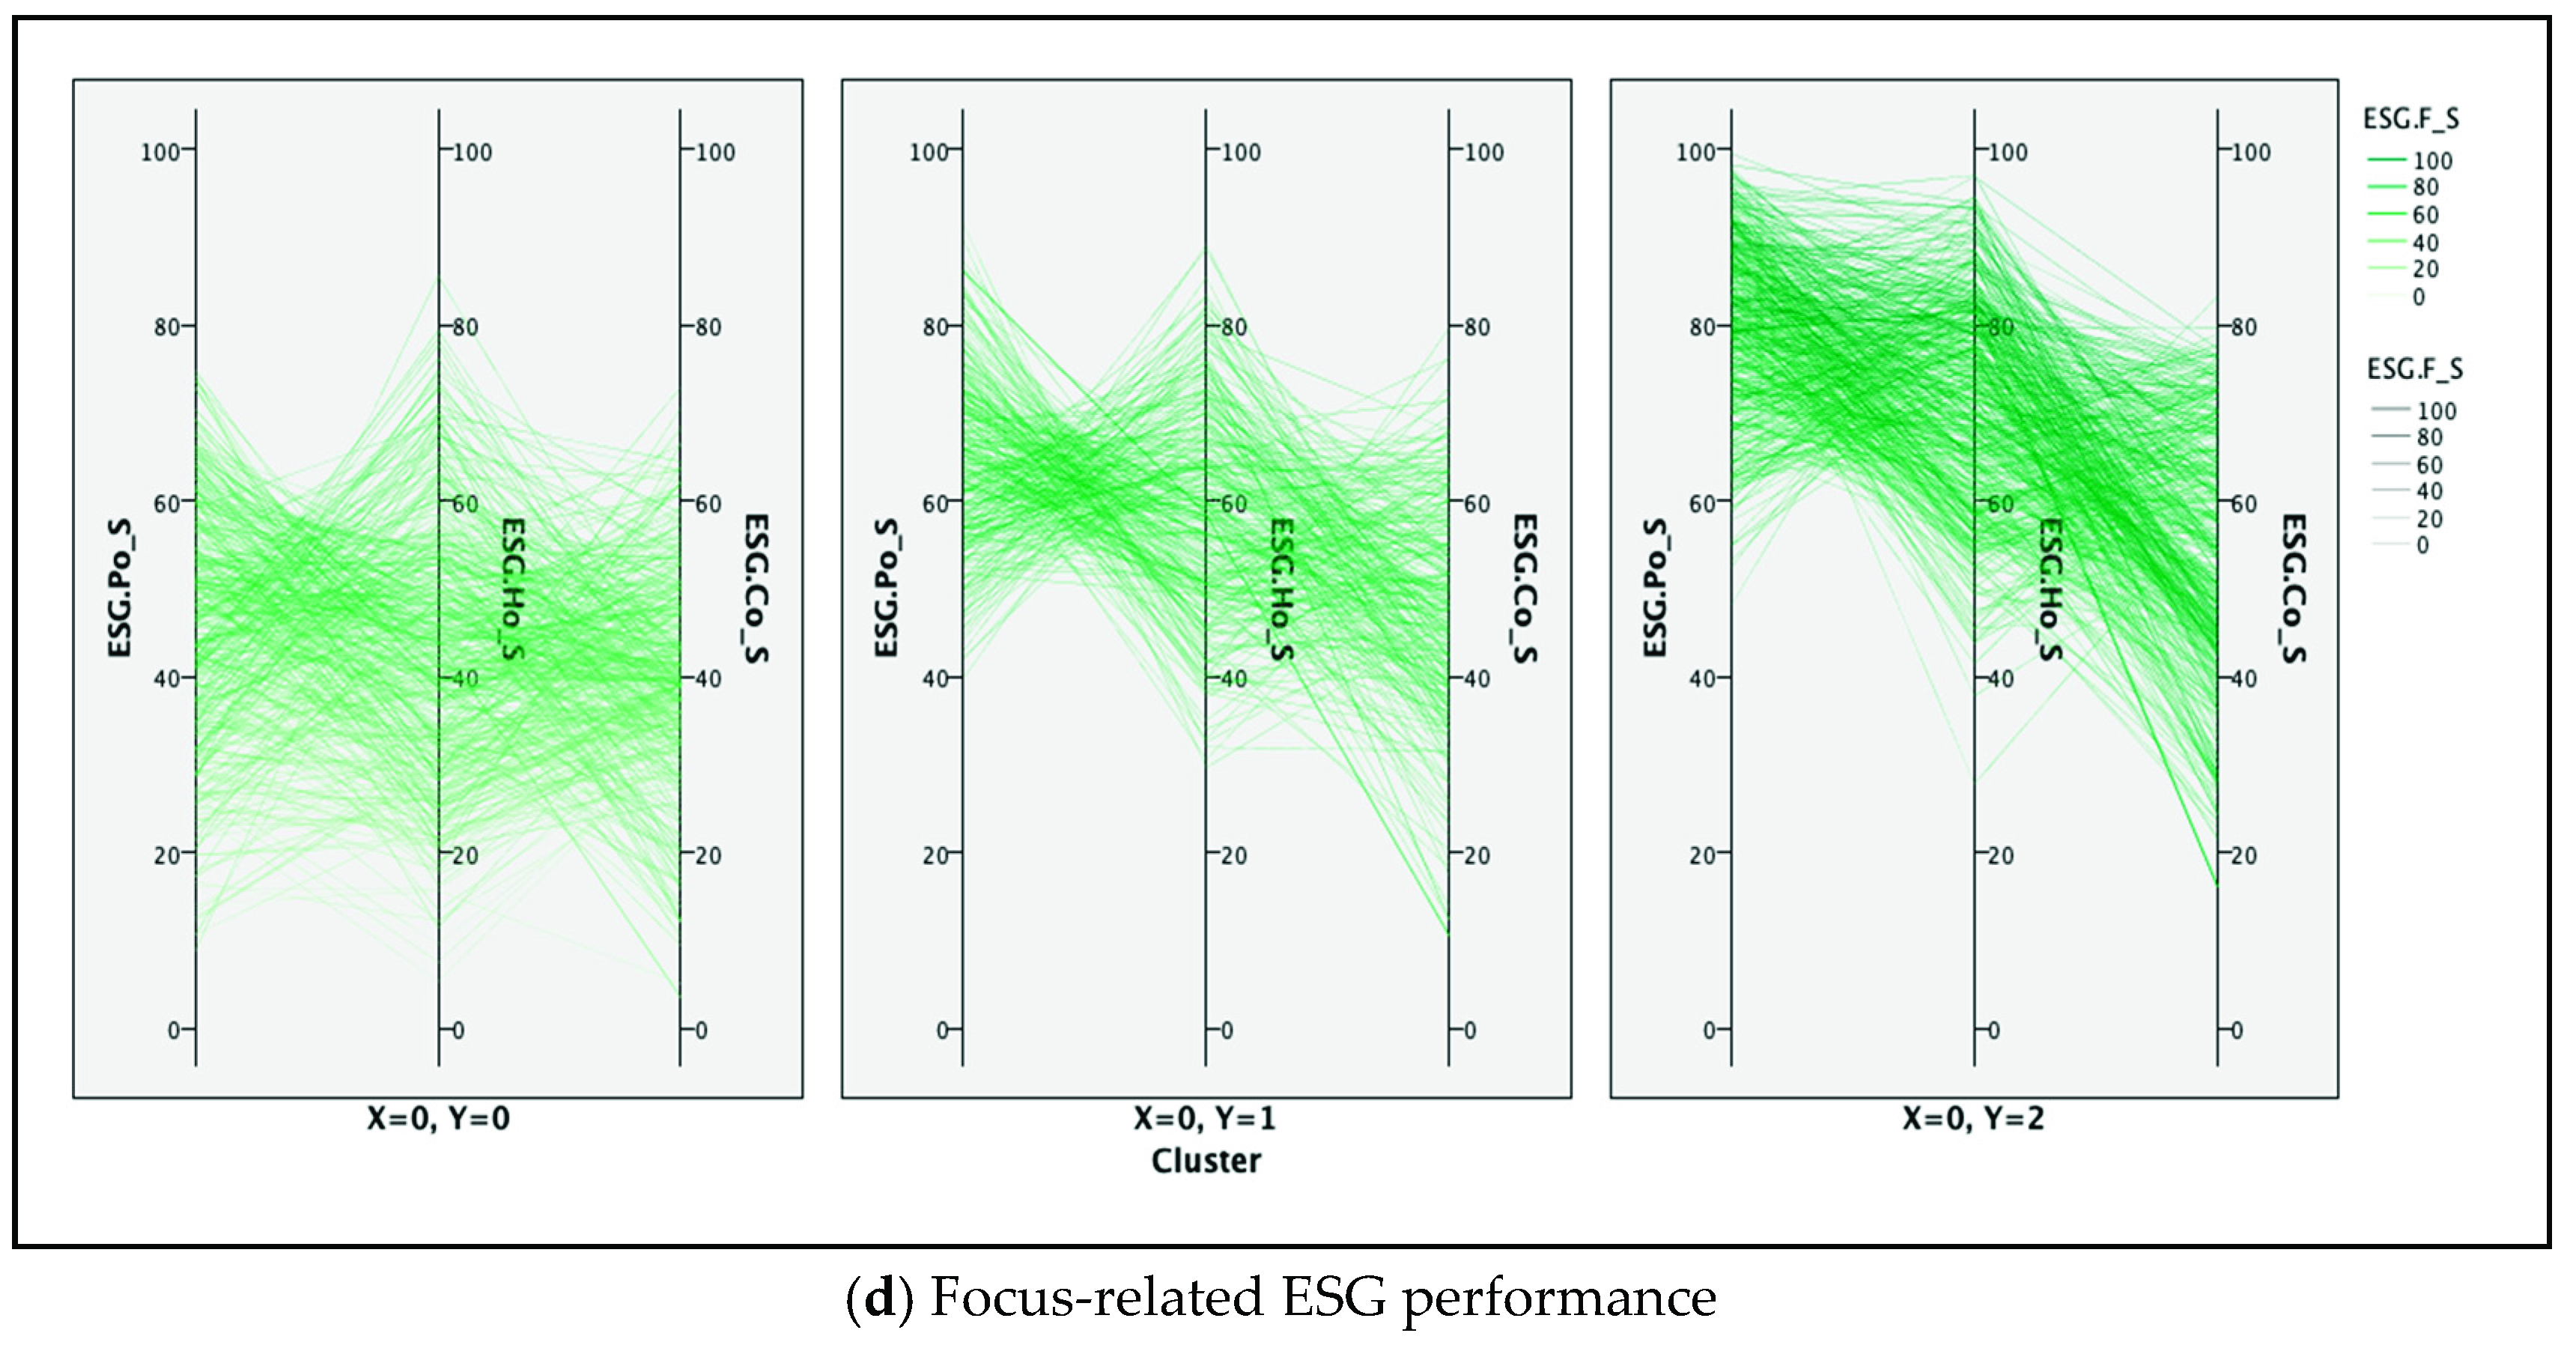
- For the Stakeholder’s View, an input layer formed of four neurons and a 1 × 3 output layer composed of three winning neurons: Lower ESG (X = 0, Y = 0); Middle ESG (X = 0, Y = 1); and Higher ESG (X = 0, Y = 2).
- For the Perspective View, an input layer formed of two neurons and a 3 × 2 output layer composed of six neurons of which only three were used: Lower ESG (X = 0, Y = 0); Middle ESG (X = 1, Y = 0); and Higher ESG (X = 2, Y = 0).
- For the Management Level View, an input layer formed of three neurons and a 3 × 2 output layer composed of six neurons of which only three were used: Higher ESG (X = 0, Y = 0); Middle ESG (X = 1, Y = 0); and Lower ESG (X = 2, Y = 0).
- For the Focus View, an input layer formed of three neurons and a 2 × 3 output layer composed of six neurons of which only three were used: Lower ESG (X = 0, Y = 0); Middle ESG (X = 0, Y = 1); and Higher ESG (X = 0, Y = 2).
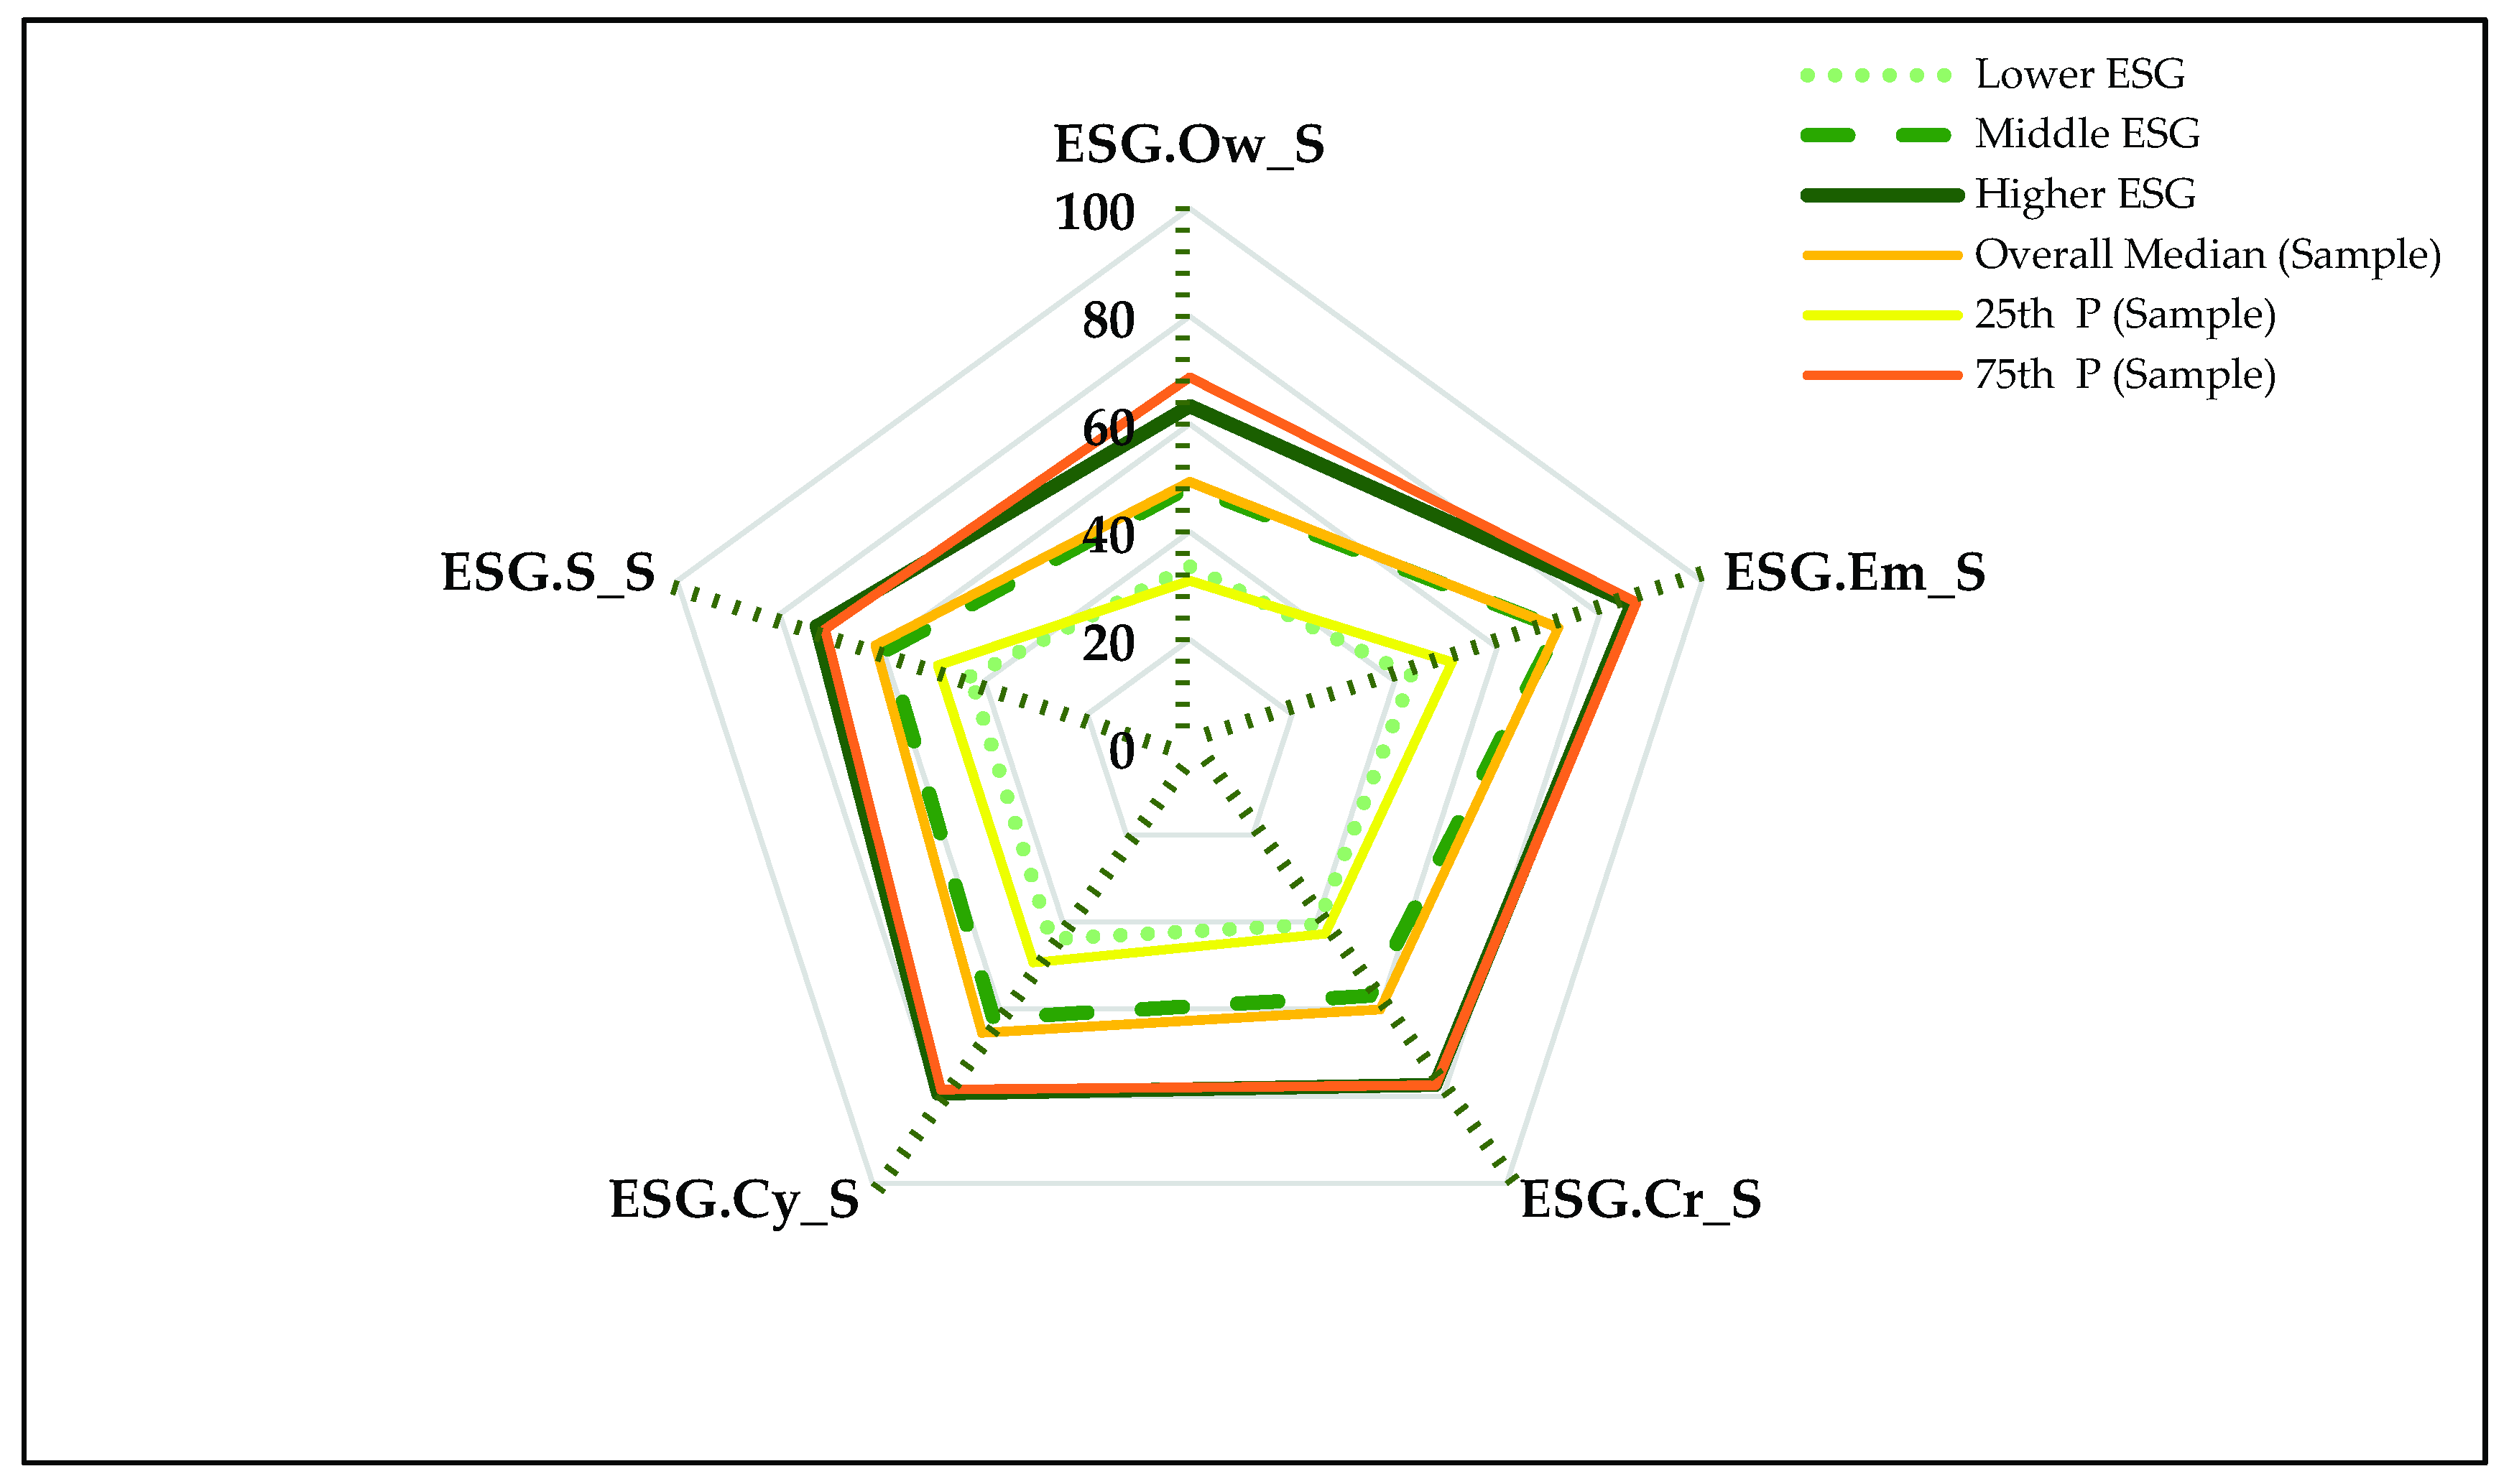
- In the lower ESG group, companies achieve median stakeholder-related ESG performances below the 25th percentile of the sample, except for the ESG.Ow_S.
- The middle ESG companies perform lower than the median of the entire sample. All the medians of the cluster are above the 1st quartile.
- The higher ESG European businesses have lower values than the 75th percentile of the sample, except for the ESG.Cy_S and ESG.S_S.
- At the level of the lower ESG group, the sustainable achievement is found to be statistically diverse across several pairs of ESG performance.
- At the level of the middle ESG group, the pairwise analysis emphasized that the differences in medians are statistically significant between almost all pairs of the stakeholder-related ESG variables.
- At the level of the higher ESG group, the results mirror the Middle ESG cluster case.
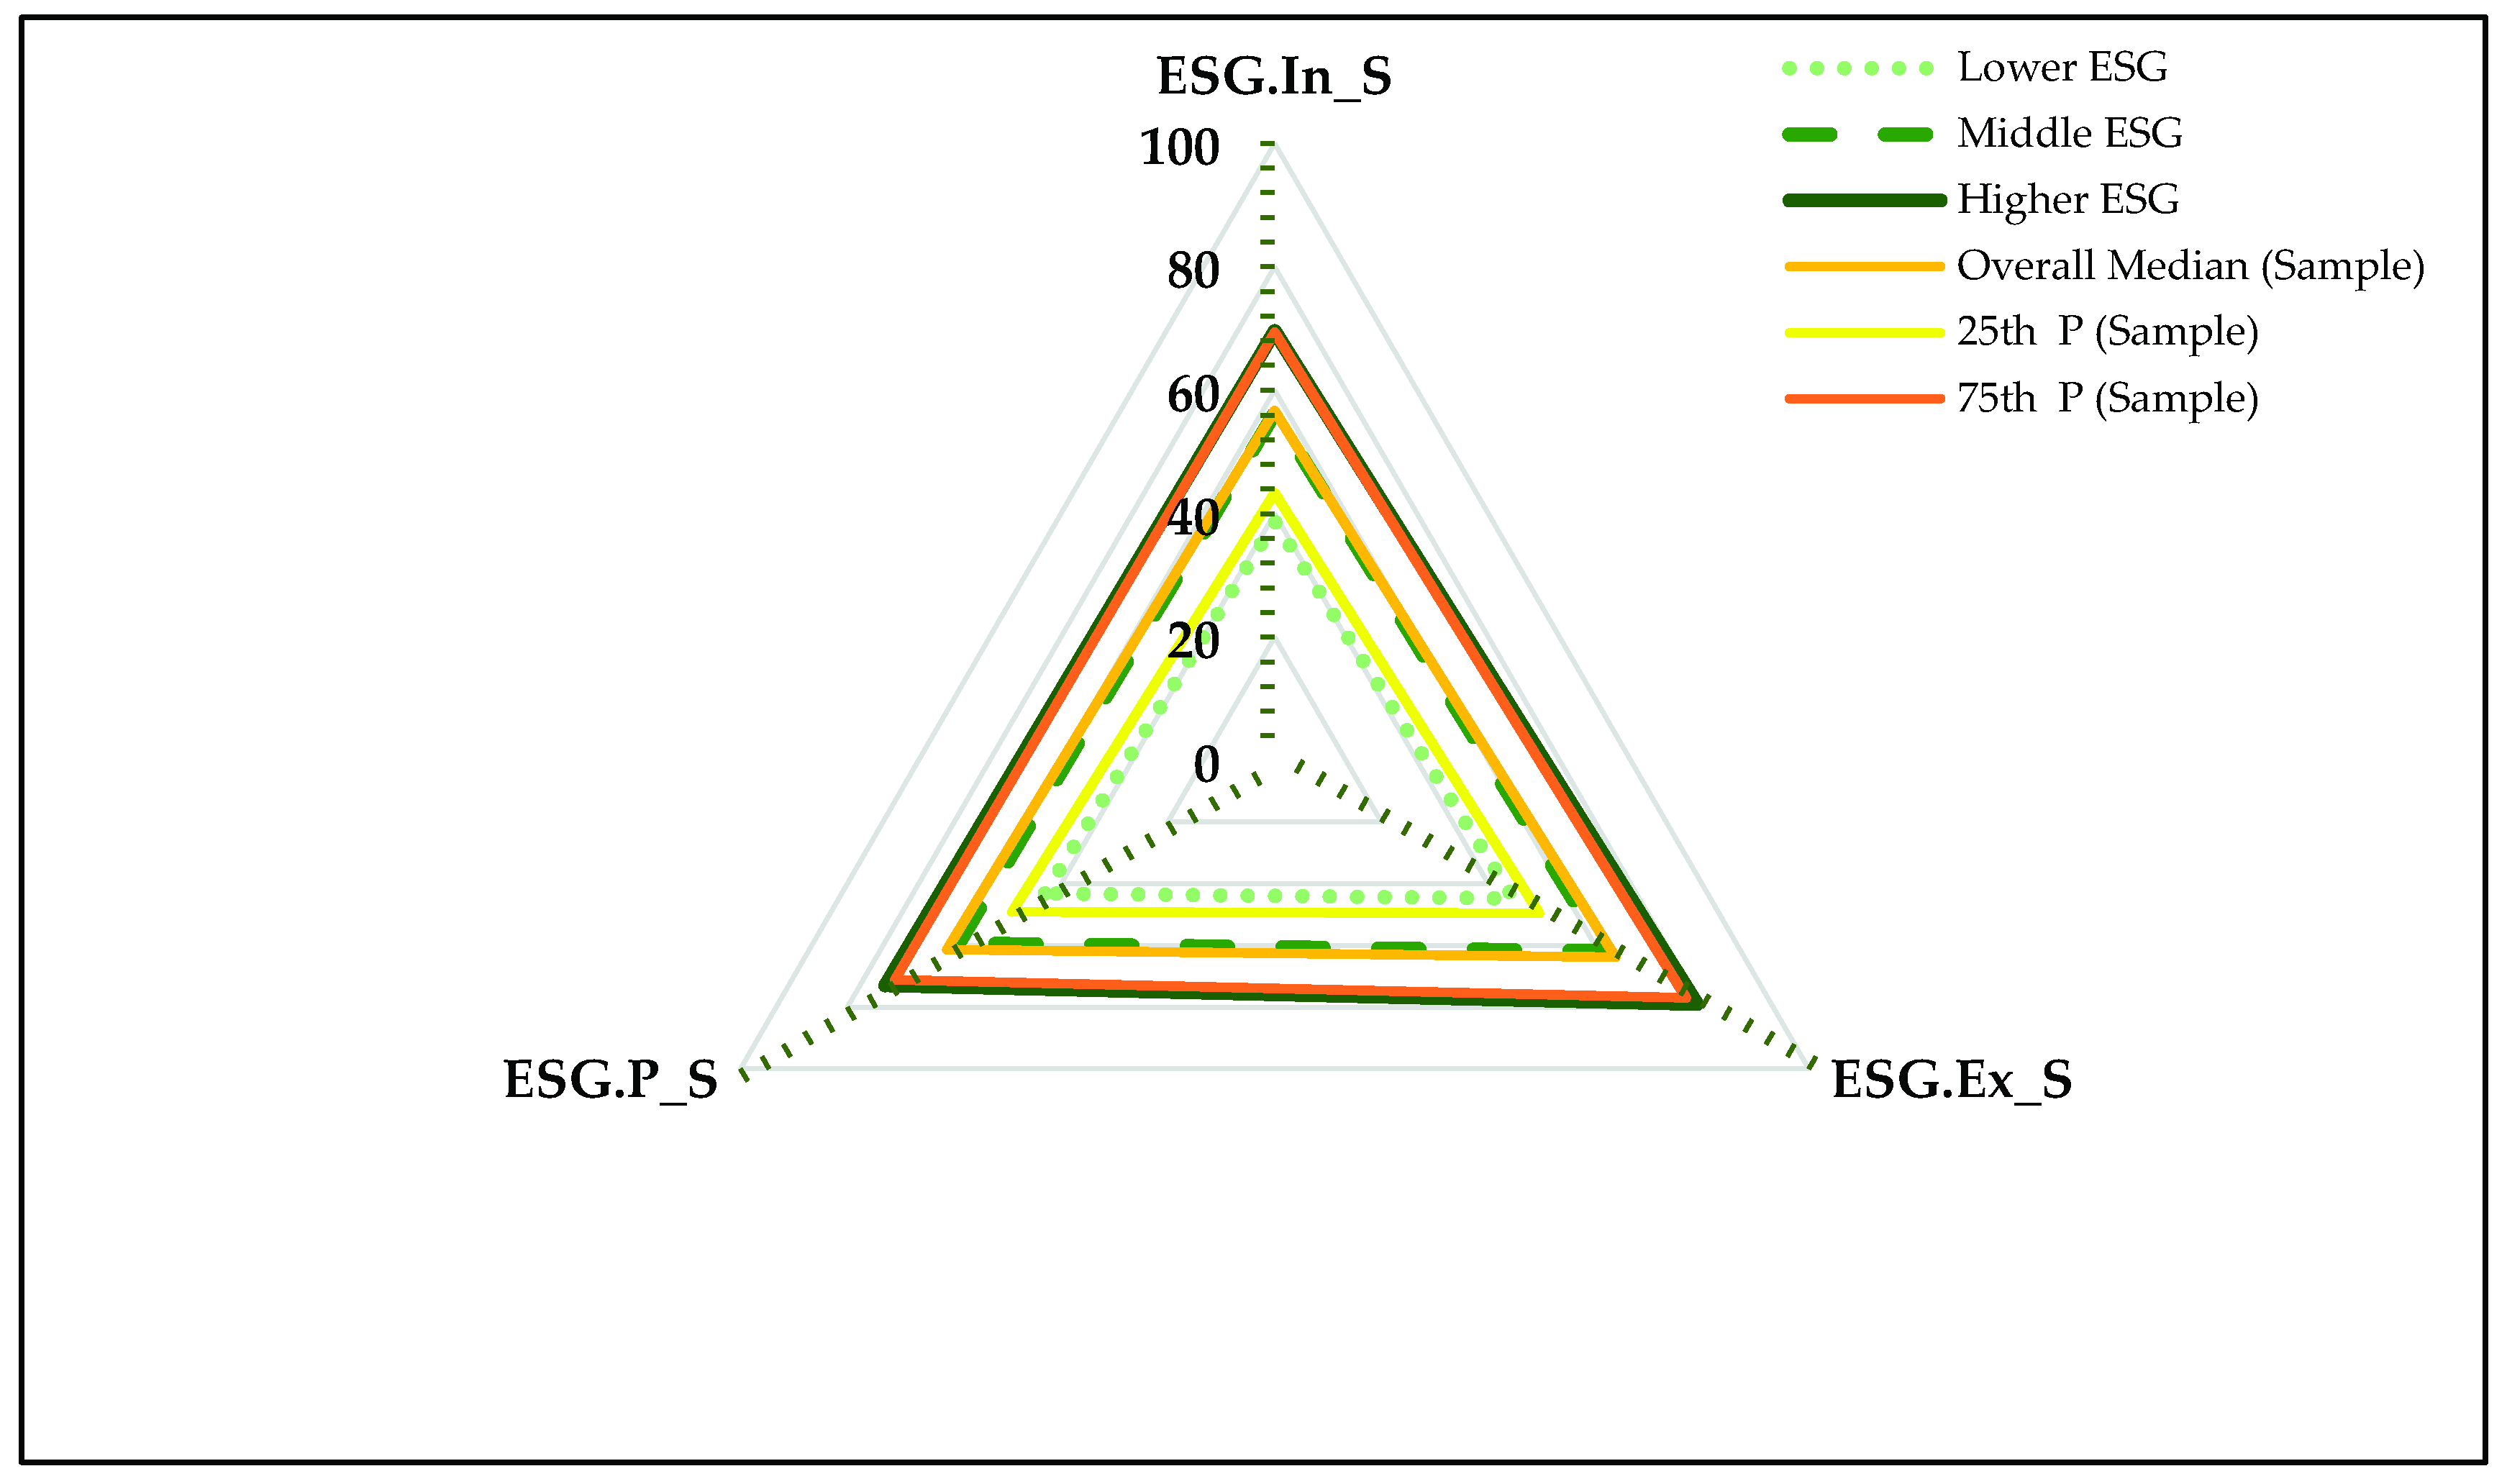
- In the lower ESG group, companies achieve median perspective-related ESG performances below the 25th percentile of the sample.
- The middle ESG companies perform lower than the median of the entire sample. All the medians of the cluster are above the 1st quartile.
- The higher ESG European businesses have higher values than the 75th percentile of the sample.
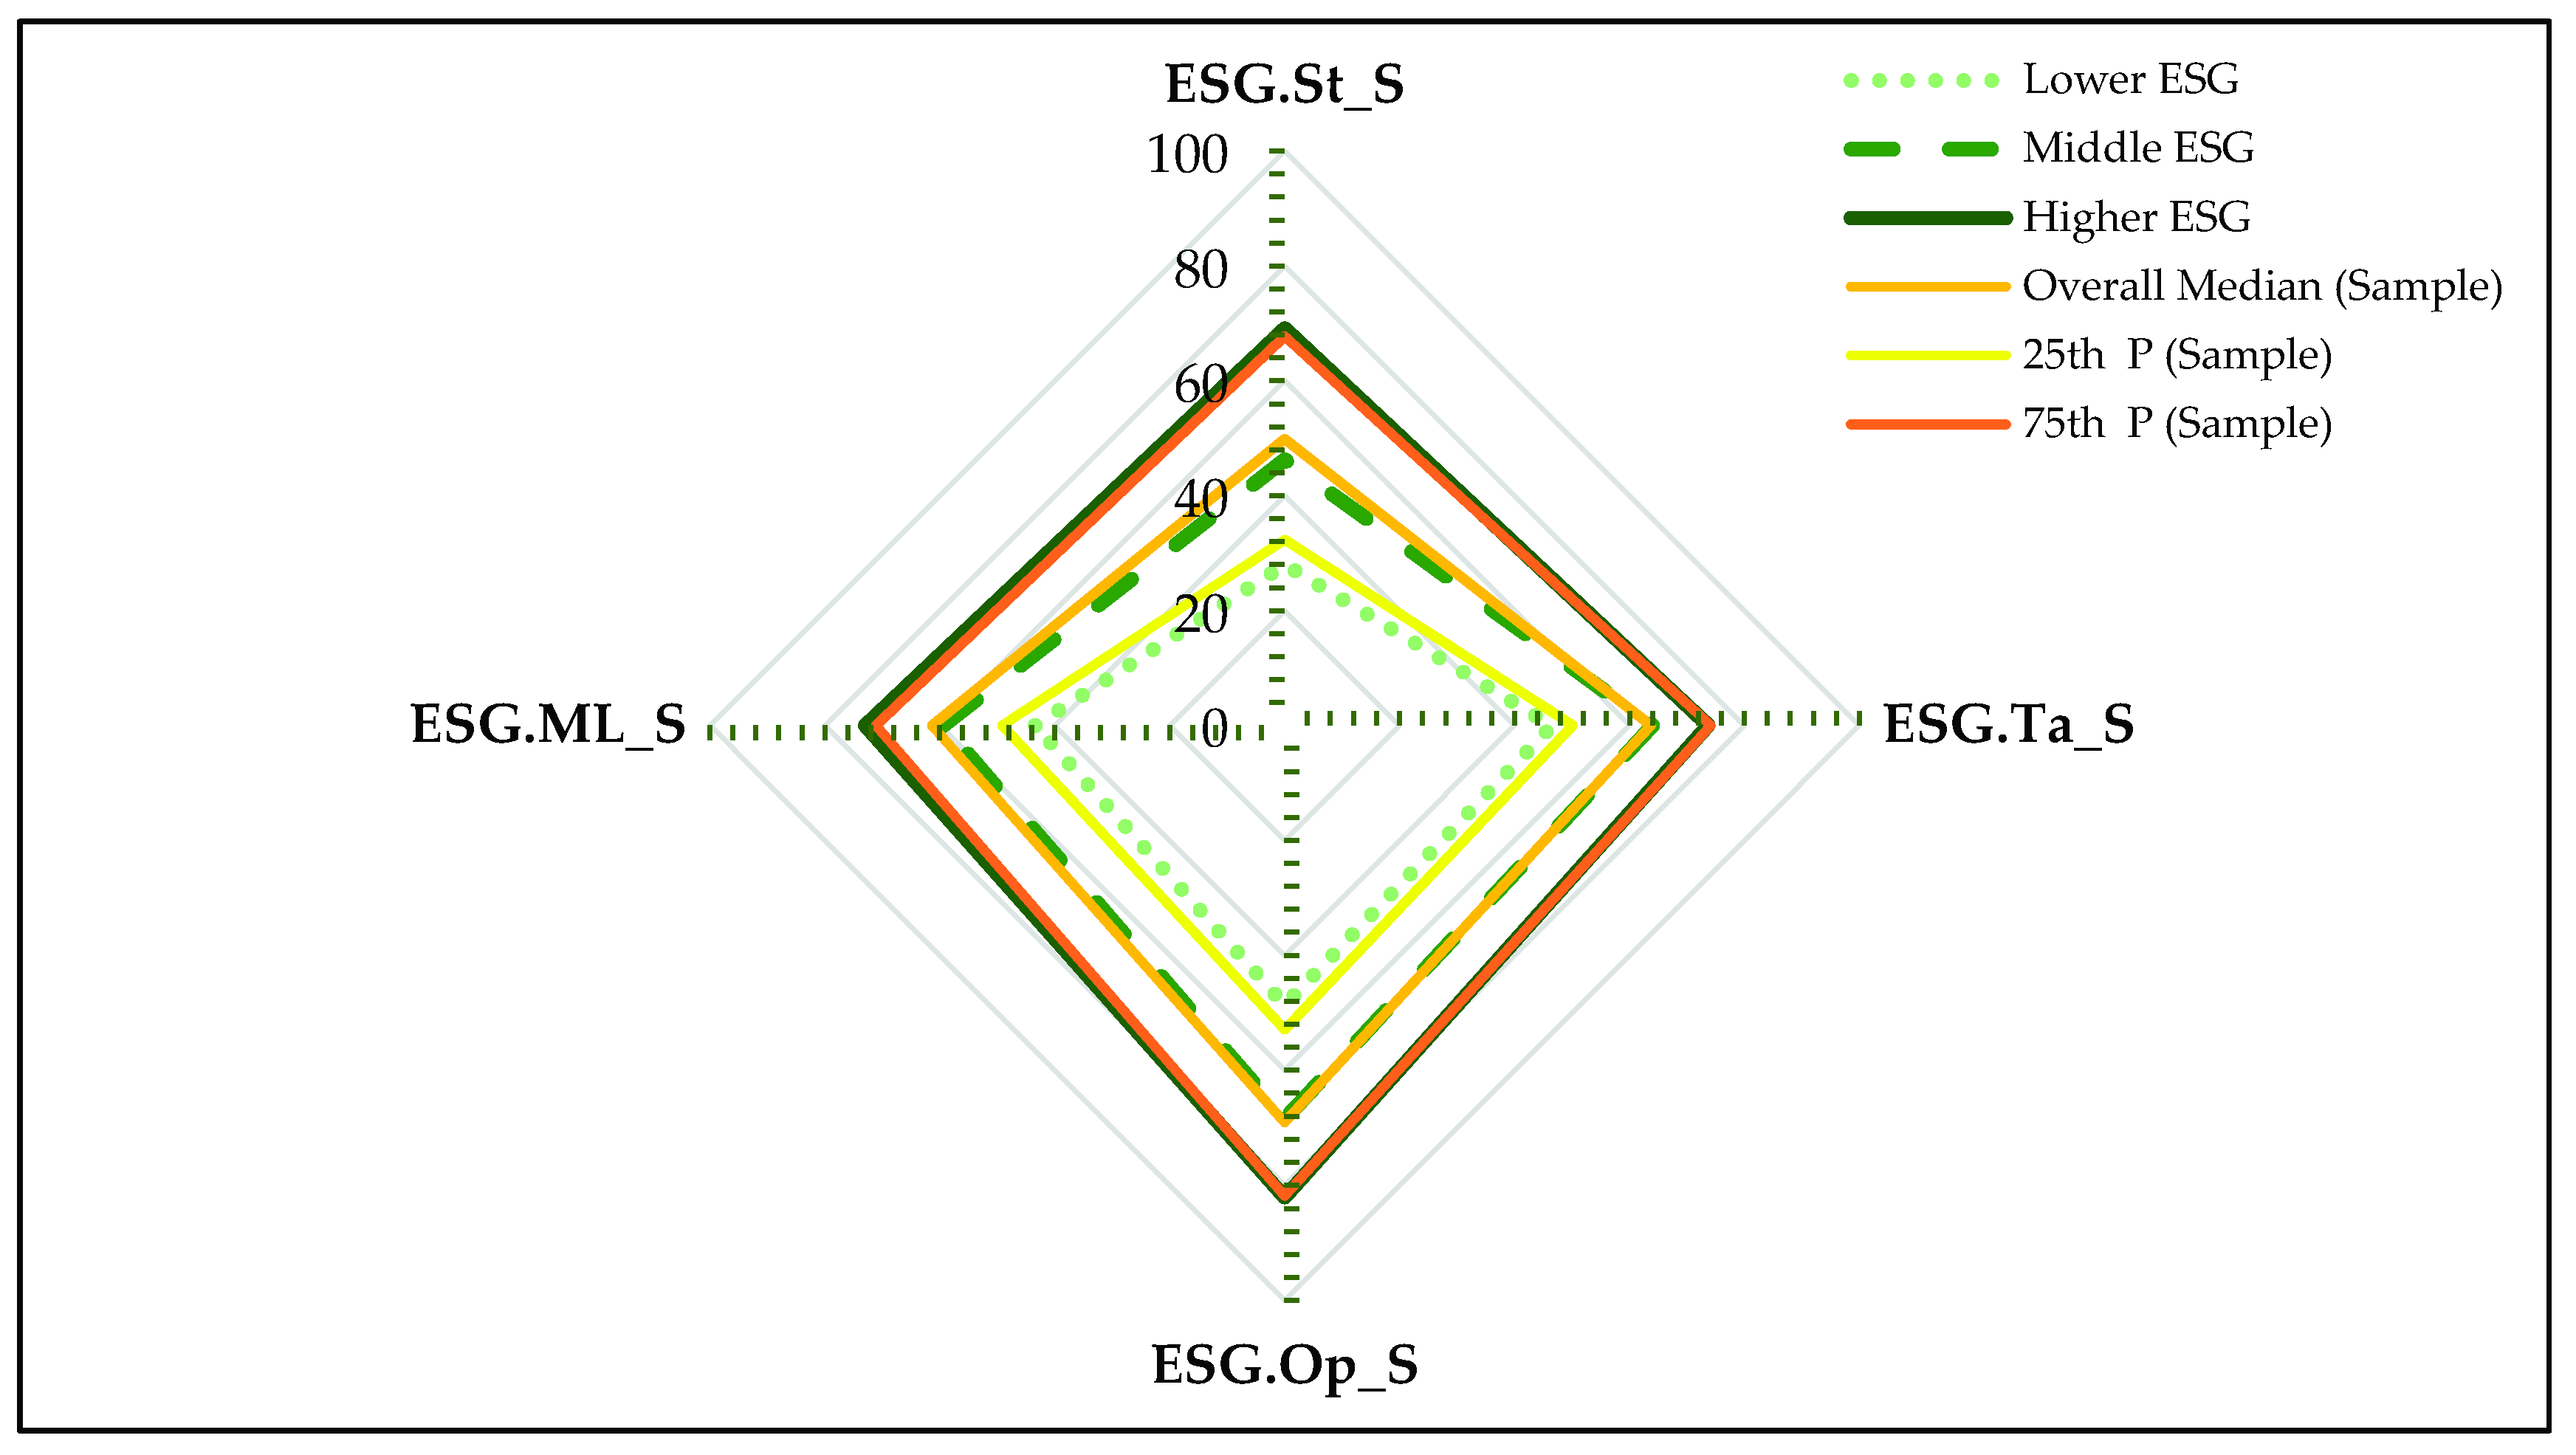
- In the lower ESG group, the investigated companies achieve median management level related ESG performances below the 25th percentile of the sample.
- The middle ESG companies perform lower than the median of the entire sample, except for the ESG.Ta_S. All the medians of the cluster are above the 1st quartile.
- The higher ESG European businesses have higher values than the 75th percentile of the sample, except for the ESG.Ta_S.
- At the level of the lower ESG group, the pairwise analysis emphasized the statistically significant characteristic of the sustainable performance between two pairs of variables.
- At the level of the middle ESG group, the pairwise analysis stressed a similar situation with the lower ESG group.
- At the level of the higher ESG group, the sustainable performance is found to be statistically diverse across all three management level components.
- Within the Lower ESG cluster, only the ESG.Co_S, outlining the image frame of the ESG, has the median above the 25th percentile of the sample.
- Within the Middle ESG cluster there is a similar situation, since only the ESG.Co_S has the median above the median of the sample.
- Within the Higher ESG clusters, the ESG.Po_S and ESG.F_S have medians above the 75th percentile.
- At the level of the lower ESG group, the pairwise analysis underlined the statistically significant characteristic of the sustainable performance between two pairs of variables.
- At the level of the middle ESG group, the pairwise analysis emphasized the statistically significant characteristic of the sustainable performance between all formed pairs.
- At the level of the higher ESG group, the pairwise analysis also highlighted the statistically significant feature of the ESG performance between all pairs of composite variables.
5. Conclusions
Author Contributions
Funding
Conflicts of Interest
References
- Escrig-Olmedo, E.; Fernández-Izquierdo, M.Á.; Ferrero-Ferrero, I.; Rivera-Lirio, J.M.; Muñoz-Torres, M.J. Rating the raters: Evaluating how ESG rating agencies integrate sustainability principles. Sustainability 2019, 11, 16. [Google Scholar] [CrossRef]
- Taliento, M.; Favino, C.; Netti, A. Impact of environmental, social, and governance information on economic performance: Evidence of a corporate ‘sustainability advantage’ from Europe. Sustainability 2019, 11, 26. [Google Scholar] [CrossRef]
- Badía, G.; Pina, V.; Torres, L. Financial performance of government bond portfolios based on environmental, social and governance criteria. Sustainability 2019, 11, 13. [Google Scholar] [CrossRef]
- Amel-Zadeh, A.; Serafeim, G. Why and how investors use ESG information: Evidence from a global survey. Financ. Anal. J. 2018, 74, 87–103. [Google Scholar] [CrossRef]
- Landi, G.; Sciarelli, M. Towards a more ethical market: The impact of ESG rating on corporate financial performance. Soc. Responsib. J. 2019, 15, 11–27. [Google Scholar] [CrossRef]
- Orsagh, M.; Allen, J.; Sloggett, J.; Bartholdy, S.; Georgieva, A.; Dehman, N.A.; Sofronova, Y. ESG Integration in Europe, the Middle East, and Africa: Markets, Practices, and Data. CFA Institute, Principles for Responsible Investment (PRI). 2019. Available online: https://www.unpri.org/download?ac=6036 (accessed on 21 May 2019).
- Ernst & Young (EY). Is Your Non-Financial Performance Revealing the True Value of Your Business to Investors? EY LLP: London, UK, 2017. Available online: https://www.ey.com/Publication/vwLUAssets/EY_-_Nonfinancial_performance_may_influence_investors/$FILE/ey-nonfinancial-performance-may-influence-investors.pdf (accessed on 21 December 2018).
- EU High-Level Expert Group on Sustainable Finance. Financing A Sustainable European economy. Final Report 2018. Financial Stability, Financial Services and Capital Markets Union (FISMA), European Commission. 2018. Available online: https://ec.europa.eu/info/sites/info/files/180131-sustainable-finance-final-report_en.pdf (accessed on 21 May 2019).
- United Nations Environment Programme (UNEP) and the World Bank Group (WB). Roadmap for A Sustainable Financial System. November 2017. Available online: http://unepinquiry.org/wp-content/uploads/2017/11/Roadmap_for_a_Sustainable_Financial_System.pdf (accessed on 21 May 2019).
- World Federation of Exchanges (WFE). WFE Sustainability Principles. 2018. Available online: https://www.world-exchanges.org/storage/app/media/research/Studies_Reports/2018/WFE%20Sustainability%20Principles%20October%202018.pdf (accessed on 22 May 2019).
- International Organization of Securities Commissions (IOSCO). Statement on Disclosure of ESG Matters by Issuers. 18 January 2019. Available online: https://www.iosco.org/library/pubdocs/pdf/IOSCOPD619.pdf (accessed on 22 May 2019).
- Organization for Economic Co-operation and Development. Social Impact Investment 2019: The Impact Imperative for Sustainable Development; OECD Publishing: Paris, France, 2019; ISBN 9789264311299. [Google Scholar]
- Vitolla, F.; Raimo, N.; Rubino, M. Appreciations, criticisms, determinants, and effects of integrated reporting: A systematic literature review. Corp. Soc. Responsib. Environ. Manag. 2019, 26, 518–528. [Google Scholar] [CrossRef]
- Daugaard, D. Emerging new themes in environmental, social and governance investing: A systematic literature review. Account. Financ. 2019. [Google Scholar] [CrossRef]
- Brooks, C.; Oikonomou, I. The effects of environmental, social and governance disclosures and performance on firm value: A review of the literature in accounting and finance. Br. Account. Rev. 2018, 50, 1–15. [Google Scholar] [CrossRef]
- Friede, G.; Busch, T.; Bassen, A. ESG and financial performance: Aggregated evidence from more than 2000 empirical studies. J. Sustain. Financ. Investig. 2015, 5, 210–233. [Google Scholar] [CrossRef]
- Dufwa, L.; Hammarström, M. Corporate Sustainability and the Financial Implications for the European Basic Materials Industry. Bachelor’ Thesis, University of Gothenburg, Gothenburg, Sweden, Spring. 2015. Available online: https://gupea.ub.gu.se/bitstream/2077/40462/1/gupea_2077_40462_1.pdf (accessed on 8 December 2018).
- Aouadi, A.; Marsat, S. Do ESG controversies matter for firm value? Evidence from international data. J. Bus. Ethics 2018, 151, 1027–1047. [Google Scholar] [CrossRef]
- Ferrero-Ferrero, I.; Fernández-Izquierdo, M.Á.; Muñoz-Torres, M.J. The effect of environmental, social and governance consistency on economic results. Sustainability 2016, 8, 16. [Google Scholar] [CrossRef]
- Ortas, E.; Álvarez, I.; Jaussaud, J.; Garayar, A. The impact of institutional and social context on corporate environmental, social and governance performance of companies committed to voluntary corporate social responsibility initiatives. J. Clean. Prod. 2015, 108, 673–684. [Google Scholar] [CrossRef]
- Cavaco, S.; Crifo, P. CSR and financial performance: Complementarity between environmental, social and business behaviours. Appl. Econ. 2014, 46, 3323–3338. [Google Scholar] [CrossRef]
- Han, J.J.; Kim, H.J.; Yu, J. Empirical study on relationship between corporate social responsibility and financial performance in Korea. Asian J. Sustain. Soc. Responsib. 2016, 1, 61–76. [Google Scholar] [CrossRef] [Green Version]
- Nollet, J.; Filis, G.; Mitrokostas, E. Corporate social responsibility and financial performance: A non-linear and disaggregated approach. Econ. Model. 2016, 52, 400–407. [Google Scholar] [CrossRef] [Green Version]
- Tang, Z.; Hull, C.E.; Rothenberg, S. How corporate social responsibility engagement strategy moderates the CSR–financial performance relationship. J. Manag. Stud. 2012, 49, 1274–1303. [Google Scholar] [CrossRef]
- Li, Y.; Gong, M.; Zhang, X.-Y.; Koh, L. The impact of environmental, social, and governance disclosure on firm value: The role of CEO power. Br. Account. Rev. 2018, 50, 60–75. [Google Scholar] [CrossRef] [Green Version]
- Utz, S. Corporate scandals and the reliability of ESG assessments: Evidence from an international sample. Rev. Manag. Sci. 2019, 13, 483–511. [Google Scholar] [CrossRef]
- Jitmaneeroj, B. Reform priorities for corporate sustainability: Environmental, social, governance, or economic performance? Manag. Decis. 2016, 54, 1497–1521. [Google Scholar] [CrossRef]
- Dorfleitner, G.; Halbritter, G.; Nguyen, M. The risk of social responsibility—Is it systematic? J. Sustain. Financ. Investig. 2016, 6, 1–14. [Google Scholar] [CrossRef]
- Dorfleitner, G.; Halbritter, G.; Nguyen, M. Measuring the level and risk of corporate responsibility—An empirical comparison of different ESG rating approaches. J. Asset Manag. 2015, 16, 450–466. [Google Scholar] [CrossRef]
- Clark, G.L.; Feiner, A.; Viehs, M. From the Stockholder to the Stakeholder: How Sustainability Can Drive Financial Outperformance. 5 March 2015. Available online: http://dx.doi.org/10.2139/ssrn.2508281 (accessed on 20 December 2018).
- Tkáč, M.; Verner, R. Artificial neural networks in business: Two decades of research. Appl. Soft Comput. 2016, 38, 788–804. [Google Scholar] [CrossRef]
- Somers, M.J.; Casal, J. Introducing neural computing in governance research: Applying self-organizing maps to configurational studies. Corp. Gov. Int. Rev. 2017, 25, 440–453. [Google Scholar] [CrossRef]
- Horobet, A.; Belașcu, L.; Ioniță, I.; Șerban-Oprescu, A.-T. A neural networks perspective on the financial integration of European capital markets. Econ. Comput. Econ. Cybern. Stud. Res. 2014, 48, 115–126. Available online: http://www.ecocyb.ase.ro/nr20141/Horobet%20Alexandra.pdf (accessed on 23 May 2019).
- Di Tollo, G.; Tanev, S.; De March, D.; Ma, Z. Neural networks to model the innovativeness perception of co-creative firms. Expert Syst. Appl. 2012, 39, 12719–12726. [Google Scholar] [CrossRef]
- Riva, E.; Lucchini, M. Firm performance: Taxonomy of European companies using self-organizing maps. Qual. Quant. Int. J. Methodol. 2018, 52, 457–477. [Google Scholar] [CrossRef]
- Resta, M.; Garelli, R.; Dameri, R.P. Mapping financial performances in Italian ICT-related firms via self-organizing maps. In Network, Smart and Open: Three Keywords for Information Systems Innovation. Lecture Notes in Information Systems and Organisation; Lamboglia, R., Cardoni, A., Dameri, R., Mancini, D., Eds.; Springer: Cham, Germany, 2018; pp. 271–281. ISBN 978-3-319-62636-9. [Google Scholar]
- Van Duuren, E.; Plantinga, A.; Scholtens, B. ESG integration and the investment management process: Fundamental investing reinvented. J. Bus. Ethics 2016, 138, 525–533. [Google Scholar] [CrossRef]
- De Franco, C. ESG Controversies and Their Impact on Performance; Ossiam: Paris, France, 2018; Available online: https://ossiam.com/files/research_papers/1541146820_ESG_controversies_and_performance_impact.pdf (accessed on 19 December 2018).
- Park, S.-B. Multinationals and sustainable development: Does internationalization develop corporate sustainability of emerging market multinationals? Bus. Strategy Environ. 2018, 27, 1514–1524. [Google Scholar] [CrossRef]
- Garvey, G.T.; Kazdin, J.; LaFond, R.; Nash, J.; Safa, H. A pitfall in ethical investing: ESG disclosures reflect vulnerabilities, not virtues. J. Investig. Manag. 2017, 15, 51–64. [Google Scholar] [CrossRef]
- Afonso, S.C.; Fernandes, P.O.; Monte, A.P. CSR of top Portuguese companies: Relation between social performance and economic performance. Int. J. Soc. Behav. Educ. Econ. Bus. Ind. Eng. 2012, 6, 1407–1411. [Google Scholar]
- Szopik-Depczyńska, K.; Cheba, K.; Bąk, I.; Kiba-Janiak, M.; Saniuk, S.; Dembińska, I.; Ioppolo, G. The application of relative taxonomy to the study of disproportions in the area of sustainable development of the European Union. Land Use Policy 2017, 68, 481–491. [Google Scholar] [CrossRef]
- Ioppolo, G.; Cucurachi, S.; Salomone, R.; Saija, G.; Shi, L. Sustainable local development and environmental governance: A strategic planning experience. Sustainability 2016, 8, 16. [Google Scholar] [CrossRef]
- European Commission (EC). Corporate Social Responsibility: A Business Contribution to Sustainable Development. Brussels. 02 July 2002. Available online: https://ec.europa.eu/europeaid/sites/devco/files/communication-corporate-social-responsibility-sustainable-development-com2002347-20020702_en.pdf (accessed on 20 January 2019).
- Miller, D. CSR, ESG, SRI and Why All Companies Should Care. 18 April 2018. Available online: https://www.managinc.com/news/2018/4/18/csr-esg-sri-and-why-all-companies-should-care-1 (accessed on 21 December 2018).
- Hřebíček, J.; Soukopová, J.; Trenz, O. Current trends of economic modelling of sustainable corporate performance and reporting—Review and research agenda. Procedia Econ. Financ. 2014, 12, 234–242. [Google Scholar] [CrossRef]
- Skroupa, C.P. Define Metrics for ESG, CSR and the Like, and You’ll Grab Wall Street’s Attention. 06 February 2018. Available online: https://www.forbes.com/sites/christopherskroupa/2018/02/06/define-metrics-for-esg-csr-and-the-like-and-youll-grab-wall-streets-attention/#2a6e39a55444 (accessed on 21 December 2018).
- Ribando, J.M.; Bonne, G. A New Quality Factor: Finding Alpha with ASSET4 ESG Data. Starmine Research Note, Thomson Reuters. 31 March 2010. Available online: http://citeseerx.ist.psu.edu/viewdoc/download?doi=10.1.1.429.577&rep=rep1&type=pdf (accessed on 22 December 2018).
- Miralles-Quirós, M.M.; Miralles-Quirós, J.L.; Valente Gonçalves, L.M. The value relevance of environmental, social, and governance performance: The Brazilian case. Sustainability 2018, 10, 15. [Google Scholar] [CrossRef]
- Dahlberg, L.; Wiklund, F. ESG Investing in Nordic Countries: An Analysis of the Shareholder View of Creating Value. Degree Project, Umeå University, Sweden, Spring. 2018. Available online: http://www.diva-portal.org/smash/get/diva2:1229424/FULLTEXT01.pdf (accessed on 8 December 2018).
- Wang, Z.; Hsieh, T.-S.; Sarkis, J. CSR performance and the readability of CSR reports: Too good to be true? Corp. Soc. Responsib. Environ. Manag. 2018, 25, 66–79. [Google Scholar] [CrossRef]
- Yoon, B.; Lee, J.H.; Byun, R. Does ESG performance enhance firm value? Evidence from Korea. Sustainability 2018, 10, 18. [Google Scholar] [CrossRef]
- Roman, A.G.; Mocanu, M.; Hoinaru, R. Disclosure style and its determinants in integrated reports. Sustainability 2019, 11, 16. [Google Scholar] [CrossRef]
- Kocmanová, A.; Dočekalová, M. Construction of the economic indicators of performance in relation to environmental, social and corporate governance (ESG) factors. Acta Univ. Agric. Silvic. Mendel. Brun. 2012, 60, 195–206. [Google Scholar] [CrossRef]
- Koehler, D.A.; Hespenheide, E.J. Finding the Value in Environmental, Social, and Governance Performance. Deloitte Rev. 2013, 12, 98–111. Available online: https://ssrn.com/abstract=2218841 (accessed on 17 December 2018).
- Pokorna, M. Socially Responsible Investing and Portfolio Performance. Master’ Thesis, Erasmus University Rotterdam, Rotterdam, The Netherlands, November 2017. Available online: https://thesis.eur.nl/pub/41396/Pokorna-M.-449106-.pdf (accessed on 14 December 2018).
- European Union (EU). Directive 2014/95/EU of the European Parliament and of the Council of 22 October 2014 Amending Directive 2013/34/EU as Regards Disclosure of Non-Financial and Diversity Information by Certain Large Undertakings and Groups. Official Journal of the European Union; Publications Office of the European Union: Luxembourg, 2014. Available online: https://eur-lex.europa.eu/legal-content/EN/TXT/PDF/?uri=CELEX:32014L0095&from=FI (accessed on 20 January 2019).
- European Commission (EC). Guidelines on Non-Financial Reporting (Methodology for Reporting Non-Financial Information). Official Journal of the European Union. 05 July 2017. Available online: https://eur-lex.europa.eu/legal-content/EN/TXT/PDF/?uri=CELEX:52017XC0705(01)&from=EN (accessed on 20 January 2019).
- Mocanu, M.; Roman, A.G. Financial and non-financial reporting in Romanian entities operating in agriculture, forestry, and fishery. Audit Financ. 2016, 14, 659–669. [Google Scholar] [CrossRef]
- Global Reporting Initiative (GRI). About Sustainability Reporting. 2019. Available online: https://www.globalreporting.org/information/sustainability-reporting/Pages/default.aspx (accessed on 5 January 2019).
- Sustainability Accounting Standards Board (SASB). Why is Financial Materiality Important? 2018. Available online: https://www.sasb.org/standards-overview/materiality-map/ (accessed on 5 January 2019).
- Sustainability Accounting Standards Board (SASB). SASB Materiality Map. 2018. Available online: https://materiality.sasb.org/ (accessed on 5 January 2019).
- Refinitiv. Thomson Reuters ESG Scores. February 2019. Available online: https://www.refinitiv.com/content/dam/marketing/en_us/documents/methodology/esg-scores-methodology.pdf (accessed on 7 March 2019).
- Halbritter, G.; Dorfleitner, G. The wages of social responsibility—Where are they? A critical review of ESG investing. Rev. Financ. Econ. 2015, 26, 25–35. [Google Scholar] [CrossRef]
- Manrique, S.; Martí-Ballester, C.-P. Analyzing the effect of corporate environmental performance on corporate financial performance in developed and developing countries. Sustainability 2017, 9, 30. [Google Scholar] [CrossRef]
- Sassen, R.; Hinze, A.-K.; Hardeck, I. Impact of ESG factors on firm risk in Europe. J. Bus. Econ. 2016, 86, 867–904. [Google Scholar] [CrossRef]
- Sila, I.; Cek, K. The impact of environmental, social and governance dimensions of corporate social responsibility on economic performance: Australian evidence. Procedia Comput. Sci. 2017, 120, 797–804. [Google Scholar] [CrossRef]
- Velte, P. Does ESG performance have an impact on financial performance? Evidence from Germany. J. Glob. Responsib. 2017, 8, 169–178. [Google Scholar] [CrossRef]
- Galant, A.; Cadez, S. Corporate social responsibility and financial performance relationship: A review of measurement approaches. Econ. Res. Ekon. Istraživanja 2017, 30, 676–693. [Google Scholar] [CrossRef]
- Eccles, R.G.; Ioannou, I.; Serafeim, G. The impact of corporate sustainability on organizational processes and performance. Manag. Sci. 2014, 60, 2835–2857. [Google Scholar] [CrossRef]
- Porter, M.E.; Hills, G.; Pfitzer, M.; Patscheke, S.; Hawkins, E. Measuring Shared Value: How to Unlock Value by Linking Business and Social Results. Foundation Strategy Group (FSG). Available online: https://www.hbs.edu/faculty/Pages/item.aspx?num=46910 (accessed on 18 December 2018).
- Allur, E.; Heras-Saizarbitoria, I.; Boiral, O.; Testa, F. Quality and environmental management linkage: A review of the literature. Sustainability 2018, 10, 15. [Google Scholar] [CrossRef]
- Peiró-Signes, A.; Segarra-Oña, M.; Mondéjar-Jiménez, J.; Vargas-Vargas, M. Influence of the environmental, social and corporate governance ratings on the economic performance of companies: An overview. Int. J. Environ. Res. 2013, 7, 105–112. [Google Scholar]
- Nguyen-Taylor, K.; Martindale, W. Financial Performance of ESG Integration in US Investing. Principles for Responsible Investment (PRI). 2018. Available online: https://www.unpri.org/download?ac=4218 (accessed on 21 December 2018).
- Global Reporting Initiative (GRI). Making the Connection: The Real Effect of ESG on Corporate Financial Performance. 03 February 2016. Available online: https://www.globalreporting.org/information/news-and-press-center/Pages/Real-effect-of-ESG-on-Corporate-Financial-Performance.aspx (accessed on 5 January 2019).
- Kasem, E.; Trenz, O.; Hřebíček, J. Statistical method and neural network for sustainability evaluation. In Proceedings of the 32nd International Conference on Mathematical Methods in Economics (MME 2014), Olomouc, Czech Republic, 10–12 September 2014; Talašová, J., Stoklasa, J., Talášek, T., Eds.; Palacký University: Olomouc, Czech Republic, 2014; pp. 396–401. Available online: http://mme2014.upol.cz/downloads/MME_2014_Proceedings.pdf (accessed on 21 December 2018).
- Jamali, D.; Sidani, Y.; El-Asmar, K. A three country comparative analysis of managerial CSR perspectives: Insights from Lebanon, Syria and Jordan. J. Bus. Ethics 2009, 85, 173–192. [Google Scholar] [CrossRef]
- Kohonen, T. Self-Organizing Maps, 3rd ed.; Springer: New York, NY, USA, 2001; ISBN 978-3-540-67921-9. [Google Scholar]
- Deboeck, G.; Kohonen, T. Visual Explorations in Finance with Self-Organizing Maps; Springer: London, UK, 1998; ISBN 978-3-540-76266-9. [Google Scholar]
- Wendler, T.; Gröttrup, S. Data Mining with SPSS Modeler: Theory, Exercises and Solutions, 1st ed.; Springer International Publishing: Bern, Switzerland, 2016; ISBN 978-3-319-28707-2. [Google Scholar]
- Larose, D.T.; Larose, C.D. Discovering Knowledge in Data: An Introduction to Data Mining, 2nd ed.; John Wiley & Sons, Inc.: Hoboken, NJ, USA, 2014; ISBN 978-0-470-90874-7. [Google Scholar]
- Tsiptsis, K.K.; Chorianopoulos, A. Data Mining Techniques in CRM: Inside Customer Segmentation, 1st ed.; John Wiley & Sons Ltd.: Chichester, UK, 2009; ISBN 978-0-470-74397-3. [Google Scholar]
- Nisbet, R.; Elder, J.; Miner, G. Handbook of Statistical Analysis and Data Mining Applications, 1st ed.; Elsevier, Academic Press: London, UK, 2009; ISBN 978-0-12-374765-5. [Google Scholar]
- Abbas, O.A. Comparisons between Data Clustering Algorithms. Int. Arab J. Inf. Technol. 2008, 5, 320–325. Available online: https://iajit.org/PDF/vol.5,no.3/15-191.pdf (accessed on 21 May 2019).
- Sarstedt, M.; Mooi, E. A Concise Guide to Market Research: The Process, Data, and Methods Using IBM SPSS Statistics, 3rd ed.; Springer: Heidelberg, Germany, 2019; ISBN 978-3-662-56706-7. [Google Scholar]
- Tkaczynski, A. Segmentation using two-step cluster analysis. In Segmentation in Social Marketing: Process, Methods and Application, 1st ed.; Dietrich, T., Rundle-Thiele, S., Kubacki, K., Eds.; Springer: Singapore, 2017; pp. 109–125. ISBN 978-981-10-1833-6. [Google Scholar]
- Field, A. Discovering Statistics Using IBM SPSS Statistics, 5th ed.; SAGE Publications: London, UK, 2017; ISBN 978-1526436566. [Google Scholar]
- Laerd Statistics. Statistical Tutorials and Software Guides. Available online: https://statistics.laerd.com/ (accessed on 30 March 2019).
- Laerd Statistics. Friedman Test Using SPSS Statistics. Statistical Tutorials and Software Guides. Available online: https://statistics.laerd.com/spss-tutorials/friedman-test-using-spss-statistics.php (accessed on 30 March 2019).
- Laerd Statistics. Kruskal-Wallis H Test Using SPSS Statistics. Statistical Tutorials and Software Guides. Available online: https://statistics.laerd.com/spss-tutorials/kruskal-wallis-h-test-using-spss-statistics.php (accessed on 30 March 2019).
- Laerd Statistics. Sign Test Using SPSS Statistics. Statistical Tutorials and Software Guides. Available online: https://statistics.laerd.com/spss-tutorials/sign-test-using-spss-statistics.php (accessed on 30 March 2019).
- Laerd Statistics. Wilcoxon Signed-Rank Test Using SPSS Statistics. Statistical Tutorials and Software Guides. Available online: https://statistics.laerd.com/spss-tutorials/wilcoxon-signed-rank-test-using-spss-statistics.php (accessed on 30 March 2019).
- Laerd Statistics. Jonckheere-Terpstra Test Using SPSS Statistics. Statistical Tutorials and Software Guides. Available online: https://statistics.laerd.com/spss-tutorials/jonckheere-terpstra-test-using-spss-statistics.php (accessed on 30 March 2019).
- Aguayo, R.; Cañadas, G.R.; Assbaa-Kaddouri, L.; Cañadas-De la Fuente, G.A.; Ramírez-Baena, L.; Ortega-Campos, E. A risk profile of sociodemographic factors in the onset of academic burnout syndrome in a sample of university students. Int. J. Environ. Res. Public Health 2019, 16, 10. [Google Scholar] [CrossRef]
- Gamito, P.S.; Morais, D.G.; Oliveira, J.G.; Brito, R.; Rosa, P.J.; de Matos, M.G. Frequency is not enough: Patterns of use associated with risk of Internet addiction in Portuguese adolescents. Comput. Hum. Behav. 2016, 58, 471–478. [Google Scholar] [CrossRef]
- Lepp, A.; Li, J.; Barkley, J.E.; Salehi-Esfahani, S. Exploring the relationships between college students’ cell phone use, personality and leisure. Comput. Hum. Behav. 2015, 43, 210–219. [Google Scholar] [CrossRef]
- Kissi, D. Sustainability Analysis and Stewardship: Raising The Bar in ESG. An Interview with BNP Paribas Asset Management’s Helena Viñes Fiestas. 13 April 2018. Available online: https://www.garp.org/#!/risk-intelligence/all/all/a1Z1W000003IWVaUAO (accessed on 21 April 2019).


| Indicator | Economic Sector 1 | ||||||||||
|---|---|---|---|---|---|---|---|---|---|---|---|
| BMT | CCS | CNC | ENG | FIN | HLC | IND | TEC | TEL | UTL | TOTAL | |
| No. of ESG reporting companies in the economic sector | 118 | 191 | 78 | 85 | 311 | 84 | 217 | 67 | 46 | 47 | 1244 |
| No. of total listed companies in the economic sector | 1021 | 2004 | 1078 | 503 | 2900 | 772 | 2451 | 1034 | 146 | 390 | 12,299 |
| % of ESG reporting companies in total companies head-quartered in Europe | 11.56 | 9.53 | 7.24 | 16.90 | 10.72 | 10.88 | 8.85 | 6.48 | 31.51 | 12.05 | 10.11 |
| Country 1 | Economic Sector | ||||||||||
|---|---|---|---|---|---|---|---|---|---|---|---|
| BMT | CCS | CNC | ENG | FIN | HLC | IND | TEC | TEL | UTL | Total | |
| AT | 4 | 0 | 0 | 1 | 6 | 0 | 4 | 1 | 1 | 1 | 18 |
| BE | 2 | 1 | 3 | 1 | 7 | 4 | 4 | 2 | 3 | 1 | 28 |
| CH | 7 | 6 | 8 | 1 | 22 | 8 | 15 | 8 | 2 | 1 | 78 |
| CY | 1 | 0 | 0 | 1 | 1 | 0 | 0 | 0 | 0 | 0 | 3 |
| CZ | 0 | 0 | 0 | 0 | 2 | 0 | 0 | 0 | 1 | 1 | 4 |
| DE | 17 | 24 | 4 | 2 | 15 | 11 | 18 | 9 | 5 | 5 | 110 |
| DK | 1 | 2 | 2 | 1 | 6 | 7 | 8 | 1 | 0 | 1 | 29 |
| ES | 2 | 7 | 2 | 4 | 12 | 3 | 8 | 2 | 2 | 6 | 48 |
| FI | 7 | 4 | 2 | 1 | 2 | 1 | 6 | 2 | 2 | 1 | 28 |
| FR | 4 | 24 | 6 | 6 | 16 | 6 | 26 | 8 | 3 | 3 | 102 |
| GI | 0 | 1 | 0 | 0 | 0 | 0 | 0 | 0 | 0 | 0 | 1 |
| GR | 1 | 3 | 1 | 2 | 8 | 0 | 2 | 0 | 1 | 1 | 19 |
| GS | 0 | 0 | 0 | 0 | 13 | 0 | 0 | 0 | 0 | 0 | 13 |
| HU | 0 | 0 | 0 | 1 | 1 | 1 | 0 | 0 | 1 | 0 | 4 |
| IE | 4 | 3 | 4 | 1 | 3 | 1 | 2 | 0 | 0 | 0 | 18 |
| IM | 0 | 1 | 0 | 0 | 0 | 0 | 0 | 1 | 0 | 0 | 2 |
| IT | 1 | 11 | 2 | 4 | 18 | 3 | 5 | 1 | 3 | 7 | 55 |
| JS | 1 | 0 | 0 | 0 | 4 | 0 | 0 | 0 | 0 | 0 | 5 |
| LU | 2 | 2 | 0 | 1 | 3 | 0 | 1 | 0 | 3 | 0 | 12 |
| MT | 0 | 1 | 0 | 0 | 0 | 0 | 0 | 0 | 0 | 0 | 1 |
| NL | 5 | 3 | 4 | 5 | 9 | 2 | 7 | 5 | 3 | 0 | 43 |
| NO | 2 | 1 | 3 | 8 | 4 | 0 | 2 | 0 | 1 | 0 | 21 |
| PL | 2 | 4 | 2 | 4 | 12 | 0 | 2 | 1 | 1 | 4 | 32 |
| PT | 2 | 0 | 2 | 1 | 1 | 0 | 0 | 0 | 2 | 1 | 9 |
| RU | 10 | 0 | 2 | 10 | 5 | 0 | 0 | 0 | 4 | 5 | 36 |
| SE | 8 | 12 | 3 | 1 | 15 | 4 | 22 | 4 | 2 | 0 | 71 |
| UA | 0 | 0 | 1 | 0 | 0 | 0 | 0 | 0 | 0 | 0 | 1 |
| UK | 28 | 72 | 24 | 18 | 116 | 15 | 72 | 16 | 5 | 8 | 374 |
| Total | 111 | 182 | 75 | 74 | 301 | 66 | 204 | 61 | 45 | 46 | 1165 |
| ESG View | Description | Main Components | ESG Categories (No. of Indicators) 1 |
|---|---|---|---|
| ESG Stakeholder Score (ESG.S_S) | categories of stakeholders/beneficiaries that are mainly influenced by the sustainable actions of the organization | ESG Owner Score (ESG.Ow_S) | Management (34) Shareholders (12) |
| ESG Employee Score (ESG.Em_S) | Workforce (29) | ||
| ESG Consumer Score (ESG.Cr_S) | Environmental Innovation (19) Product Responsibility (12) | ||
| ESG Community Score (ESG.Cy_S) | Resource Use (20) Emissions (22) Human Rights (8) Community (14) CSR Strategy (8) | ||
| ESG Perspective Score (ESG.P_S) | direction of impacts exerted by the sustainable actions of the organization | ESG Internal Score (ESG.In_S) | Workforce (29) Management (34) Shareholders (12) CSR Strategy (8) |
| ESG External Score (ESG.Ex_S) | Resource Use (20) Emissions (22) Environmental Innovation (19) Human Rights (8) Community (14) Product Responsibility (12) | ||
| ESG Management Level Score (ESG.ML_S) | hierarchical levels mainly involved in or generating the sustainable actions of the organization | ESG Strategic Score (ESG.St_S) | Community (14) Management (34) CSR Strategy (8) |
| ESG Tactical Score (ESG.Ta_S) | Environmental Innovation (19) Workforce (29) Shareholders (12) | ||
| ESG Operational Score (ESG.Op_S) | Resource Use (20) Emissions (22) Human Rights (8) Product Responsibility (12) | ||
| ESG Focus Score (ESG.F_S) | corporate priorities mainly considered by the sustainable actions of the organization | ESG Process Oriented Score—ESG Technology-Innovation (ESG.Po_S) | Resource Use (20) Emissions (22) Environmental Innovation (19) Product Responsibility (12) |
| ESG Human Oriented Score—ESG Relationship (ESG.Ho_S) | Workforce (29) Human Rights (8) Management (34) Shareholders (12) | ||
| ESG Communication Oriented Score—ESG Image (ESG.Co_S) | Community (14) CSR Strategy (8) Controversies (23) |
| Variable | Min. | Max. | Mean | SD | 25th Q | Median | 75th Q | Skewness | Kurtosis | ||
|---|---|---|---|---|---|---|---|---|---|---|---|
| Stat. | Stat. | Stat. | Stat. | Stat. | Stat. | Stat. | Stat. | S.E. | Stat. | S.E. | |
| ENV_S | 8.91 | 99.43 | 64.89 | 19.69 | 51.79 | 66.19 | 80.79 | −0.41 | 0.07 | −0.50 | 0.14 |
| SOC_S | 4.33 | 98.59 | 62.44 | 19.70 | 48.80 | 64.88 | 77.44 | −0.5 | 0.07 | −0.27 | 0.14 |
| GOV_S | 1.02 | 95.77 | 50.19 | 21.45 | 33.53 | 50.20 | 67.91 | −0.01 | 0.07 | −0.89 | 0.14 |
| ESG_S | 12.85 | 95.75 | 59.53 | 15.98 | 49.06 | 61.23 | 70.95 | −0.39 | 0.07 | −0.28 | 0.14 |
| ESG.Combined_S | 10.24 | 90.56 | 51.05 | 16.05 | 38.76 | 49.07 | 63.68 | 0.21 | 0.07 | −0.74 | 0.14 |
| ESG.Combined_A | 10.24 | 75.86 | 51.96 | 11.86 | 42.57 | 53.55 | 61.62 | −0.30 | 0.07 | −0.72 | 0.14 |
| ESG.Controversies_S | 0.17 | 72.06 | 44.38 | 23.04 | 17.14 | 57.26 | 59.59 | −0.86 | 0.07 | −1.00 | 0.14 |
| Resource.Use_S | 0.08 | 99.83 | 68.01 | 23.08 | 52.06 | 71.83 | 87.44 | −0.58 | 0.07 | −0.56 | 0.14 |
| Emissions_S | 0.28 | 99.92 | 66.60 | 24.39 | 51.13 | 71.11 | 87.03 | −0.72 | 0.07 | −0.27 | 0.14 |
| Environmental.Innovation_S | 0.20 | 99.83 | 59.89 | 26.17 | 37.58 | 61.92 | 84.11 | −0.21 | 0.07 | −1.12 | 0.14 |
| Workforce_S | 0.98 | 99.84 | 67.34 | 23.86 | 51.19 | 71.94 | 87.13 | −0.70 | 0.07 | −0.31 | 0.14 |
| Human.Rights_S | 2.78 | 99.74 | 70.37 | 24.68 | 50.30 | 78.72 | 91.61 | −0.70 | 0.07 | −0.80 | 0.14 |
| Community_S | 0.22 | 99.83 | 50.69 | 30.84 | 23.16 | 49.68 | 79.51 | 0.05 | 0.07 | −1.33 | 0.14 |
| Product.Responsibility_S | 0.22 | 99.82 | 59.56 | 28.90 | 39.08 | 61.18 | 84.40 | −0.38 | 0.07 | −1.06 | 0.14 |
| Management_S | 0.13 | 99.62 | 49.47 | 28.92 | 24.66 | 49.23 | 74.20 | 0.02 | 0.07 | −1.20 | 0.14 |
| Shareholders_S | 0.13 | 99.54 | 51.42 | 29.10 | 25.88 | 51.94 | 77.15 | −0.04 | 0.07 | −1.22 | 0.14 |
| CSR.Strategy_S | 0.97 | 99.80 | 51.31 | 28.26 | 26.32 | 52.78 | 75.00 | −0.07 | 0.07 | −1.20 | 0.14 |
| ESG.Ow_S | 1.02 | 98.93 | 49.98 | 23.57 | 30.95 | 49.28 | 68.65 | 0.01 | 0.07 | −0.97 | 0.14 |
| ESG.Em_S | 0.98 | 99.84 | 67.34 | 23.86 | 51.19 | 71.94 | 87.13 | −0.70 | 0.07 | −0.31 | 0.14 |
| ESG.Cr_S | 4.04 | 99.23 | 59.76 | 21.90 | 42.78 | 60.11 | 77.54 | −0.17 | 0.07 | −0.83 | 0.14 |
| ESG.Cy_S | 7.00 | 97.88 | 62.62 | 19.62 | 49.32 | 65.51 | 78.53 | −0.45 | 0.07 | −0.52 | 0.14 |
| ESG.S_S | 12.72 | 95.77 | 59.62 | 16.02 | 49.14 | 61.35 | 71.12 | −0.40 | 0.07 | −0.28 | 0.14 |
| ESG.In_S | 3.39 | 96.78 | 56.17 | 18.17 | 43.39 | 56.69 | 69.37 | −0.25 | 0.07 | −0.51 | 0.14 |
| ESG.Ex_S | 10.72 | 98.99 | 62.64 | 18.54 | 49.53 | 63.80 | 77.03 | −0.36 | 0.07 | −0.53 | 0.14 |
| ESG.P_S | 12.72 | 95.77 | 59.62 | 16.02 | 49.14 | 61.35 | 71.12 | −0.40 | 0.07 | −0.28 | 0.14 |
| ESG.St_S | 1.11 | 97.74 | 50.04 | 22.60 | 32.31 | 49.91 | 67.77 | −0.01 | 0.07 | −0.86 | 0.14 |
| ESG.Ta_S | 7.46 | 96.78 | 61.80 | 17.14 | 50.14 | 63.74 | 74.14 | −0.43 | 0.07 | −0.21 | 0.14 |
| ESG.Op_S | 5.56 | 99.48 | 66.18 | 19.70 | 52.92 | 69.06 | 81.87 | −0.55 | 0.07 | −0.39 | 0.14 |
| ESG.ML_S | 12.72 | 95.77 | 59.62 | 16.02 | 49.14 | 61.35 | 71.12 | −0.40 | 0.07 | −0.28 | 0.14 |
| ESG.Po_S | 8.78 | 99.48 | 64.08 | 19.00 | 51.05 | 65.51 | 79.30 | −0.41 | 0.07 | −0.46 | 0.14 |
| ESG.Ho_S | 5.32 | 97.02 | 58.01 | 17.98 | 45.58 | 58.61 | 71.70 | −0.25 | 0.07 | −0.53 | 0.14 |
| ESG.Co_S | 3.41 | 83.19 | 47.58 | 14.33 | 38.22 | 46.92 | 57.73 | −0.05 | 0.07 | −0.28 | 0.14 |
| ESG.F_S | 12.75 | 87.05 | 57.88 | 13.61 | 48.84 | 59.38 | 67.59 | −0.41 | 0.07 | −0.28 | 0.14 |
| ESG Risks Exposure (ESG_RE) | No. of Companies | Percent |
|---|---|---|
| 1—Higher exposure to ESG risks (ESG Controversies Score ≤ 25) | 333 | 28.60 |
| 2—Lower exposure to ESG risks (25 < ESG Controversies Score ≤ 50) | 23 | 2.00 |
| 3—No exposure to ESG risks (ESG Controversies Score > 50) | 809 | 69.40 |
| Total | 1165 | 100.00% |
| Country/Territory * of Headquarters | Cluster | |||||
|---|---|---|---|---|---|---|
| Higher ESG | Middle ESG | Lower ESG | ||||
| Count | % Within Country | Count | % Within Country | Count | % Within Country | |
| Austria (AT) | 5 | 27.8 | 10 | 55.6 | 3 | 16.7 |
| Belgium (BE) | 12 | 42.9 | 5 | 17.9 | 11 | 39.3 |
| Switzerland (CH) | 35 | 44.9 | 14 | 17.9 | 29 | 37.2 |
| Cyprus (CY) | 2 | 66.7 | 0 | 0.0 | 1 | 33.3 |
| Czech Republic (CZ) | 1 | 25.0 | 1 | 25.0 | 2 | 50.0 |
| Germany (DE) | 53 | 48.2 | 26 | 23.6 | 31 | 28.2 |
| Denmark (DK) | 11 | 37.9 | 8 | 27.6 | 10 | 34.5 |
| Spain (ES) | 29 | 60.4 | 7 | 14.6 | 12 | 25.0 |
| Finland (FI) | 13 | 46.4 | 13 | 46.4 | 2 | 7.1 |
| France (FR) | 68 | 66.7 | 24 | 23.5 | 10 | 9.8 |
| Gibraltar (GI) * | 0 | 0.0 | 0 | 0.0 | 1 | 100.0 |
| Greece (GR) | 9 | 47.4 | 1 | 5.3 | 9 | 47.4 |
| Guernsey (GS) * | 2 | 15.4 | 2 | 15.4 | 9 | 69.2 |
| Hungary (HU) | 3 | 75.0 | 0 | 0.0 | 1 | 25.0 |
| Ireland (IE) | 4 | 22.2 | 5 | 27.8 | 9 | 50.0 |
| Isle of Man (IM) * | 0 | 0.0 | 0 | 0.0 | 2 | 100.0 |
| Italy (IT) | 24 | 43.6 | 16 | 29.1 | 15 | 27.3 |
| Jersey (JS) * | 0 | 0.0 | 1 | 20.0 | 4 | 80.0 |
| Luxembourg (LU) | 4 | 33.3 | 2 | 16.7 | 6 | 50.0 |
| Malta (MT) | 0 | 0.0 | 0 | 0.0 | 1 | 100.0 |
| Netherlands (NL) | 25 | 58.1 | 5 | 11.6 | 13 | 30.2 |
| Norway (NO) | 9 | 42.9 | 6 | 28.6 | 6 | 28.6 |
| Poland (PL) | 8 | 25.0 | 8 | 25.0 | 16 | 50.0 |
| Portugal (PT) | 6 | 66.7 | 1 | 11.1 | 2 | 22.2 |
| Russia (RU) | 9 | 25.0 | 6 | 16.7 | 21 | 58.3 |
| Sweden (SE) | 37 | 52.1 | 13 | 18.3 | 21 | 29.6 |
| Ukraine (UA) | 0 | 0.0 | 0 | 0.0 | 1 | 100.0 |
| United Kingdom (UK) | 127 | 34.0 | 106 | 28.3 | 141 | 37.7 |
| TOTAL | 496 | 42.58 | 280 | 24.03 | 389 | 33.39 |
| Economic Sector 1 | ||||||||||||
|---|---|---|---|---|---|---|---|---|---|---|---|---|
| BMT | CCS | CNC | ENG | FIN | HLC | IND | TEC | TEL | UTL | TOTAL | ||
| High ESG Cluster | Count | 49 | 79 | 35 | 38 | 120 | 32 | 80 | 22 | 19 | 22 | 496 |
| % within cluster | 9.88 | 15.93 | 7.06 | 7.66 | 24.19 | 6.45 | 16.13 | 4.44 | 3.83 | 4.44 | 100.0 | |
| % within ec. sector | 44.14 | 43.41 | 46.67 | 51.35 | 39.87 | 48.48 | 39.22 | 36.07 | 42.22 | 47.83 | 42.58 | |
| % of total | 4.21 | 6.78 | 3.00 | 3.26 | 10.30 | 2.75 | 6.87 | 1.89 | 1.63 | 1.89 | 42.58 | |
| Middle ESG Cluster | Count | 31 | 45 | 15 | 17 | 52 | 16 | 61 | 21 | 10 | 12 | 280 |
| % within cluster | 11.07 | 16.07 | 5.36 | 6.07 | 18.57 | 5.71 | 21.79 | 7.50 | 3.57 | 4.29 | 100.0 | |
| % within ec. sector | 27.93 | 24.73 | 20.00 | 22.97 | 17.28 | 24.24 | 29.90 | 34.43 | 22.22 | 26.09 | 24.03 | |
| % of total | 2.66 | 3.86 | 1.29 | 1.46 | 4.46 | 1.37 | 5.24 | 1.80 | 0.86 | 1.03 | 24.03 | |
| Low ESG Cluster | Count | 31 | 58 | 25 | 19 | 129 | 18 | 63 | 18 | 16 | 12 | 389 |
| % within cluster | 7.97 | 14.91 | 6.43 | 4.88 | 33.16 | 4.63 | 16.20 | 4.63 | 4.11 | 3.08 | 100.0 | |
| % within ec. sector | 27.93 | 31.87 | 33.33 | 25.68 | 42.86 | 27.27 | 30.88 | 29.51 | 35.56 | 26.09 | 33.39 | |
| % of total | 2.66 | 4.98 | 2.15 | 1.63 | 11.07 | 1.55 | 5.41 | 1.55 | 1.37 | 1.03 | 33.39 | |
| TOTAL | Count | 111 | 182 | 75 | 74 | 301 | 66 | 204 | 61 | 45 | 46 | 1165 |
| % within cluster | 9.53 | 15.62 | 6.44 | 6.35 | 25.84 | 5.67 | 17.51 | 5.24 | 3.86 | 3.95 | 100.0 | |
| % within ec. sector | 100.0 | 100.0 | 100.0 | 100.0 | 100.0 | 100.0 | 100.0 | 100.0 | 100.0 | 100.0 | 100.0 | |
| % of total | 9.53 | 15.62 | 6.44 | 6.35 | 25.84 | 5.67 | 17.51 | 5.24 | 3.86 | 3.95 | 100.0 | |
| Thematic ESG Medians | Lower ESG Cluster | Middle ESG Cluster | Higher ESG Cluster |
|---|---|---|---|
| Community_S | 21.43 | 42.91 | 81.14 |
| Resource.Use_S | 46.67 | 70.86 | 87.62 |
| Emissions_S | 47.12 | 69.69 | 85.63 |
| Environmental.Innovation_S | 41.04 | 58.52 | |
| Workforce_S | 49.14 | 71.83 | |
| Human.Rights_S | 45.37 | 75.81 | 91.55 |
| Product.Responsibility_S | 41.50 | 58.38 | |
| Management_S | 36.08 | ||
| CSR.Strategy_S | 25.60 | 51.44 | 73.53 |
| Resource.Use_S | 46.67 | 70.86 | 87.62 |
| Emissions_S | 47.12 | 69.69 | 85.63 |
| Environmental.Innovation_S | 41.04 | 58.52 | 81.40 |
| Workforce_S | 49.14 | 71.83 | 84.61 |
| Human.Rights_S | 45.37 | 75.81 | 91.55 |
| Product.Responsibility_S | 41.50 | 58.38 | 82.16 |
| Community_S | 81.14 | ||
| Management_S | 36.08 | ||
| Management_S | 36.08 | 48.57 | 60.60 |
| Resource.Use_S | 46.67 | 70.86 | 87.62 |
| Emissions_S | 47.12 | 69.69 | 85.63 |
| Environmental.Innovation_S | 58.52 | 81.40 | |
| Workforce_S | 49.14 | 71.83 | 84.61 |
| Human.Rights_S | 45.37 | 75.81 | 91.55 |
| Community_S | 81.14 | ||
| Product.Responsibility_S | 58.38 | 82.16 | |
| CSR.Strategy_S | 73.53 | ||
| Product.Responsibility_S | 41.50 | 58.38 | 82.16 |
| Resource.Use_S | 46.67 | 70.86 | 87.62 |
| Emissions_S | 47.12 | 69.69 | |
| Workforce_S | 49.14 | 71.83 | |
| Human.Rights_S | 45.37 | 75.81 | 91.55 |
| Environmental.Innovation_S | 41.04 | 58.52 | 81.40 |
| Resource.Use_S | 87.62 | ||
| Emissions_S | 85.63 | ||
| Human.Rights_S | 45.37 | 75.81 | 91.55 |
| Workforce_S | 71.83 | ||
| Workforce_S | 84.61 | ||
| Resource.Use_S | 87.62 | ||
| Human.Rights_S | 91.55 | ||
| Emissions_S | 85.63 | ||
| Human.Rights_S | 91.55 |
| Economic Sector | Resource.Use_S | Emissions_S | Environmental.Innovation_S | Workforce_S | Human.Rights_S | Community_S | Product.Responsibility_S | Management_S | CSR.Strategy_S |
|---|---|---|---|---|---|---|---|---|---|
| Lower ESG Cluster | |||||||||
| BMT | |||||||||
| CCS | |||||||||
| CNC | |||||||||
| ENG | |||||||||
| FIN | |||||||||
| HLC | |||||||||
| IND | |||||||||
| TEC | |||||||||
| TEL | |||||||||
| UTL | |||||||||
| Middle ESG Cluster | |||||||||
| BMT | |||||||||
| CCS | |||||||||
| CNC | |||||||||
| ENG | |||||||||
| FIN | |||||||||
| HLC | |||||||||
| IND | |||||||||
| TEC | |||||||||
| TEL | |||||||||
| UTL | |||||||||
| Higher ESG Cluster | |||||||||
| BMT | |||||||||
| CCS | |||||||||
| CNC | |||||||||
| ENG | |||||||||
| FIN | |||||||||
| HLC | |||||||||
| IND | |||||||||
| TEC | |||||||||
| TEL | |||||||||
| UTL | |||||||||
| Legend | ≤Q1 | >Q1 and ≤Q2 | >Q2 and ≤Q3 | >Q3 | |||||
| View | Cluster | ||
|---|---|---|---|
| Lower ESG | Middle ESG | Higher ESG | |
| Stakeholder View | 33% | 24% | 43% |
| Perspective View | 34% | 23% | 43% |
| Management Level View | 34% | 23% | 43% |
| Focus View | 35% | 24% | 41% |
© 2019 by the authors. Licensee MDPI, Basel, Switzerland. This article is an open access article distributed under the terms and conditions of the Creative Commons Attribution (CC BY) license (http://creativecommons.org/licenses/by/4.0/).
Share and Cite
Iamandi, I.-E.; Constantin, L.-G.; Munteanu, S.M.; Cernat-Gruici, B. Mapping the ESG Behavior of European Companies. A Holistic Kohonen Approach. Sustainability 2019, 11, 3276. https://doi.org/10.3390/su11123276
Iamandi I-E, Constantin L-G, Munteanu SM, Cernat-Gruici B. Mapping the ESG Behavior of European Companies. A Holistic Kohonen Approach. Sustainability. 2019; 11(12):3276. https://doi.org/10.3390/su11123276
Chicago/Turabian StyleIamandi, Irina-Eugenia, Laura-Gabriela Constantin, Sebastian Madalin Munteanu, and Bogdan Cernat-Gruici. 2019. "Mapping the ESG Behavior of European Companies. A Holistic Kohonen Approach" Sustainability 11, no. 12: 3276. https://doi.org/10.3390/su11123276
APA StyleIamandi, I.-E., Constantin, L.-G., Munteanu, S. M., & Cernat-Gruici, B. (2019). Mapping the ESG Behavior of European Companies. A Holistic Kohonen Approach. Sustainability, 11(12), 3276. https://doi.org/10.3390/su11123276