Article

Urbanization Effects on Human-Perceived Temperature Changes in the North China Plain

1
School of Geography and Tourism, Shaanxi Normal University, Xi’an 710119, China
2
Key Laboratory of Water Cycle & Related Land Surface Processes, Institute of Geographical Sciences and Natural Resources Research, Chinese Academy of Sciences, Beijing 100101, China
*
Authors to whom correspondence should be addressed.
Sustainability 2019, 11(12), 3413; https://doi.org/10.3390/su11123413
Submission received: 3 June 2019 / Revised: 17 June 2019 / Accepted: 19 June 2019 / Published: 21 June 2019

Abstract

:
Urbanization and associated land use changes significantly alter the energy and radiation balance, land surface characteristics, and regional climates, posing challenges to natural ecosystems and human society. The combined effects of changes in air temperature (T), relative humidity (RH), and wind speed (WS) profoundly influence human-perceived temperature and the corresponding human thermal comfort, especially in urban areas with large population. This study analyzes the spatiotemporal changes in human-perceived temperatures in the North China Plain, represented by heat index (HI) in summer and wind chill temperature (WCT) in winter, and quantifies the effects of urbanization on temperature changes, based on the observational data of 56 meteorological stations during 1976–2016. The results show a significant warming trend, with human-perceived temperatures increasing faster than T. The warming trend in WCT is higher than that in HI, indicating more thermal discomfort in summer and more thermal comfort in winter. However, the warming trend moderately slows after 1996, partly due to the global surface warming hiatus. Urban areas experience stronger warming trends than non-urban areas, demonstrating the notable effects of urbanization. For the entire study area, urbanization and associated urban land expansion accelerate the increase in HI by 26% and the increase in WCT by 17%.

1. Introduction

Human beings are currently experiencing an unprecedented rate of urbanization and population growth [1,2,3]. Today, 55% of the global population lives in urban area, and this number is predicted to reach 68% by 2050 [4]. In the context of global warming and rapid urban expansion, people are facing rising hazards of extreme climate events, including heat waves, cold events, droughts, storms, and floods [5]. Among all the factors, extreme temperatures are strongly related to human health [6,7,8]. For example, heat extremes can lead to symptoms such as skin rashes, heat cramps, heat syncope, and heat stroke [9,10], while cold extremes may cause hypothermia, musculoskeletal disorder, numbness, and frostbite [8,11]. Extreme hot or cold events pose threats to humans, especially outdoor workers, women, children, the elderly, and persons with chronic disease [6,12,13]. Compared to suburban and rural areas, urban areas with dense population are prone to more serious threats induced by temperature [1,14,15].
Numerous studies have demonstrated rising heat events and declining cold events across the world during the past few decades, and such adverse changes have proven to be closely related to urbanization [1,2,16,17]. Typically, urbanization magnifies the urban heat island (UHI) effect, as indicated by a higher temperature in urban areas than in surrounding or rural areas [2,18,19]. The main causes for UHI are associated with the differences in the surface energy and radiation between urban areas and rural areas due to alterations by construction and structures [16,18]. Generally, urban surfaces absorb more solar radiation than the countryside due to the lower albedo of urban materials and greater radiation retention of buildings, concrete pavements, and asphalt surfaces [20,21]. In addition, due to the conversion of humid and vegetated covered soils to impervious surfaces, the absorbed solar radiation is converted to sensible rather than latent heat, further intensifying the heating effect [18,22]. Moreover, urban buildings and streets increase surface roughness and reduce wind speed (WS), thus restricting air convection for cooling [10,23]. Additionally, cities release more heat than rural areas from human activities, such as the combustion of fossil fuel for transportation, industrial manufacturing, and indoor heating or cooling [18]. With the increased greenhouse gas emissions and intense land use changes of urbanization, solar radiation budgets in urban ecosystems will change and further influence human thermal comfort.
Human-perceived temperature, also known as apparent temperature, is the equivalent temperature felt by the human body [24,25,26]. Unlike air temperature (T) alone, human-perceived temperature simultaneously describes the combined effects of T, humidity, and WS [27,28]. Recent studies have shown that such combined effects play great roles in human thermal comfort, depending on whether the human-perceived temperature exceeds a threshold for human adaptability [26,29,30,31]. For example, in hot summers, high humidity inhibits the evaporation of sweat from skin to the environment and thus exacerbates heat stress for humans, but a high WS facilitates heat dissipation by convective cooling and thereby mitigates the heat threat [10]. In cold winters, high wind velocity can quickly weaken the heat storage of the human body and markedly worsen the degree of coldness felt by people [13,32]. In recent years, evidence has shown that apparent temperatures affect the mortality and morbidity of human cardiopulmonary, cardiovascular, and respiratory diseases [33,34,35]. Meanwhile, to alleviate human discomfort to extreme temperatures, the consumption of natural resources (e.g., fossil fuels for heating and air-conditioning) and subsequent economic costs are also raised [36,37]. Under global warming and rapid urbanization, extreme temperatures are expected to occur more frequently, which may cause negative impacts on thermal comfort and human health. Thus, changes in the thermal comfort of humans, especially in hot summer and cold winter conditions, need further investigation.
China has the largest population in the world and has experienced unprecedented economic development and urban expansion since the reform and opening-up policy implemented in the late 1970s. Large-scale land use/cover change (LUCC) and urban construction exert considerable influences on local climate change and extreme events [27,38,39,40]. This effect is particularly strong in highly developed regions or megacities with a large population. The North China Plain (NCP) is the heartland of China and has important political, cultural, and economic functions. The NCP is also one of the most densely populated and urbanized regions in China; thus, the temperature stress on dwellers within this region tends to increase under global warming and anthropogenic disturbances. Compared with the widespread studies on air/surface temperatures and their extremes in natural systems [41,42,43], relatively less attention has been paid to the combined effects of temperature, humidity, and WS in this region. Furthermore, variations in human-perceived temperatures have not been explored in detail, and their responses to urbanization remain unclear [26,42].
A good understanding of temperature changes under global change and urbanization is of great importance for climate change adaptation and city sustainability. Therefore, the aim of this study is to investigate the changes in human-perceived temperature and their response to urbanization in the NCP over the past four decades. The remaining text is organized as follows. First, the study area, temperature indicators, data source and methods are described in Section 2. Section 3 reveals the characteristics of spatiotemporal changes of the heat index (HI) and wind chill temperature (WCT) over the NCP, and urbanization effects (UE) on human-perceived temperature changes are quantified and discussed. Finally, a conclusion is presented in Section 4.

2. Materials and Methods

2.1. Study Area

The NCP (32~41°N and 113~121°E) is located in the lower reaches of the Yellow, Huai, and Hai Rivers in China, including all or part of 7 provinces and municipalities (Beijing, Tianjin, Hebei, Shandong, Anhui, Jiangsu, and Henan). It is the largest alluvial plain of China, covering an area of 400,000 km2 (Figure 1), most of which is less than 50 meters above sea level. It is dominated by warm temperate monsoon, with a mean annual air temperature of 8~15 °C and mean annual rainfall of 500~1000 mm occurring mostly in summer (June, July, and August). As the political, economic, and cultural center of China, the NCP, with a population of over 407 million people, has become one of the most densely populated regions in China and even across the world. Urban expansion and population growth have influenced regional climate and land surface conditions, and have subsequently resulted in a series of environmental issues, such as heat waves, water security issues,, and haze [38,42].

2.2. Definition of Human-Perceived Temperatures

HI in summer [24] and WCT in winter [25] are chosen as indicators of human-perceived temperatures, representing the equivalent temperature perceived by humans in heat-humid and cold-windy conditions, respectively. All the indicators used in this study are listed in Table 1.
HI is based on air temperature (T) and relative humidity (RH), which is calculated as follows:
H I = 42.379 + 2.04901523 × T + 10.14333127 × R H 0.22475541 × T × R H 6.83783 × 10 3 × T 2 5.481717 × 10 2 × R H 2 + 1.22874 × 10 3 × T 2 × R H + 8.5282 × 10 4 × T × R H 2 1.99 × 10 6 × T 2 × R H 2
where T is air temperature (°F) and RH is relative humidity (%). The unit conversion from °F to °C is executed.
WCT is based on T and WS, and the equations for calculating WCT vary at high and low WSs. When the WS is higher than 5 km/h, WCT is calculated as:
W C T = 13.12 + 0.6215 × T 11.37 × W S 0.16 + 0.3965 × T × W S 0.16
And when the WS is lower than 5 km/h, WCT is computed as [44]:
W C T = T + 1.59 + 0.1345 T 5 × W S
where T is the air temperature (°C) and WS is the wind speed (km/h).

2.3. Data Sources

Three types of data are used in this study, namely, geographical, meteorological, and socioeconomic data. The geographical data are used to acquire the geo-location and basic information of the study area. The meteorological data are used to analyze the spatiotemporal changes of temperature indicators. The socioeconomic data are used to distinguish the urban region and non-urban region within the study area.
The geographical data contain the locations of meteorological stations, the spatial scope of the study area and the urban area, and land use/cover change (LUCC) mapping. The urban area data in 2013 with a shapefile format is obtained from the Baruch College in City University of New York (https://www.baruch.cuny.edu/confluence/display/geoportal/ESRI+International+Data). LUCC data is obtained from the Resource and Environment Data Cloud Platform of the Chinese Academy of Science, produced by Xu, et al. [45]. Herein, data at the late 1980s, 1990, 1995, 2000, 2010 and 2015 are selected, with a spatial resolution of 1 km. The urban area extent and urban land of the NCP are extracted from these data.
The meteorological data, including daily mean T, daily mean RH, and daily mean WS, were acquired from the National Climatic Center of the China Meteorological Administration (http://data.cma.cn/). Observational data during 1976–2017 for two seasons (i.e., winter and summer) are collected in this study; winter comprises December, January, and February, while summer comprises June, July, and August. To avoid unnecessary errors caused by data quality, stations with over 5% missing records are excluded, and other missing data are interpolated through the error correction method based on surrounding stations. The surrounding stations are selected based on a standard within a searching radius less than 20 km. To avoid plausible effect of terrain, stations with elevation over 500 m are excluded. Finally, observational data at 56 meteorological stations are selected.
The socioeconomic data mainly refer to demographic data, which contain statistical data and spatial distribution grid data. The city demographic data are collected from the Statistical Yearbook 2016 of Beijing, Tianjin, Hebei, Shandong, Anhui, Jiangsu, and Henan, issued by the National Bureau of Statistics of China. Yearbooks are obtained from the China Economic and Social Development Statistics Database of the National Knowledge Infrastructure (http://tongji.cnki.net/kns55/Navi/NaviDefault.aspx). The population mapping in 2015 at a spatial resolution of 1 km is obtained from the Resource and Environment Data Cloud Platform of the Chinese Academy of Science, produced by Xu [46]. These data are used to distinguish urban and non-urban areas in the NCP, combined with the urban area data.

2.4. Methods

All the meteorological data used in this study are processed as regional average values through arithmetic average. The linear trends of long-term mean temperature indicators are calculated by simple linear regression. The statistical significance of trends is evaluated by the modified Mann–Kendall test [47]. The urbanization effects on temperatures is estimated through three steps. First, urban stations are selected following two criteria: urban areas with population over 250,000 and stations located within radius less than 20 km from the urban areas [1,14]. Then, the other stations are classified as non-urban stations. Second, the regional average values of temperature indicators in urban and non-urban areas are calculated by averaging all urban and non-urban stations over the whole study region. Finally, the urbanization effect (UE) is expressed as the difference of temperature trends between urban and non-urban areas, and the urbanization contribution (UC) is evaluated as the ratio of UE to the temperature trends in urban areas [17].

3. Results and Discussion

3.1. Spatial Distribution of Changes in Temperatures

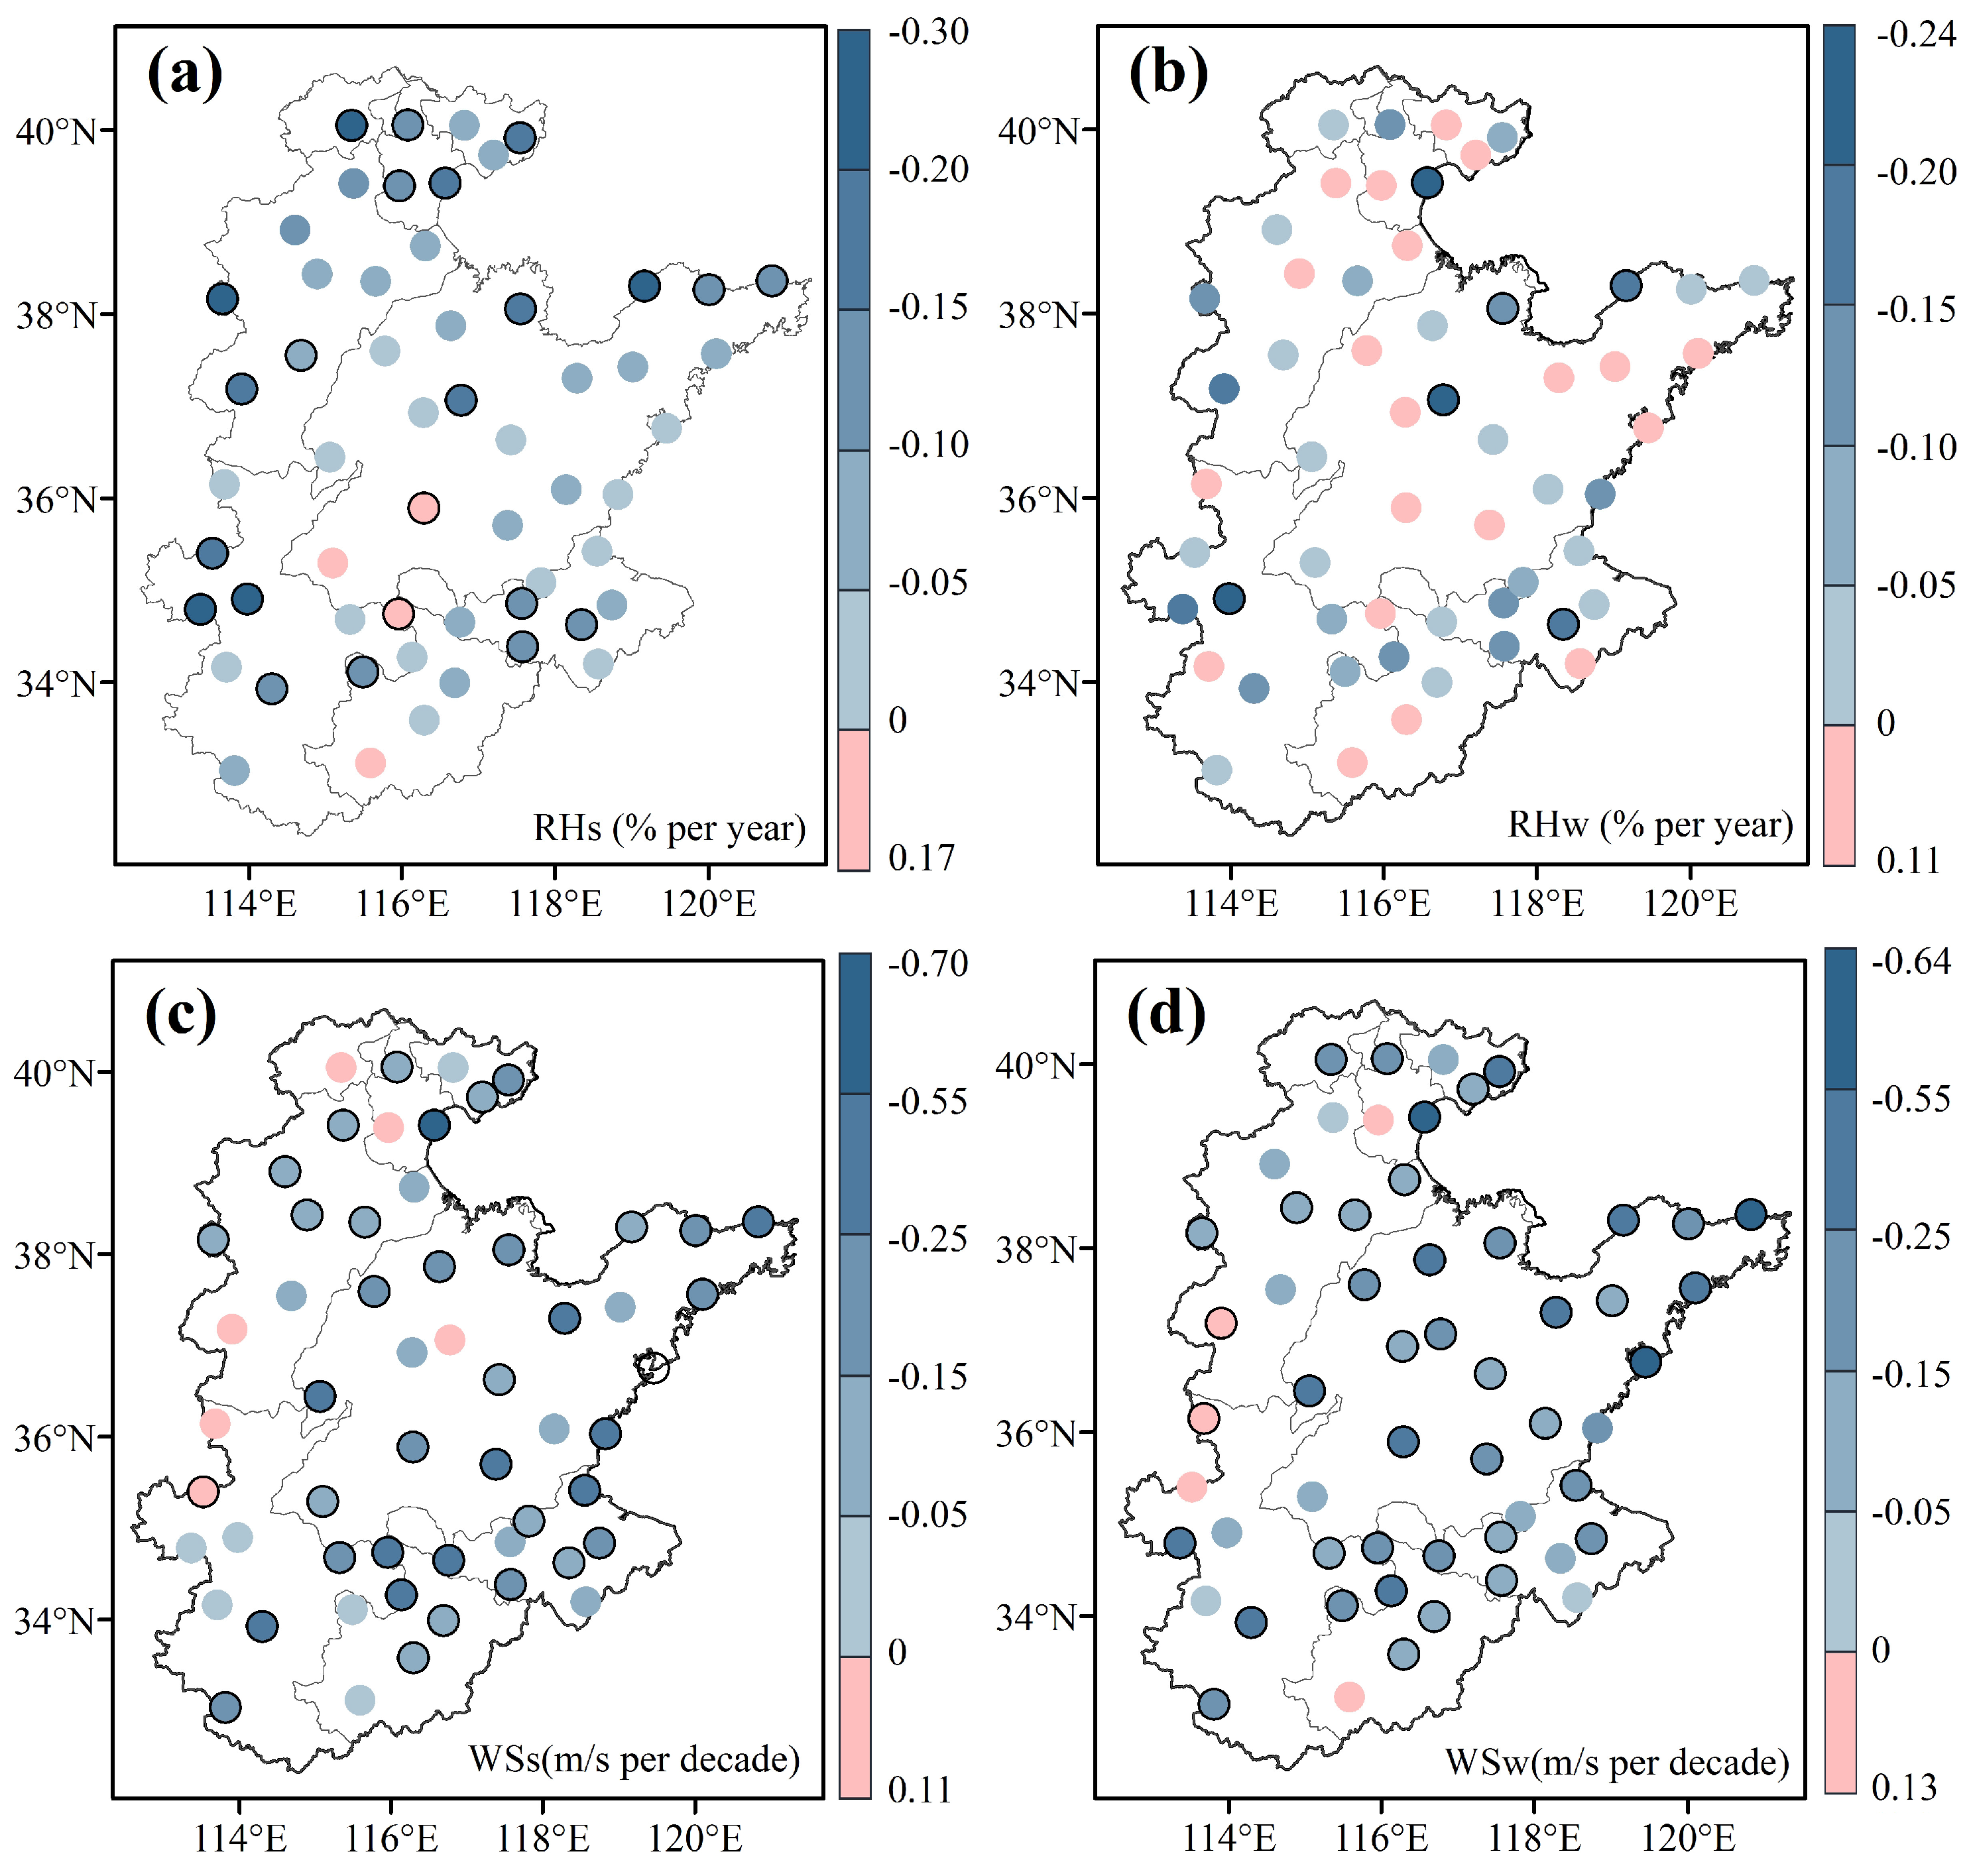
Figure 2 shows the spatial distribution of the trends in the summer HI, winter WCT, and corresponding T in the NCP during 1976–2016. Almost all the stations (i.e., 98.2% for HI, 94.6% for summer T, 98.2% for WCT, and 100% for winter T) show positive trends in the different temperature indicators, and most of these trends are statistically significant at the 5% level. The increasing trend in HI (0.35 °C per decade) is larger than that in T (0.25 °C per decade), suggesting that heat stress perceived by humans increases faster than the actual air temperature. This result is consistent with the findings of Luo and Lau [27] who reported stronger increasing trend in human-perceived heat stress than in air temperature across eastern China. According to the relationship between HI, T, and RH, HI increases as T or RH increases. During the period of 1976–2016, RH in summer shows a decreasing trend (−0.96% per decade) in most parts of the NCP (Figure 3a). Thus, it is obvious that increasing T is the dominant factor in HI increments, whereas declining RH exerts negative effects on HI changes.
In winter, WCT increases in most regions, displaying a similar spatial pattern as summer HI, but the magnitude of the WCT trend is much higher than that of the HI trend (Figure 2a,c), with a maximum value (1.20 °C per decade) two times greater than the largest HI value (0.65 °C per decade). This indicates that human-perceived temperatures increase more rapidly in winter than in summer. This finding is in accordance with previous research in different regions of China [17,28,41]. This phenomenon may be attributed to two reasons. On the one hand, the increasing trend in T is much larger in winter than in summer (Figure 2b,d), which is the primary cause for the higher increasing trend in WCT than in HI. On the other hand, due to the negative relationship between WCT and WS, declines in WS help store energy and intensify the warming effect in winter (Figure 3d). Such declines in WS are partly because large-scale urban constructions such as buildings and streets increase the surface roughness and block air flow. Furthermore, increases in black carbon aerosols from the combustion of fossil fuels for transportation, industry, and domestic uses alter cloud structure and the thermal contrast between land and sea, which results in a decreasing WS of the East Asian winter monsoon over the NCP [38,48]. The warming trends are prominent in densely populated and highly urbanized areas, such as the Beijing–Tianjin–Hebei (BTH) region and eastern coastal regions (Figure 2a). This indicates that people residing in these areas suffer more heat stress and less wind chill than in other places, and urbanization plays an important role in the warming.
At sub-regional scales, the long-term mean annual temperatures show obvious spatial heterogeneity, especially between the northern part and the southern part of the study area (Figure A1). To better explore the changes in temperatures and their responses to environmental factors over different land surface conditions and climate patterns, we further divide the study area into two parts (north and south) by the boundary of 35°N. Table 2 shows the trends of regional mean temperature and climate indicators over the whole study area, the north part and the south part. In summer, both HI and T show a higher increasing trend in the north (0.39 and 0.29 °C per decade respectively) than in the south (0.32 and 0.22 °C per decade respectively), while RH shows stronger decreasing trend in the north (−1.03% per decade) than in the south (−0.89% per decade). Increasing T has positive effects on the increase in HI, but decreasing RH offsets part of the warming trend, implying that the spatial pattern of HI is dominated by changes in T. This finding is consistent with previous studies [49,50]. The higher warming trend in the north is partly ascribed to the more rapid urbanization process in the north (31%) than in the south (16%), despite the generally higher level of urbanization in the south than in the north (Figure A2). In winter, T shows almost the same increasing trend in the north (0.42 °C per decade) and in the south (0.43 °C per decade), whereas WS shows a stronger decreasing trend in the north (−0.20 m/s per decade) than in the south (−0.16 m/s per decade). This indicates that the spatial distribution of WCT is dominated by WS, though the general trend of WCT is under the combined effects of T and WS. These results suggest that the urbanization effects on increasing T in winter are not as significant as that in summer.

3.2. Temporal Evolution of Regional Mean Temperature

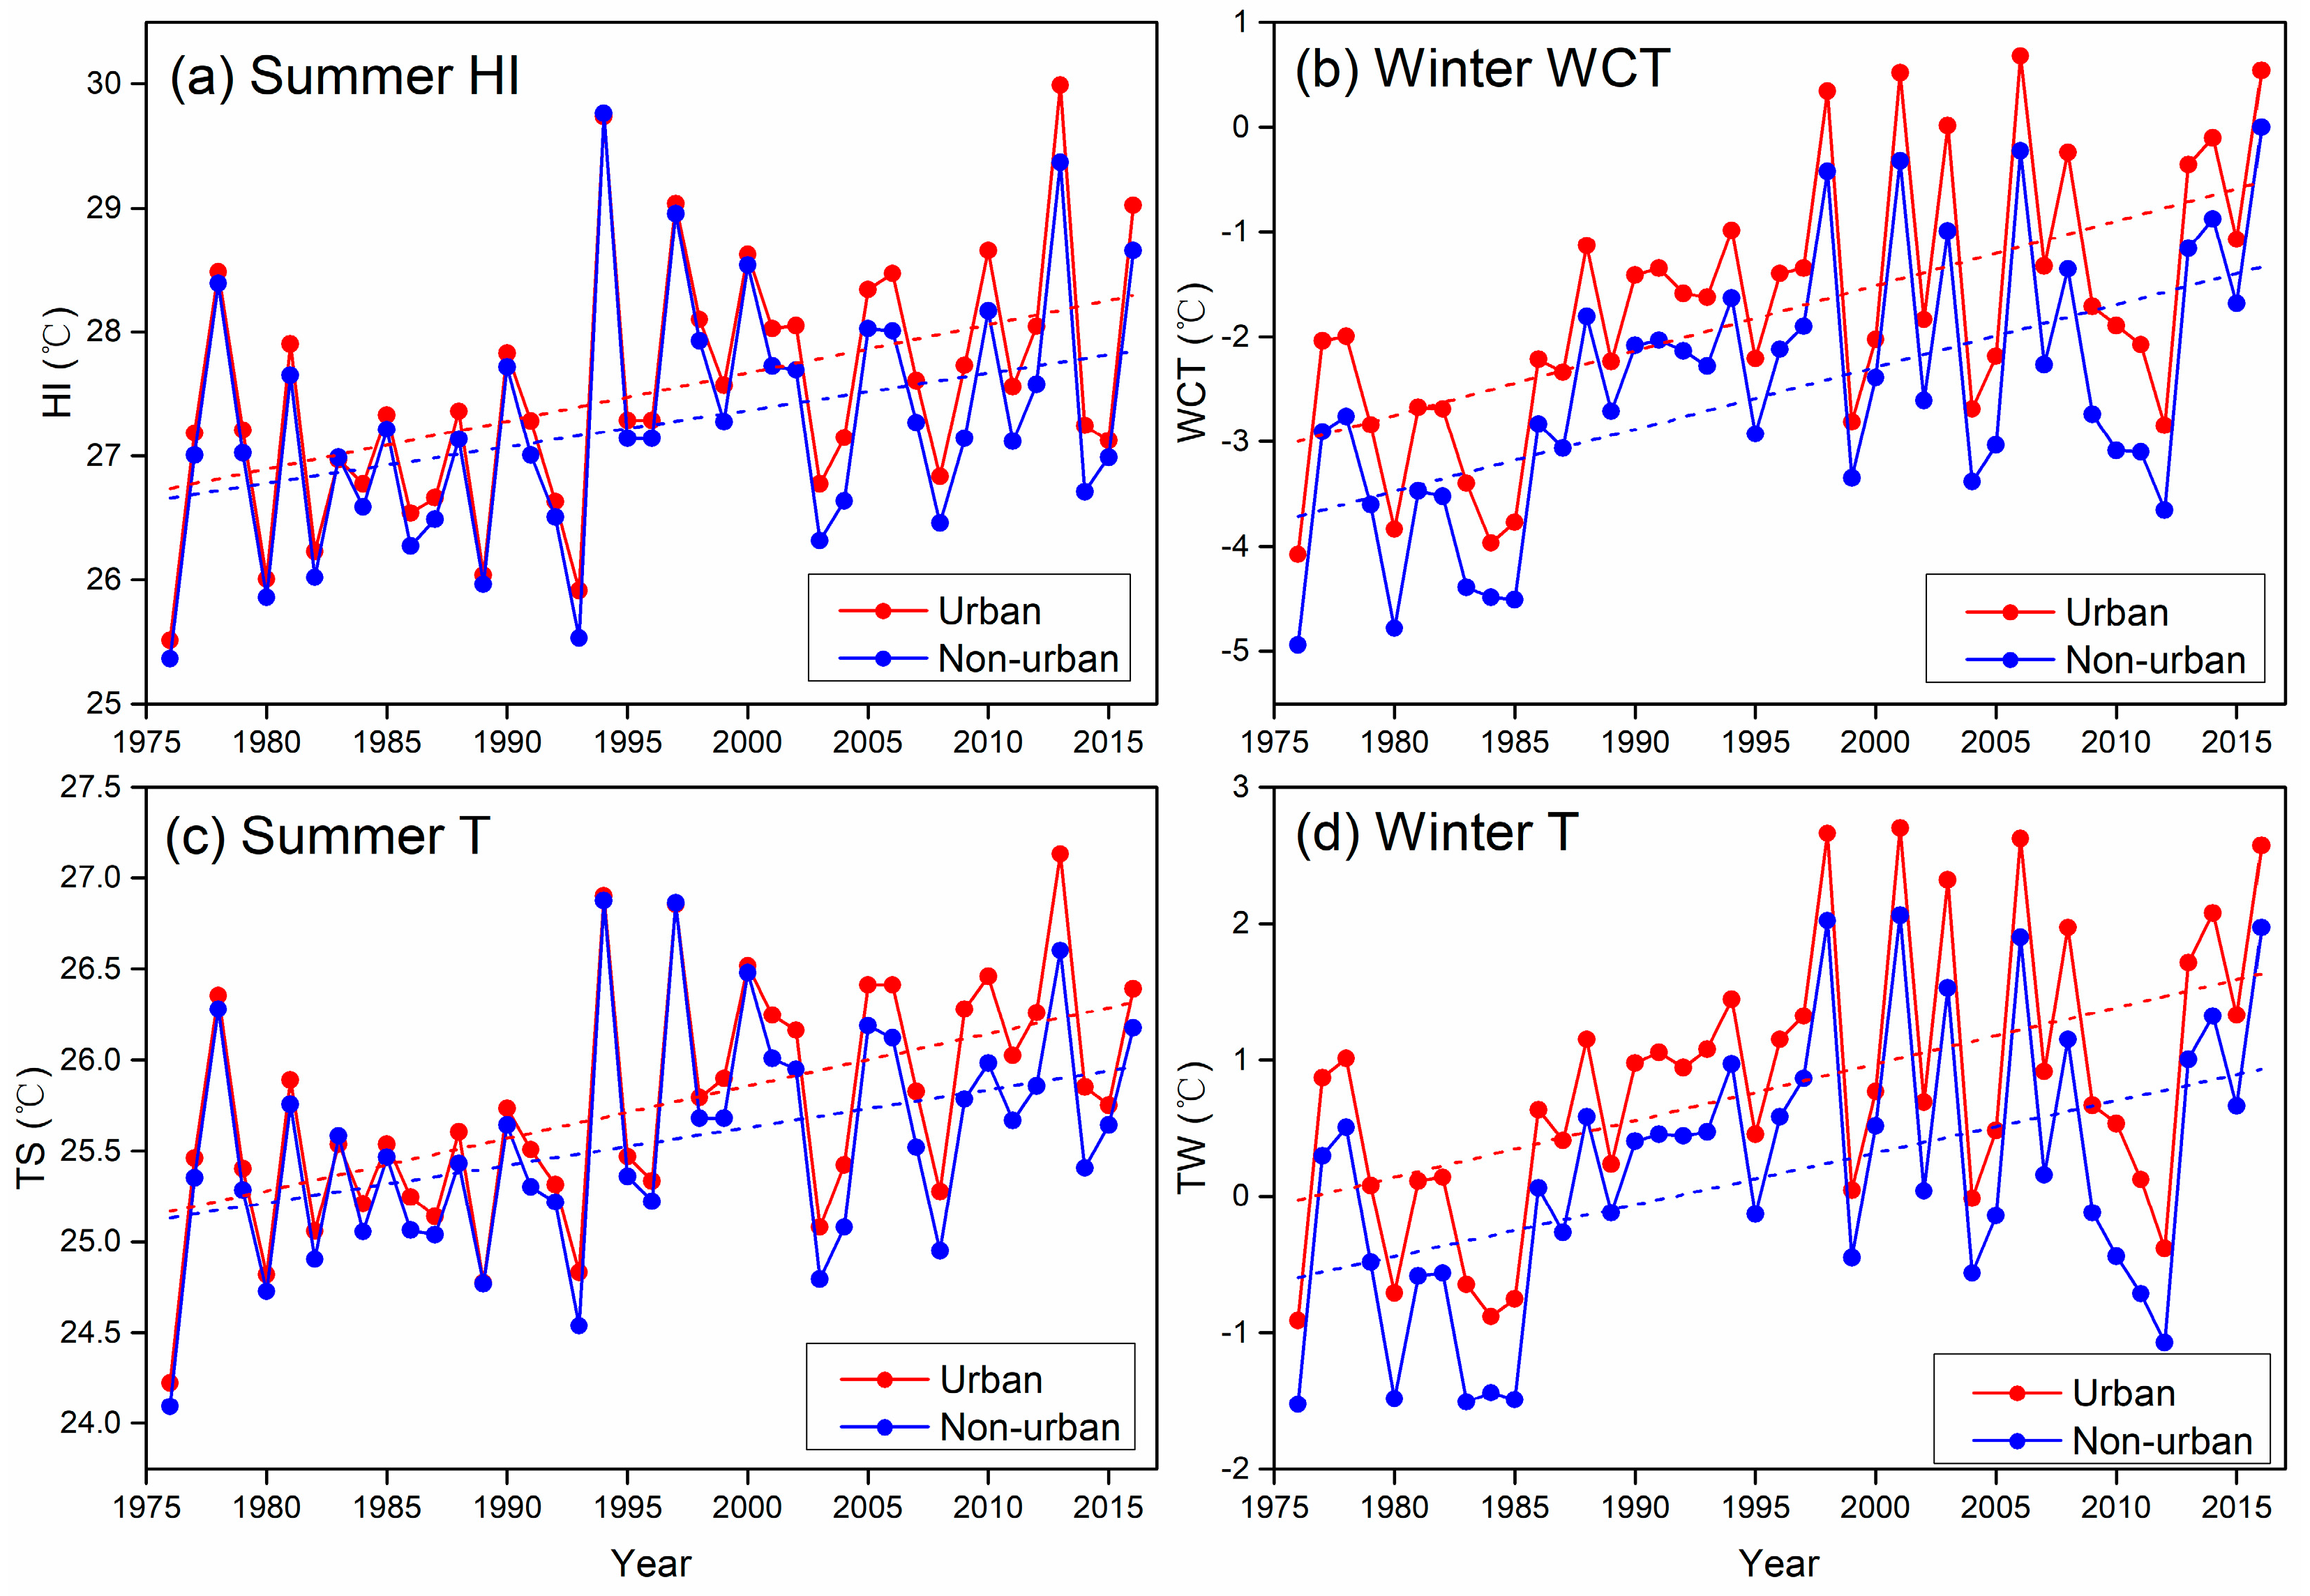
The evolution of temperature indicators during 1976–2016 in the NCP is depicted in Figure 4. For the entire study area, the human-perceived temperatures of both HI and WCT show a significantly increasing trend, despite interannual fluctuations. This trend is mainly ascribable to increasing T and decreasing WS, which has been noted by previous studies [31,51]. Such a decline in surface WS is connected to both monsoonal weakening and the changes in surface roughness due to LUCC [51,52]. Compared to the overwhelming effect of rising temperature, the offsetting effect of the long-lasting decrease in RH on heat stress is considerably small [53]. As a result, this warming trend leads to more comfortable thermal conditions in winter but less comfortable thermal conditions in summer. The interannual changing patterns of temperatures over urban and non-urban areas are roughly similar, though urban areas are subjected to higher warming trends than non-urban areas in both summer and winter (Table 2). This implies that urbanization intensifies heat stress and abates wind chill, causing more thermal discomfort in summer and less discomfort in winter on the human body. The additional warming trend in urban regions is dominated by UHI and heat release from intense human activities.
The rough increments in HI and WCT are controlled by increasing T, but notably, the temporal changes in T experience two stages, i.e., 1976–1995 (period-1) and 1996–2016 (period-2). T in both summer and winter show a slightly lower increasing trend in period-2 than in period-1 (Table A1), implying that the warming process has decelerated to some extent during the past two decades. This slowdown in warming may become a typical component of the recent global surface warming hiatus [54,55,56]. Xie, Huang, and Liu [54] confirmed the robust warming hiatus in China during 1998–2013, and further found that the recent warming hiatus is mainly induced by changes in atmospheric circulation. The circulation variations are opposite between the two sub-periods. The westerly wind that prevents the invasion of cold air from the Arctic to northern China is enhanced during period-1 and weakened during period-2, leading to the previous accelerated warming and the recent warming hiatus, as Figure 4 shows.
Overall, people experience gradually increasing thermal discomfort in summer and decreasing thermal discomfort in winter during 1976–2016, especially in urban areas. In spite of the warming trend at a long-term scale, extreme temperature events still exist and tend to occur more frequently in the future, which may raise acute threats for public health [57,58]. Therefore, the mechanism of changes in human-perceived temperatures requires further exploration.

3.3. Urbanization Effect and its Implications

In this section, we quantify the UE on changes in human-perceived temperature. In summer, the HI values in urban and non-urban areas demonstrate an increasing trend of 0.40 and 0.30 °C per decade over the whole NCP, respectively (Table 2). This suggests that urbanization leads to an additional warming in HI of 0.10 °C per decade, which is responsible for 26% of the total warming trend. Previous studies have reported consistent results that urbanization contributes to 21~30% of increasing heat stress in urban areas of eastern China [27]. For WCT, urbanization induces a surplus warming of 0.12 °C per decade (Table 2), which accounts for 17% of the total temperature change. These results indicate that urbanization plays a greater role in human-perceived temperature changes in summer than in winter, which is in accordance with previous research [41]. Notably the UC to temperature changes displays a regional divergence (Table 2). Compared with the UC to the increase of HI/WCT in the north part (1%/10%), the south part is subjected to a greater UC of 49%/25%.
Previous research has identified two main representative indicators of urbanization: LUCC and CO2 concentration increases [2,59]. Aerosol forcing, black carbon concentrations, and corresponding energy distributions are phenomenon more likely occur at the global scale than at the regional scale. Herein, we focus on human-induced land use changes, which is helpful for understanding the mechanism of warming at the regional scale. China has experienced unprecedented urban constructions such as buildings, highways, bridges, and other infrastructures over the past four decades [60], which have considerably influenced land surface conditions and subsequently the local climate. As a typical indicator of urbanization, urban land variations imply changing demands in both public and domestic areas, such as household and industrial purposes [61]. In this study, we use urban area (UA) to explore the response of temperature changes to LUCC induced by urbanization in the NCP.
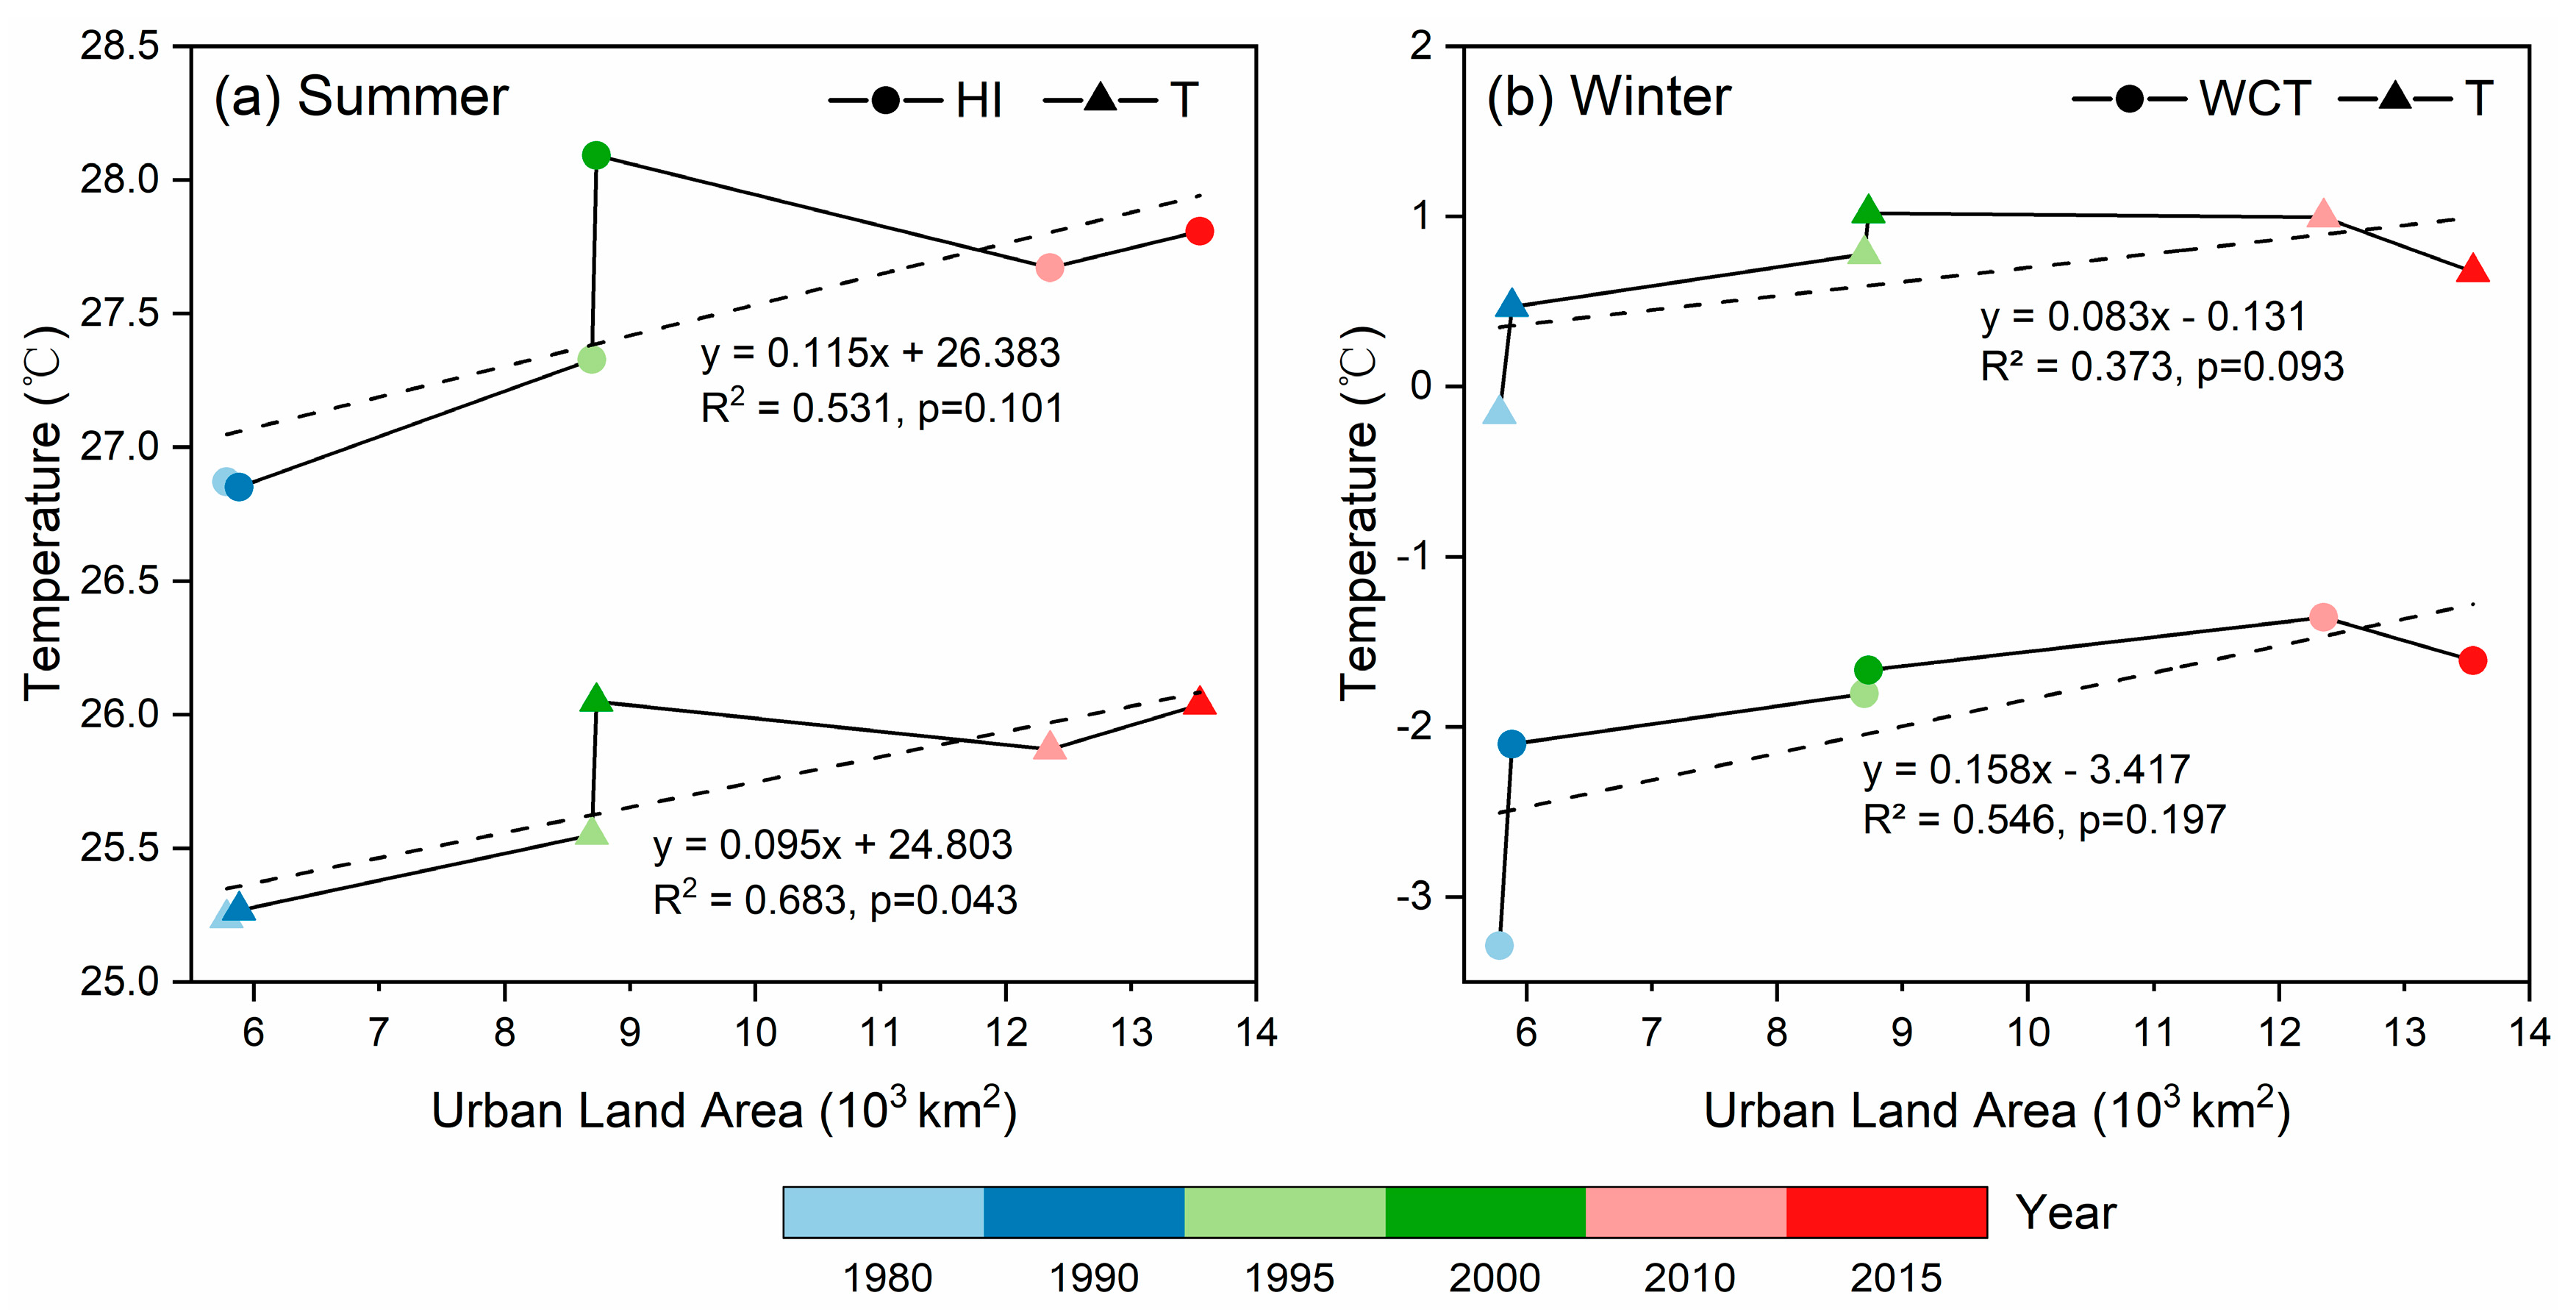
Figure 5 shows the linear relationship between the UA of the NCP and human-perceived temperatures. Although slight differences of the relationships exist between summer and winter, HI and WCT both increase with increasing UA from the late 1980s to the mid-2020s. The correlation coefficients between UA and the two indicators are 0.729 and 0.739, respectively, which implies that urban expansion plays a positive role in temperature increase. However, temperature reaches the peak in the late 2000 with UA changes and slightly decreases since then, which may be attributed to the alleviating effect of the warming hiatus since 1998 [54,55]. Apart from urban land expansion, urban population growth and intense anthropogenic activities also accelerate the warming trend in the NCP. For example, Kang and Eltahir [42] projected that the combined effects of climate change and agricultural irrigation activities are likely to exacerbate the summer heat threat in the NCP. Lou, et al. [38] noted that black carbon produced by burning coal for heating in winter could alter the land-sea thermal contrast and then weaken the wind strength of the East Asian winter monsoon, thereby finally amplifying the warming trend in the NCP.
Although the results above show that urbanization has considerably positive influences on the warming trend in the NCP, the actual conditions may be more complex, especially at the local scales for specific places, districts, or cities. For instance, some artificial natural systems within cities, such as urban wetlands [62], green roofs on buildings [63], and green spaces like parks and gardens [64], are designed to have cooing effects on urban heat. To mitigate future warming trends and enhance the resilience of humans to heat stress, more nature-based solutions, represented by green and blue constructions, should be implemented by decision-makers in urban planning. There are also some uncertainties in this study. First, the classified criteria of urban and non-urban stations may lead to discrepancies in the responses of temperatures to urbanization. The criteria are subjective for different regions, concerning searching radius, population number, and urban size [1,14]. Moreover, the number of stations, data quality and data availability could affect the precision of the evaluation results. To obtain more accurate results, high-resolution datasets with enhanced data quality should be applied in future research.

4. Conclusions

Global warming and urbanization significantly alter land surface conditions and climate patterns at regional scales. The combined effects of changes in temperature, humidity, wind speed, and other environmental factors profoundly influence human-perceived temperatures, which are closely related to thermal comfort and human health. In this study, we explore the spatiotemporal changes in human-perceived temperatures (i.e., HI and WCT), and quantify the UE on these changes in the NCP. The results can assist the government and policy makers in mitigating climate change and promoting sustainability of the social-economic-natural ecosystem. Conclusions can be drawn as follows.
  • During 1976–2016, all temperature indicators show significantly increasing trends over the whole study area, among which HI and WCT show higher warming trends than T, indicating that human-perceived temperatures increase faster than T. The warming trend in winter is higher than that in summer.
  • Human-perceived temperatures show higher increasing trends in urban areas than in non-urban areas, implying more thermal discomfort in summer and slightly more thermal comfort in winter, especially in urban areas. The warming trends in period-2 (1996–2016) are lower than those in period-1 (1976–1995), partly due to the global surface warming hiatus.
  • For the entire study area, 26% of the increase in HI and 17% of the increase in WCT are attributed to urbanization and associated urban land expansion. The UE is much larger in the south than in the north, divided by the boundary of 35°N.

Author Contributions

F.W. collected the data, conducted the analyses, and wrote the original draft; K.D. designed the study and provided funding. L.Z. helped in reviewing and editing the manuscript. All authors reviewed the manuscript.

Funding

This research was funded by the National Natural Science Foundation of China (41771030, 41890822), the Strategic Priority Research Program of the Chinese Academy of Sciences (XDA23040304) and the Fundamental Research Funds for the Central Universities (GK201802004).

Conflicts of Interest

The authors declare no conflict of interest.

Appendix A

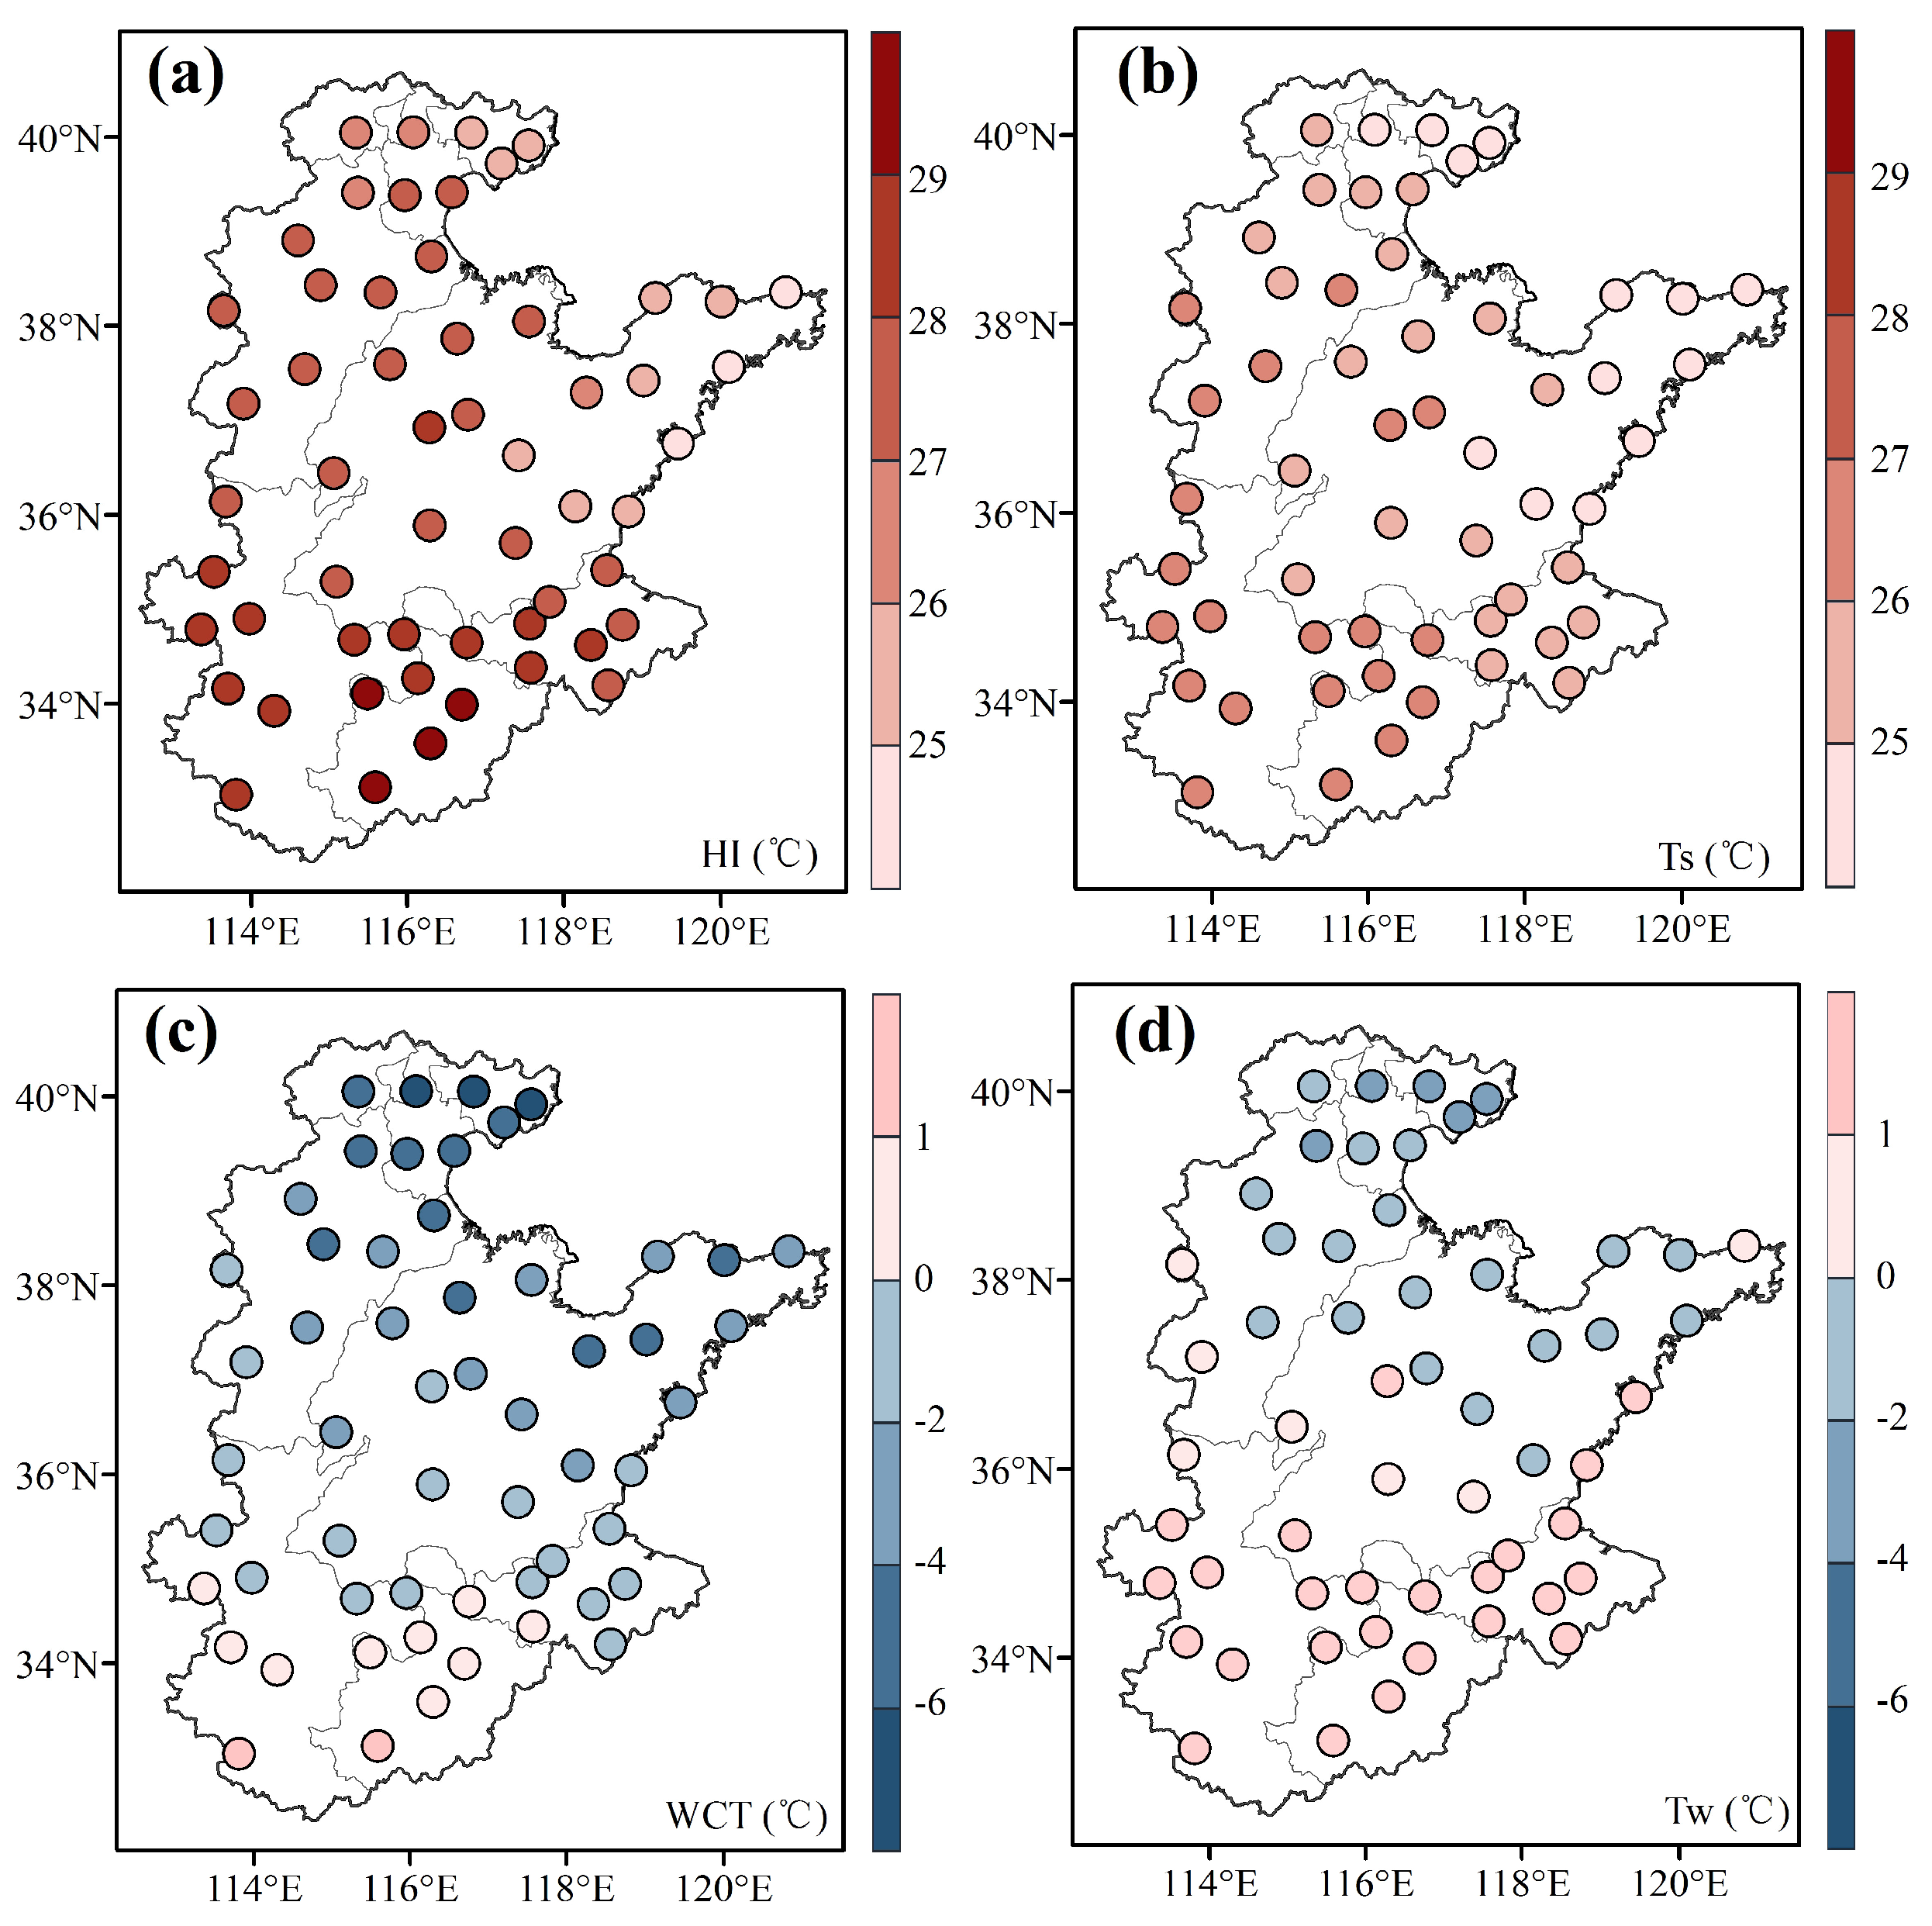
Figure A1. Spatial pattern of long-term mean annual values of the (a) heat index (HI); (b) air temperature in summer (Ts); (c) wind chill temperature (WCT); and (d) air temperature in winter (Tw). Black circle denotes significant at the 5% significance level. The dark-gray lines denote the provincial boundaries.
Sustainability 11 03413 g0a1
Figure A2. Spatial pattern of urban land (in red) over the NCP in (a) 1980s and (b) 2015. The dark-gray lines denote the provincial boundaries. (c) The percentage of urban area in the total land over the north part and south part (divided by the boundary of 35°N). The first two paired columns denote the percentage of urban area in 1980s and 2015, respectively; and the third one denotes the relative changes of the increment in urban area percentage from 1980s to 2015. This increment only represents the conversion of non-urban land into urban lands during the study period.
Sustainability 11 03413 g0a2
Table A1. Trends of the regional mean temperature (°C per decade)/humidity (% per decade)/wind indicators (m/s per decade) for urban and non-urban stations during 1976–2016.
Sub-PeriodHITsWCTTwRHsWSw
Period-10.300.181.050.670.43−0.31
Period-20.070.100.22−0.03−1.27−0.28
Note: HI and WCT represent heat index and wind chill temperature; Ts and Tw represent air temperature in summer and winter; RHs and WSw represent relative humidity in summer and wind speed in winter. Bold denotes significant at the 5% significance level.

References

  1. Mishra, V.; Ganguly, A.R.; Nijssen, B.; Lettenmaier, D.P. Changes in observed climate extremes in global urban areas. Environ. Res. Lett. 2015, 10, 024005. [Google Scholar] [CrossRef]
  2. Kalnay, E.; Cai, M. Impact of urbanization and land-use change on climate. Nature 2003, 423, 528–531. [Google Scholar] [CrossRef]
  3. Birch, E.L.; Wachter, S.M. (Eds.) Global Urbanization; University of Pennsylvania Press: Philadelphia, PA, USA, 2011. [Google Scholar] [CrossRef]
  4. United Nations Department of Public Information. World Urbanization Prospects 2018; UN Department of Public Information: New York, NY, USA, 2018. [Google Scholar]
  5. Rosenzweig, C.; Solecki, W.D.; Romero-Lankao, P.; Mehrotra, S.; Dhakal, S.; Ibrahim, S.A. Climate Change and Cities: Second Assessment Report of the Urban Climate Change Research Network; Cambridge University Press: Cambridge, UK, 2018. [Google Scholar]
  6. Patz, J.A.; Campbell-Lendrum, D.; Holloway, T.; Foley, J.A. Impact of regional climate change on human health. Nature 2005, 438, 310–317. [Google Scholar] [CrossRef] [PubMed]
  7. Barnett, A.G.; Hajat, S.; Gasparrini, A.; Rocklöv, J. Cold and heat waves in the United States. Environ. Res. 2012, 112, 218–224. [Google Scholar] [CrossRef] [PubMed] [Green Version]
  8. Pienimaki, T. Cold exposure and musculoskeletal disorders and diseases. A review. Int. J. Circumpolar Health 2002, 61, 173–182. [Google Scholar] [CrossRef] [PubMed]
  9. Kovats, R.S.; Hajat, S. Heat stress and public health: A critical review. Annu. Rev. Public Health 2008, 29, 41–55. [Google Scholar] [CrossRef] [PubMed]
  10. Christina, K.; Kovats, R.S.; Bettina, M.; Gerd, J. Heat-Waves: Risks and Responses; World Health Organization, Regional Office for Europe: Copenhagen, Denmark, 2004. [Google Scholar]
  11. Holmér, I. Evaluation of cold workplaces: An overview of standards for assessment of cold stress. Ind. Health 2009, 47, 228–234. [Google Scholar] [CrossRef] [PubMed]
  12. McMichael, A.J.; Woodruff, R.E.; Hales, S. Climate change and human health: Present and future risks. Lancet 2006, 367, 859–869. [Google Scholar] [CrossRef]
  13. Castellani, J.W.; Young, A.J. Human physiological responses to cold exposure: Acute responses and acclimatization to prolonged exposure. Auton. Neurosci. 2016, 196, 63–74. [Google Scholar] [CrossRef] [Green Version]
  14. Jin, K.; Wang, F.; Chen, D.; Jiao, Q.; Xia, L.; Fleskens, L.; Mu, X. Assessment of urban effect on observed warming trends during 1955–2012 over China: A case of 45 cities. Clim. Chang. 2015, 132, 631–643. [Google Scholar] [CrossRef]
  15. Ye, H.; Huang, Z.; Huang, L.; Lin, L.; Luo, M. Effects of urbanization on increasing heat risks in South China. Int. J. Climatol. 2018, 38, 5551–5562. [Google Scholar] [CrossRef]
  16. Li, J.; Song, C.; Cao, L.; Zhu, F.; Meng, X.; Wu, J. Impacts of landscape structure on surface urban heat islands: A case study of Shanghai, China. Remote Sens. Environ. 2011, 115, 3249–3263. [Google Scholar] [CrossRef]
  17. Ren, G.; Zhou, Y. Urbanization Effect on Trends of Extreme Temperature Indices of National Stations over Mainland China, 1961–2008. J. Clim. 2014, 27, 2340–2360. [Google Scholar] [CrossRef]
  18. Oke, T.R. The energetic basis of the urban heat island. Q. J. R. Meteorol. Soc. 1982, 108, 1–24. [Google Scholar] [CrossRef]
  19. Oleson, K.W.; Anderson, G.B.; Jones, B.; McGinnis, S.A.; Sanderson, B. Avoided climate impacts of urban and rural heat and cold waves over the U.S. using large climate model ensembles for RCP8.5 and RCP4.5. Clim. Chang. 2018, 146, 377–392. [Google Scholar] [CrossRef] [PubMed]
  20. Werner, H.T.; Stella, S.-F.L. Solar radiation and urban heat islands. Ann. Assoc. Am. Geogr. 1973, 63, 181–207. [Google Scholar]
  21. Ramamurthy, P.; Bou-Zeid, E. Contribution of impervious surfaces to urban evaporation. Water Resour. Res. 2014, 50, 2889–2902. [Google Scholar] [CrossRef]
  22. Yuan, F.; Bauer, M.E. Comparison of impervious surface area and normalized difference vegetation index as indicators of surface urban heat island effects in Landsat imagery. Remote Sens. Environ. 2007, 106, 375–386. [Google Scholar] [CrossRef]
  23. Stewart, I.D.; Oke, T.R. Local Climate Zones for Urban Temperature Studies. Bull. Am. Meteorol. Soc. 2012, 93, 1879–1900. [Google Scholar] [CrossRef]
  24. Rothfusz, L.P. The Heat Index Equation (or, More Than You ever Wanted to Know about Heat Index); National Oceanic and Atmospheric Administration, National Weather Service, Office of Meteorology: Fort Worth, TX, USA, 1990.
  25. Osczevski, R.J. The basis of wind chill. Arctic 1995, 48, 372–382. [Google Scholar] [CrossRef]
  26. Li, J.; Chen, Y.D.; Gan, T.Y.; Lau, N.-C. Elevated increases in human-perceived temperature under climate warming. Nat. Clim. Chang. 2018, 8, 43–47. [Google Scholar] [CrossRef]
  27. Luo, M.; Lau, N.C. Increasing Heat Stress in Urban Areas of Eastern China: Acceleration by Urbanization. Geophys. Res. Lett. 2018. [Google Scholar] [CrossRef]
  28. Feng, S.; Gong, D.; Zhang, Z.; He, X.; Guo, D.; Lei, Y. Wind-chill temperature changes in winter over China during the last 50 years. Acta Geogr. Sin. 2009, 64, 1071–1082. [Google Scholar]
  29. Pal, J.S.; Eltahir, E.A.B. Future temperature in southwest Asia projected to exceed a threshold for human adaptability. Nat. Clim. Chang. 2015, 6, 197–200. [Google Scholar] [CrossRef]
  30. Willett, K.M.; Sherwood, S. Exceedance of heat index thresholds for 15 regions under a warming climate using the wet-bulb globe temperature. Int. J. Climatol. 2012, 32, 161–177. [Google Scholar] [CrossRef]
  31. Wang, Y.; Chen, L.; Song, Z.; Huang, Z.; Ge, E.; Lin, L.; Luo, M. Human-perceived temperature changes over South China: Long-term trends and urbanization effects. Atmos. Res. 2019, 215, 116–127. [Google Scholar] [CrossRef]
  32. Carder, M.; McNamee, R.; Beverland, I.; Elton, R.; Cohen, G.R.; Boyd, J.; Agius, R.M. The lagged effect of cold temperature and wind chill on cardiorespiratory mortality in Scotland. Occup. Environ. Med. 2005, 62, 702–710. [Google Scholar] [CrossRef] [Green Version]
  33. Liu, L.; Breitner, S.; Pan, X.; Franck, U.; Leitte, A.M.; Wiedensohler, A.; von Klot, S.; Wichmann, H.-E.; Peters, A.; Schneider, A. Associations between air temperature and cardio-respiratory mortality in the urban area of Beijing, China: A time-series analysis. Environ. Health 2011, 10, 51. [Google Scholar] [CrossRef]
  34. Guo, Y.; Barnett, A.G.; Pan, X.; Yu, W.; Tong, S. The impact of temperature on mortality in Tianjin, China: A case-crossover design with a distributed lag nonlinear model. Environ. Health Perspect. 2011, 119, 1719–1725. [Google Scholar] [CrossRef]
  35. Tian, Z.; Li, S.; Zhang, J.; Jaakkola, J.J.; Guo, Y. Ambient temperature and coronary heart disease mortality in Beijing, China: A time series study. Environ. Health 2012, 11, 56. [Google Scholar] [CrossRef]
  36. Desideri, U.; Proietti, S.; Sdringola, P. Solar-powered cooling systems: Technical and economic analysis on industrial refrigeration and air-conditioning applications. Appl. Energy 2009, 86, 1376–1386. [Google Scholar] [CrossRef]
  37. Rezaie, B.; Rosen, M.A. District heating and cooling: Review of technology and potential enhancements. Appl. Energy 2012, 93, 2–10. [Google Scholar] [CrossRef]
  38. Lou, S.; Yang, Y.; Wang, H.; Smith, S.J.; Qian, Y.; Rasch, P.J. Black Carbon Amplifies Haze Over the North China Plain by Weakening the East Asian Winter Monsoon. Geophys. Res. Lett. 2019, 46, 452–460. [Google Scholar] [CrossRef] [Green Version]
  39. Yang, X.; Ruby Leung, L.; Zhao, N.; Zhao, C.; Qian, Y.; Hu, K.; Liu, X.; Chen, B. Contribution of urbanization to the increase of extreme heat events in an urban agglomeration in east China. Geophys. Res. Lett. 2017, 44, 6940–6950. [Google Scholar] [CrossRef]
  40. Sun, Y.; Zhang, X.; Ren, G.; Zwiers, F.W.; Hu, T. Contribution of urbanization to warming in China. Nat. Clim. Chang. 2016, 6, 706–709. [Google Scholar] [CrossRef]
  41. Bian, T.; Ren, G.; Yue, Y. Effect of Urbanization on Land-Surface Temperature at an Urban Climate Station in North China. Bound. Layer Meteorol. 2017, 165, 553–567. [Google Scholar] [CrossRef]
  42. Kang, S.; Eltahir, E.A.B. North China Plain threatened by deadly heatwaves due to climate change and irrigation. Nat. Commun. 2018, 9, 2894. [Google Scholar] [CrossRef] [PubMed]
  43. Wei, B.; Xie, Y.; Jia, X.; Wang, X.; He, H.; Xue, X. Land use/land cover change and it’s impacts on diurnal temperature range over the agricultural pastoral ecotone of Northern China. Land Degrad. Dev. 2018, 29, 3009–3020. [Google Scholar] [CrossRef]
  44. Mekis, É.; Vincent, L.A.; Shephard, M.W.; Zhang, X. Observed Trends in Severe Weather Conditions Based on Humidex, Wind Chill, and Heavy Rainfall Events in Canada for 1953–2012. Atmos. Ocean 2015, 53, 383–397. [Google Scholar] [CrossRef]
  45. Xu, X.; Liu, J.; Zhang, S.; Li, R.; Yan, C.; Wu, S. China’s Multi-Period Land Use Land Cover Remote Sensing Monitoring Dataset (CNLUCC); Chinese Academy of Sciences Resource and Environmental Science Data Center Data Registration and Publishing System: Beijing, China, 2018. [Google Scholar]
  46. Xu, X. China Population Spatial Distribution Kilometer Grid Dataset; Data Registration and Publishing System of the Resource and Environmental Science Data Center of the Chinese Academy of Sciences: Beijing, China, 2017. [Google Scholar]
  47. Hamed, K.H.; Rao, A.R. A modified Mann-Kendall trend test for autocorrelated data. J. Hydrol. 1998, 204, 182–196. [Google Scholar] [CrossRef]
  48. Bond, T.C.; Doherty, S.J.; Fahey, D.W.; Forster, P.M.; Berntsen, T.; DeAngelo, B.J.; Flanner, M.G.; Ghan, S.; Kärcher, B.; Koch, D.; et al. Bounding the role of black carbon in the climate system: A scientific assessment. J. Geophys. Res. Atmos. 2013, 118, 5380–5552. [Google Scholar] [CrossRef]
  49. Liu, B.; Xu, M.; Henderson, M.; Qi, Y.; Li, Y. Taking China’s temperature: Daily range, warming trends, and regional variations, 1955–2000. J. Clim. 2004, 17, 4453–4462. [Google Scholar] [CrossRef]
  50. Xu, M.; Chang, C.-P.; Fu, C.; Qi, Y.; Robock, A.; Robinson, D.; Zhang, H.-M. Steady decline of east Asian monsoon winds, 1969–2000: Evidence from direct ground measurements of wind speed. J. Geophys. Res. 2006, 111. [Google Scholar] [CrossRef]
  51. Wu, J.; Zha, J.; Zhao, D.; Yang, Q. Changes in terrestrial near-surface wind speed and their possible causes: An overview. Clim. Dyn. 2017, 51, 2039–2078. [Google Scholar] [CrossRef]
  52. Huang, R.; Chen, J.; Wang, L.; Lin, Z. Characteristics, processes, and causes of the spatio-temporal variabilities of the East Asian monsoon system. Adv. Atmos. Sci. 2012, 29, 910–942. [Google Scholar] [CrossRef]
  53. Wu, J.; Gao, X.; Giorgi, F.; Chen, D. Changes of effective temperature and cold/hot days in late decades over China based on a high resolution gridded observation dataset. Int. J. Climatol. 2017, 37, 788–800. [Google Scholar] [CrossRef]
  54. Xie, Y.; Huang, J.; Liu, Y. From accelerated warming to warming hiatus in China. Int. J. Climatol. 2017, 37, 1758–1773. [Google Scholar] [CrossRef]
  55. Li, Q.; Yang, S.; Xu, W.; Wang, X.L.; Jones, P.; Parker, D.; Zhou, L.; Feng, Y.; Gao, Y. China experiencing the recent warming hiatus. Geophys. Res. Lett. 2015, 42, 889–898. [Google Scholar] [CrossRef]
  56. Intergovernmental Panel on Climate Change (IPCC). Climate Change 2013: The Physical Science Basis. In Contribution of Working Group I to the Fifth Assessment Report of the Intergovernmental Panel on Climate Change; Cambridge University Press: Cambridge, UK; New York, NY, USA, 2013. [Google Scholar]
  57. Horton, D.E.; Johnson, N.C.; Singh, D.; Swain, D.L.; Rajaratnam, B.; Diffenbaugh, N.S. Contribution of changes in atmospheric circulation patterns to extreme temperature trends. Nature 2015, 522, 465–469. [Google Scholar] [CrossRef] [Green Version]
  58. Wang, L.; Chen, W. A CMIP5 multimodel projection of future temperature, precipitation, and climatological drought in China. Int. J. Climatol. 2014, 34, 2059–2078. [Google Scholar] [CrossRef]
  59. Kühn, T.; Partanen, A.I.; Laakso, A.; Lu, Z.; Bergman, T.; Mikkonen, S.; Kokkola, H.; Korhonen, H.; Räisänen, P.; Streets, D.G.; et al. Climate impacts of changing aerosol emissions since 1996. Geophys. Res. Lett. 2014, 41, 4711–4718. [Google Scholar] [CrossRef]
  60. Xu, J.; Ding, L. A review of metro construction in China: Organization, market, cost, safety and schedule. Front. Eng. Manag. 2017, 4. [Google Scholar] [CrossRef]
  61. Grimm, N.B.; Faeth, S.H.; Golubiewski, N.E.; Redman, C.L.; Wu, J.; Bai, X.; Briggs, J.M. Global change and the ecology of cities. Science 2008, 319, 756–760. [Google Scholar] [CrossRef]
  62. Xue, Z.; Hou, G.; Zhang, Z.; Lyu, X.; Jiang, M.; Zou, Y.; Shen, X.; Wang, J.; Liu, X. Quantifying the cooling-effects of urban and peri-urban wetlands using remote sensing data: Case study of cities of Northeast China. Landsc. Urban Plan. 2019, 182, 92–100. [Google Scholar] [CrossRef]
  63. Susca, T.; Gaffin, S.R.; Dell’osso, G.R. Positive effects of vegetation: Urban heat island and green roofs. Environ. Pollut. 2011, 159, 2119–2126. [Google Scholar] [CrossRef] [PubMed]
  64. Oliveira, S.; Andrade, H.; Vaz, T. The cooling effect of green spaces as a contribution to the mitigation of urban heat: A case study in Lisbon. Build. Environ. 2011, 46, 2186–2194. [Google Scholar] [CrossRef]
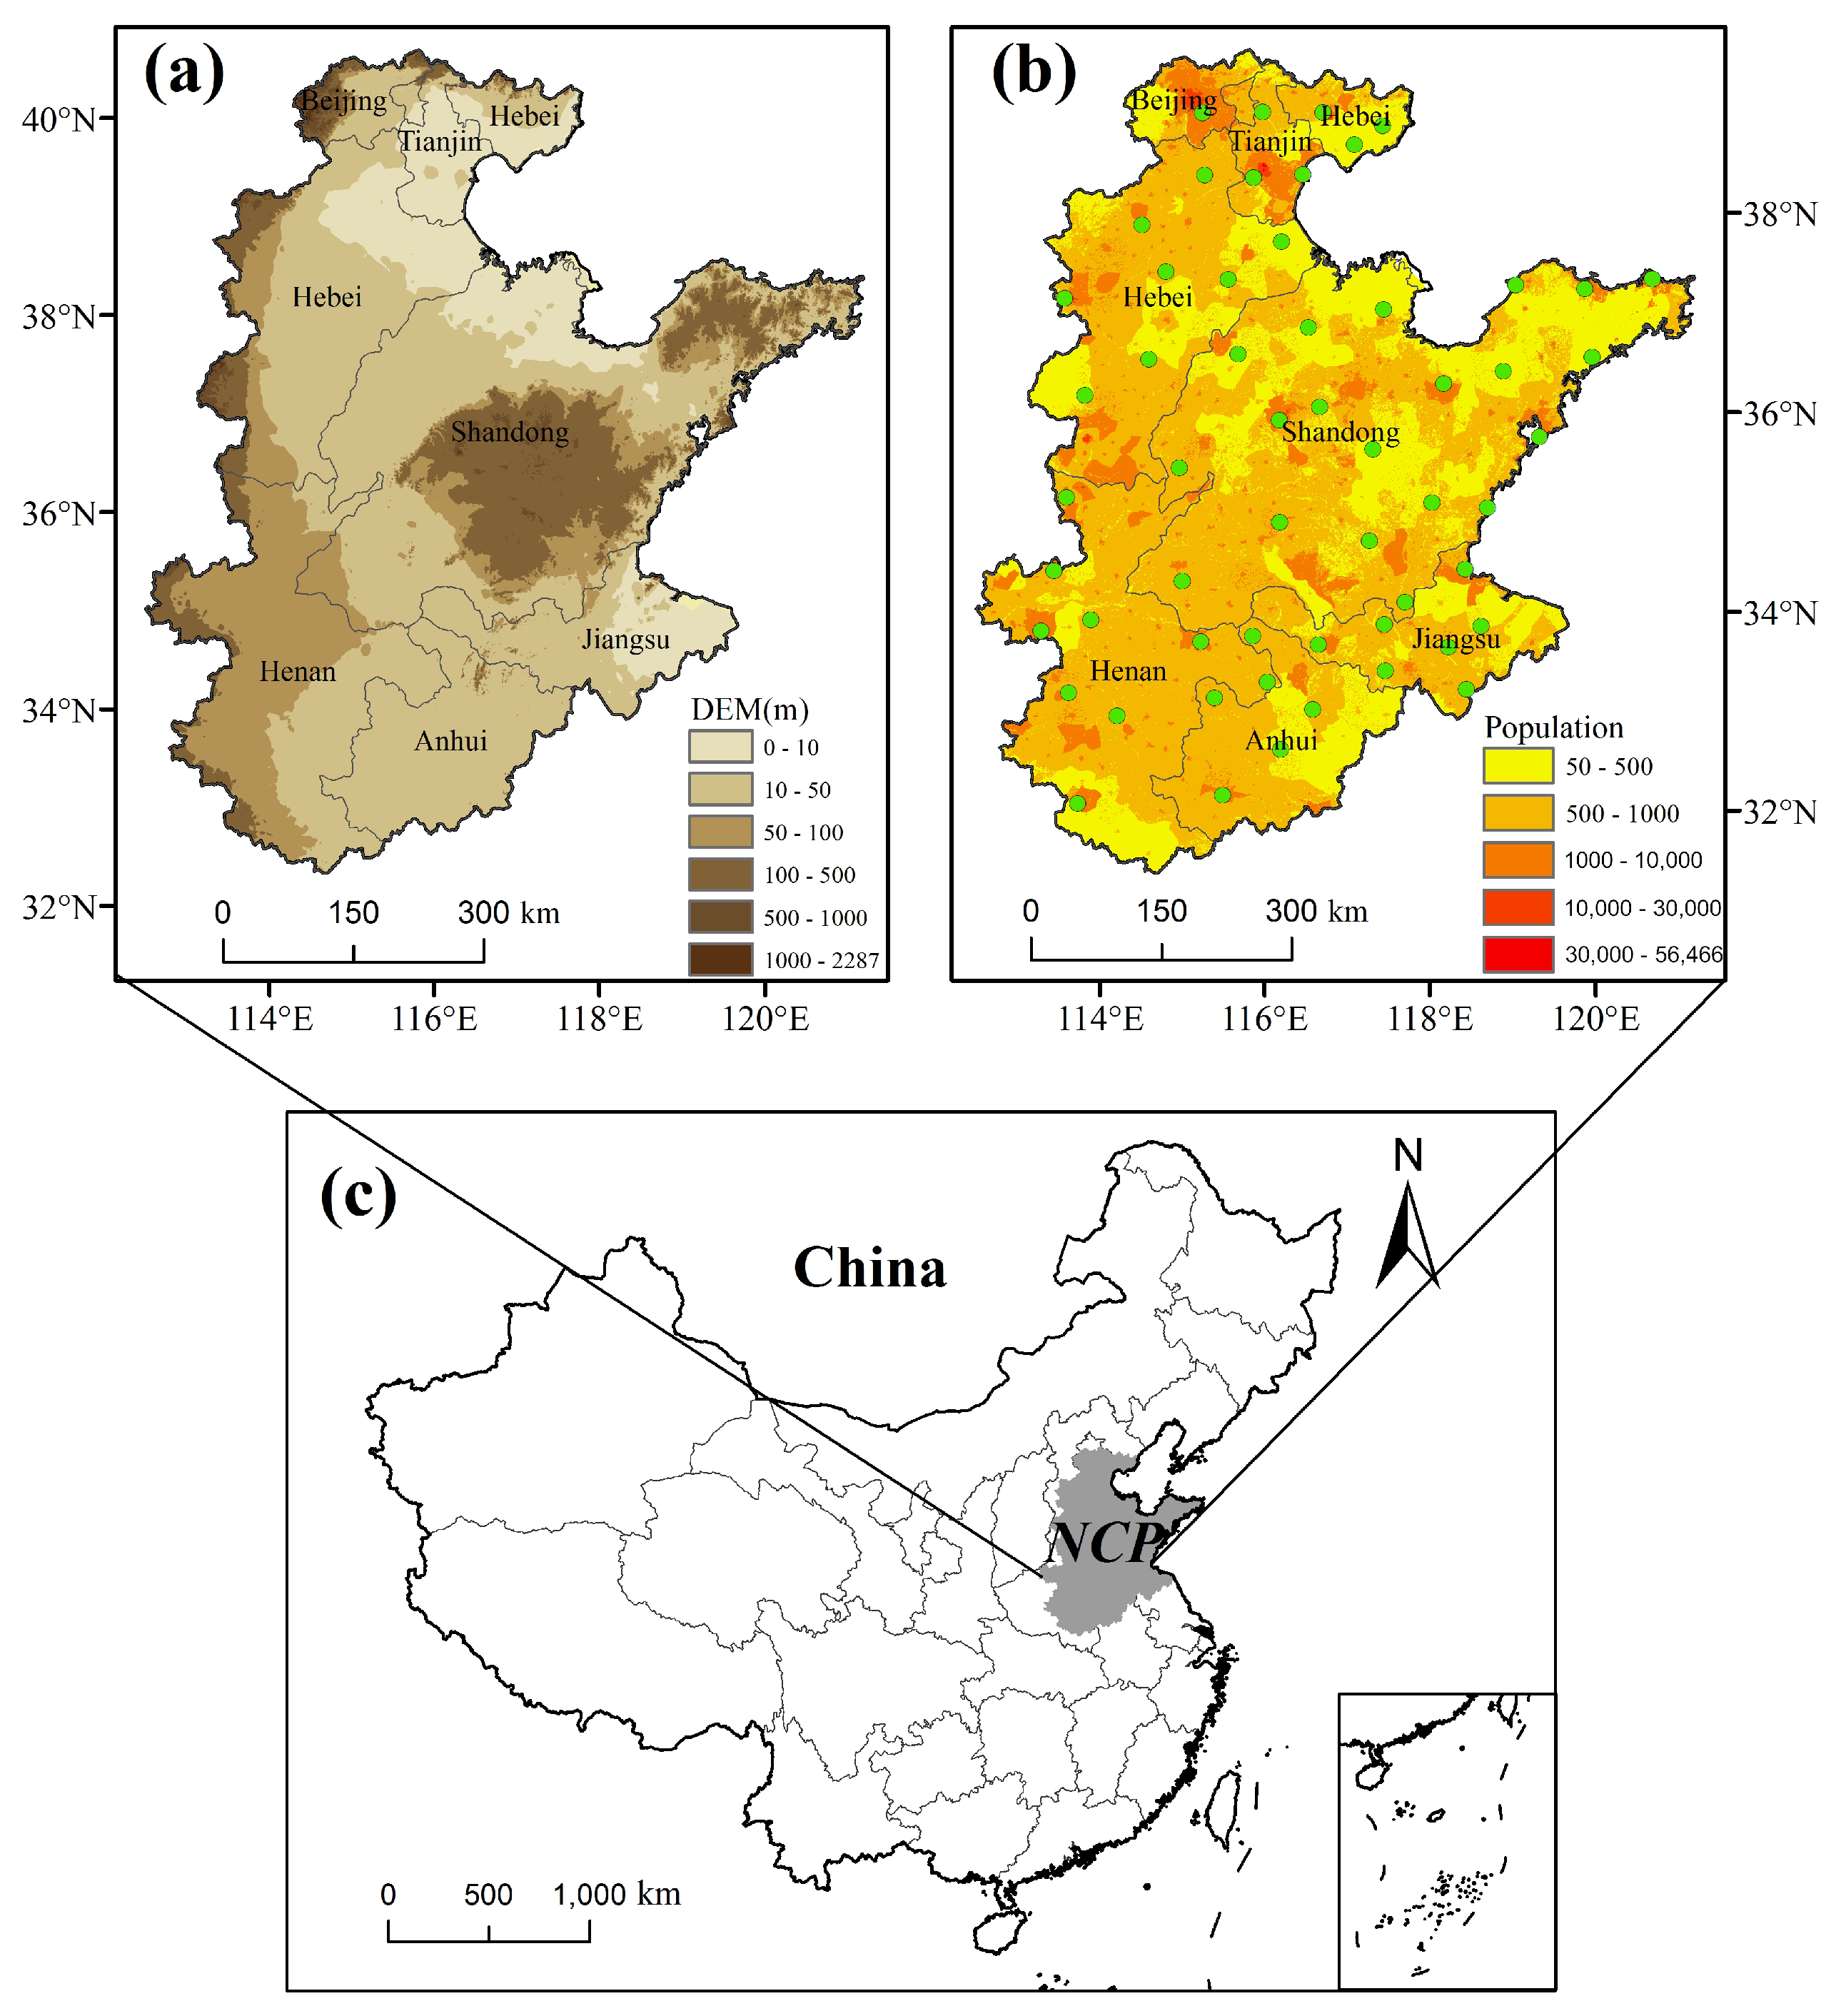
Figure 1. Location and basic information of the study area: (a) digital elevation map (DEM, unit: m); (b) spatial pattern of population; (c) location of the North China Plain (NCP) in China.
Sustainability 11 03413 g001
Figure 2. Spatial pattern of long-term annual trends of the (a) heat index (°C per decade); (b) air temperature in summer (°C); (c) wind chill temperature (°C); and (d) air temperature in winter (°C). The black circle denotes significance at the 5% significance level. The dark-gray lines denote the provincial boundaries.
Sustainability 11 03413 g002
Figure 3. Spatial pattern of the long-term annual trends of the (a) relative humidity in summer (RHs); (b) relative humidity in winter (RHw); (c) wind speed in summer (WSs); and (d) wind speed in winter (WSw). Black circle denotes significant at the 5% significance level. The dark-gray lines denote the provincial boundaries.
Sustainability 11 03413 g003
Figure 4. Temporal evolution of regional mean temperature indicators for urban (red) and non-urban (blue) stations over the entire study area during 1976–2016: (a) heat index (HI) in summer; (b) wind chill temperature (WCT) in winter; (c) air temperature (T) in summer; and (d) T in winter. Dashed lines denote the corresponding linear trends.
Sustainability 11 03413 g004
Figure 5. Relationship between the urban land area of the NCP and temperature indicators. The urban land area data are obtained in the late 1980s, 1990, 1995, 2000, 2010 and 2015; each date are considered the records for the previous five years (i.e., 1976–1980, 1986–1990, 1991–1995, 1996–2000, 2016–2010 and 2011–2015, respectively). The 5-year mean values of temperature indicators are calculated corresponding time period. (a) Heat index (circle) and air temperature (triangle) in summer (°C); (b) wind chill temperature (circle) and air temperature (triangle) in winter (°C). Dashed lines denote the corresponding linear trends.
Sustainability 11 03413 g005
Table 1. Definitions of all the indicators used in this study.
IndicatorsDefinitionUnit
HIHeat index°C
WCTWind chill temperature°C
TDaily mean temperature°C
RHRelative humidity%
WSWind speedm/s
Table 2. Trends of regional mean temperatures (°C per decade)/humidity (% per decade)/wind speed (m/s per decade) for urban and non-urban stations; urbanization effects (°C per decade) and urbanization contributions (%) on temperature changes during 1976–2016.
RegionIndicators Summer  Winter
WholeUrbanNon-UrbanUEUC (%)WholeUrbanNon-UrbanUEUC (%)
WholeHI/WCT0.35 0.400.300.10 26 0.64 0.700.580.12 17
T0.25 0.300.210.09 31 0.42 0.470.380.08 18
RH−0.96 −1.27−0.66 −0.45 −0.71 −0.18
WS−0.16 −0.16−0.17 −0.18 −0.20−0.16
NorthHI/WCT0.39 0.390.380.00 1 0.65 0.680.610.07 10
T0.29 0.300.280.02 7 0.42 0.430.400.03 7
RH−1.03 −1.23−0.84 −0.32 −0.67 0.02
WS−0.17 −0.19−0.14 −0.20 −0.22−0.18
SouthHI/WCT0.32 0.420.21 0.21 49 0.64 0.730.550.18 25
T0.22 0.300.13 0.16 55 0.43 0.500.360.14 28
RH−0.89 −1.32−0.47 −0.57 −0.76 −0.37
WS−0.16 −0.13−0.20  −0.16 −0.17−0.15  
Note: Bold denotes significant at the 5% significance level. UE denotes urbanization effect; UC denotes urbanization contribution.