3.1. Study Sites
Poland’s higher education services are largely found in major cities such as Warsaw, Cracow, or Gdansk. A port city, Gdansk is Poland’s sixth most populated city (more than 460,000) and seventh for size (more than 260 km
2). Car ownership is 550 cars per 1000 population. With its unusual alignment, Gdansk features a linear transport system. The city’s main road and rail axis is populated with shops, services, and education facilities, including Gdansk’s biggest universities. Because it is linear, the system cumulates trips along the main transport axis and on its access roads. As a result, Gdansk, just as the majority of big cities is clogged by congestion, an effect of many trips and the popularity of the car as a mode of transport. On a daily basis, Gdansk can record about 870,000 trips [
43], of which 39% are by car, 38% by public transport, 22% walking, and 2% cycling. Considering the size of Gdansk’s academic community (15% in relation to Gdansk’s population), a high percentage of trips will be generated by university students and staff. This becomes quite clear when we compare road traffic and public transport traffic during the academic year and when schools are closed for holidays.
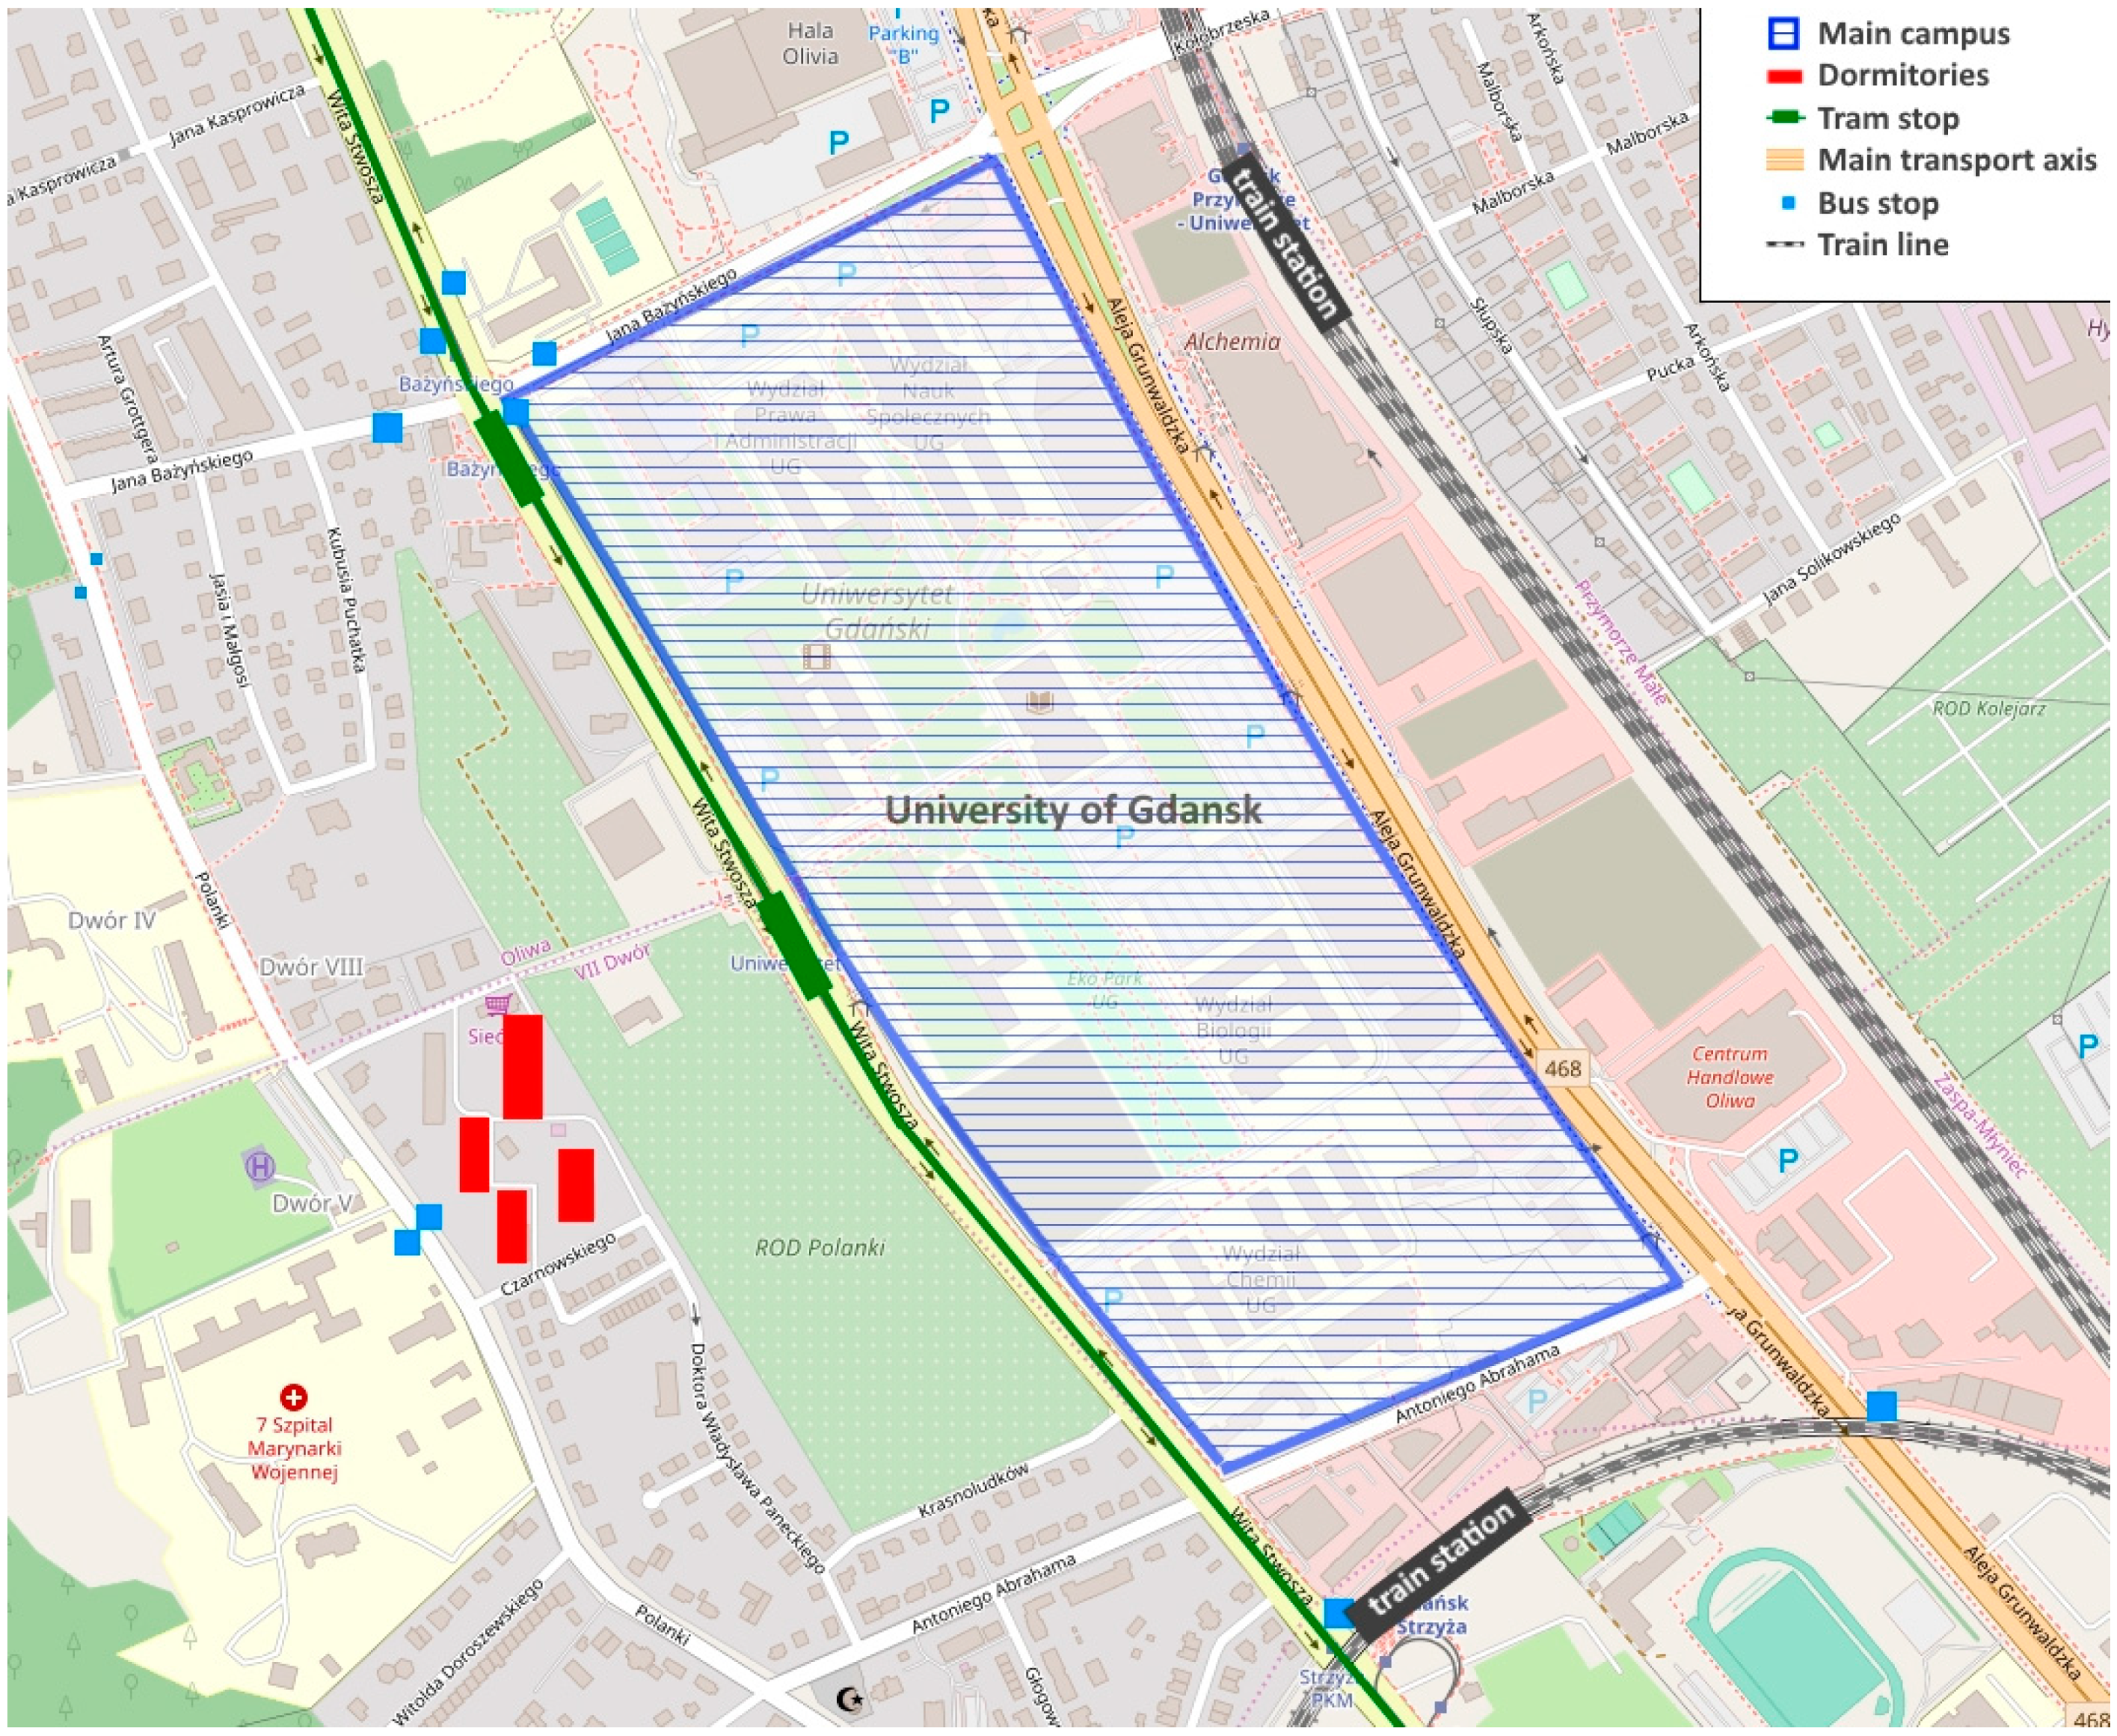
The Gdansk University of Technology (GUT) and the University of Gdansk (UG) are the biggest universities in north Poland. Both have urban locations and compact campuses with just a few of their facilities located outside the main locations. UG is situated in Oliwa, a dynamically developing district and home to academic, office, commercial, and residential uses. UG has more than 30,000 students with nearly 3200 staff. A clear majority studies or works in the university’s main campus called Oliva Campus. GUT is situated in Wrzeszcz, a district which for years has been Gdansk’s main commercial and service hub. GUT has nearly 24,000 students and more than 2700 staff. Nearly all of the university’s buildings are located on the main campus. UG and GUT combined represent 85% of Gdansk’s academic community. Both universities have similar characteristics such as their location along the city’s main transport axis (
Figure 1 and
Figure 2), access to public transport, transport services and how both universities operate.
The transport services of both universities comprise internal services within the campuses and external services linked to the adjoining streets, public transport stops, car parks, and university buildings outside the campuses. Because both universities are located on the city’s main transport axis, they have excellent links to Gdansk’s transport network and to public transport (access to the bus, tram and train network), cycling and pedestrian infrastructure. UG’s Oliwa campus has about 1500 parking spaces for staff and students. With a capacity of about 700 parking spaces, GUT provides parking for its staff only. Because parking is limited in both universities, many people park illegally on the campus or outside it–in designated parking places, in on-street parking, on semi-legal and legal sites. Some park in nearby residential streets, causing a nuisance for the residents.
3.2. Surveys
To support our analyses, GUT and UG academic communities were asked to take part in a survey. The online questionnaire was distributed by an internal mail system to e-mail addresses of all staff and students. Participation was voluntary and anonymous.
The purpose of the survey was to understand the structure of academic community for its transport preferences, daily transport choices and willingness to reduce car use and choose alternative transport modes instead (
Table 2).
The survey covered a total of 3378 people, staff and students of both universities. Depending on the surveyed group, the response rate ranged from 3% to 29% (
Table 3). In order to verify if the number of respondents meets the requirements of the minimum sample size, the formula given by Smith [
44] was used (Formula (1)). Having a big enough sample is important if we want to draw inferences about the entire university community based on the group surveyed.
where:
is a minimum sample size,
is a size of the target population,
is the unknown response distribution (
),
is the normal variate for 95% confidence (
and
is an absolute accuracy level (
was applied).
Based on the calculated minimum sample size (
Table 3) it can be confirmed that in the case of each surveyed group the number of respondents meets the requirements of a minimum sample size.
The questionnaire was conducted in the spring, from May to June. The reason why this period was selected was the good weather (encouraging active forms of mobility) and regular study periods with no days off or university events.
3.3. Statistical Analysis
The sample’s representativeness was tested by comparing it to the population for its share in the particular university units and functions. The analyses showed that the respondents represented a similar proportion of overall university functions and population. In both cases, staff functions were found to be significantly (~10%) underrepresented in the category of service employees (cleaning, maintenance service, etc.) who range from 14–17% of university staff. This is probably because service staff may have limited access to a computer or university e-mail. Considering the differences in the structure of the sample and population, a rim (Random Iterative Method) weighting algorithm was applied to ensure a representative sample. The weighting methods are commonly used in quantitative market research in order to achieve the representative sample in relation to the known target population characteristics [
45]. In the case of rim algorithm, the weighting is done against several criteria. In the study three criteria were used: University, status and function.
It was important to relate the respondents’ declared transport behaviour and preferences to the location and attractiveness of the sources of their university commutes. An indicator was proposed to express public transport (PT) accessibility
from trip origin to its destination (Formula (2)). Public transport accessibility can be defined as the degree of ease with which it is possible to get from a given city district,
to a given university with the use of existing public transport infrastructure and services. The indicator takes into account the public transport infrastructure in a given district (as part of the district’s built environment), the available public transport connections between the district and a given university and the average time needed to travel between the district and the university using the available public transport services. The indicator can be from 0 to 1. The higher the rate, the better the accessibility and convenience of public transport commutes. The indicator only applies to people commuting within Gdansk (when the trip origin is located in Gdansk).
where:
and
denote whether a tram and train service connection is available from the district
(0-absent, 1-present),
denotes whether PT services are available for direct travel from the district,
to the university (1-ability to use a direct service, 0-having to transfer),
is a normalised travel time by PT, calculated using Formula (3),
are weights of variable significance determined using an expert method and all adding up to 1.
where:
is average time to travel by PT from the district
to the given university and
is average time to travel by PT from the furthest district to the given university.
A similar indicator
was proposed to express on a scale of 0–1 the possibility of walking from trip origin (district
) to destination (the university).
where:
is average walking time from the district
to the given university and
is average walking time from the furthest district to the given university.
The accessibility analysis showed that accessibility by PT is the highest for mixed land use districts and districts situated along Gdansk’s main transport axis. Accessibility was the lowest for districts further away from the main transport axis which are largely residential in character. Walking accessibility is high in university districts or those directly adjacent to them.
Modes of transport were considered in four groups: the car, public transport, cycling, walking. Next, cross-analyses were conducted by combining a selected transport mode with respondent characteristics, location of trip origin/destination and others. This helped to identify academic community transport patterns and the factors that influence a respondent’s choice of transport mode.
Transport choice factors were identified using the chi
2 test of independence, followed with a strength statistic Cramer’s V coefficient. The chi
2 test is a popular non-parametric statistic for testing hypotheses when all variables are nominal [
46]. The calculated statistic
reflects the difference between the observed counts and the counts expected if there was no relationship between the analysed variables. Cramer’s V is a standardized strength test for chi
2, calculated according to the Formula (5).
where:
is a total number of observations and
is a number of columns or rows (whichever is less) of the table with an actual count of the cases.
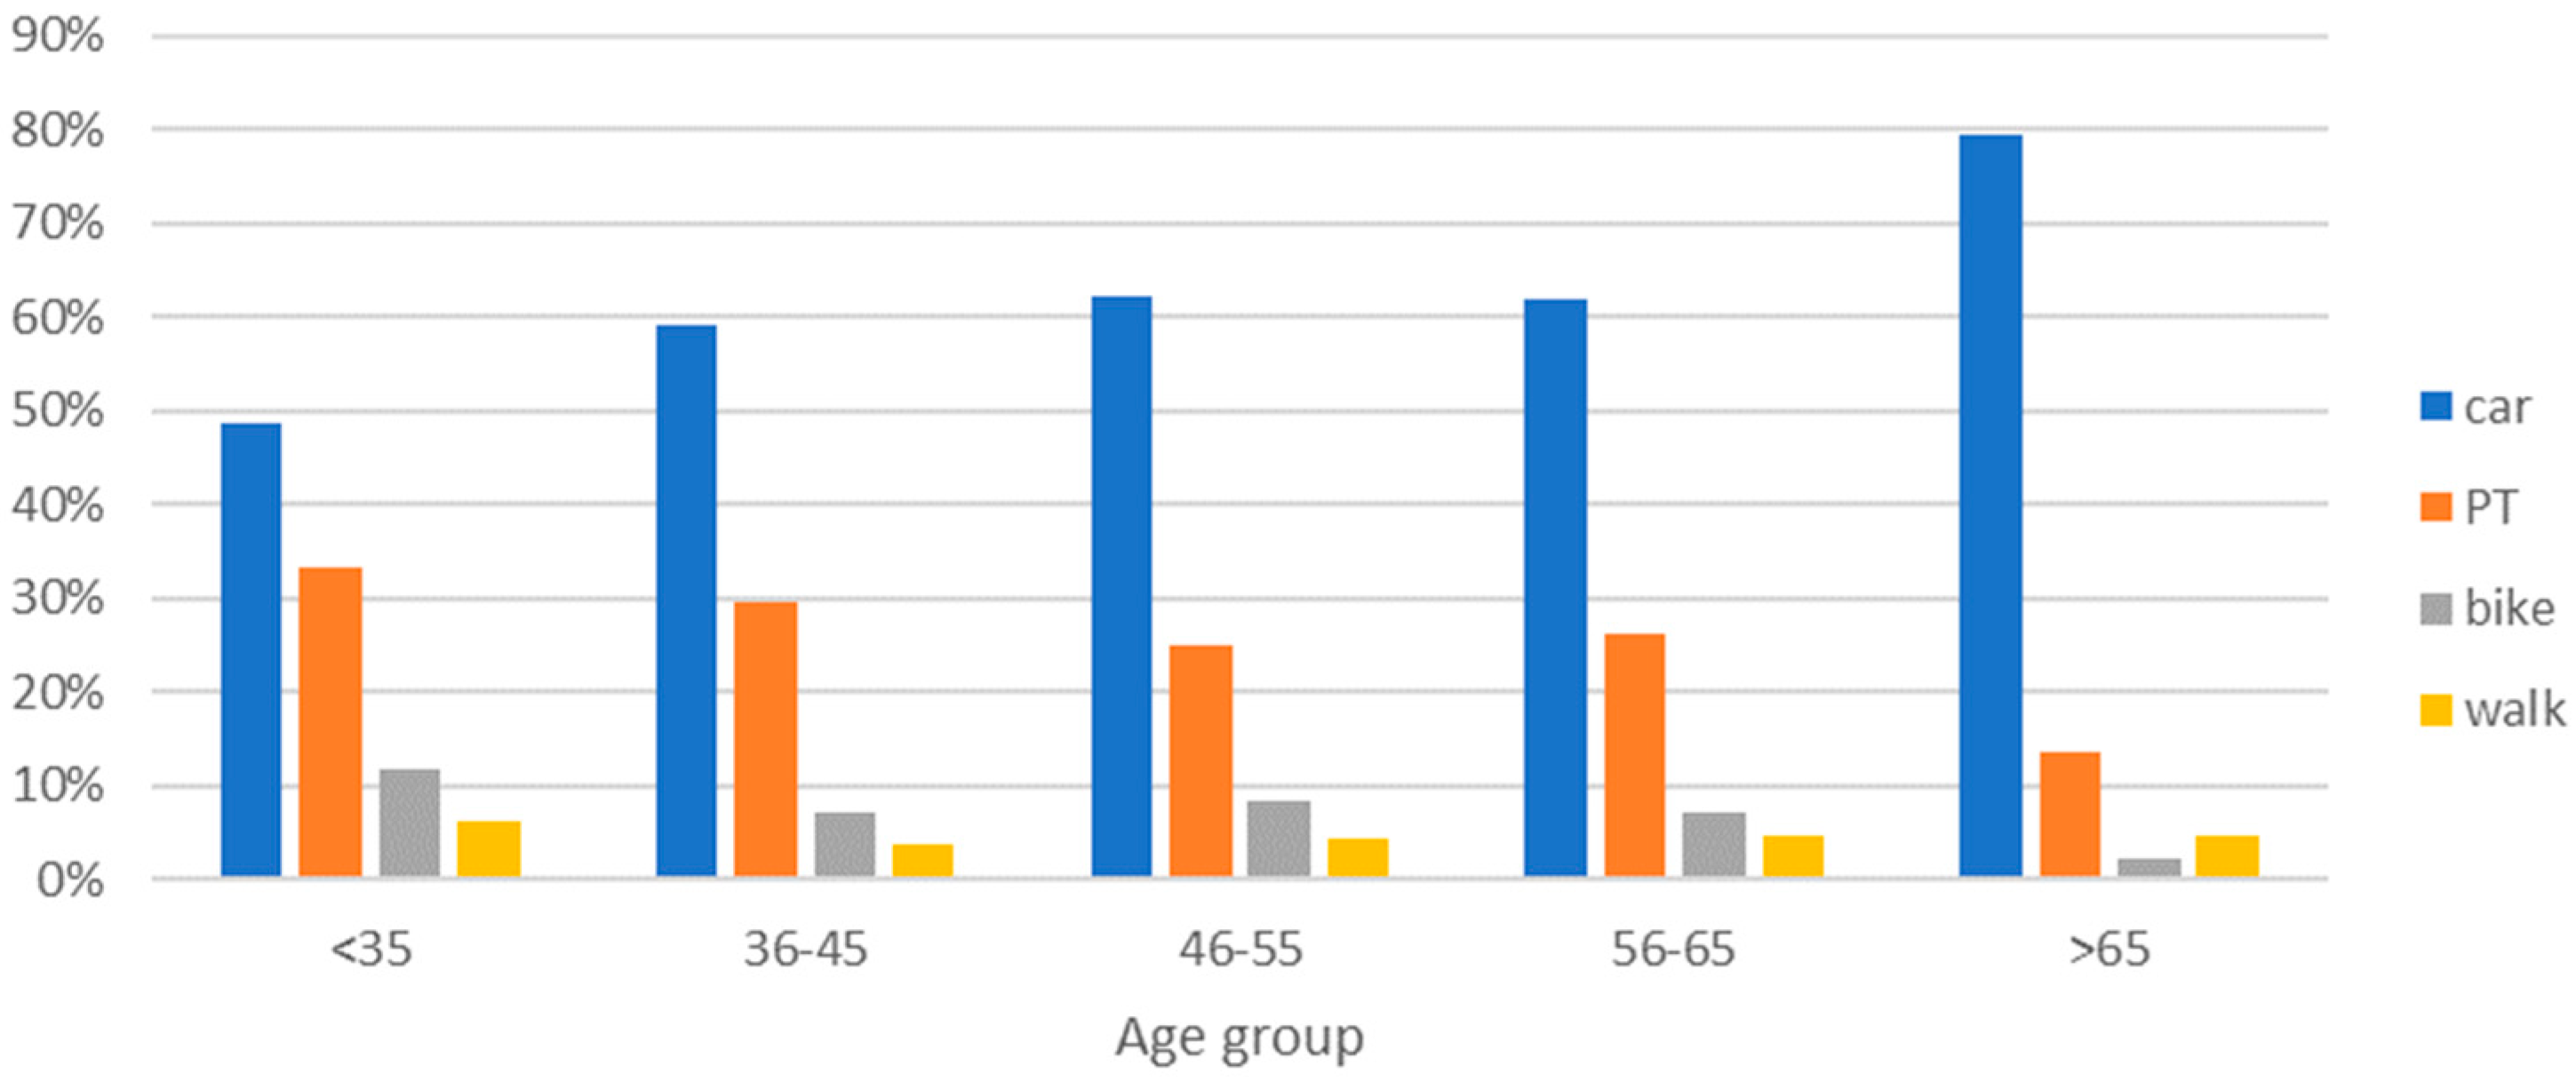
Cramer’s V coefficient was used to assess the strength of the relationship between a chosen transport mode and respondent’s characteristics (i.e., gender, age group, function, car availability). The statistic gives a value between 0 and 1. The higher the value, the stronger the relationship between variables.
Taking into account the results of chi
2 independence test, the academic community was divided into segments of similar patterns and transport choice determinants. For this purpose, the classification trees method and the CHAID (Chi
2 Automatic Interaction Detector) algorithm were used. The calculations were performed using statistical software [
47].


