Article

Hydroponic Lettuce Production Using Treated Post-Hydrothermal Liquefaction Wastewater (PHW)

1
Department of Agricultural and Biological Engineering, University of Illinois Urbana-Champaign, 1304 W. Pennsylvania Ave., Urbana, IL 61801, USA
2
Department of Crop Sciences, University of Illinois Urbana-Champaign, 1102 S. Goodwin Ave., Urbana, IL 61801, USA
*
Author to whom correspondence should be addressed.
Sustainability 2019, 11(13), 3605; https://doi.org/10.3390/su11133605
Submission received: 23 May 2019 / Revised: 19 June 2019 / Accepted: 28 June 2019 / Published: 30 June 2019

Abstract

:
Post-hydrothermal liquefaction wastewater (PHW) is a byproduct of the hydrothermal liquefaction (HTL) process. Previous research indicates that PHW is free of pathogens and contains nutrients needed for crop growth, but may contain metal(loid)s. This study evaluated the ability of differentially treated PHW for effective and safe hydroponic lettuce production. Water containing only hydroponic fertilizer (Source Water 1) had the highest total dry yield of all five treatments; 3.1 times higher than Source Water 2 (diluted PHW with sand filtration), 3.5 times higher than Source Water 3 (diluted PHW with sand + carbon filtration), 2.6 times higher than Source Water 4 (diluted and nitrified PHW with sand filtration), and 1.3 times higher than Source Water 5 (diluted PHW supplemented with hydroponic fertilizer). Findings also indicated that while PHW was below the US Department of Agriculture Foreign Agriculture Service maximum levels for cadmium, lead, and mercury in food, the concentration of arsenic was 1.6, 2.4, and 2.0 times higher than the maximum level for Source Waters 2, 3, and 4, respectively. There was no detectable E. coli or fecal coliforms in any of the treated PHW. While nitrogen was present in the raw PHW, only 0.03% was NO3-N and NO2-N. Diluted PHW supplemented with hydroponic fertilizer had lower lettuce yield than hydroponic fertilizer alone, indicating a potential non-nutrient inhibition of plant growth by PHW. Therefore, this research demonstrates that treated PHW does not pose a biological contamination risk for lettuce, but may entail levels of arsenic in edible leaf tissues that are in excess of safe levels. Additional treatment of PHW can benefit crop production by allowing crop utilization of a greater fraction of total nitrogen in the raw PHW.

1. Introduction

The U.S. produces an estimated 79 million dry tons of sustainably collectable livestock manure and food processing waste annually [1]. This has encouraged a growing interest in hydrothermal liquefaction (HTL), a process by which organic matter, such as sewage or manure, is converted to bio-crude oil under high temperatures and pressures [2]. Furthermore, this process produces an aqueous byproduct that contains crop nutrients including nitrogen, phosphorus, and potassium [3]. The high temperatures and pressures needed for the HTL process destroy biological and organic contaminants, such as pharmaceuticals, pathogens, and genetic material, which are present in the HTL feedstock [4,5]. Therefore, there is high potential for post-hydrothermal liquefaction wastewater (PHW) for food crop production.
Wastewater reuse for irrigation is a current topic of study, in particular on the effect of treated wastewater on crops and soil [6,7]. Some concerns with the use of wastewater as irrigation are metal(loid) contamination, drugs, and pathogens [8,9]. However, the high temperatures and pressures in HTL are hypothesized to eliminate the drugs and pathogens from the PHW, which leaves a potential risk for metal(loid)s in PHW. Studies have shown the benefits and limitations of non-PHW wastewater sources in the hydroponic production. Hydroponic crop production entails plant production in the absence of soil in which roots are directly exposed to nutrient solution. Compared to non-hydroponic agriculture, hydroponic production requires 82 times more energy but 92% less water and produces 11 times more yield per area [10].
Treatment of wastewater has been shown to be possible over 7 days with a Pistia stratiotes phytofiltration lagoon, with an average biomass production of 5.8 g of dry weight per square meter per day [11]. Lettuce (Lactuca sativa) can successfully be produced with treated greywater without posing a substantial health risk for pathogens or metal(loid)s, while also providing a 5.1 log10 reduction of E. coli in the final effluent [12]. Hydroponic barley (Hordeum vulgare) production using wastewater has been investigated [13] and found a decrease in yields of 47% and 17% for conventional activated sludge and lagoon system water compared to half-strength Hoagland Solution, concluding that further fertilization with wastewater would be necessary and that metal(loid) concentrations in plant tissue increased, but did not exceed, toxic levels. Al-Karaki [14] explored using tertiary-treated sewage wastewater to grow barley in controlled environment vertical hydroponic growing towers. Compared to treatments of tap water alone, which was used without fertilizer for hydroponic green fodder due to short growth period, wastewater, and wastewater mixed with municipal tap water improved both yields and water efficiency. Furthermore, no pathogens were found in any hydroponic treatment, compared to previous research in conventional agriculture.
Primary and secondary treated municipal wastewater was investigated for hydroponic cucumber (Cucumis sativus) irrigation with a nutrient film technique [15]. It was found that primary treated wastewater, with or without nutrient supplementation, decreased plant height and reduced leaf and flower number, but this was not seen with secondary treated wastewater. However, the increased fruit number and weight resulted in increased yields, but it was also found to spread plant disease in plant roots and fruit. Chow et al. [16] cultivated lettuce and Chinese cabbage (Brassica rapa ssp pekinensis) with primary and secondary municipal wastewater effluents and half-strength Cooper nutrient solution. Chinese cabbage showed signs of phytotoxicity with both effluents, but lettuce did not; both crops had lower yields than the control. However, da Silva Cuba Carvalho et al. [17] sought to evaluate nutrient absorption and yields of lettuce cultivated hydroponically with wastewater from a domestic sewage treatment station. Using nutrient film technique with treatments of tap water and fertilizer, wastewater supplemented with fertilizers, and wastewater alone, they found that wastewater supplemented with fertilizers had lettuce yields and nutrient uptake comparable to tap water with fertilizers. However, treated sewage effluent alone did not have the nutrients necessary for lettuce production and had a quarter of the mass compared to supplemented wastewater. Cui et al. [18] treated septic tank effluent using vertical-flow wetlands followed by hydroponically growing spinach (Spinacia oleracea) and lettuce, which resulted in removal efficiencies sufficient for a secondary biological treatment plant discharge, with yields less than nutrient solution hydroponic control, but higher than in field production. Norström et al. [19] investigated using hydroponics and microalgae production in conjunction with conventional biological treatment to treat domestic wastewater. The system was able to achieve a 90% chemical oxygen demand (COD) removal, 72% total nitrogen reduction, and 47% phosphorus reduction, but was not sufficient for Swedish effluent standards.
It has been demonstrated that wastewater spiked with PHW can augment the growth of mixed culture algae and rice. Phototrophic algae growth was quantified as Chlorophyll a concentration, which was increased by over 30% when using a small percentage of PHW (0.5%). However, larger concentrations of PHW had an inhibitory effect, perhaps due to high ammonia concentrations or organic inhibitors [20,21,22,23]. In past work, phenol, toluene, benzene and a variety of nitrogenous heteroatomic compounds have been identified in PHW [24] and are known to be toxic to some algae [25,26]. It is also known that acclimated algae can tolerate up to 15% HTL aqueous product. In comparison to conventional wastewater treatment processes like activated sludge, it has been shown that phototrophic algae can enhance removal of wastewater nutrients, N and P, by 86% and 95%, respectively [27].
Average rice yields from plants grown using a blend of nutrients from swine manure and PHW was approximately 18.5% higher than control plants grown in municipal water containing synthetic nutrients [28]. However, one problem noticed in this study was that the rice irrigated with PHW had higher levels of certain metals (i.e., Hg, Cd, Pb, with only Hg exceeding the current FDA standards for rice), which is a topic of this proposed study.
The overall goal of this study was to assess the ability of treated PHW to effectively and safely grow lettuce, hydroponically. Specifically, this study measured yield and shoot content of metal(loid)s, nitrogen, and phosphorus of lettuce grown using five different source waters.

2. Materials and Methods

In this study, five different source waters were used to grow lettuce, hydroponically (Table 1); one water source consisting of municipal tap water and hydroponic fertilizer and four water sources consisting of treated PHW. The treated PHW are based on previous work [29]. The water sources were used as an irrigation/fertigation source for the production of lettuce. A series of five identically constructed hydroponic racks (Figure 1) were used for the hydroponic production of lettuce. Each rack contained three growing bins and received water from the treatment group’s source water. Each bin consisted of a batch reactor, in essence a static flood tray. Each bin contained a foam board layer to keep the plant potted in organic media above the water, but allowed the root system to be submerged in the nutrient-rich feed (e.g., diluted but otherwise untreated PHW, nitrified PHW, filtered PHW, etc.). Each bin accommodated 18 lettuce plants.

2.1. Experimental Design

Lettuce plants, in bins of 18 plants randomly selected from plug trays, received the five source water treatments, as shown in Table 1.
Three replications of each of the five source water treatments were completed in a controlled environment, for a total of 15 experimental units. The hydroponic fertilizer treatment served as a control group for normal hydroponic lettuce production. For the individual experimental units, the following parameters were measured:
  • Net change in fresh mass from planting to harvest (net fresh yield)
  • Total dry yield at harvest
  • Metal(loid) concentrations (Hg, As, Cd, and Pb) in harvested dry mass
  • Nitrogen and phosphorus contents of harvested dry mass

2.2. Materials

2.2.1. PHW Source

The PHW was produced in a hydrothermal liquefaction laboratory pilot reactor with a feedstock of algae grown on swine manure. The PHW was undiluted in barrels at a storage facility prior to being collected. The PHW was well mixed and then placed in five 5-gallon sealed plastic buckets.

2.2.2. Water Source and Dilutions

Due to the large volume of water needed, municipal tap water was used to prepare all dilutions in 55-gallon plastic barrels. Tap water was added to raw PHW to generate the 2.5% mixtures. This dilution factor was chosen as an estimated dilution factor based on nutrients required for lettuce growth and previous PHW analysis from this lab.

2.2.3. Filtration Equipment

Sand and sand+carbon filtration treatments were performed with a Sand Master Soft Sided Above Ground Pool Sand Filter System (Swimline, Edgewood, NY, USA), filled with sand and a sand-carbon-sand layering, respectively. The sand was Fairmount Minerals Pool Filter #20 Grade Silica Sand (Fairmount Santrol, Benton Harbor, MI, USA), and the activated carbon source was Custom Aquatic Premium Bulk Granular Activated Carbon (Custom Aquatic, Vista, CA, USA) [29].

2.2.4. Nitrification Equipment

Nitrification was performed in 55-gallon plastic barrels and was aided by ATM Aquarium Products Colony Nitrifying Bacteria (ATM Aquarium Products, Las Vegas, NV, USA) true nitrifying bacteria starter, a 45 L/min Hydrofarm AAPA45L Active Aqua Commercial Air Pump (Hydrofarm, Petaluma, CA, USA), 6 VIVOSUN 4 × 2 Inch Large Air Stone Cylinders (Vivosun, Los Angeles, CA, USA), and Aquatic Experts Rigid Latex-Coated Coarse Bulk Roll Pond Filter Media, 18x72x1 Inches (Aquatic Experts, Greensboro, NC, USA) as biofilter material for the bacteria [29].

2.2.5. Hydroponic Fertilizer Formula

The hydroponic fertilizer was formulated from the General Hydroponics (Santa Rosa, CA, USA) brand Flora Series hydroponic fertilizer for “aggressive vegetative growth” solution, using the three component fertilizers Flora Gro, Flora Micro, and Flora Bloom. This fertilizer was chosen as it is an easily obtained and consistent commercial hydroponic fertilizer. Flora Gro, Flora Micro, and Flora Bloom are 2-1-6, 5-0-1, and 0-5-4 NPK fertilizers, respectively. The “aggressive vegetative growth” formulation utilizes 396, 264, and 132 mL/100 liters of Flora Gro, Flora Micro, and Flora Bloom, respectively. To prepare Source Water 1, the components were measured with graduated cylinders and thoroughly mixed in a 55-gallon plastic barrel.

2.2.6. Growing Racks and Bins

Each of the five source water treatments were assigned a growing rack (Figure 1) with 3 grow bins per rack. The racks were Husky (Denver, NC, USA) 78 in. H × 48 in. W × 24 in. D adjustable steel wire shelf units that were modified to have four shelves. The top three shelves were used for holding grow bins and lighting fixtures and the bottom was used for holding the air pump and electrical equipment. Each lettuce growing shelf had a Lithonia (Atlanta, GA, USA) Lighting High Bay Industrial 6-light hanging fluorescent fixture, a grow bin, and two VIVOSUN (Los Angeles, CA, USA) 4x2 inch cylinder air stones with connected tubing. The lighting fixtures of each rack were fitted with six 4 ft T8 32-Watt Daylight 6500K ALTO Linear Fluorescent Light Bulbs and connected to a GE (Boston, MA, USA) Indoor 24 h Mechanical Timer to control photoperiod to 12 h per day. The air stones of each rack were connected to a 20-Watt 45 L/min Hydrofarm (Petaluma, CA, USA) AAPA45L Active Aqua air pump split with a 6-outlet manifold to provide diffused oxygen to the root zone of the grow bins. The distance from the bottom of the lighting fixture to the top of the grow bin was 30.5 cm.
Each grow bin consisted of a Sterilite 86 cm L × 47.6 cm W × 17.8 cm H quart plastic tote container (Townsend, MA, USA), with a GreenGuard (Marietta, GA, USA) R3 Unfaced Polystyrene insulation foam board cut with 18 circular holes for PonicsFarm NP3AB 3-inch Black Slotted Mesh Net Pots, and filled with the respective treatment nutrient solution. The holes were spaced so that pots were spaced in five rows, with three rows of 4 pots and two rows of 3 pots staggered between them. The net pots were held in the holes by the buoyancy of the foam board on the nutrient solution. Each net pot contained the lettuce plug, surrounded by Hydroton lightweight expanded clay aggregate (LECA) to hold the plug and allow room for root growth. The air stones were placed at either end of the length of the grow bin, submerged under the nutrient solution.

2.2.7. Lettuce Plug Source

The lettuce plants used in this experiment were VF Lettuce Buttercrunch Plug 288 transplant plugs sourced from Wenke Greenhouse through Ball Horticultural Company (West Chicago, IL, USA). Prior to shipment at 4 weeks old, the seeds were germinated at 20 °C and grown after germination at 15.6 °C with low humidity. The media used was a peat perlite mixture with no starter charge of fertilizer but were fertilized with 15-3-16 NPK 2× micros at 100 mg kg−1. Upon arrival, the lettuce plugs were put under the laboratory conditions, allowed to soak in the hydroponic fertilizer solution for 1 day, and then healthy plugs were randomly selected, weighed, and transplanted into the grow bins.

2.3. Procedure

2.3.1. Initial PHW & Dilutions

The lab ambient temperature was kept at 18.3 °C. When not in use, PHW was sealed in the 5-gallon plastic barrels to prevent contamination from the room environment. For each of the source water treatments, the water was well-mixed with a powered stirring rod for 3 min before being added to the grow bins [29].

2.3.2. Nitrification Process

Nitrification was stimulated with the aid of ATM Aquarium Products Colony Nitrifying Bacteria (ATM Aquarium Products, Las Vegas, NV, USA) true nitrifying bacteria starter, a 45 L/min Hydrofarm AAPA45L Active Aqua Commercial Air Pump (Hydrofarm, Petaluma, CA, USA), 6 VIVOSUN 4 × 2 Inch Large Air Stone Cylinders (Vivosun, Los Angeles, CA, USA), and Aquatic Experts Rigid Latex-Coated Coarse Bulk Roll Pond Filter Media, 18 × 72 × 1 inches (Aquatic Experts, Greensboro, NC, USA) as biofilter material for the bacteria. The nitrification was carried out in 55-gallon plastic barrels [29].
For Source Water 4, prior to filtration, nitrification was performed over an 8 day period in order to convert some of the ammonium and organic forms of nitrogen in the raw PHW into NO3+NO2. A 100 mL volume of true nitrifying bacteria solution per 200 L of diluted PHW to introduce the bacteria to the wastewater. The temperature was held at 26.7 °C in closed-lid 55-gallon bins and supplied with oxygen from 45 L/min air pumps using 6 air diffusing stones for 8 days. Additionally, 48 × 72 × 1 inches of filter pad media was submerged in the nitrifying solution to increase the surface area for nitrifying bacteria to multiply on [29].

2.3.3. Filtration Preparation and Process, Sand and Sand + Carbon

Two pool filters were used, one for sand filtration and the other for sand+carbon filtration. For sand filtration (Source Waters 2 and 4), filter-quality sand was poured into the filtration bed of the pool filter to three-quarters of the height of the bed, according to the manufacturers instructions. For sand+carbon filtration (Source Water 3), the middle third of the filter sand was replaced with activated carbon. The filter bed was primed with tap water before use. The sand was Fairmount Minerals Pool Filter #20 Grade Silica Sand (Fairmount Santrol, Benton Harbor, MI, USA), and the activated carbon source was 4 × 8 US mesh size (particles were in the range of 0.25” to 0.125”) Custom Aquatic Premium Bulk Granular Activated Carbon (Custom Aquatic, Vista, CA, USA). Between nitrified and non-nitrified solutions, the filter media was removed, the filter bed was cleaned with bleach and thoroughly rinsed, and fresh filter media was added to the filter bed. The 200 L of diluted (both non-nitrified and nitrified) PHW were then passed through the pool filter at 5 psi at a flow rate of 75.7 L per minute (20 gallons per minute) for a single-pass filtration [29].

2.3.4. Fertilizer Supplementation

For Source Water 5, the procedure for preparing Source Water 1 was repeated, but using the sand filtered 2.5% PHW mixture (Source Water 2) to prepare the formulation of hydroponic fertilizer instead of tap water. Thus, this source water has both the hydroponic fertilizer and PHW.

2.3.5. Growth Period and Harvesting

After the source water mixtures and grow bins were prepared, the lettuce was grown for 28 days before harvesting. Environmental conditions in the room were controlled and spatially consistent for the experiment duration. During this time, grow bins were inspected daily to observe growth and replace any water lost to evapotranspiration with the prepared source water stock solution. At harvest, the leafy mass of the lettuce was weighed individually and then collected by the source water group and shelf number to be dried for quantifying leaf tissue elemental concentration.

2.4. Analyses

2.4.1. Lettuce Yields

Lettuce yields were determined by measuring the mass of both initial lettuce plugs and final aboveground lettuce tissue for each individual plant. Mass was measured with a Mettler Toledo (Columbus, OH, USA) PL601-S Electronic Scale Balance. The difference in plant mass only accounts for the “above ground” portion of the plant, though the plug measurements also contained the roots and plug media for the mass calculations, as removing the roots and rooting media would damage the plant. For a healthy and fully-grown lettuce plant, the initial mass added from the inclusion of the roots and plug media was assumed negligible compared to the grown mass of the plant.
The net fresh yield is presented as the difference between the fresh mass at harvest minus the fresh mass of the plug at the start of the study. The net fresh yield is important for highlighting how much the lettuce plants grew after exposure to the water treatments, as well as illustrating treatments where the lettuce plants decreased in mass or died. The total dry yield, however, is the average mass across the three bins for each treatment of the dry lettuce at harvest. The plant tissue was dried in a drying oven at 70 °C until a constant mass was achieved. From this, the dry mass of the aboveground plant tissue was recorded.

2.4.2. Metal(loid) Uptake by Lettuce

Dried plant leaf tissue from the harvested lettuce was gathered by grow bin unit and ground for one minute using a blade grinder (80335R Hamilton Beach, Glen Allen, VA, USA) to homogenize and achieve a consistent particle size of dry plant tissue. Ground tissues samples were digested and analyzed for mercury (Hg), lead (Pb), cadmium (Cd), and arsenic (As) by inductively coupled plasma mass spectrometry (ICP-MS) using a Perkin Elmer Nexion 350D at the Microanalysis Laboratory at the School of Life Sciences and the University of Illinois.

2.4.3. Nutrient Element Assay

Nutrients in all aqueous samples were tested at the Water Quality Lab at the Agricultural Engineering Sciences Building. Samples were analyzed for nitrogen (total N and NO3 + NO2) according to automated hydrazine reduction method (Standards Methods 4500-NO3-H, NEMI) and for orthophosphate and total P using the ascorbic acid reduction method (Standard Methods 4500-P-F, NEMI). A portion of the dried plant material was sent to Midwest Laboratories for determination of total N and P.

2.4.4. E. coli/coliforms Testing

The coliform and E.coli indicator organisms were detected and enumerated using 3M PetrifilmTM E.Coli/Coliform Count plates (Product Code 6414). These E.coli/Coliform plates contain Violet Red Bile nutrients, a cold-water-soluble gelling agent, an indicator of glucuronidase activity, and a tetrazolium indicator that facilitate colony detection and enumeration in food and aqueous samples. One milliliter of water was taken from each sample, plated, and incubated at 37 °C for 24 h.

2.5. Source Waters

Based on methods described above, the nutrient and metal(loid) concentrations of the source waters were determined and are presented in Table 2.
Across all source water treatments, no E. coli/coliforms were detected in the water, initially. Therefore, E. coli/coliform testing was not conducted for the lettuce in this experiment, as any contamination would not be due to the water.

2.6. Statistical Analysis

Differences between the treatments were analyzed for significance using a one-way analysis of variance (ANOVA) with post-hoc Tukey Honestly Significant Difference (HSD) for comparing multiple source water treatments. When sample sizes were unequal, the Tukey-Kramer method was used.

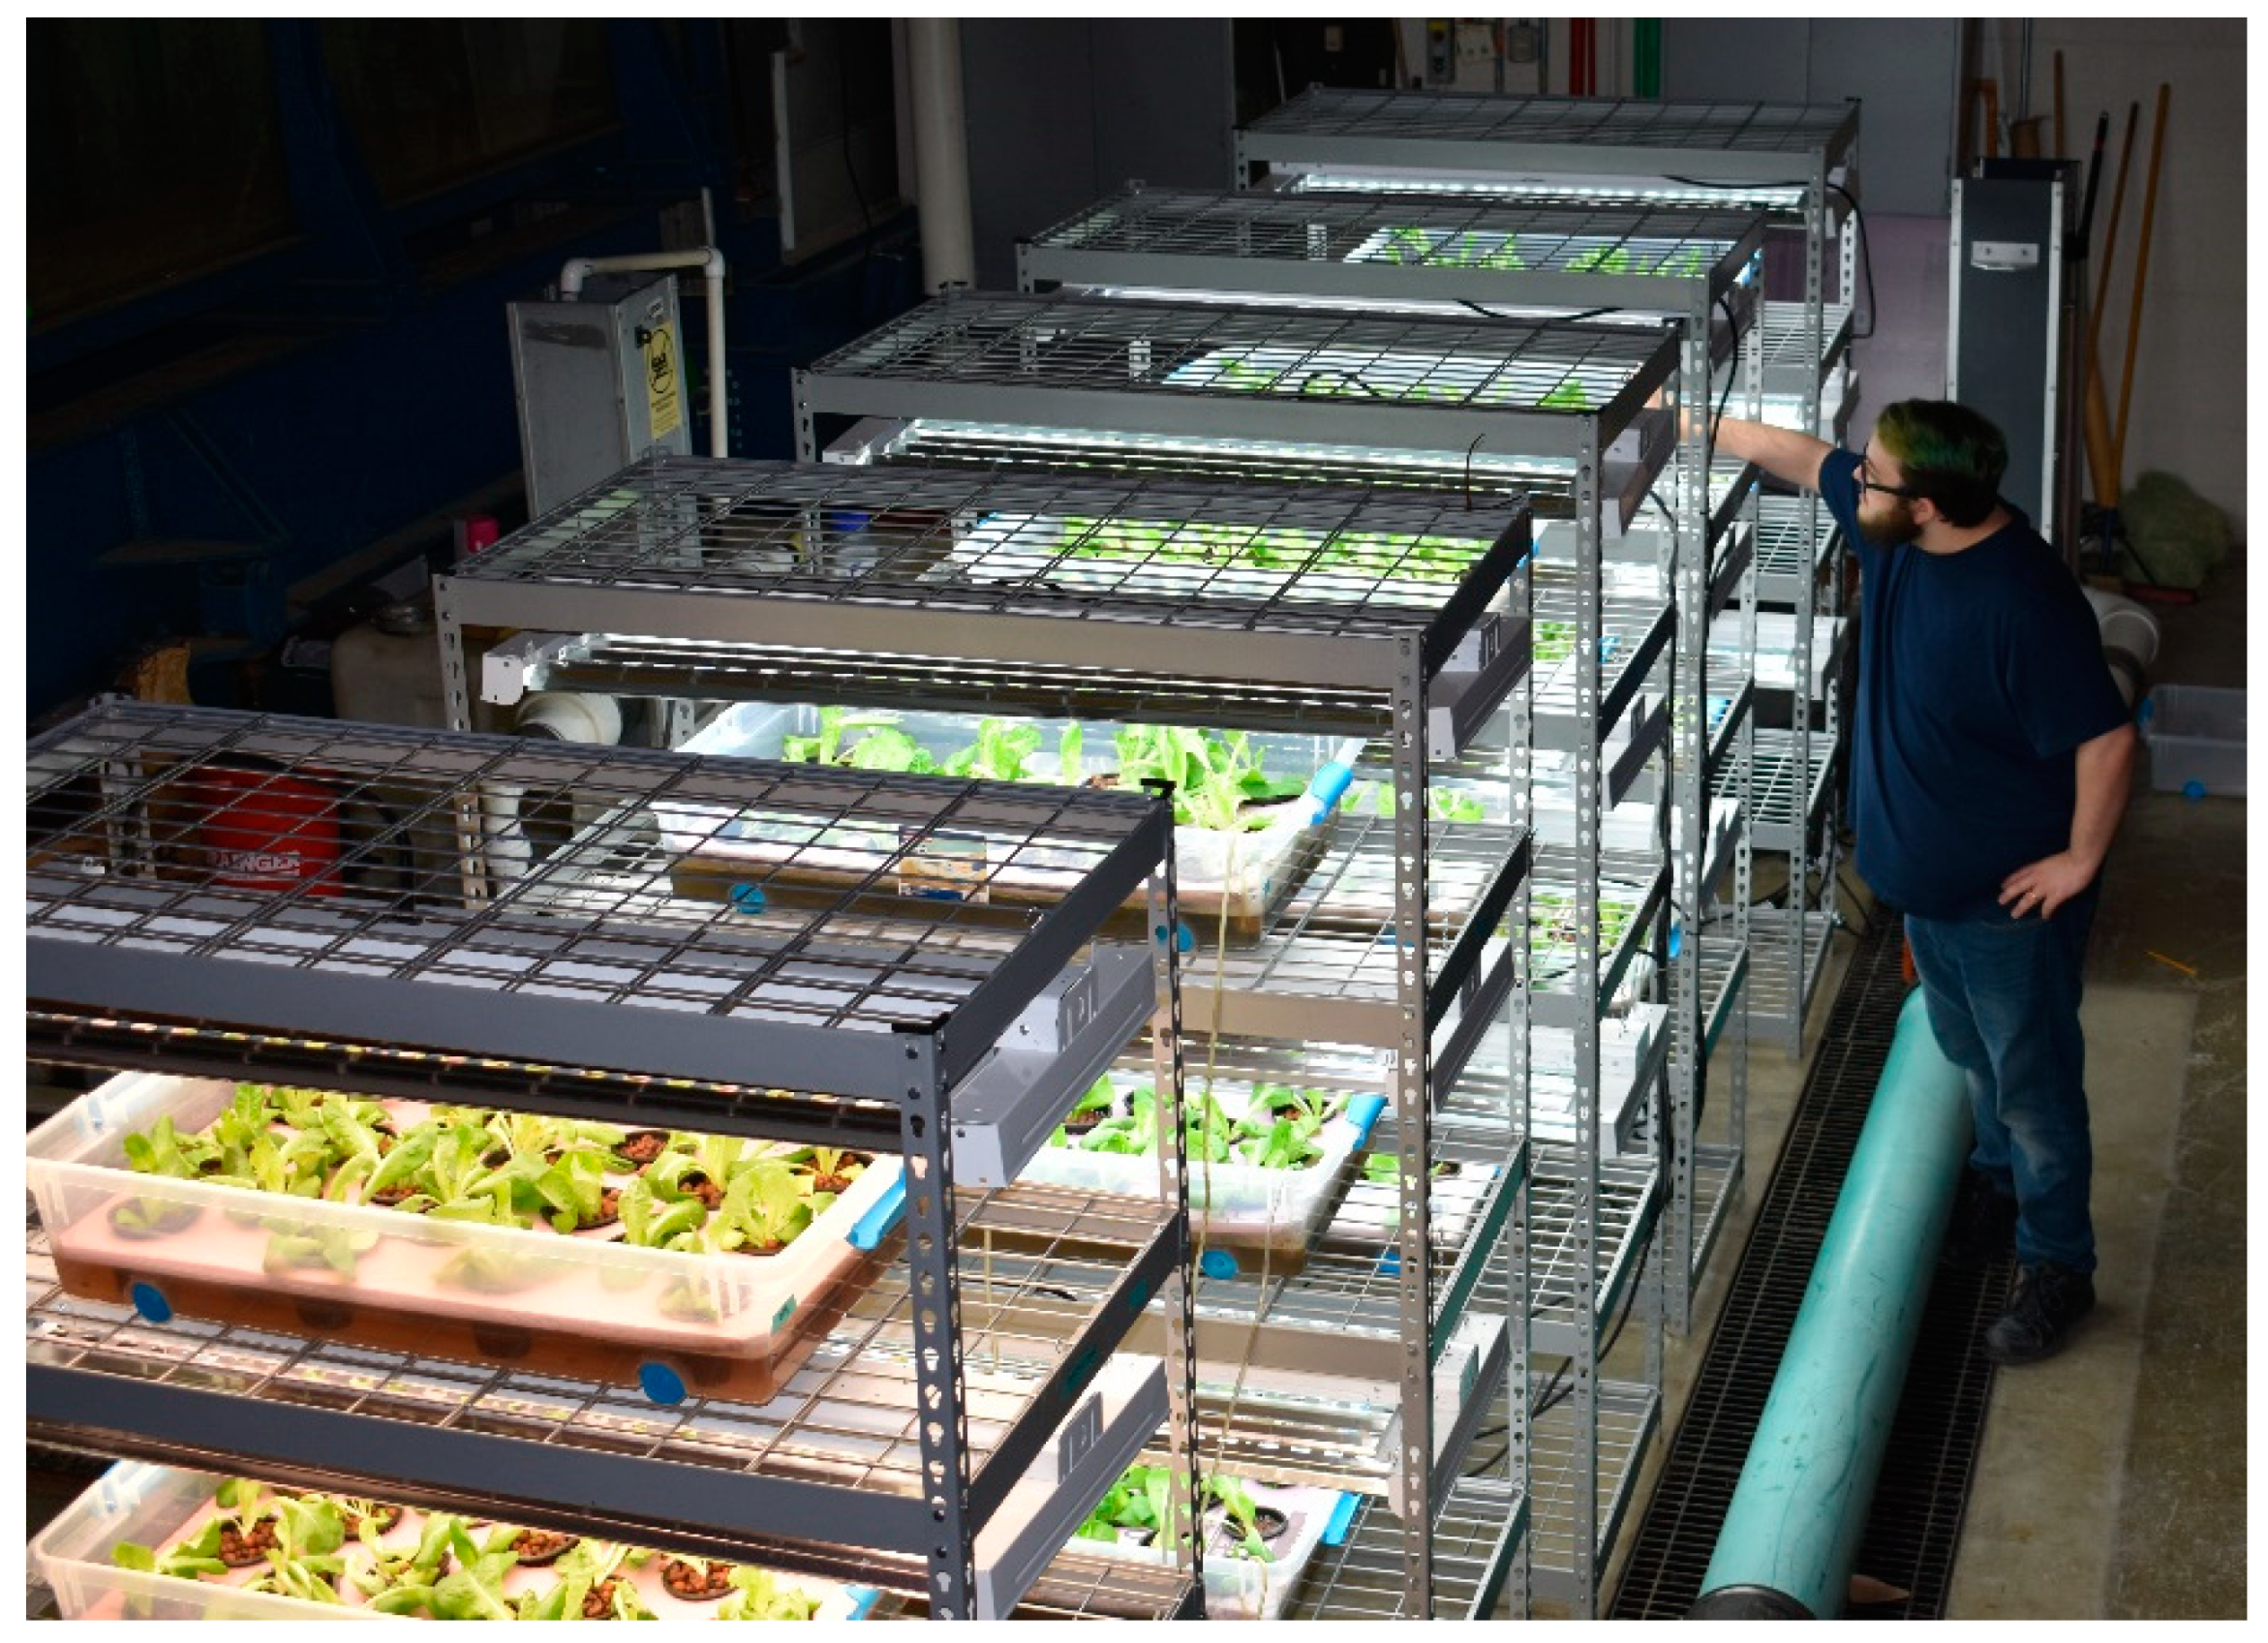
3. Results and Discussion

At the end of the 4-week growing cycle, all lettuce tissue was harvested and each individual plant weighed. The plants were then combined according to bin, dried, and weighed again. The dried plants were analyzed for nutrient content and concentrations of metal(loid)s. Table 3 summarizes the concentrations of metal(loid)s, nutrient content, and yields of lettuce for all five source water treatments.
Table 3 summarizes the average concentrations across the three bins for each source water treatment of cadmium, mercury, lead, and arsenic, as well as the percentage of nitrogen and phosphorus in the dry lettuce tissue at harvest. In addition, the net fresh and total dry yields are provided. The net fresh yield is presented as the difference between the fresh yields at harvest minus the fresh mass of the plug at the start of the study. Source Water 1 (control) had the highest net fresh yield of all five source water treatments; 36.5 times higher than Source Water 2, 163.3 times higher than Source Water 3, 17.7 times higher than Source Water 4, and 1.6 times higher than Source Water 5. Source Water 1 also had the highest total dry yield of all five source water treatments; 3.06 times higher than Source Water 2, 3.5 times higher than Source Water 3, 2.6 times higher than Source Water 4, and 1.3 times higher than Source Water 5. It should be noted that the total dry yield is higher than the net fresh yield for Source Waters 2, 3, and 4, due to desiccation of above-ground biomass of many of the individual lettuce plants. Plants that had lower mass or died allowed for a decrease in net fresh yield, but still contributed to a total dry yield since some plant matter remained. Differences in metalloid concentrations thus appear to be driven by N and P contents of source water via biomass dilution.
The concentration of cadmium was the highest in the lettuce from Source Water 3, at nearly four times higher than Source Water 1 (control). Lettuce from Source Water 3 also had the highest arsenic concentration, which was nearly four times higher than Source Water 1. Lettuce from Source Water 2 had the highest mercury concentration, but it was only slightly higher than Source Water 1. The concentrations of cadmium, mercury, and lead were significantly lower for the lettuce from Source Water 5, even though it was the diluted PHW supplemented with hydroponics fertilizer, which Source Water 1 also received. Therefore, it is a possibility that a compound in the PHW prevented the lettuce from taking up cadmium, mercury, and lead, or perhaps a mechanism of the plant that prevented uptake. The concentrations of mercury and lead were lower for the lettuce from Source Water 4 than Source Water 1.
Lettuce shoot nitrogen and phosphorus contents were nearly identical for Source Water 1 and 5 even though the total dry yield was 1.3 times higher for Source Water 1. The nitrogen content for Source Water 1 was 2.8, 3.0, and 3.6 times higher than Source Waters 2, 3, and 4, respectively. The phosphorus content for Source Water 1 was 6.5, 7.4, and 4.5 times higher than Source Waters 2, 3, and 4, respectively. 
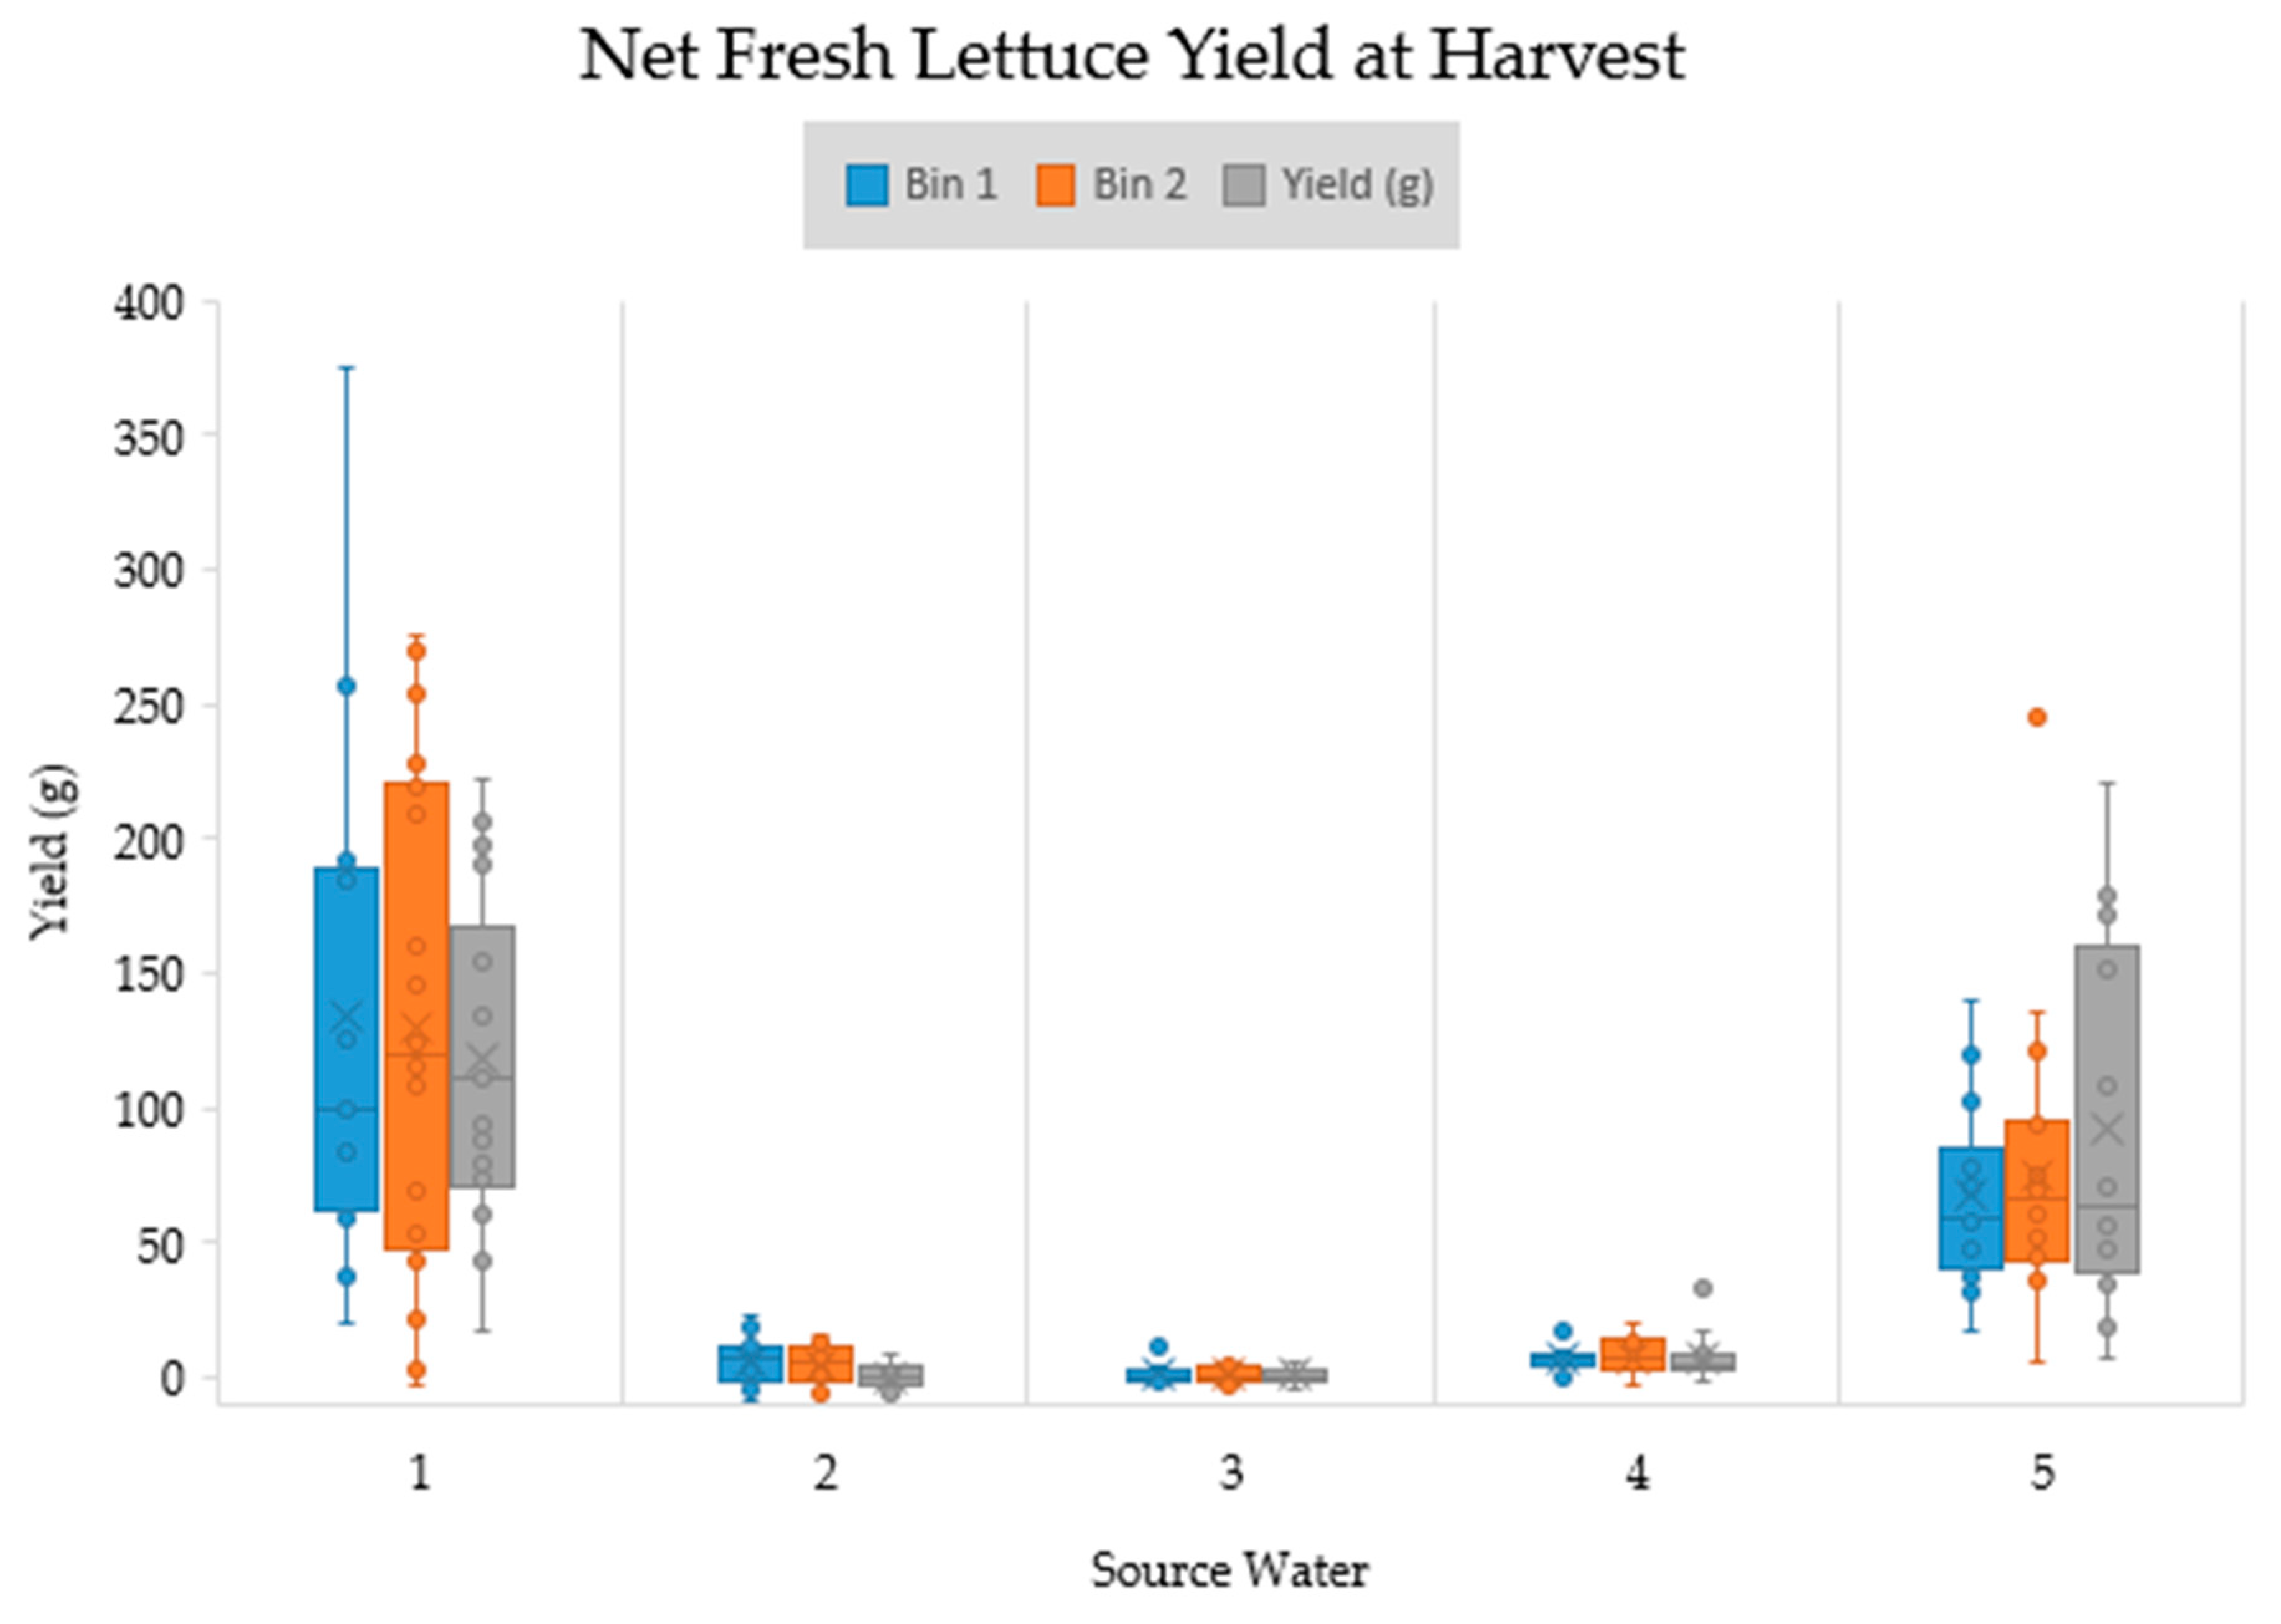
Figure 2 shows the net fresh yields of each bin and for each source water. Therefore, it seems that Source Waters 2, 3, and 4 could have used more nitrogen and phosphorus.
The overall trend is that Source Waters 1 and 5 had relatively lower metal(loid) concentrations, but higher nitrogen and phosphorus concentrations as well as higher fresh and dry weight. This can likely be explained by Source Waters 1 and 5 having sufficient nutrients for normal lettuce growth and thus the lettuce plants in those treatments were able to uptake more nitrogen and phosphorous and produce biomass. Meanwhile, the deficiency in nutrients for Source Waters 2, 3, and 4 likely limited plant growth and could have promoted uptake of metal(loid)s as a byproduct of plant stress. However, between Source Waters 1 and 5, Source Water 1 had a higher uptake of Cd, Hg, and Pb, and yet had higher P uptake and yields, in spite of similar concentrations of the metal(loid)s and nutrients. This finding could be a result of pH imbalance, as pH was not controlled in this study, which can impact the availability of nutrients and other compounds. Alternatively, it could be a result of an unexplored compound in PHW that impacts plant growth. Between Source Waters 2, 3, and 4, higher concentrations of contaminants and nutrients in the source water did not uniformly lead to a higher uptake of those compounds in the plant tissue. However, it is difficult to draw full conclusions from this phenomenon, as the plants were severely deficient in nutrients and already had partially desiccated, which could confound the findings for these source water treatments.
Within each source water treatment, replications had similar distributions for yields. Of the treatments, Source Water 1 had the greatest net fresh yields, followed closely by Source Water 5. Source Waters 2, 3, and 4 all had similar, but extremely poor yields. Table 4 shows the p-values for all source water comparisons of net fresh yield. The significant differences (p < 0.05) are highlighted in red for convenience.
The statistical analysis confirmed that the Source Water 1 net fresh yield was significantly higher than all other treatments and the Source Water 5 net fresh yield was higher than Source Waters 2, 3, and 4. Figure 3 shows the total dry lettuce yield from each bin and for each source water. The average total dry yield is also displayed for all three bins for a given source water with the solid blue bar.
The total dry yield of each individual bin varied slightly. Source Waters 1, 2, and 3 had higher total dry yields from bin 1, which was the bin on the top shelf of the rack. In contrast, Source Waters 4 and 5 had higher total dry yields from bin 3, which was the shelf at the bottom of the rack. It is possible that location of each bin within the rack could have impacted the yields. However, since each treatment had one bin at each level of the rack, this potential variation is accounted for when taking the average of the three bins. Table 5 shows the p-values for all source water treatment comparisons of total dry yield with significant differences (p < 0.05) highlighted in red.
Total dry yield from Source Water 1 and 5 was significantly higher than Source Waters 2, 3, and 4. There was not a significant difference in the total dry yield between Source Waters 1 and 5. This is in contrast to Mazur [28] who did see a significant increase in yields and inferred that PHW can increase grain yields, whereas our lettuce yields with supplemented PHW decreased overall yields. 
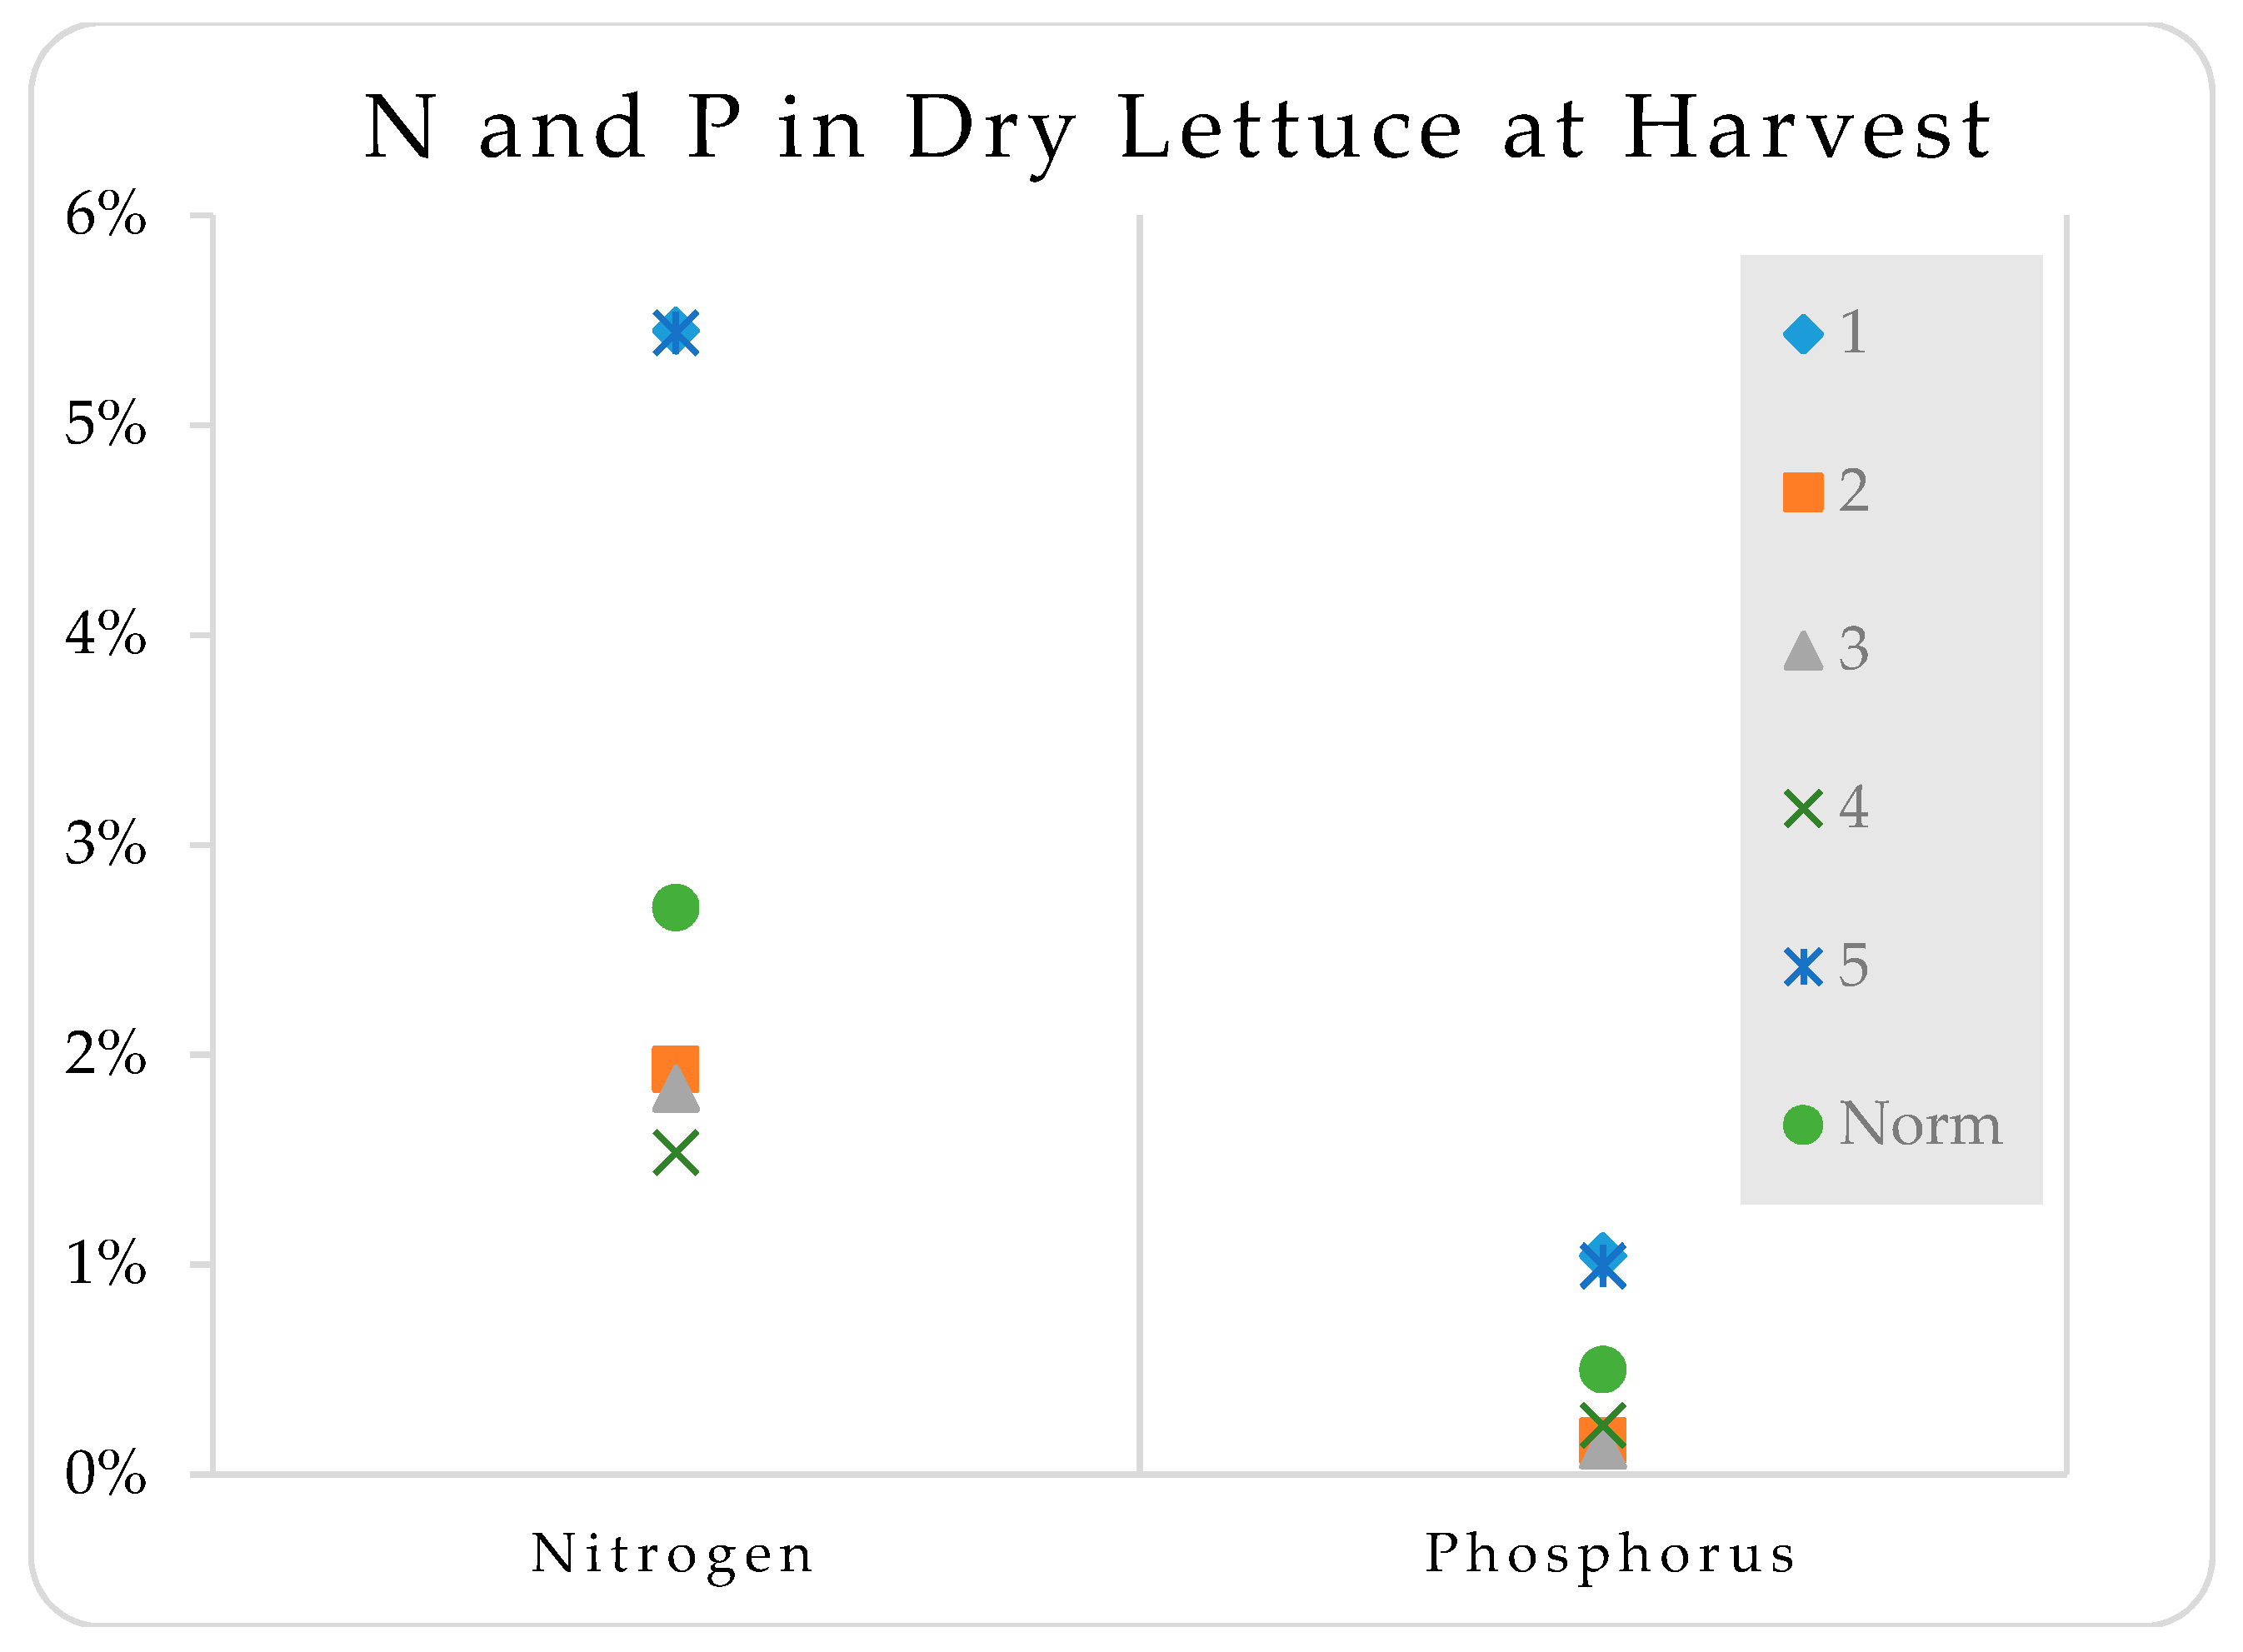
Figure 4 shows the nitrogen and phosphorus contents in the total dry lettuce from each bin and for each treatment. Lettuce leaf nutrient concentration guidelines were provided by Midwest Laboratories as benchmarks of sufficiency for nitrogen and phosphorus.
The nitrogen and phosphorus contents for lettuce harvested from Source Waters 1 and 5 were above the norms, meaning there was sufficient nitrogen and phosphorus, while the lettuce harvested from Source Waters 2, 3, and 4 were below the norms for nitrogen and phosphorus, meaning there was a nitrogen and phosphorus limitation. Table 6 shows the p-values for all source water treatment comparisons of nitrogen and phosphorus content. The significant differences (p < 0.05) are highlighted in red for convenience.
The statistical analysis confirmed that the nitrogen and phosphorus contents in the dry lettuce was significantly greater for Source Waters 1 and 5 than Source Waters 2, 3, and 4. There was no significant different in nitrogen or phosphorus content between Source Water 1 and Source Water 5. Figure 5 shows the concentrations of metal(loid)s in the dry lettuce from each bin and for each source water treatment.
The concentrations of cadmium, mercury, and lead were all below the maximum allowable levels for food as determined by the US Department of Agriculture Foreign Agriculture Service [30] for all five source water treatments. The concentration of arsenic in lettuce from Source Waters 2, 3 and 4, however, were above the maximum allowable level. A study by Eregno et al. [12] involved growing lettuce hydroponically with treated greywater with added human urine and found that lettuce leaves across all treatments were below estimated Health Risk Index and Target Hazard Quotient values and therefore implied to have low health risk for consumption. However, Eregno et al. [12] did report that the HRI for As and THQ for As and Cr were relatively higher than the other metal(loid)s tested, which is similar to our findings for arsenic. Table 7 shows the p-values for all source water treatment comparisons of metal(loid)s content. The significant differences (p < 0.05) are highlighted in red for convenience.
The average concentration of cadmium across the three bins was significantly lower in Source Water 1 than Source Waters 2 or 3 and significantly higher in Source Waters 2 and 3 than Source Water 5. In addition, the average concentration of arsenic across the three bins was significantly higher in Source Waters 3 and 4 than Source Waters 5. 
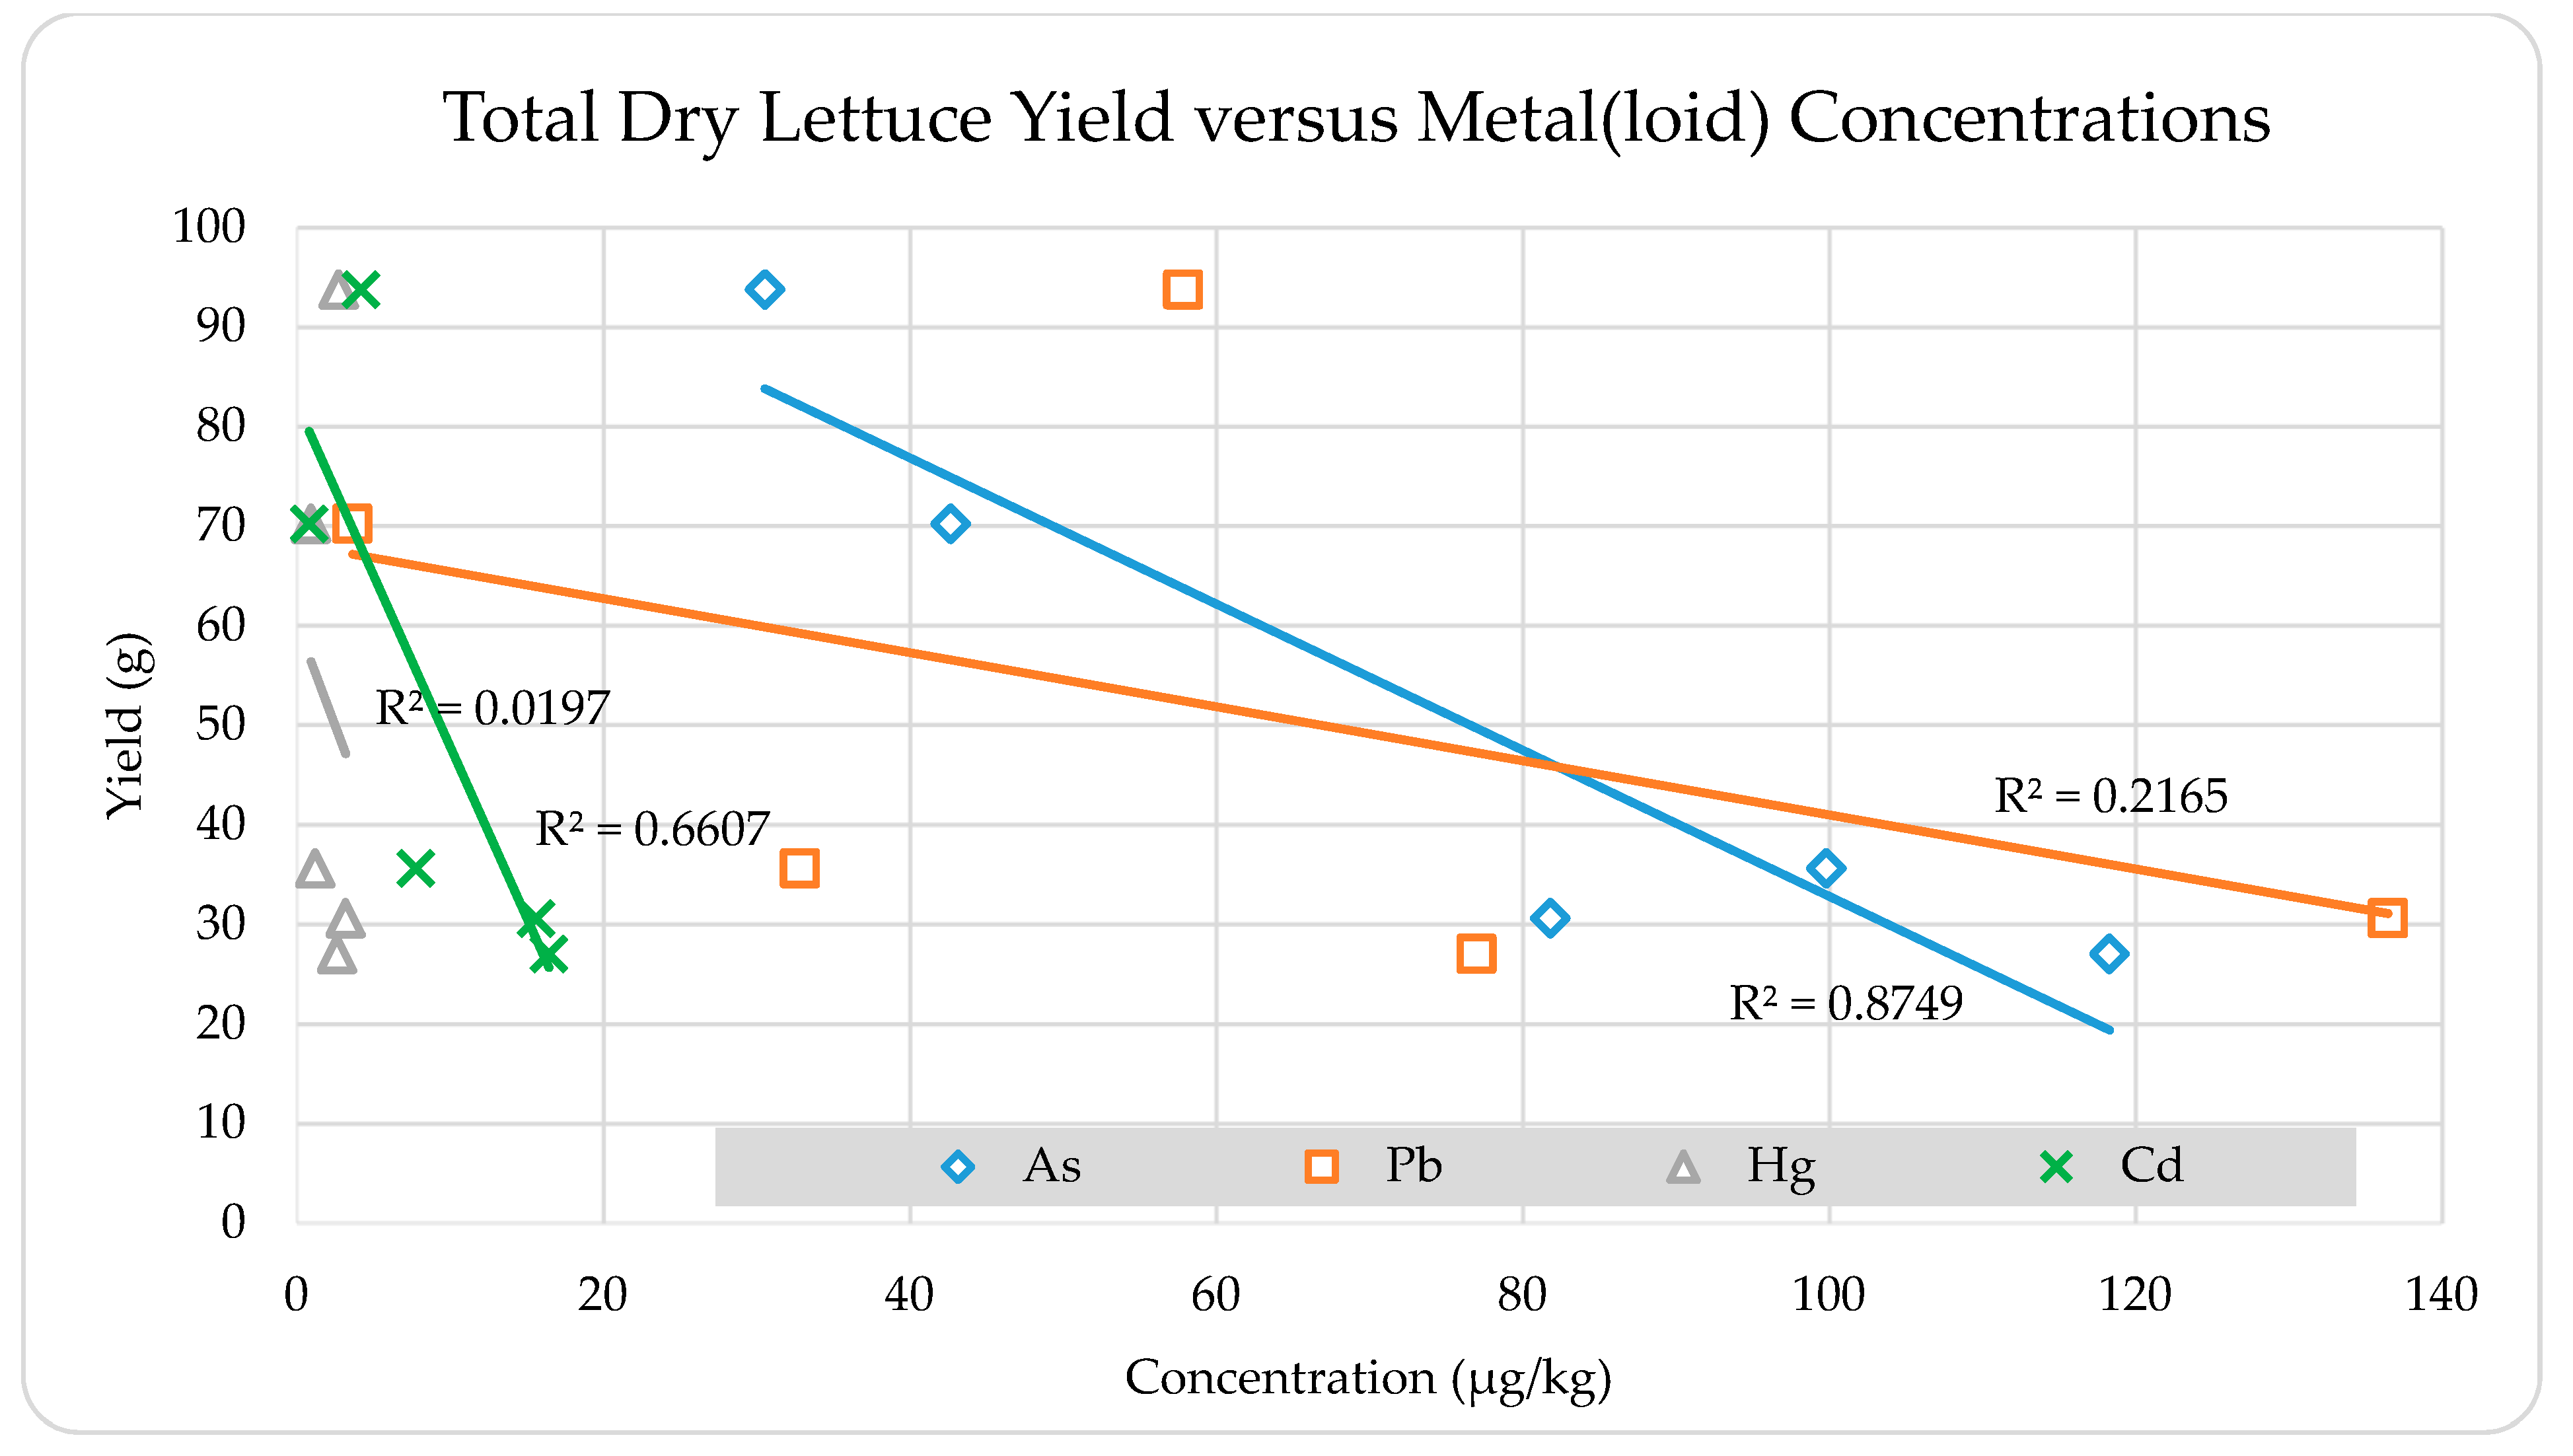
Figure 6 shows a regression analysis between the total dry lettuce yield and metal(loid) concentrations.
There is a negative correlation between lettuce leaf yield and leaf concentrations of all four metal(loid)s, meaning a higher yield led to biomass dilution, in which the load of metal(loid) elements is diluted into more tissue biomass. A strong correlation existed between total dry lettuce yield and arsenic concentration (R2 = 0.8749). A moderate correlation existed between total dry lettuce yield and cadmium concentration (R2 = 0.6607), and relatively weak correlations with lead (R2 = 0.2165) and mercury (R2 = 0.0197). 
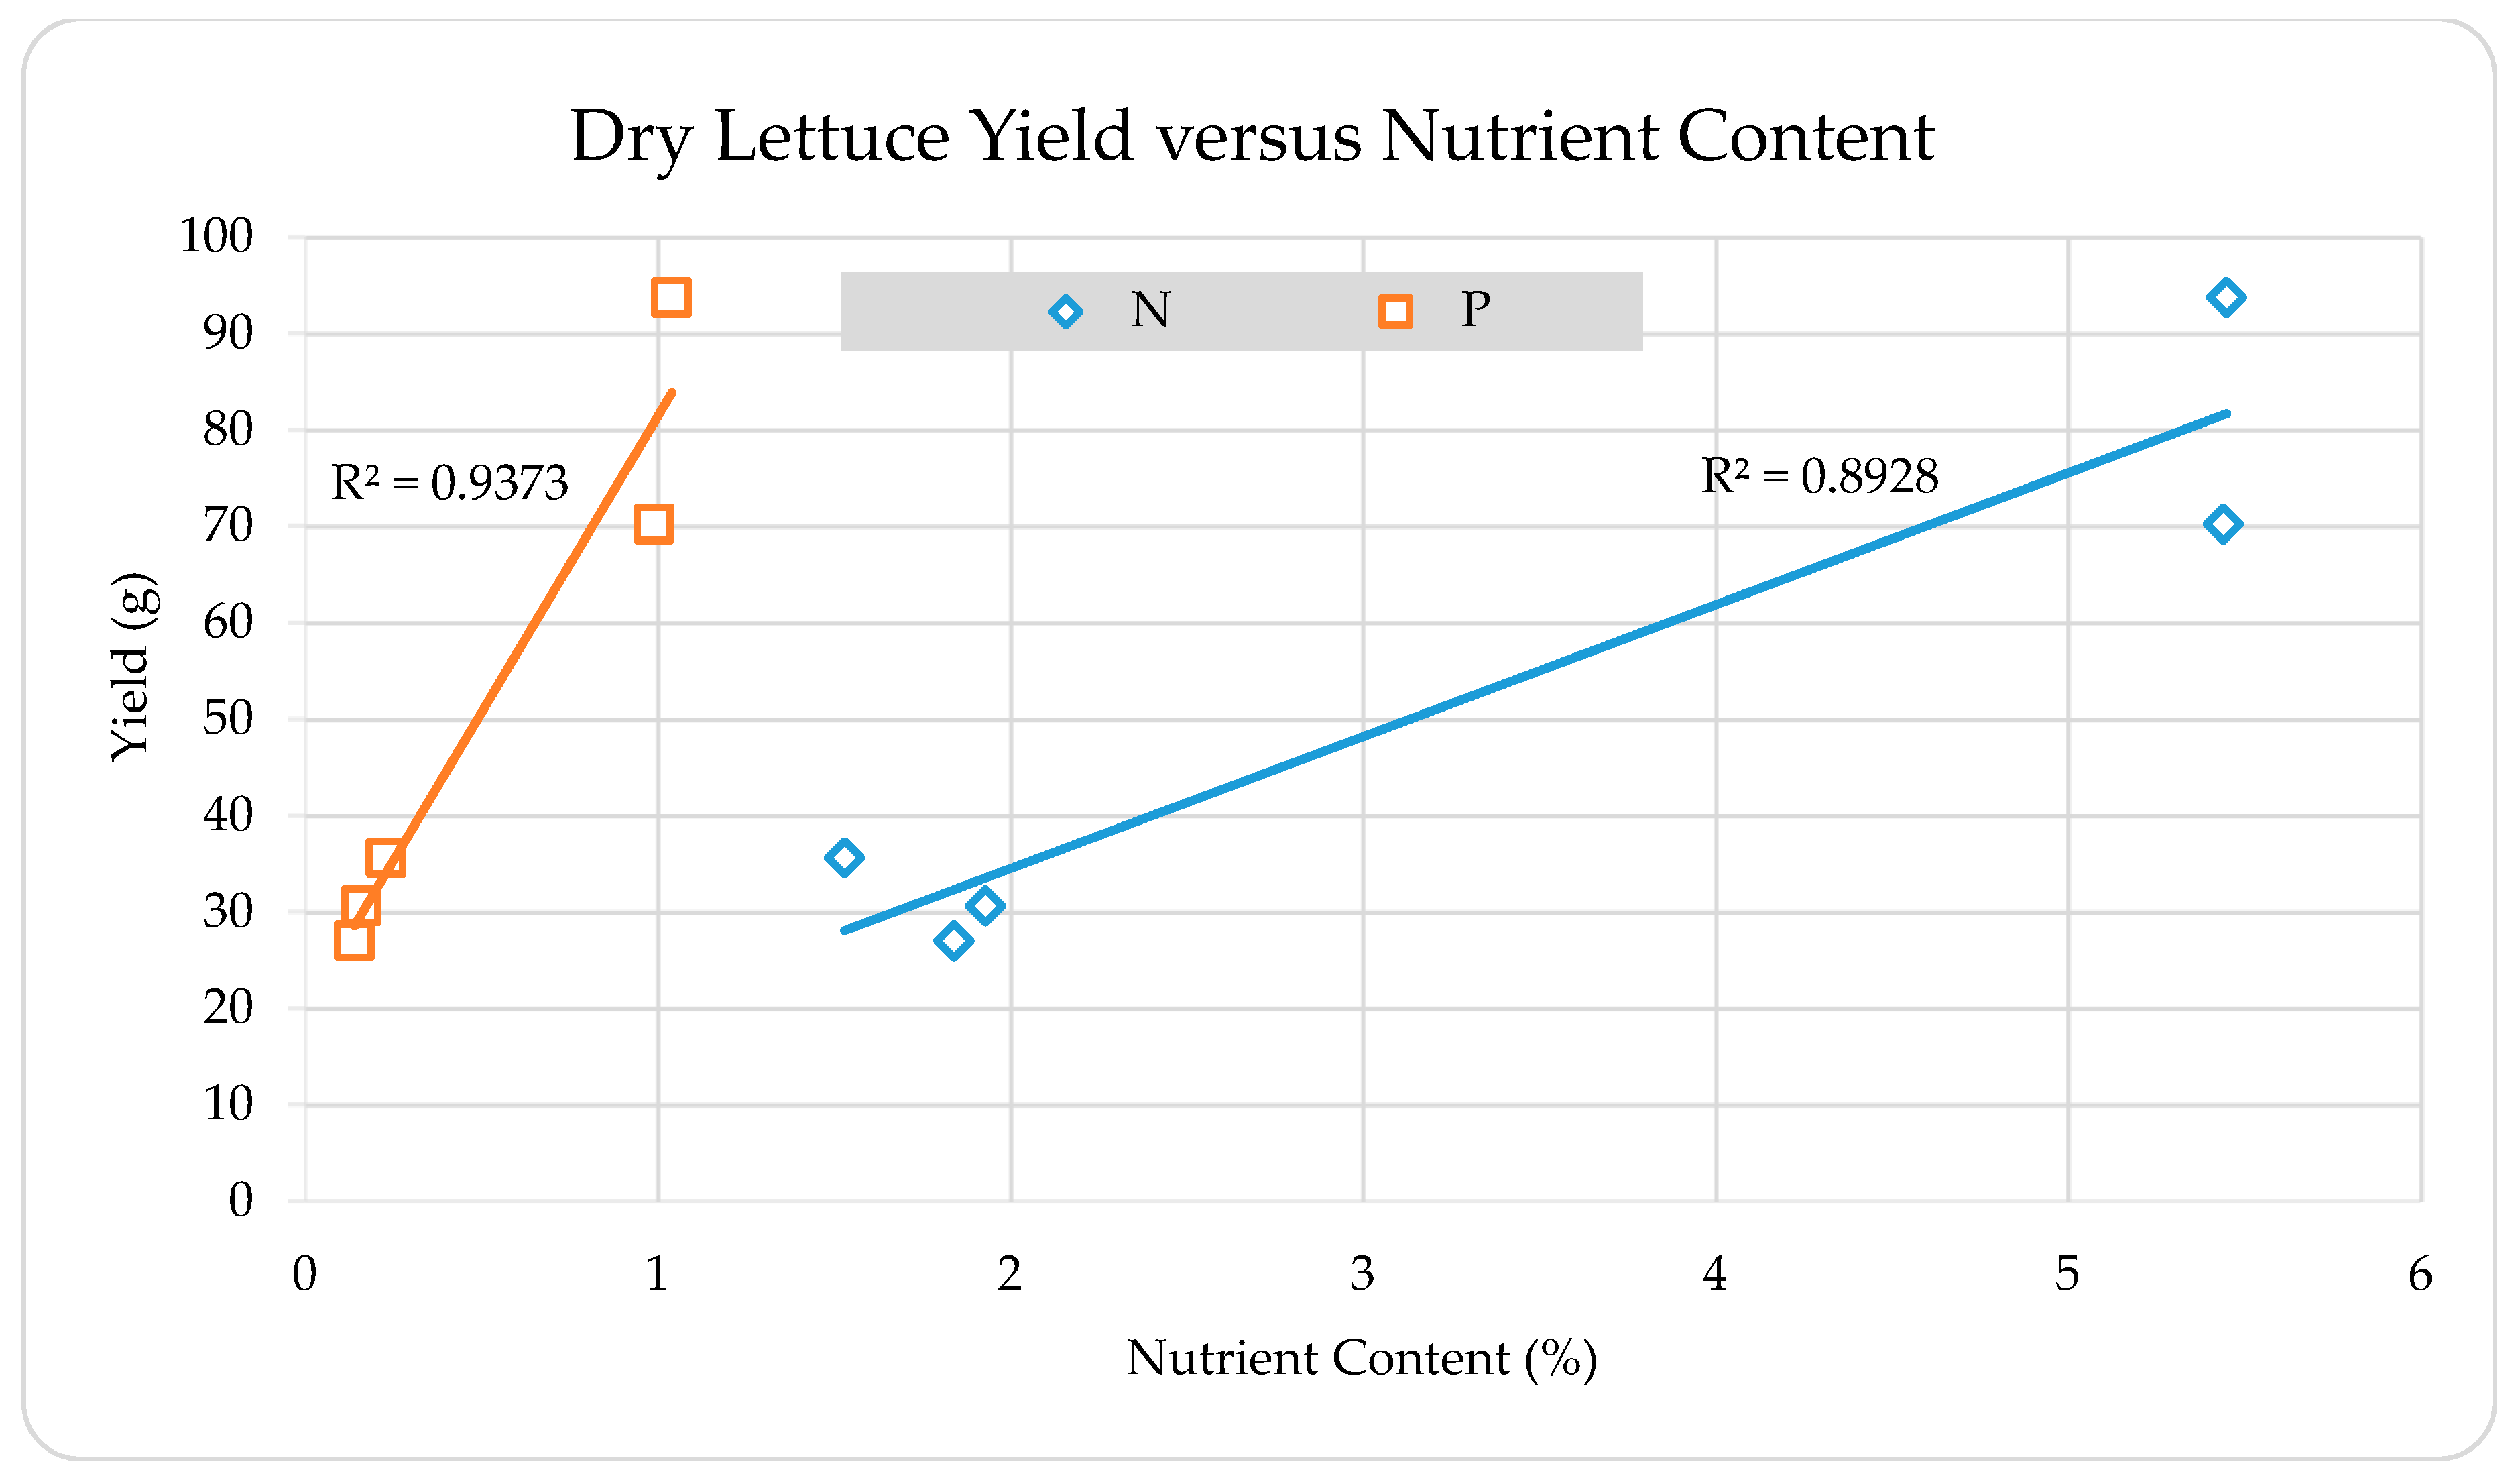
Figure 7 shows a regression analysis between the total dry lettuce yield and nutrient content.
There is a positive correlation between yields and both nitrogen and phosphorus, meaning the total dry yield decreased as the concentrations of each nutrient increased. A strong correlation existed between total dry lettuce yield and both nitrogen (R2 = 0.8928) and phosphorus (R2 = 0.9373).

4. Broader Impacts

Lettuce yields and nutrient concentrations indicate that PHW source waters without supplemented hydroponic fertilizer (Source Waters 2, 3, 4) had significantly lower lettuce yields and nutrient content due to N and P limitation. Therefore, diluted PHW alone is not a sufficient sole nutrient source for meeting N and P needs of hydroponically grown lettuce. However, supplemented PHW and conventional hydroponic fertilizer were not significantly different. Thus, PHW can be used in hydroponic fertilizer formulation without a significant negative impact on yields and nutrition as a source of nitrogen and irrigation water. Still, it was seen that supplemented PHW had overall lower yields and nutrients than hydroponic fertilizer alone, indicating some inhibitory effect in PHW that warrants further investigation. Moreover, N and P supplementation promotes significant increases in the biomass of edible tissue, diluting concentrations of metal(loid)s and thus increasing the utility of PHW for hydroponic crop production from a food safety standpoint.
While the plant tissue analysis shows that arsenic exceeded the maximum allowable concentration for lettuce in Source Waters 2, 3, and 4, these treatments had vastly lower yields and showed extreme symptoms of nutrient deficiency. In other words, one potential implication of this study is that sufficient nutrient supplementation can be used to manage potential metal(loid) accumulation in edible tissues. This means that PHW needs to be supplemented with other nutrients for lettuce cultivation, but when PHW is supplemented, it can produce similar yields and nutrition to conventional hydroponic production.
As HTL is already an attractive technology of biofuel production derived from wastewater, producing hydroponic crops with the PHW byproduct only further increases the incentive to include HTL in the Food-Water-Energy Nexus approach. HTL production facilities could be coupled with hydroponic crop production facilities to address all three pillars of the Food-Water-Energy Nexus and increase the sustainability of the HTL technology.
Further research on PHW as a crop fertilizer should focus on finding methods to convert the nitrogen in PHW into plant-available inorganic forms (e.g., NO3 and NO2), identifying inhibitory compounds in PHW, finding sources of wastewater rich in phosphorous that could complement PHW’s nitrogen concentration, expanding this research to other cultivars of lettuce or other hydroponic crops, and examining the overall nutrient, water, and energy efficiency of the hydrothermal liquefaction process in conjunction with cultivation using PHW.

5. Conclusions

This study evaluated treated PHW source waters for the production of safe hydroponic lettuce. Four PHW source water treatments were compared to synthetic fertilizer in cultivating lettuce. Water containing only hydroponic fertilizer (Source Water 1) had the highest total dry yield of all five treatments. Findings also indicated that while PHW was below the US Department of Agriculture Foreign Agriculture Service maximum levels for cadmium, lead, and mercury in food, the concentration of arsenic was higher than the maximum level for Source Waters 2, 3, and 4, respectively. There was no detectable E. coli or fecal coliforms in any of the treated PHW. While nitrogen was present in the raw PHW, only 0.03% was NO3-N and NO2-N. Diluted PHW supplemented with hydroponic fertilizer had lower lettuce yield than hydroponic fertilizer alone, indicating a potential non-nutrient inhibition of plant growth by PHW.
This study demonstrates the agronomic and food safety potential of PHW for hydroponic production of nutritionally important crops such as leafy greens. Additionally, this study identifies the importance of supplementing source waters with nitrogen and phosphorus for economic crop production as well as to mitigate the risk of metalloids to consumers via biomass dilution.

Author Contributions

Conceptualization, S.J. and P.C.D.; Data curation, S.J. and P.C.D.; Investigation, S.J. and P.C.D.; Methodology, S.J. and P.C.D.; Project administration, P.C.D.; Resources, Y.Z., A.J.M. and P.C.D.; Supervision, P.C.D.; Writing—original draft, S.J.; Writing—review & editing, Y.Z., A.J.M. and P.C.D.

Funding

This research received no external funding.

Acknowledgments

The authors would like to thank Quintin Potthast and John (Jack) Bryant for their assistance with laboratory data collection.

Conflicts of Interest

The authors declare no conflict of interest.

References

  1. Biofuels and Bioproducts from Wet and Gaseous Waste Streams: Challenges and Opportunities; US Dept. of Energy: Washington, DC, USA, 2017; pp. VIII–X.
  2. Akhtar, J.; Amin, N.A.S. A review on process conditions for optimum bio-oil yield in hydrothermal liquefaction of biomass. Renew. Sustain. Energy Rev. 2011, 15, 1615–1624. [Google Scholar] [CrossRef]
  3. Leng, L.; Zhou, W. Chemical compositions and wastewater properties of aqueous phase (wastewater) produced from the hydrothermal treatment of fresh biomass: A review. energy sources, part a: Recover. util. Environ. Eff. 2018, 40, 2648–2659. [Google Scholar]
  4. Peterson, A.; Vogel, F.; Lachance, R.P.; Fröling, M.; Antal, M.J., Jr.; Tester, J.W. Thermochemical biofuel production in hydrothermal media: A review of sub-and supercritical water technologies. Energy Environ. Sci. 2008, 1, 32–65. [Google Scholar] [CrossRef]
  5. Huang, H.J.; Yuan, X.Z. Recent progress in the direct liquefaction of typical biomass. Prog. Energy Combust. Sci. 2015, 49, 59–80. [Google Scholar] [CrossRef]
  6. Ambika, S.R.; Ambika, P.K.; Govindaiah. Crop growth and soil properties affected by sewage water irrigation—A review. Agric. Rev. 2010, 31, 203–209. [Google Scholar]
  7. Jaramillo, M.F.; Restrepo, I. Wastewater reuse in agriculture: A review about its limitations and benefits. Sustainability 2019, 9, 1734. [Google Scholar] [CrossRef]
  8. Christou, A.; Agüera, A.; Bayona, J.M.; Cytryn, E.; Fotopoulos, V.; Lambropoulou, D.; Manaia, C.M.; Michael, C.; Revitt, M.; Schroder, P.; et al. The potential implications of reclaimed wastewater reuse for irrigation on the agricultural environment: The knowns and unknowns of the fate of antibiotics and antibiotic resistant bacteria and resistance genes—A review. Water Res. 2017, 123, 448–467. [Google Scholar] [CrossRef]
  9. Khalid, S.; Shahid, M.; Natasha; Bibi, I.; Sarwar, T.; Shah, A.H.; Niazi, N.K. A review of environmental contamination and health risk assessment of wastewater use for crop irrigation with a focus on low and high-income countries. Int. J. Environ. Res. Public Health 2018, 15, 895. [Google Scholar] [CrossRef]
  10. Barbosa, G.L.; Gadelha, F.D.A.; Kublik, N.; Proctor, A.; Reichelm, L.; Weissinger, E.; Wohlleb, G.M.; Halden, R.U. Comparison of land, water, and energy requirements of lettuce grown using hydroponic vs. conventional agricultural methods. Int. J. Environ. Res. Public Health 2015, 12, 6879–6891. [Google Scholar] [CrossRef]
  11. Olguín, E.J.; García-López, D.A.; González-Portela, R.E.; Sánchez-Galván, G. Year-Round phytofiltration lagoon assessment using pistia stratiotes within a pilot-plant scale biorefinery. Sci. Total Environ. 2017, 592, 326–333. [Google Scholar] [CrossRef]
  12. Eregno, F.E.; Moges, M.E.; Heistad, A. Treated greywater reuse for hydroponic lettuce production in a green wall system: Quantitative health risk assessment. Water 2017, 9, 454. [Google Scholar] [CrossRef]
  13. Adrover, M.; Moyà, G.; Vadell, J. Use of hydroponics culture to assess nutrient supply by treated wastewater. J. Environ. Manag. 2013, 127, 162–165. [Google Scholar] [CrossRef] [PubMed]
  14. Al-Karaki, G.N. Utilization of treated sewage wastewater for green forage production in a hydroponic system. Emir. J. Food Agric. 2011, 23, 80–94. [Google Scholar] [CrossRef]
  15. Pilatakis, G.; Manios, T.; Tzortzakis, N. The use of primary and secondary treated municipal wastewater for cucumber irrigation in hydroponic system. Water Pract. Tech. 2013, 8, 433–439. [Google Scholar] [CrossRef]
  16. Chow, K.K.; Wang, J.Y.; Tay, J.H. Hydroponic cultivation of leafy vegetables in primary and secondary municipal wastewater. Acta Hortic. 2001, 554, 139–146. [Google Scholar] [CrossRef]
  17. da Silva Cuba Carvalho, R.; Bastos, R.G.; Souza, C.F. Influence of the use of wastewater on nutrient absorption and production of lettuce grown in a hydroponic system. Agric. Water Man. 2018, 203, 311–321. [Google Scholar] [CrossRef] [Green Version]
  18. Cui, L.H.; Luo, S.M.; Zhu, X.Z.; Liu, Y.H. Treatment and utilization of septic tank effluent using vertical-flow constructed wetlands and vegetable hydroponics. J. Environ. Sci. 2003, 15, 75–82. [Google Scholar]
  19. Norström, A.; Larsdotter, K.; Gumaelius, L.; Jansen, J.; Dalhammar, G.A. small scale hydroponics wastewater treatment system under Swedish conditions. Water Sci. Tech. 2004, 48, 161–167. [Google Scholar] [CrossRef]
  20. Abeliovich, A.; Azov, Y. Toxicity of ammonia to algae in sewage oxidation ponds. Appl. Environ. Microbiol. 1976, 31, 801–806. [Google Scholar] [Green Version]
  21. Källqvist, T.; Svenson, A. Assessment of ammonia toxicity in tests with the microalga, Nephroselmis pyriformis, Chlorophyta. Water Res. 2003, 37, 477–484. [Google Scholar] [CrossRef]
  22. Konig, A.M.; Pearson, H.W.; Silva, S.A. Ammonia toxicity to algal growth in waste stabilization ponds. Water Sci. Technol. 1987, 19, 115–122. [Google Scholar] [CrossRef]
  23. Tam, N.F.Y.; Wong, Y. Effect of ammonia concentrations on growth of Chlorella vulgaris and nitrogen removal from media. Bioresour. Technol. 1996, 57, 45–50. [Google Scholar] [CrossRef]
  24. Appleford, M.J.; Ocfemia, K.C.S.; Zhang, Y.; Christianson, L.; Funk, T.L.; Dong, R. Analysis and Characterization of the Product Oil and Other Products of Hydrothermal Conversion of Swine Manure, 2005; ASAE Annual Meeting; American Society of Agricultural and Biological Engineers: St. Joseph, MI, USA, 2005; p. 1. [Google Scholar]
  25. Agrawal, S.C.; Gupta, S.R. Survival and reproduction of some blue-green and green algae as affected by sewage water, fertilizer factory effluent, brassica oil, phenol, toluene and benzene. Folia Microbiol. 2009, 54, 67–73. [Google Scholar] [CrossRef] [PubMed]
  26. Guang-Hua, L.; Chao, W.; Xiao-Ling, G. Prediction of toxicity of phenols and anilines to algae by quantitative structure-activity relationship. Biomed. Environ. Sci. 2008, 21, 193–196. [Google Scholar]
  27. Zhou, Y.; Schideman, L.; Yu, G.; Zhang, Y. A synergistic combination of algal wastewater treatment and hydrothermal biofuel production maximized by nutrient and carbon recycling. Energy Environ. Sci. 2013, 6, 3765–3779. [Google Scholar] [CrossRef]
  28. Mazur, Z. The Co-cultivation of Rice and Algae to Improve Process Economics for Algal Biofuel Production. Master’s. Thesis, University of Illinois, Urbana-Champaign, IL, USA, 2016. [Google Scholar]
  29. Jesse, S.D.; Davidson, P.C. Treatment of post-hydrothermal liquefaction wastewater (PHWW) for metals, nutrients, and indicator pathogens. Water 2019, 11, 854. [Google Scholar] [CrossRef]
  30. Butterworth, J.; Bugang, W. Maximum levels of contaminants in foods. In Global Agriculture Information Network Report Number CH6064; United States Department of Agriculture Foreign Agricultural Service: Washington, DC, USA, 2006; pp. 1–11.
Figure 1. Photograph of full hydroponic system during lettuce growing cycle.
Sustainability 11 03605 g001
Figure 2. Net fresh yield of lettuce during experiment plotted according to the fertilizer used over the 4 weeks of growth for each replication performed. The cross represents mean, center bar represents median, upper and lower limits of the box represent the upper and lower quartiles, and whiskers represent the range of the data, with outliers outside of the whiskers.
Sustainability 11 03605 g002
Figure 3. Total dry yield of lettuce at harvest for the 5 different source waters. The individual yield for each bin is provided, in addition to the average of the three bins.
Sustainability 11 03605 g003
Figure 4. Percent nitrogen and phosphorus in the dry lettuce for each source water treatment. Norms are from Midwest Laboratories for sufficient element composition for adult lettuce plant tissue.
Sustainability 11 03605 g004
Figure 5. Comparison of the concentration of metal(loid)s in the lettuce at harvest for the 5 different source water treatments. The maximum allowable levels, as set by the US Department of Agriculture Foreign Agriculture Service, is also included for comparison [30].
Sustainability 11 03605 g005
Figure 6. Correlation between dry lettuce yield and metal(loid) concentrations. The R2 values are provided for each best fit line.
Sustainability 11 03605 g006
Figure 7. Correlation between dry lettuce yield and nutrient content. The R2 values are provided for each best fit line.
Sustainability 11 03605 g007
Table 1. Descriptions of the five source waters used in this study.
Source Water NumberSource Water Description
1Hydroponic fertilizer
22.5% PHW with sand filtration
32.5% PHW with sand+carbon filtration
42.5% PHW with nitrification and sand filtration
52.5% PHW with sand filtration and supplemented with hydroponic fertilizer
Table 2. Average concentrations of nutrients and metal(loid)s in the water prior to lettuce being grown.
Source WaterNO3-N + NO2-N mg/LTotal N mg/LPO4-P mg/LTotal P mg/LCd µg/LHg µg/LPb µg/LAs µg/L
1193.38211.2029.3029.300.260.002.451.86
20.008.550.090.100.080.003.068.18
30.001.360.420.430.130.002.756.75
40.0020.580.050.180.540.000.502.21
5193.38219.7429.3929.400.260.302.192.13
Table 3. Summary table of concentrations of metal(loid)s, nutrient content, and yield of lettuce for each of the five source water treatments.
Source WaterConcentrations of Metal(loid)s in Dry Leaf Mass (µg/kg)Nitrogen and Phosphorus (%)Net Fresh Yield (g)Total Dry Yield (g)
CdHgPbAsNP
14.202.7457.8630.565.45%1.04%127.3493.67
215.603.19136.5081.811.93%0.16%3.4930.60
316.452.6377.01118.321.84%0.14%0.7827.00
47.761.2132.8699.851.53%0.23%7.1935.57
50.810.933.6442.695.44%0.99%78.2570.20
Table 4. Significant differences in fresh mass (yield) between source waters. Significant differences (p < 0.05) are highlighted in red.
Source Water 1Source Water 2p-Value
120.001
130.001
140.001
150.001
230.900
240.900
250.001
340.900
350.001
450.001
Table 5. Significant differences in total dry mass (yield) between source waters. Significant differences (p < 0.05) are highlighted in red.
Source Water 1Source Water 2p-Value
120.001
130.001
140.001
150.060
230.900
240.900
250.002
340.755
350.001
450.006
Table 6. Significant differences in N and P content in the dry leaf mass between source waters. Significant differences (p < 0.05) are highlighted in red.
Source Water 1Source Water 2NP
120.0010.001
130.0010.001
140.0010.001
150.9000.900
230.9000.900
240.0600.672
250.0010.001
340.1850.457
350.0010.001
450.0010.001
Table 7. Significant differences in metals concentrations in the dry leaf mass between source waters. Significant differences (p < 0.05) are highlighted in red.
Source Water ASource Water BCdHgPbAs
120.0420.9000.6690.073
130.0290.9000.9000.003
140.8040.4980.9000.014
150.8300.3500.8800.900
230.9000.9000.8340.264
240.2100.2770.4530.797
250.0090.1810.2420.213
340.1460.5610.9000.784
350.0060.4080.7140.008
450.3030.9000.9000.042

