Article

Bibliometric Analysis on Smart Cities Research

1
School of Economics and Management, Shanghai Maritime University, 1550 Haigang Ave, Shanghai 201306, China
2
College of Foreign Languages, Shanghai Maritime University, 1550 Haigang Ave, Shanghai 201306, China
*
Author to whom correspondence should be addressed.
Sustainability 2019, 11(13), 3606; https://doi.org/10.3390/su11133606
Submission received: 20 May 2019 / Revised: 17 June 2019 / Accepted: 26 June 2019 / Published: 30 June 2019

Abstract

:
Smart cities have been a global concern in recent years, involving comprehensive scientific research. To obtain a structural overview and assist researchers in making insights into the characteristics of smart cities research, bibliometric analysis was carried out in this paper. With the application of the bibliometric analysis software VOSviewer and CiteSpace, 4409 smart cities were identified by the core collection of the Web of Science in publications between 1998 and 2019 and used in the analysis of this paper. Concretely, this research visually demonstrates a comprehensive overview of the field relating to smart cities in terms of the production of regular publications, main domain of smart cities researchers, most influential countries (institutions, sources and authors), and interesting research directions in the smart city researches. We also present the research collaboration among countries (regions), organizations and authors based on a series of cooperation analyses. The bibliometric analysis of the existing work provided a valuable and seminal reference for researchers and practitioners in smart cities-related research communities.

1. Introduction

Smart cities have been in the spotlight for the last few decades, due to dramatic urbanization all over the world [1]. It has attracted a great deal of interest from many researchers who focus on urban management or construction technologies and witness the exponential research growth in the field. Under such a scenario, obtaining a clearly structured overview from the wealth of information is a key problem in finding potential areas in smart city researches [2].
What is a smart city? A simplistic explanation is that a smart city is a place where traditional networks and services are made more flexible, efficient, and sustainable with the use of information, digital, and telecommunication technologies to improve the city’s operations for the benefit of its inhabitants [3]. Smart cities are widely seen as localities that actively embrace new technologies to achieve desired urban outcomes [4]. However, the concept of a smart city is not new. Different view are found in literature regarding the origin of the concept of a ‘smart city’. Some consider the roots of the smart city date back to the 1960s under the ‘cybernetically planned cities’, while others thought the smart city figured in proposals for networked cities since the 1980s [5]. According to Bibri and Krogstie, the term was first coined in the mid-1800s to describe the new cities of the American West that were efficient and self-governed [5]. Neirotti et al. stated that the smart city had its contemporary origins in the ‘smart growth’ movement of the 1990s which referenced sustainable urbanization and the smart growth movement [6,7]. The concept “smart city” was introduced in 1994 when probing into the question of how to transform a slumbering city into a smart city with telecommunication service [8]. Since the 1990s, almost all forms of technology-based innovations in city planning, development, operation and management were closely associated with the concept of a smart city [7]. For example, smart-growth communities intend to reduce environmental impacts, or smart growth land achieved bus route efficiency [9,10]. Along with the development of information and communication technology (ICT), E-governance has been widely used and researched in city economic development, infrastructure, energy, service delivery, health care, and so forth [3,5,11]. Thus, ICT were enabling factors for transforming traditional cities into smart cities [3].
The label “smart city” was a fuzzy concept and used in ways that were not always consistent [12]. Up till this day, there is no canonical or universally agreed upon definition [5]. A range of conceptual variants are often obtained by replacing “smart” with alternative adjectives, for example, “cyberville”, “digital city”, “electronic city”, “flexicity”, “information city”, “telicity”, “wired city”, and “smart city” [3,12]. The definition of smart city was often context-dependent; different groups had a different take on the concept as they saw it from different lenses such as disciplinary, practice or conceptualization-orientation, and domain-orientation (e.g., technology, economy, society, environment, governance, etc.) [5,6]. In essence, those complex definitions of a smart city could be categorized into two mainstream approaches: 1) technology domains such as the Internet of Things (IoT) and big data (BD) which has matured enough to make smart cities efficient and responsive and allowed smart cities to emerge. The technologies enabled buildings, energy grids, natural resources, water management, waste management, mobility, and logistics worldwide to become ‘smart’; 2) people-oriented approach including soft factors such as participation, education, culture, policy innovations, social inclusion, government, safety, and cultural heritage [3,5,12].
The stream of academic, commercial and (inter)national organizations researching on and practicing smart cities has led to a growth in literature on smart cities, including a continuously growing body of research within academic journals as well as books and conference proceedings [6,13]. The amount of scientific literature available on smart city research is becoming overwhelming, which makes it challenging for researchers and practitioners to have a comprehensive, structured overview of relevant information [1,14]. Many scholars have already conducted a great number of review studies on smart urban governance, urban planning, energy technologies, IoT, sustainable development, and the trends, architecture, components, and open challenges of smart cities [4,5,15,16,17]. Literature reviews on smart-city-supporting technologies such as BD, Cloud Computing and Edge Computing were also abundant [18,19,20]. Ethics and law in the IoT world began to be concerned [21]. The tool enabling researchers, supporting policy makers’ understanding, is the bibliographic technique. The bibliographic technique is defined as the quantitative analysis (in mathematical and statistical ways) of publications. Bibliographic technique focuses on mapping the publication history, the characteristics and the development of scientific output within a specific field of research [22,23]. On the one hand, bibliometric methods are useful for identifying and quantifying cooperation patterns between the performance and research patterns of authors, journals, publications, countries and institutes, and on the other hand, they are used to assess their contribution on specific topics [23,24]. Bibliometric methods could be applied at levels of titles, keyword lists, summaries of publications, or even the entire citation record to get the specific topics and subject categories allocated to publications [25]. The co-occurrence of keywords could not only give an indication of the variety of research themes, but also identify the multidisciplinary character and directions (areas/sub-areas) for further development of a research domain [25,26]. In light of bibliometric methods, the latest advances, leading topics, current gaps in a certain field of research discipline could be drawn vividly as well as geographically. That is another reason the bibliometric method plays a crucial role in the decision-making process related to science, for example, in scientific research funding [23,27].
In this paper, bibliometric analysis was carried out on smart city research. It is becoming a consensus that a smart city is an urban environment that utilizes ICT and other related technologies to enhance performance efficiency of regular city operations (the local economy, transport, traffic management, environment, interaction with government, etc.) and the quality of services (QoS) provided to urban citizens [1,13]. More and more academic journals, books and meetings focus on the research of smart cities, since smart cities and various stakeholders are closely correlated. Moreover, there are a lot of benefits and challenges accompanying the implementation of smart cities [13]. Currently, with the comprehensive application of ICT such as IoT, BD, artificial intelligence (AI), mobile Internet, etc., smart cities are the best objective to achieve those goals. Tremendous supportive technologies such as ubiquitous computing (UC), wireless sensor networks (WSN), and machine–to–machine (M2M) communication has further strengthened smart cities: smart mobility, smart living, smart environment, smart citizens, smart government, smart manufacture, smart architecture as well as other related concepts.
Despite those studies, most of these analyses only focus on a certain perspective. Overall visual bibliometric analysis is still very rare. This paper intends to provide a macroscopic overview on the main characteristics of smart city publications based on a bibliometric analysis. Clear informative pictures presented in this paper demonstrate the research achievements in the domain of the smart city, which could help researchers and practitioners identify the underlying impacts from authors, journals, countries, institutions, references, and research topics.

2. Data and Methods

The datum was retrieved from the core collection of Web of Science (WoS) on May 10, 2019. WoS is one of the most famous scientific citation index databases in the world [1,28]. Labels like cyber city, virtual city, digital city, wired city, electronic city, flexicity, information city, telicity and techno-city were posted on those cities fueled by ICT until the largest abstraction label smart city was proposed [3,29,30,31]. In this study, the “smart city” related keywords were searched in the topic field, and the results showed that the publications first appeared in 1998 [32,33]. The search terms and strategy of smart city research are displayed in Figure 1.
In stage 1, 4409 publications related to smart cities were identified. Among those publications, the three main document types were: article (n = 4222, 95.76%), review (n = 187, 4.24%), proceedings papers (n = 176, 3.99%), and other types like letters and editorial material were less than a hundred.
Exported records from WoS contained abundant information (full record and cited references exported to text files), for example, publication year, authors, addresses of the authors, title, abstract, source journal, subject categories and references [23]. Thus, comprehensive data derived from stage 1 could be effectively used to carry out the bibliometric analysis and information visualization in step 2.
The internationally widely-used free bibliometric analysis software VOSviewer (Visualization Of Similarities) was applied to analyze and visualize the relationships among the authors, countries, journals, co-citations and terms [25]. Another free software, CiteSpace, developed by Chaomei Chen was also employed in this study [34]. CiteSpace is widely used in visualizing patterns and trends in scientific literature. It combines functions such as: drawing visual co-citation maps, separating co-citation networks, finding turning points, searching key nodes, and analyzing the evolution of the area [34]. In this study, keyword citation bursts were accomplished with CiteSpace.

3. Results and Discussion

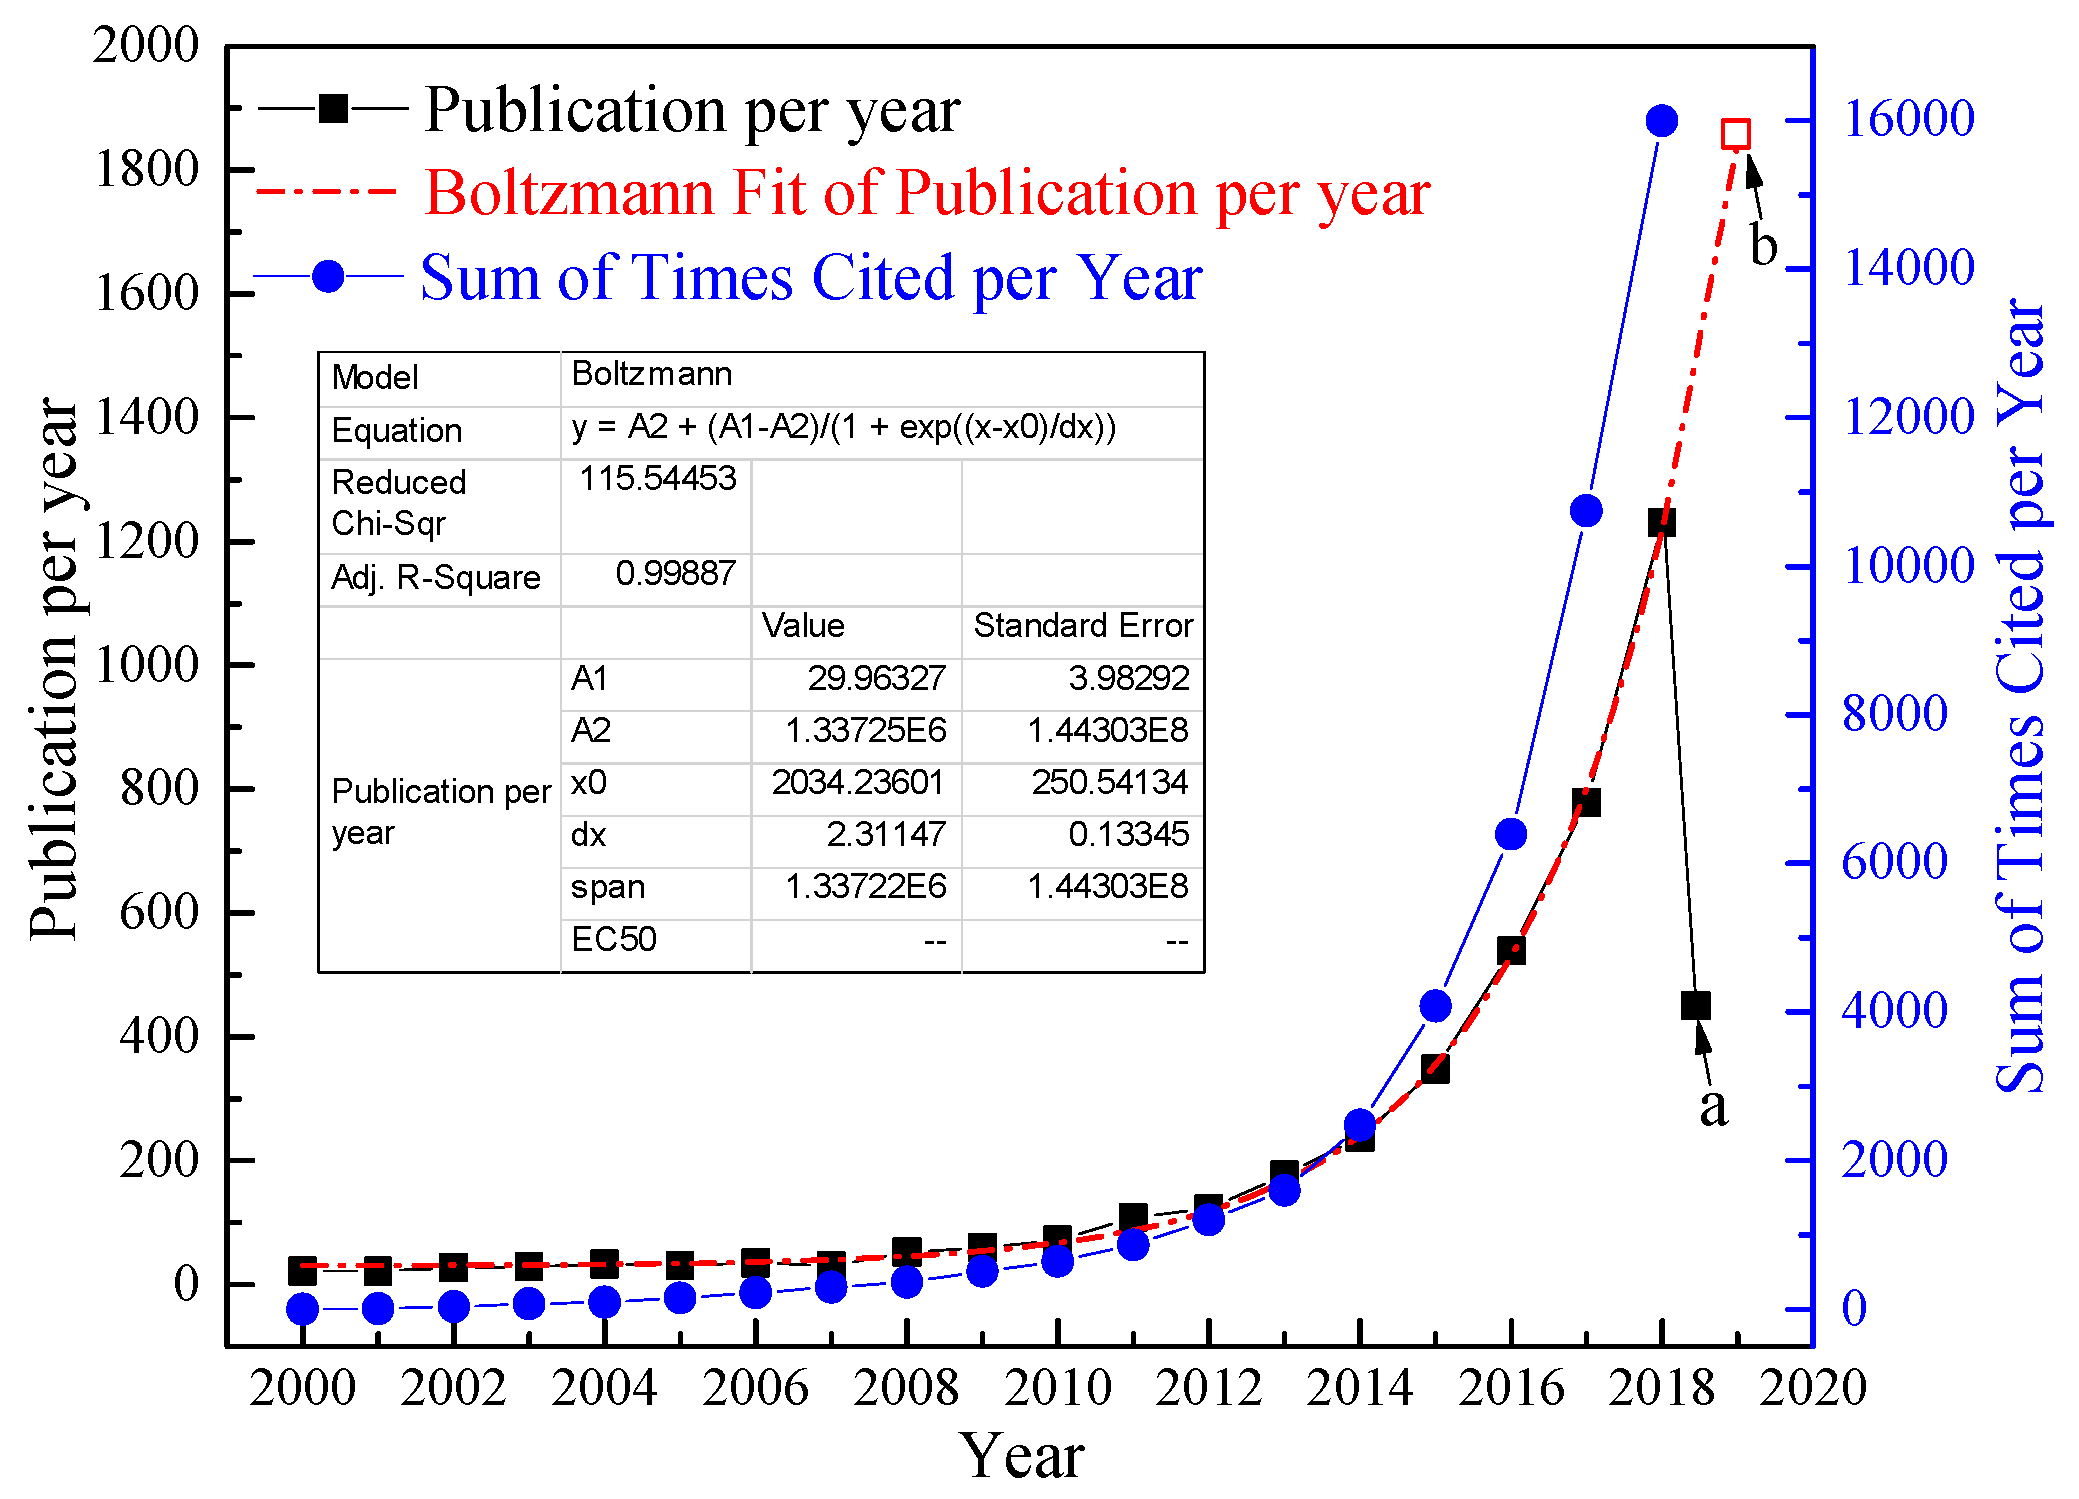
3.1. Publication Output and Growth Trend

The quantity of the publications is an important indicator that reveals the development trends of scientific research. The records of how often articles are cited as the source by others measures the quality of publications. Figure 2 depicts a chronological view on volume of articles published and cited on smart cities.
The cumulative progression of Figure 2 illustrates the obvious increase from 2000 to 2018. Although the time coverage of core collection of the WoS was 1986–present (last updated May 08, 2019), only the years when the annual publication output of smart cities research was over 10 were summarized. To clarify, there were three papers that focused on intelligent traffic; one paper was published in 1998 and two papers were published in 1999 [35,36,37]. Related to the operation of the smart city projects and supported by the European Union since 2010, the number of publications regarding smart cities considerably increased [38,39]. In the meantime, up to May 8, 2019, there were 450 papers published in 2019. By utilizing a nonlinear fit [40] (Boltzmann model, see Figure 2. R2 = 0.9989) of publications from the year 2000 to 2008, the predictive publications of 2019 were calculated as 1862. It could also be predicted that the quantity of the scientific papers on smart cities research will increase at a high speed in the near future.
A question which merits attention is that, among the 4409 publications, which publications contributed outstandingly? Thus, the top 10 publication output sources, authors, organizations, and countries were tallied up in Table 1.
In Table 1, special attention needs to be paid to some cases. When analyzing the most productive authors on smart cities, for example, when employing rules for abbreviation of Chinese names, the name “ZHANG Y” stands for 10 names in this study, such as: “Zhang, Yan (6 times)”, “Zhang, Yi (5 times)”, “Zhang, Yue (3 times)”, “Zhang, Ying (3 times)”, “Zhang, Yong (2 times)”, “Zhang, Yang (2 times)”, “Zhang, Yaou”, “Zhang, Yuan”, “Zhang, Yu” and “Zhang, Yao”, and some of them kept a co-author relationship with other authors. This situation may sometimes mislead readers to understand who contributed the most. Maybe it would be better when the full names are visualized, as in Figure 5.
The publication output and growth performance could be partly explained by the fact that, globally, governments were struggling to accommodate the rising development problems in urban expansion.

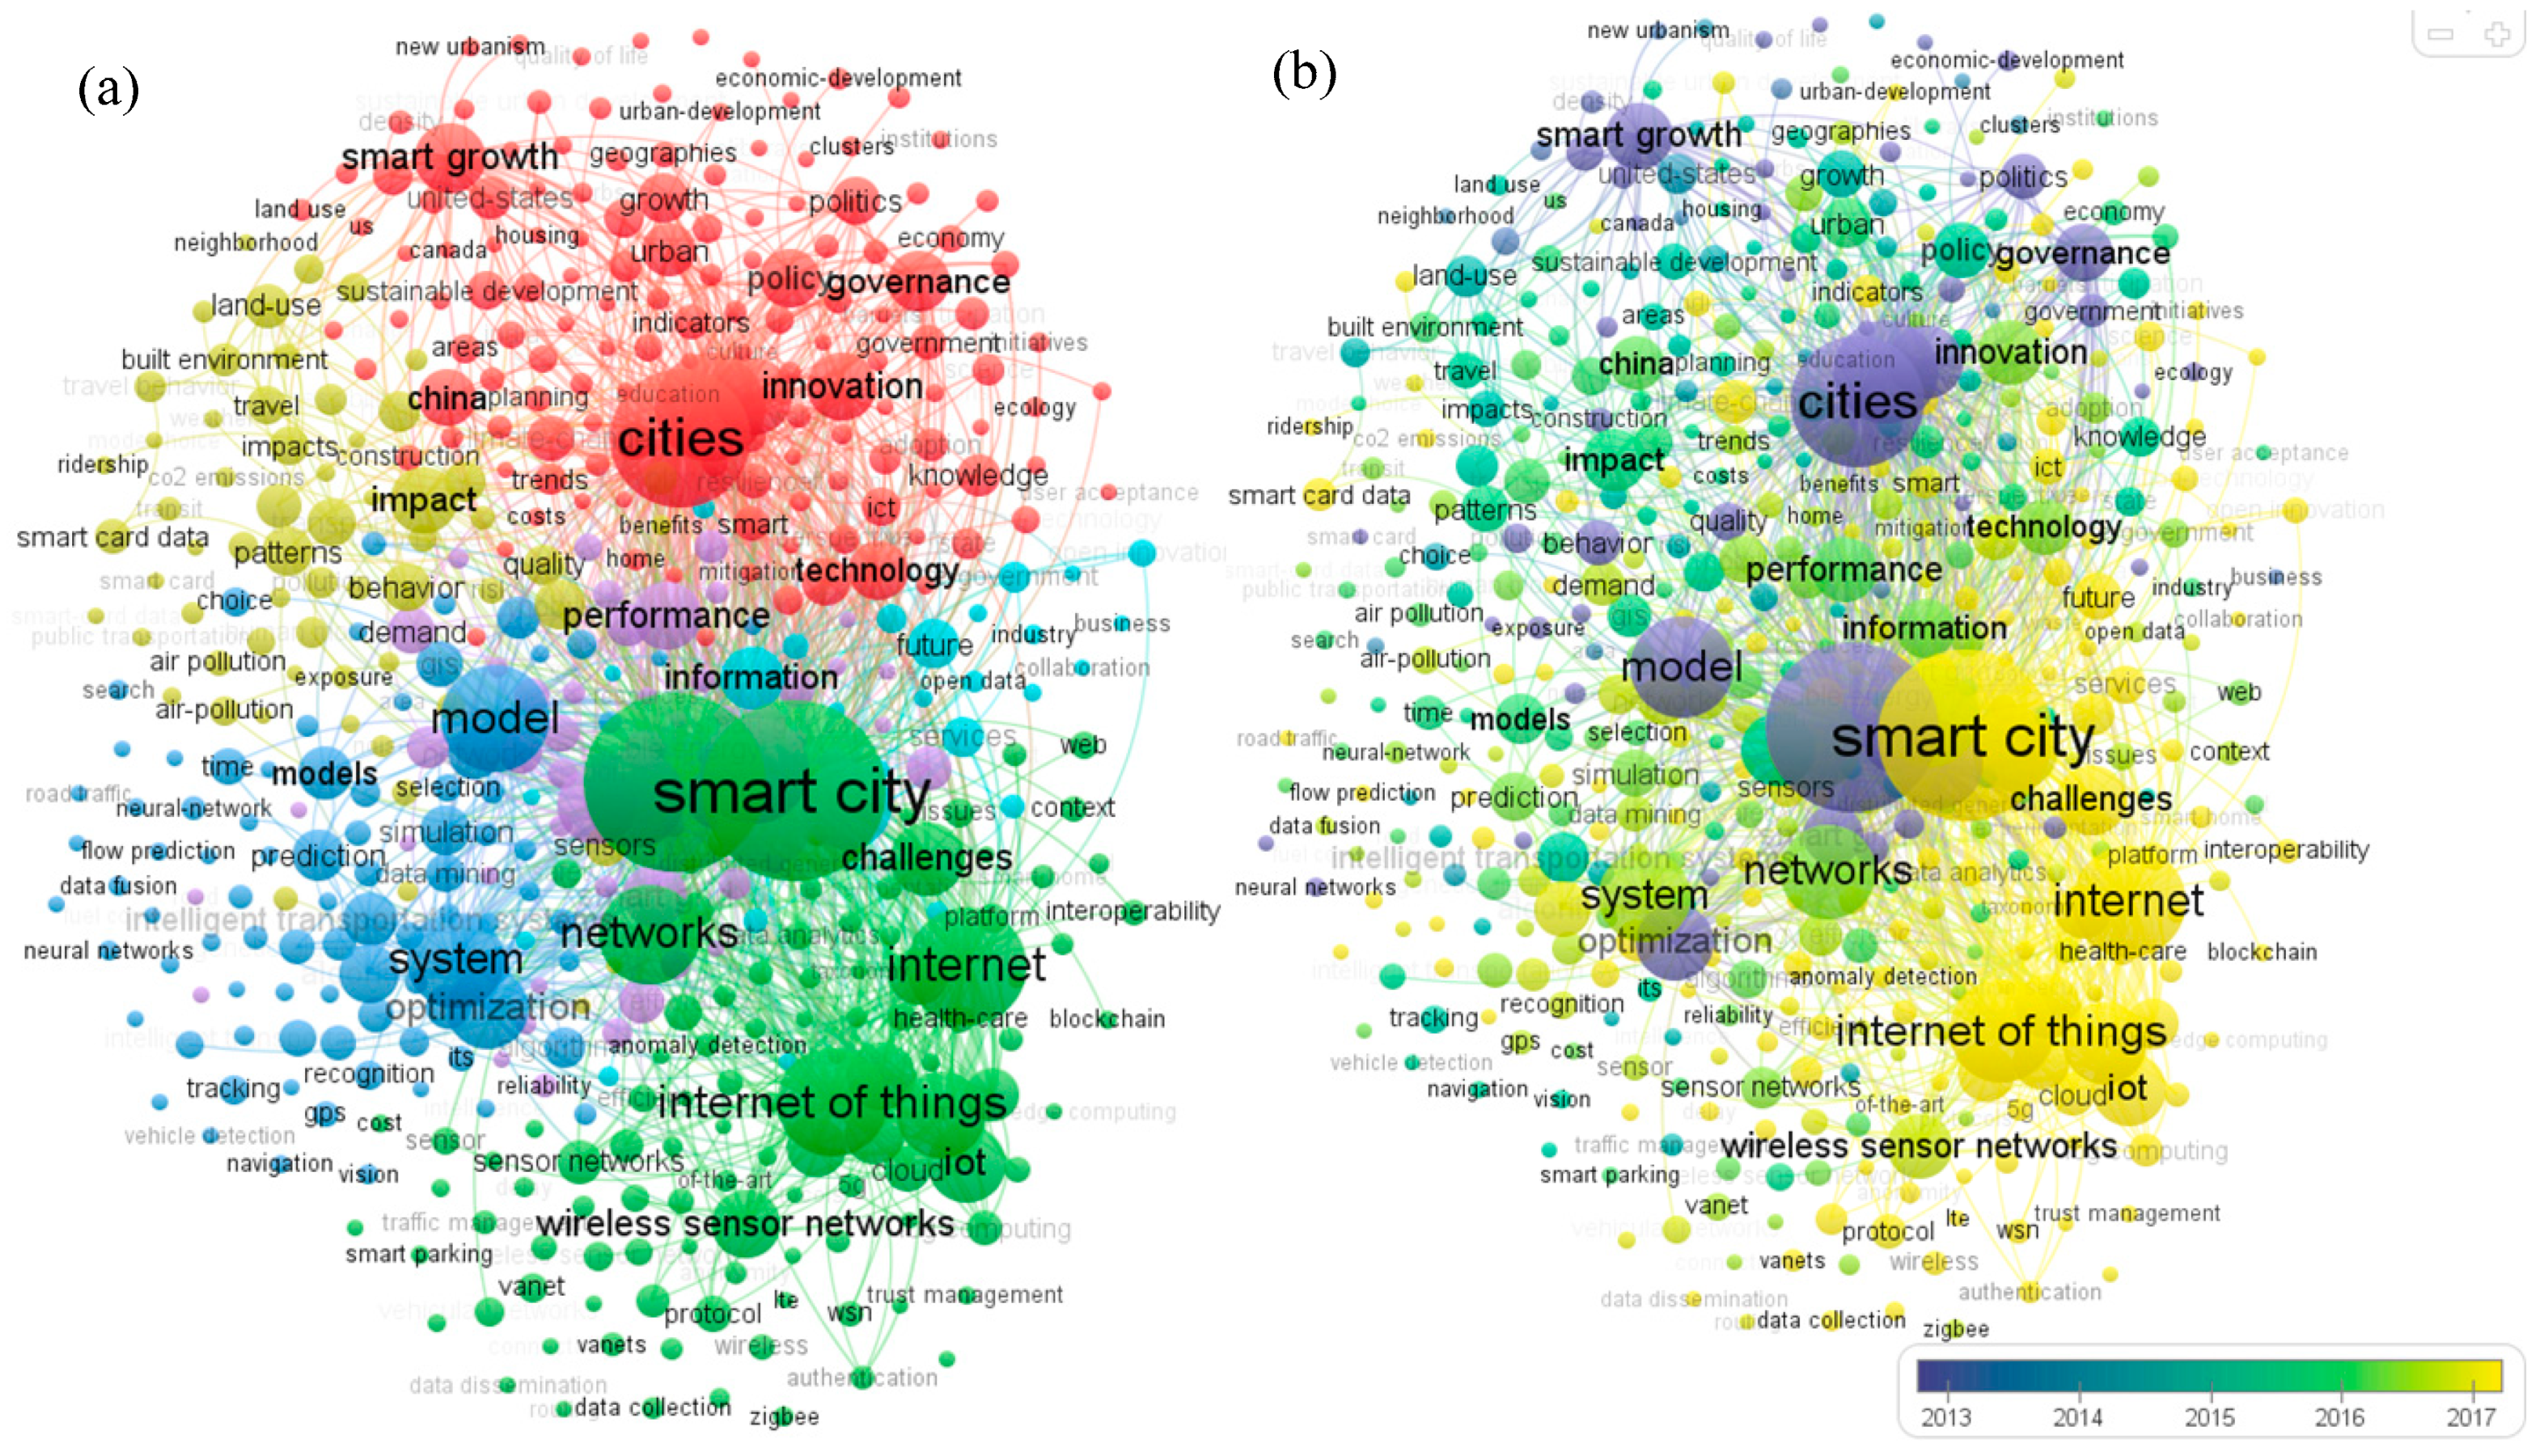
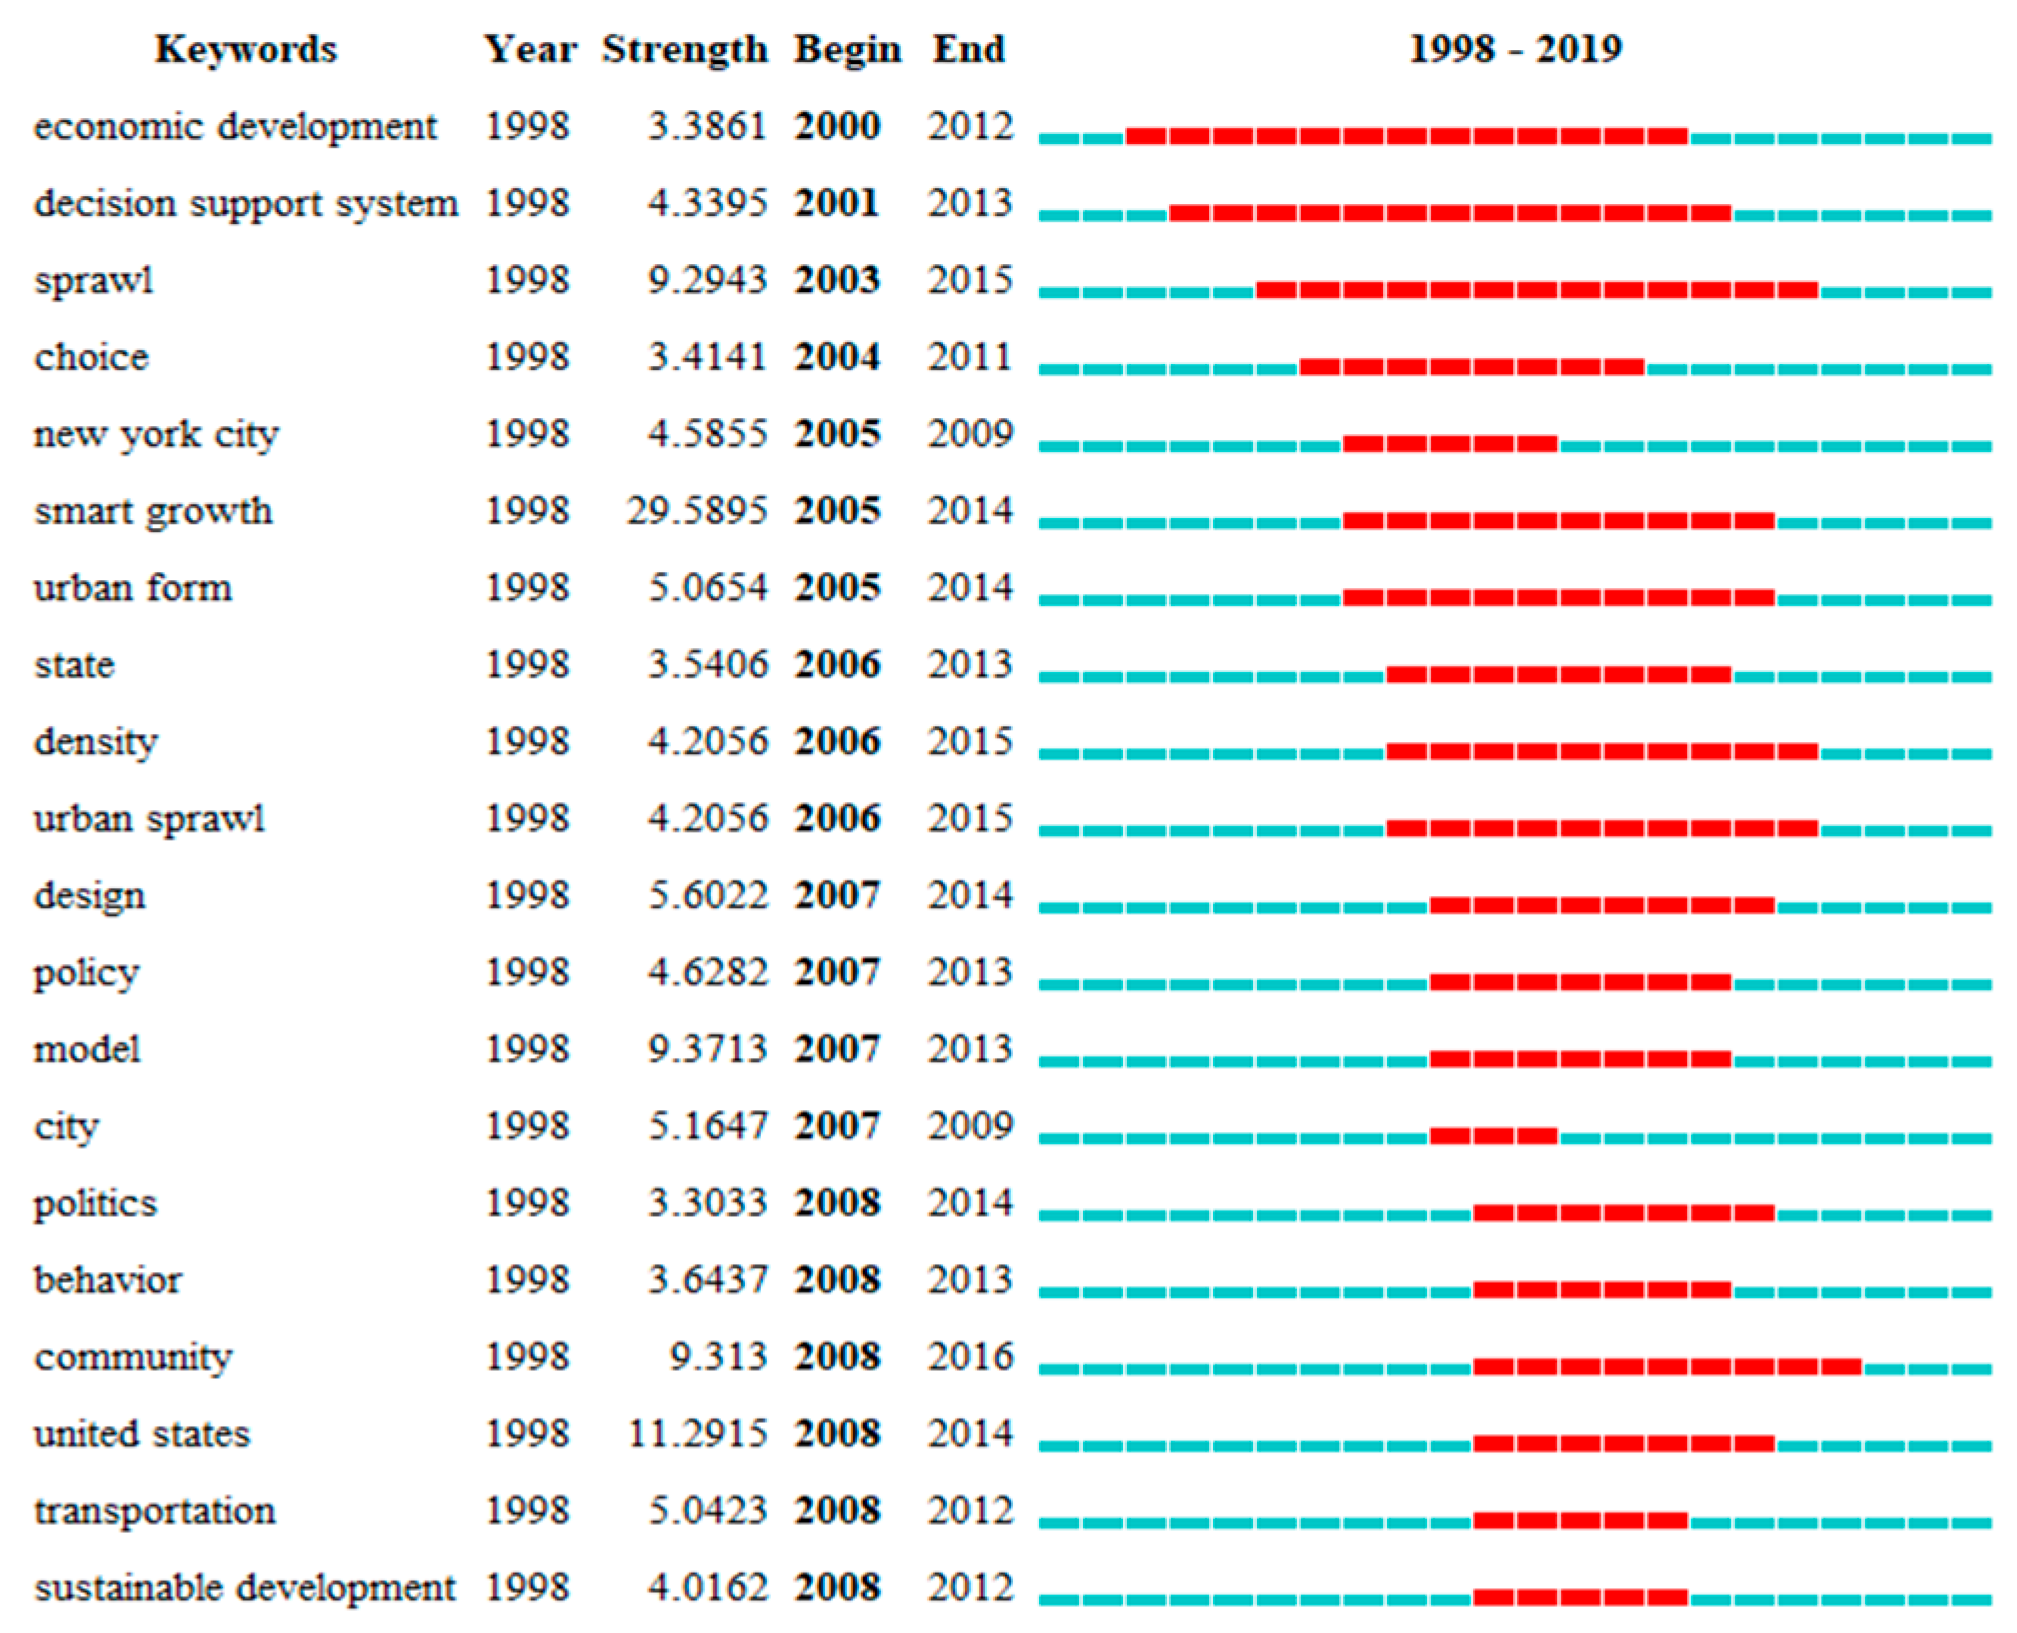
3.2. Co-Keyword and Keyword Citation Bursts Analysis

Keywords were nouns or phrases that reflected the core content of a publication [41]. The number of times an article is cited as a reference in another article reflects its scientific impact. Citation analysis was one of the parameters for assessing the quality of research published in scientific, technology, and social science journals [42]. The bibliometric data show that there were 15,400 keywords involved in this research. To illustrate the research hotspots in smart city area, keywords co-occurrence was analyzed with VOSviewer. The co-occurrence threshold of the keywords was set as 10 and 431 items were brought into visualization (Figure 3).
In Figure 3a, the size of the circles represents the occurrences of keywords. The larger a circle, the more a keyword has been co-selected in the smart city publications. The keyword ‘‘smart city’’ and ‘‘smart cities’’ had the strongest strength. The distance between the two keywords demonstrated relative strength and topic similarity. Circles in the same color cluster suggested a similar topic among these publications. The co-keyword network in Figure 3a clearly illustrated six distinct clusters. Each represented a subfield of a field of smart cities. Appropriate labels of the six main clusters could be allocated to each of them by analyzing its main node circles. Specifically, as was shown in the red cluster (Figure 3a, cluster 1, upper right, 133 items), keywords such as city/cities, sustainability, smart growth, governance, innovation, policy, technology, urban, growth, etc., apparently related to the topic of “smart development”. In the green cluster (Figure 3a, cluster 2, bottom right, 93 items), keywords such as IoT, Internet, networks, wireless sensor networks, cloud computing, etc., focused on the main domain of “telecommunications and computer science”. Next, in the yellow cluster (Figure 3a, cluster 5, upper left, 32 items), keywords like impact, transport, behavior, quality, pollution, land use, etc., concentrated on the aspect of “QoS of urban citizens”. In the blue cluster (Figure 3a, cluster 3, middle left, 91 items), keywords like models, system, optimization, algorithm, etc., were associated with urban science technology topics. Another central cluster in purple (Figure 3a, cluster 4, 61 items) comprised keywords like design, management, energy, performance, smart grid, integration, etc., which were more concerned with “smart strategy for sustainable”. The last sapphire blue cluster in the central part of Figure 3a (cluster 6, 21 items) gathered keywords like big data, framework, information, future, e-government, services, information and so on, were mainly concerning “public administration”.
As is shown in Figure 3b, the colors were used to represent the time-varying keyword occurrences from 2013 (in dark purple) to 2019 (in yellow). In nearly every sub-domain of smart city research, there were frequent keywords like smart city, IoT, Internet, cloud, interoperability, health care, and so on [43].
Figure 3 might be confusing; the link and total link strength information of the top 10 occurrence keywords were listed in Table 2.
In Table 2, a link means a co-occurrence connection between two keywords. According to the VOSviewer manual, each link has a strength, represented by a positive numerical value. The higher this value, the stronger the link. The total link strength indicates the number of publications in which two keywords occur together. By the view of the table header in Table 2, it can be seen that the new research hotspot mainly concentrated on the Internet, IoT, model, management, system and “things”.
Keyword citation bursts refer to those keywords which increase sharply in citations. Burst detection is a useful analytic method to find the keywords that receive particular attention from the related scientific communities in a certain period of time. Therefore, several interesting points could be found by analyzing the results given by CiteSpace [44]. In this section, to explore the dynamics of smart city research, and to explore the intensively researched directions, 20 bursts detected on the keywords were illustrated with CiteSpace (parameter settings: years per slice: 1; node types: keyword; top N per slice: 300. Top N%: 5%) as is shown in Figure 4.
With detected hot-spot keywords listed in Figure 4, the fast growing topics in smart city research field were reflected by the top 20 keywords with bursts. The red part represents the period when the citation burst happened [45]. “Economic development” was the first keyword proposed in smart city research. Together with the two longest burst leading keywords, economic development and decision support system, sprawl (urban) still occupied the burst range till date. The keyword ‘‘community’’ was also the nearest hot-spot keyword in the burst. The dynamic process can be found in Figure 4, by judging the burst keyword order such as: choice, smart growth, urban form, density, design, transportation. Just as some researchers said, there was an urgent transformation trend from data intelligence to service intelligence in the vision of smart cities due to the living requirements of citizens [46]. Keyword bursts also showed that the theme of the study changed quickly as time went on, and many branches of smart city research were synchronously thriving. The mushroomed new keywords with the strongest citation bursts since 2005 and the less strong citation of the keyword “economic development” since 2012 may reflect that “smart city” was growing into an independent new subject of research demine.

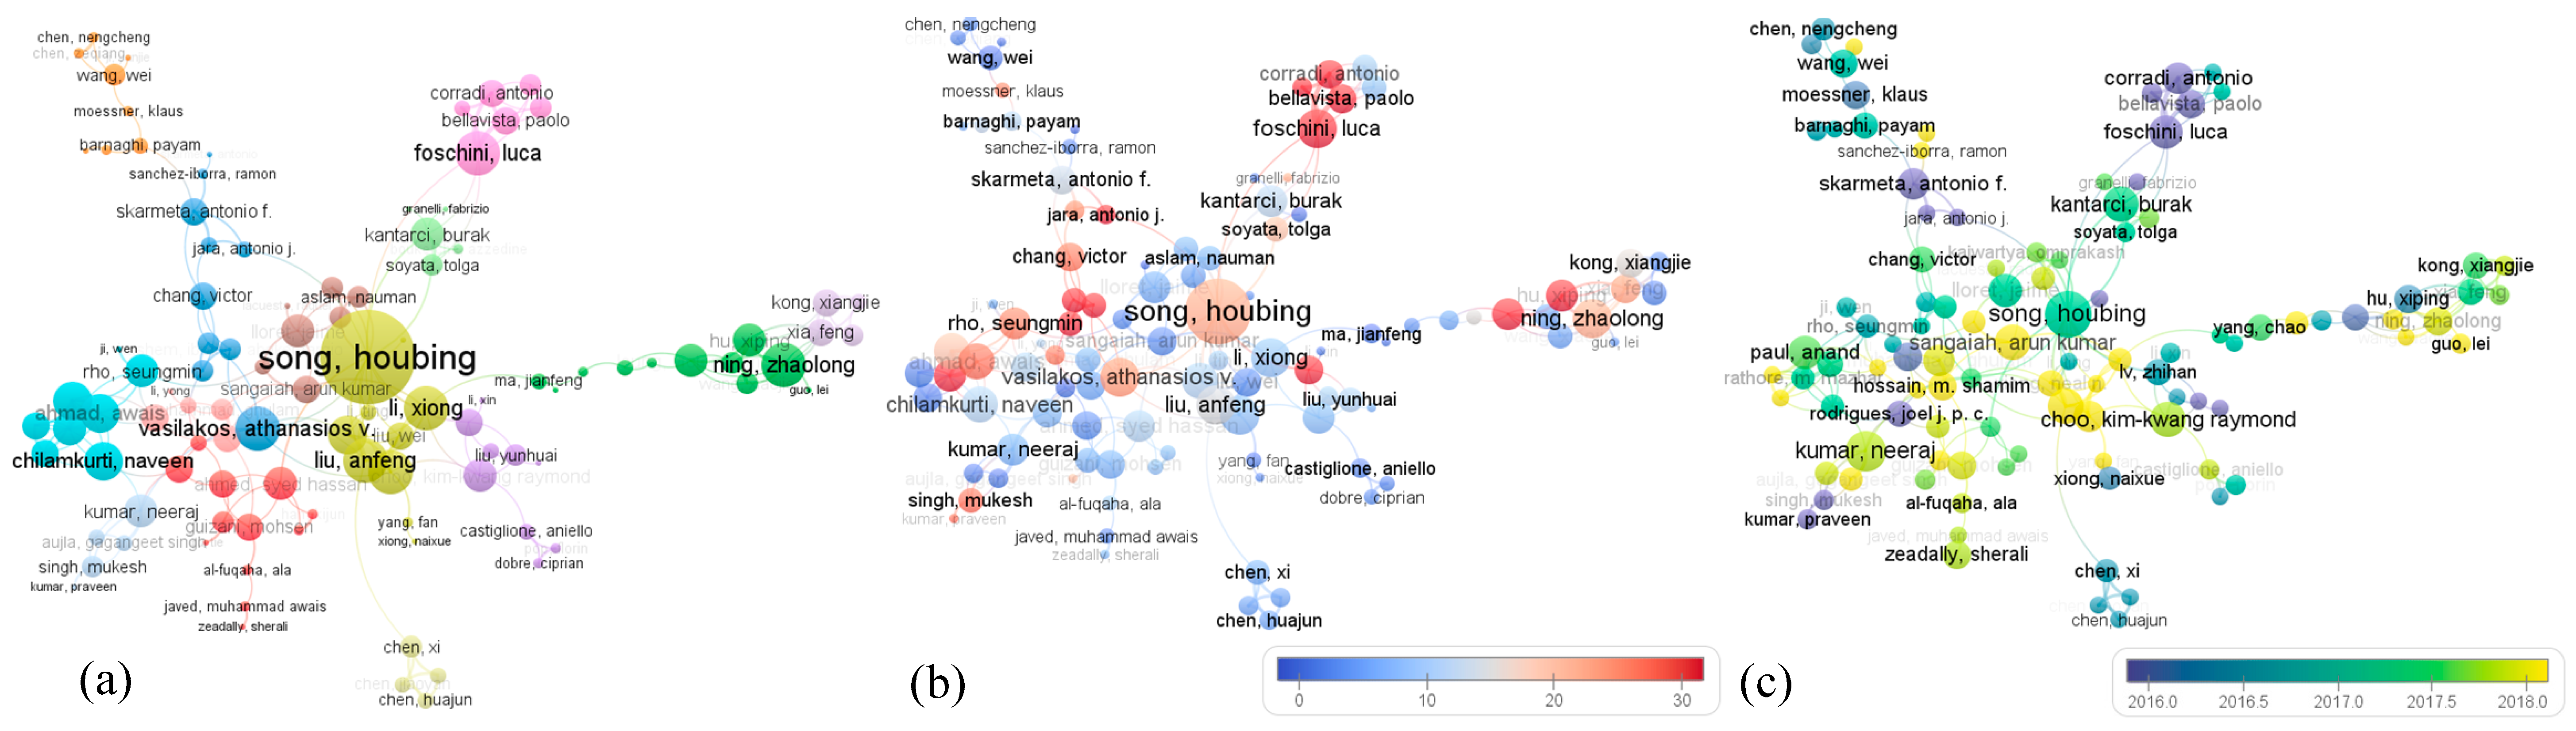
3.3. Co-Authorship Visualization Analyses

The function module of the co-authorship visualization of VOSviewer was applied to analyze the cooperation pattern of the authors, organizations and countries publishing on smart cities. Based on the 4409 publications that were contributed by 13,124 different authors, the cooperation network of the authors in smart cities research area was visually mapped in Figure 5. If an author used different names in their publications, it could not be merged, unless the unique digital identity strategy like ORCID was used [23,47].
Statistically, 40.21% of the authors (n = 1773/4, 409) were credited in two publications on the topic of smart cities, 13.11% (n = 578/4, 409) were credited on at least three publications, 5.72% (n = 252/4409) were credited on four publications, and 3.15% (n = 139/4,409) were credited on five or more publications. When creating author data based the co-authorship map, the threshold value was set at four so as to easily find the prominent authors (n = 252) who had published on the topic of smart cities. However, some of the 252 authors were not connected with the other authors in the network. There were only 104 items analyzed.
In Figure 5, lines among the authors represent their cooperation links, while 14 different colors seen in Figure 5a represent the collaboration cluster of the authors. Among these clusters, main academic relations and excellent researchers could be uncovered in the network. For instance, the strong-link researchers “Song, Houbing”, “Liu, Anfeng”, “Wang, Tian”, “Li, Xiong”, and “Xiong, Neal n.” were grouped in a cluster in Figure 5a. The main researchers in the network were “Song, Houbing”, “Vasiakos, Athanasios v.”, “Ning, Zhaolong”, “Foschini, Luca”, “Ahmad, Awais”, “Paul, Anand”, “Chilamkurti, Naveen”, “Lloret, Jaime”, “Choo, Kim-kwang Raymond”, “Song, Houbing” and “Ahmed, Syed Hassan”. Other researchers were linked to one of these main researchers.
In Figure 5b, the size of the circles represents the author link-weights, and the gradient color from blue to red demonstrates the average citation scores of articles. It can be seen from Figure 5b that, though some author linked relatively less, their publication was cited a lot. The authors were “Cardone, Giuseppe”, “Corradi, Antonio”, “Jara, Antonio, j.”, “Foschini, Luca”, “Hu, Xiping”, “Leung, Victor c. m.”, “Lv, Zhihan”, “Bellavista, Paolo”, “Song, Houbing”, “Rathore, m. Mazhar”, etc.
In Figure 5c, the size of the circles represents the average publication of an author, and the gradient color from blue to yellow demonstrates the freshness of articles. The overlay visualization result in Figure 5c shows that the five most productive authors were in descending order, “Song, Houbing”, “Kumar, Neeraj”, “Kumar, Neeraj”, “Liu, Anfeng” and “Choo, Kim-kwang Raymond”. Some authors like “Liu, Anfeng”, “Wang, Tian”, “Sangaiah, Arun Kumar”, “Song, Houbing”, “Ning, Ahaolong” and “Kumar, Neeraj” recently contributed some new publications. To sum up, the productive author, strongly linked author and the pioneer in the field of smart cities research were often the same person (e.g., “Song, Houbing”).
Complementary for Table 1, the top 10 co-authorship linked document-productive authors are shown in Table 3.
In Table 3, it can be seen that all the top 10 strong co-authorship linked authors contributed publications after 2015. That, to some extent indicates that the smart cities research domin kept the vigorous growth status.

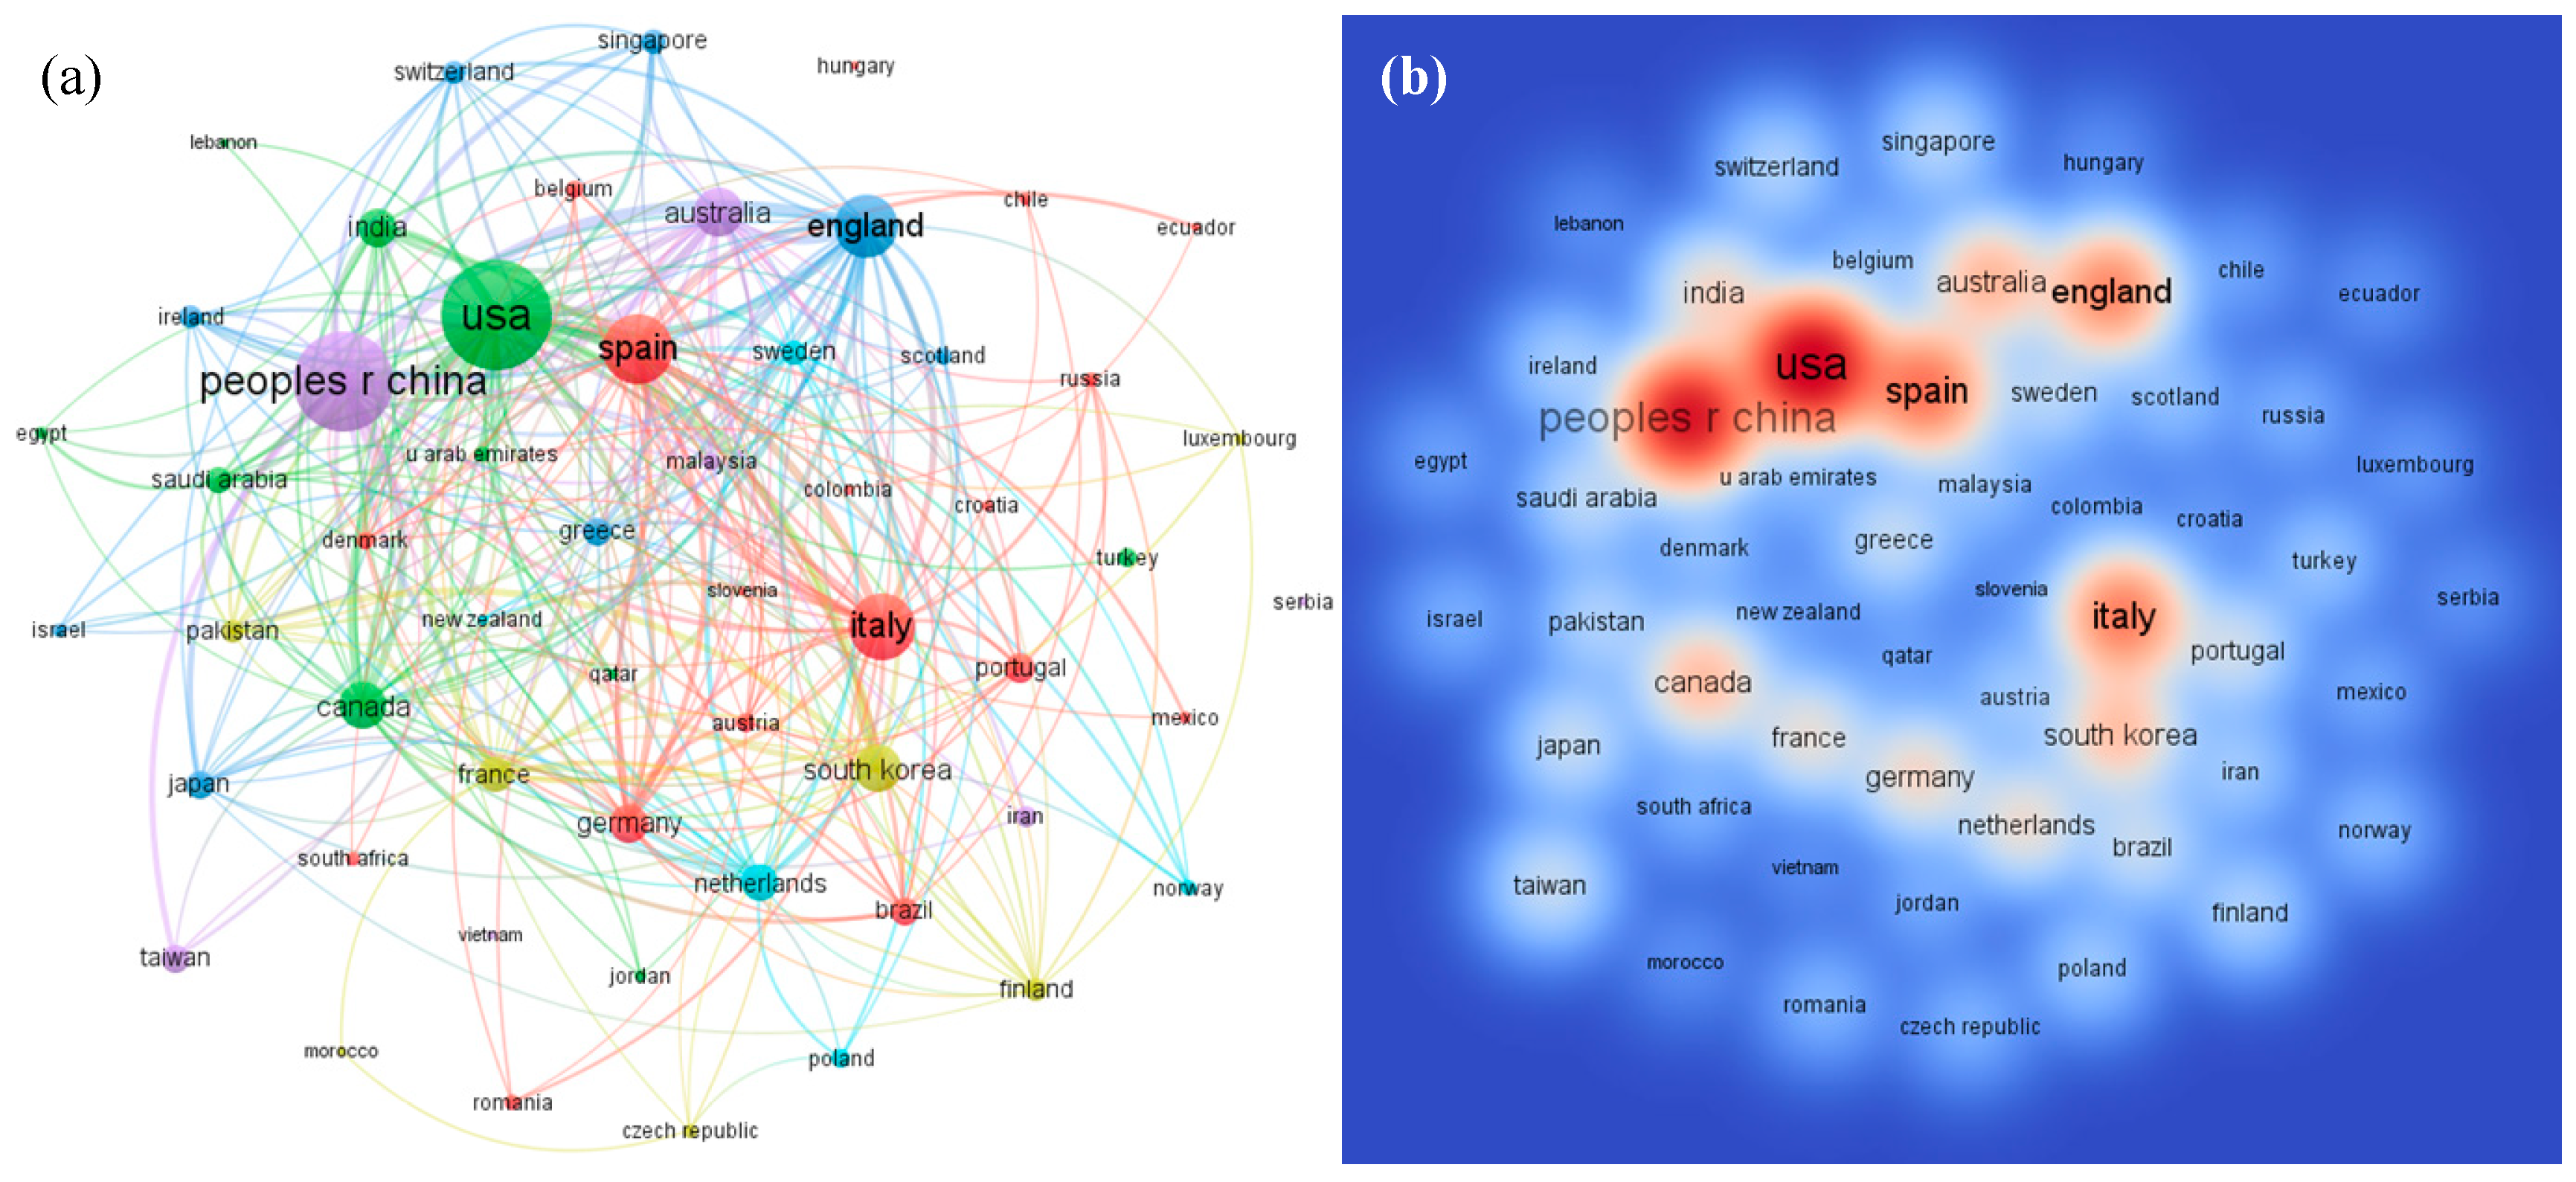
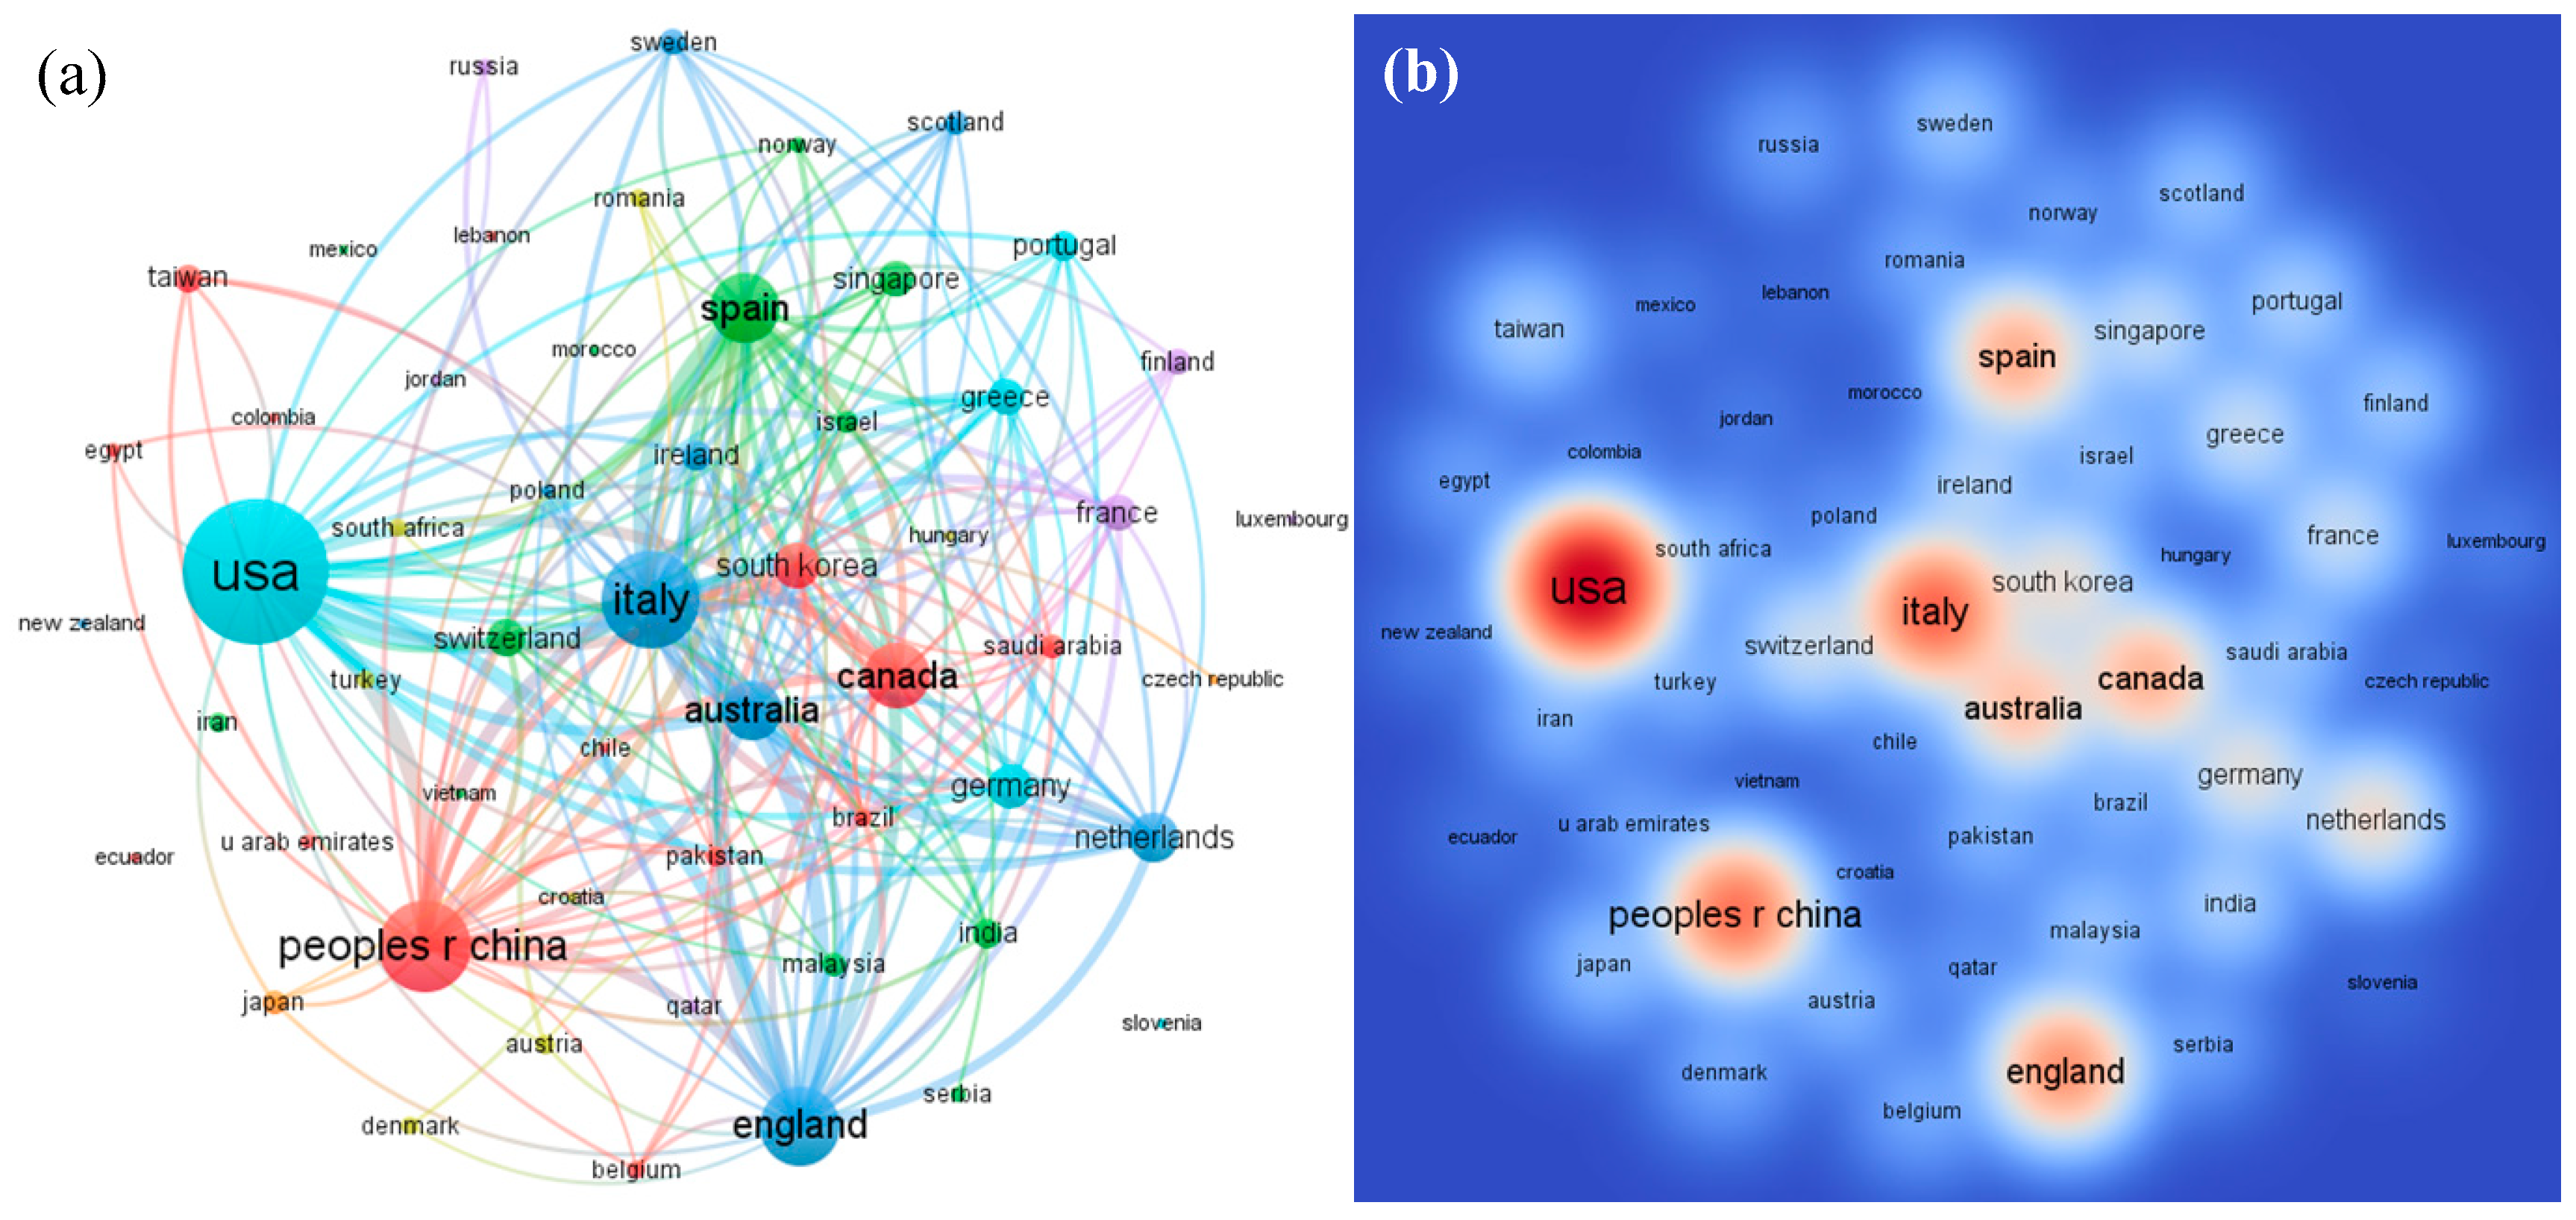
3.4. Countries/Regions Cooperation Analyses

(1) Co-author visualization analysis of countries/regions
Based on the bibliographic data collected from the core collection of the WoS, the countries co-authorship network visualization map was created (Figure 6) with VOSviewer. In the process of mapping Figure 6, the minimum document threshold of a country was set at 10. There were 55 countries out of 99 listed as visualization items.
In Figure 6a, the size of the circles represents the number of documents, the larger the circle, the more the documents. Through the use of six different colors, six scientific camps on smart city research could be distinguished. For example, USA (n = 1409), India, Canada and Saudi Arabia co-authored a lot, while China (n = 870), Australia, Malaysia as well as the Taiwan region of China were deeply linked in cooperation with smart city research. The third team colored in blue assembles countries/regions such as England (n = 387), Greece, Singapore, Switzerland, Ireland, Japan, Scotland, etc. Countries such as the Netherlands and South Korea kept a wide range of cooperation with other countries/regions. The density visualization of Figure 6b shows that the USA, China, England, Spain, Italy and Australia led the cooperation in smart city research.
(2) Citation visualization analysis of countries/regions
The citation analysis can be interpreted as when the literature of two authors is simultaneously cited by a third author, the two authors are perceived to have a co-citation relationship. A co-citation visualization map of countries/regions (Figure 7) was drawn with VOSviewer. In the process of mapping Figure 7, the minimum document threshold of a country was also set at 10.
Thus, in Figure 7a, the shorter the line between the two items, the closer the academic relationship. The size of the circles of Figure 7a represents the number of documents co-cited, the larger the circle, the more documents co-cited. Circles with the same color were used to classify the scientific communities.
Not like the spatial patterns of the countries/regions co-citation visualization, in the co-citation visualization map Figure 7a, China (with 7074 citations), among the 14 clusters, held a broader cooperation network. By contrast, the USA (with 16,338 citations) only kept close cooperation with five members. This indicates that the two main countries in smart city research kept different attitudes on an open intellectual environment. China held a more collaborative attitude. Scholars in the field of smart cities were more willingly to share their experience with China [48].
As is shown in Figure 7b, the density visualization map based on citation-weights illustrates the main countries/regions as follows: USA, Italy, China, England, Spain, Canada, Netherlands, Germany, Greece, etc. Comparing Figure 6 with Figure 7, rough conclusions can be drawn; that is though the network pattern of co-author and co-citation all reflect academic collaboration, they were distinctively different. In addition, countries/regions with large co-author intensity hold strong co-citation regime.
As a further supplement for Table 1, the main countries/regions cooperation characteristics are shown in Table 4.
A fact of interest in Table 4: the USA is the world’s leading document producer, however, China, ranked second, has a lead in the yearly average publication. This perhaps shows that China is in fact one of the new research centers of the world.

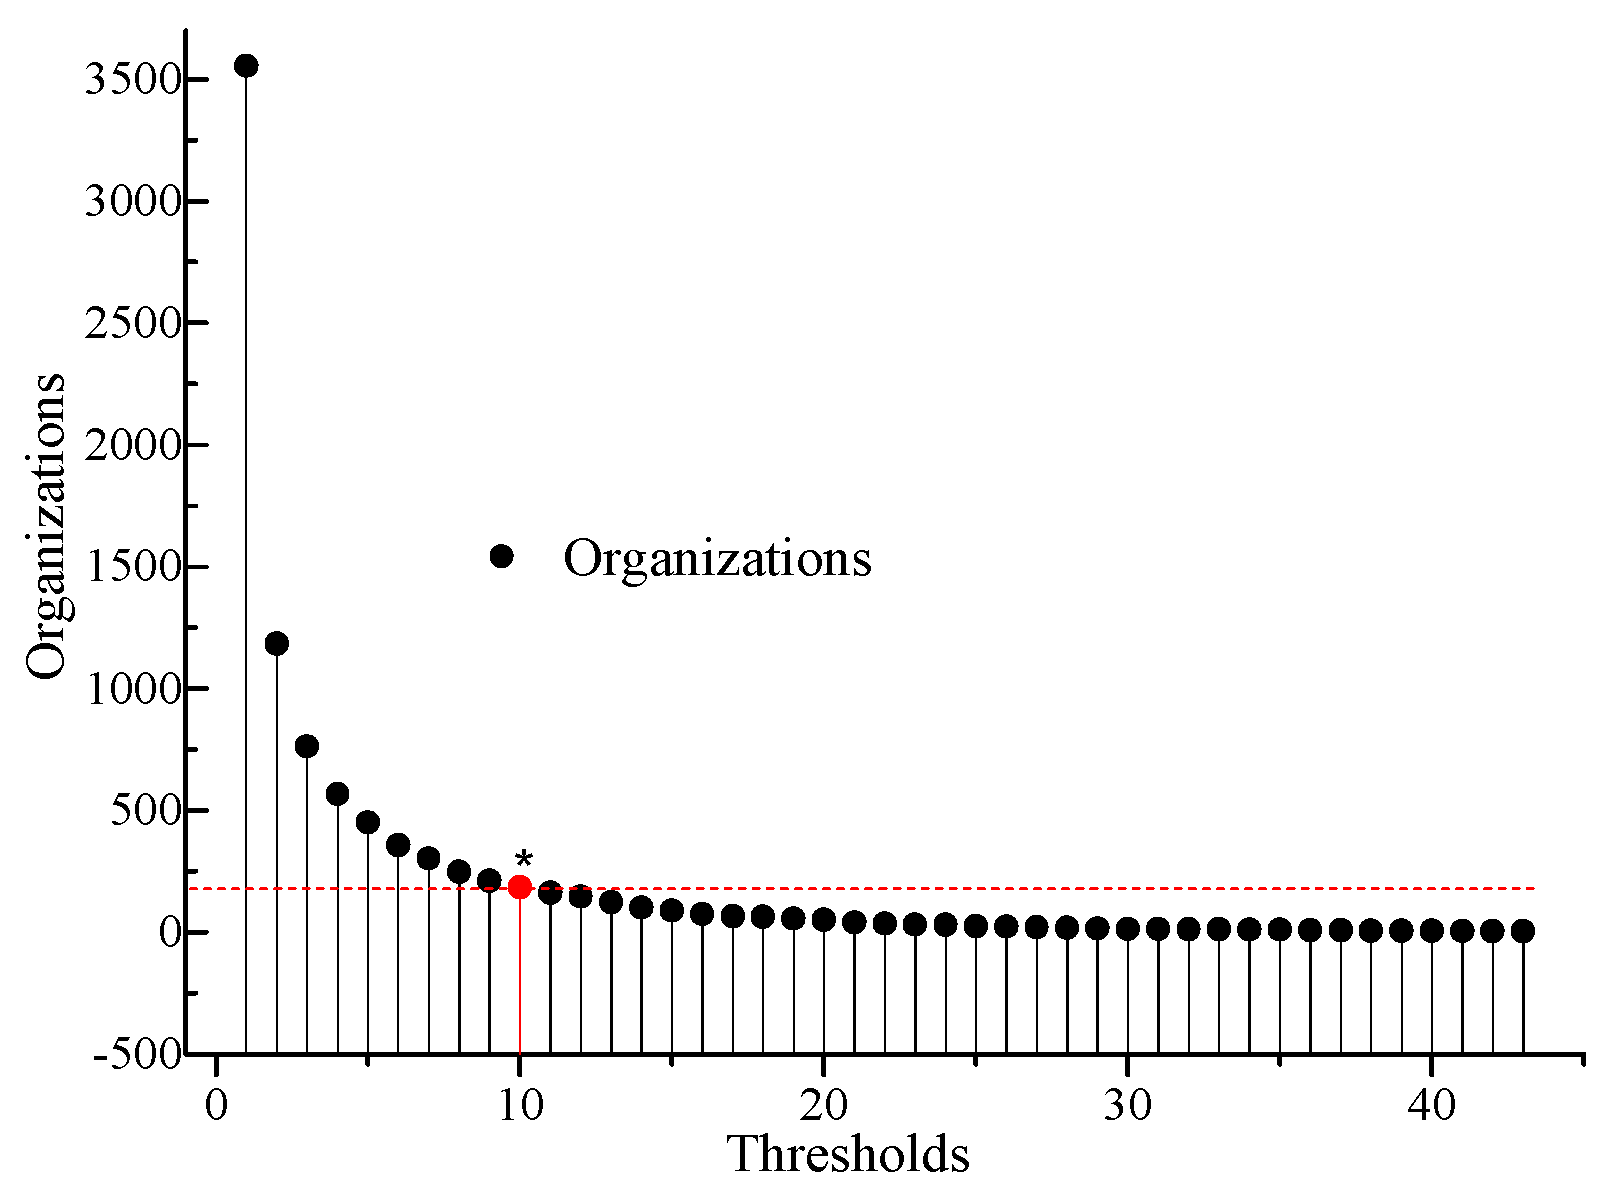
3.5. Co-Operation of Organizations on Amart Xities

In Table 1, the top 10 most productive organizations are listed. Before the bibliography analysis, the possible scope of those organizations was selected based on Figure 8.
In the diagram (Figure 8), there was a sudden drop of the organizations when the threshold value was two (only 33.3% met the threshold). On the one hand, this phenomenon implied that researches on smart city had attracted a great deal of attention; on the other hand, most organizations were still at a primary exploration stage.
To explore the main partnership among the 3556 organizations, VOSviewer was employed to give an organization citation visualization map (Figure 9). When the threshold value was 10, there were 184 powerful organizations (5.17%) left in the smart city research field.
In Figure 9a 184 representative organizations were divided into five clusters, indicated by five colors. The node/circle size represents the quantity of publications, and the line between the two nodes demonstrates the academic link between the two organizations. The shorter the line, the stronger the link. Thus it could be found in Figure 9a, that the red cluster (middle right) gathered the largest members (57) of organizations who researched on smart cities. Among this red cluster, University Politecn Valencia took the lead in publication production while University of Padua took the lead in the total links within the cluster. Opposite the red cluster, a blue cluster (middle left) embraced typical productive organizations such as the University of Bologna, Wuhan University, University of California Irvine, Swiss Federal Institute of Technology, University Pisa, etc.
The green cluster (bottom) in Figure 9a was the second largest cluster with 46 members, organizations such as: Delft University of Technology, Politecn Milan, Politecn Torino, Universidad Politecn de Madrid, and Griffith University were the key members in the publication production. Combining this with the organization link density visualization map in Figure 9b, we could infer that those members in the green cluster kept a much tighter academic collaboration. Unlike the situation in the yellow cluster (upper), organizations such as: Chinese Academy of Sciences, Dalian University of Technology, King Saud University and Huazhong University of Science and Technology took a high proportion. Based on the link between the yellow cluster and the green cluster in Figure 9b, it could be concluded that the cooperation of organizations in the European region was much stronger as compared with that of Asia.

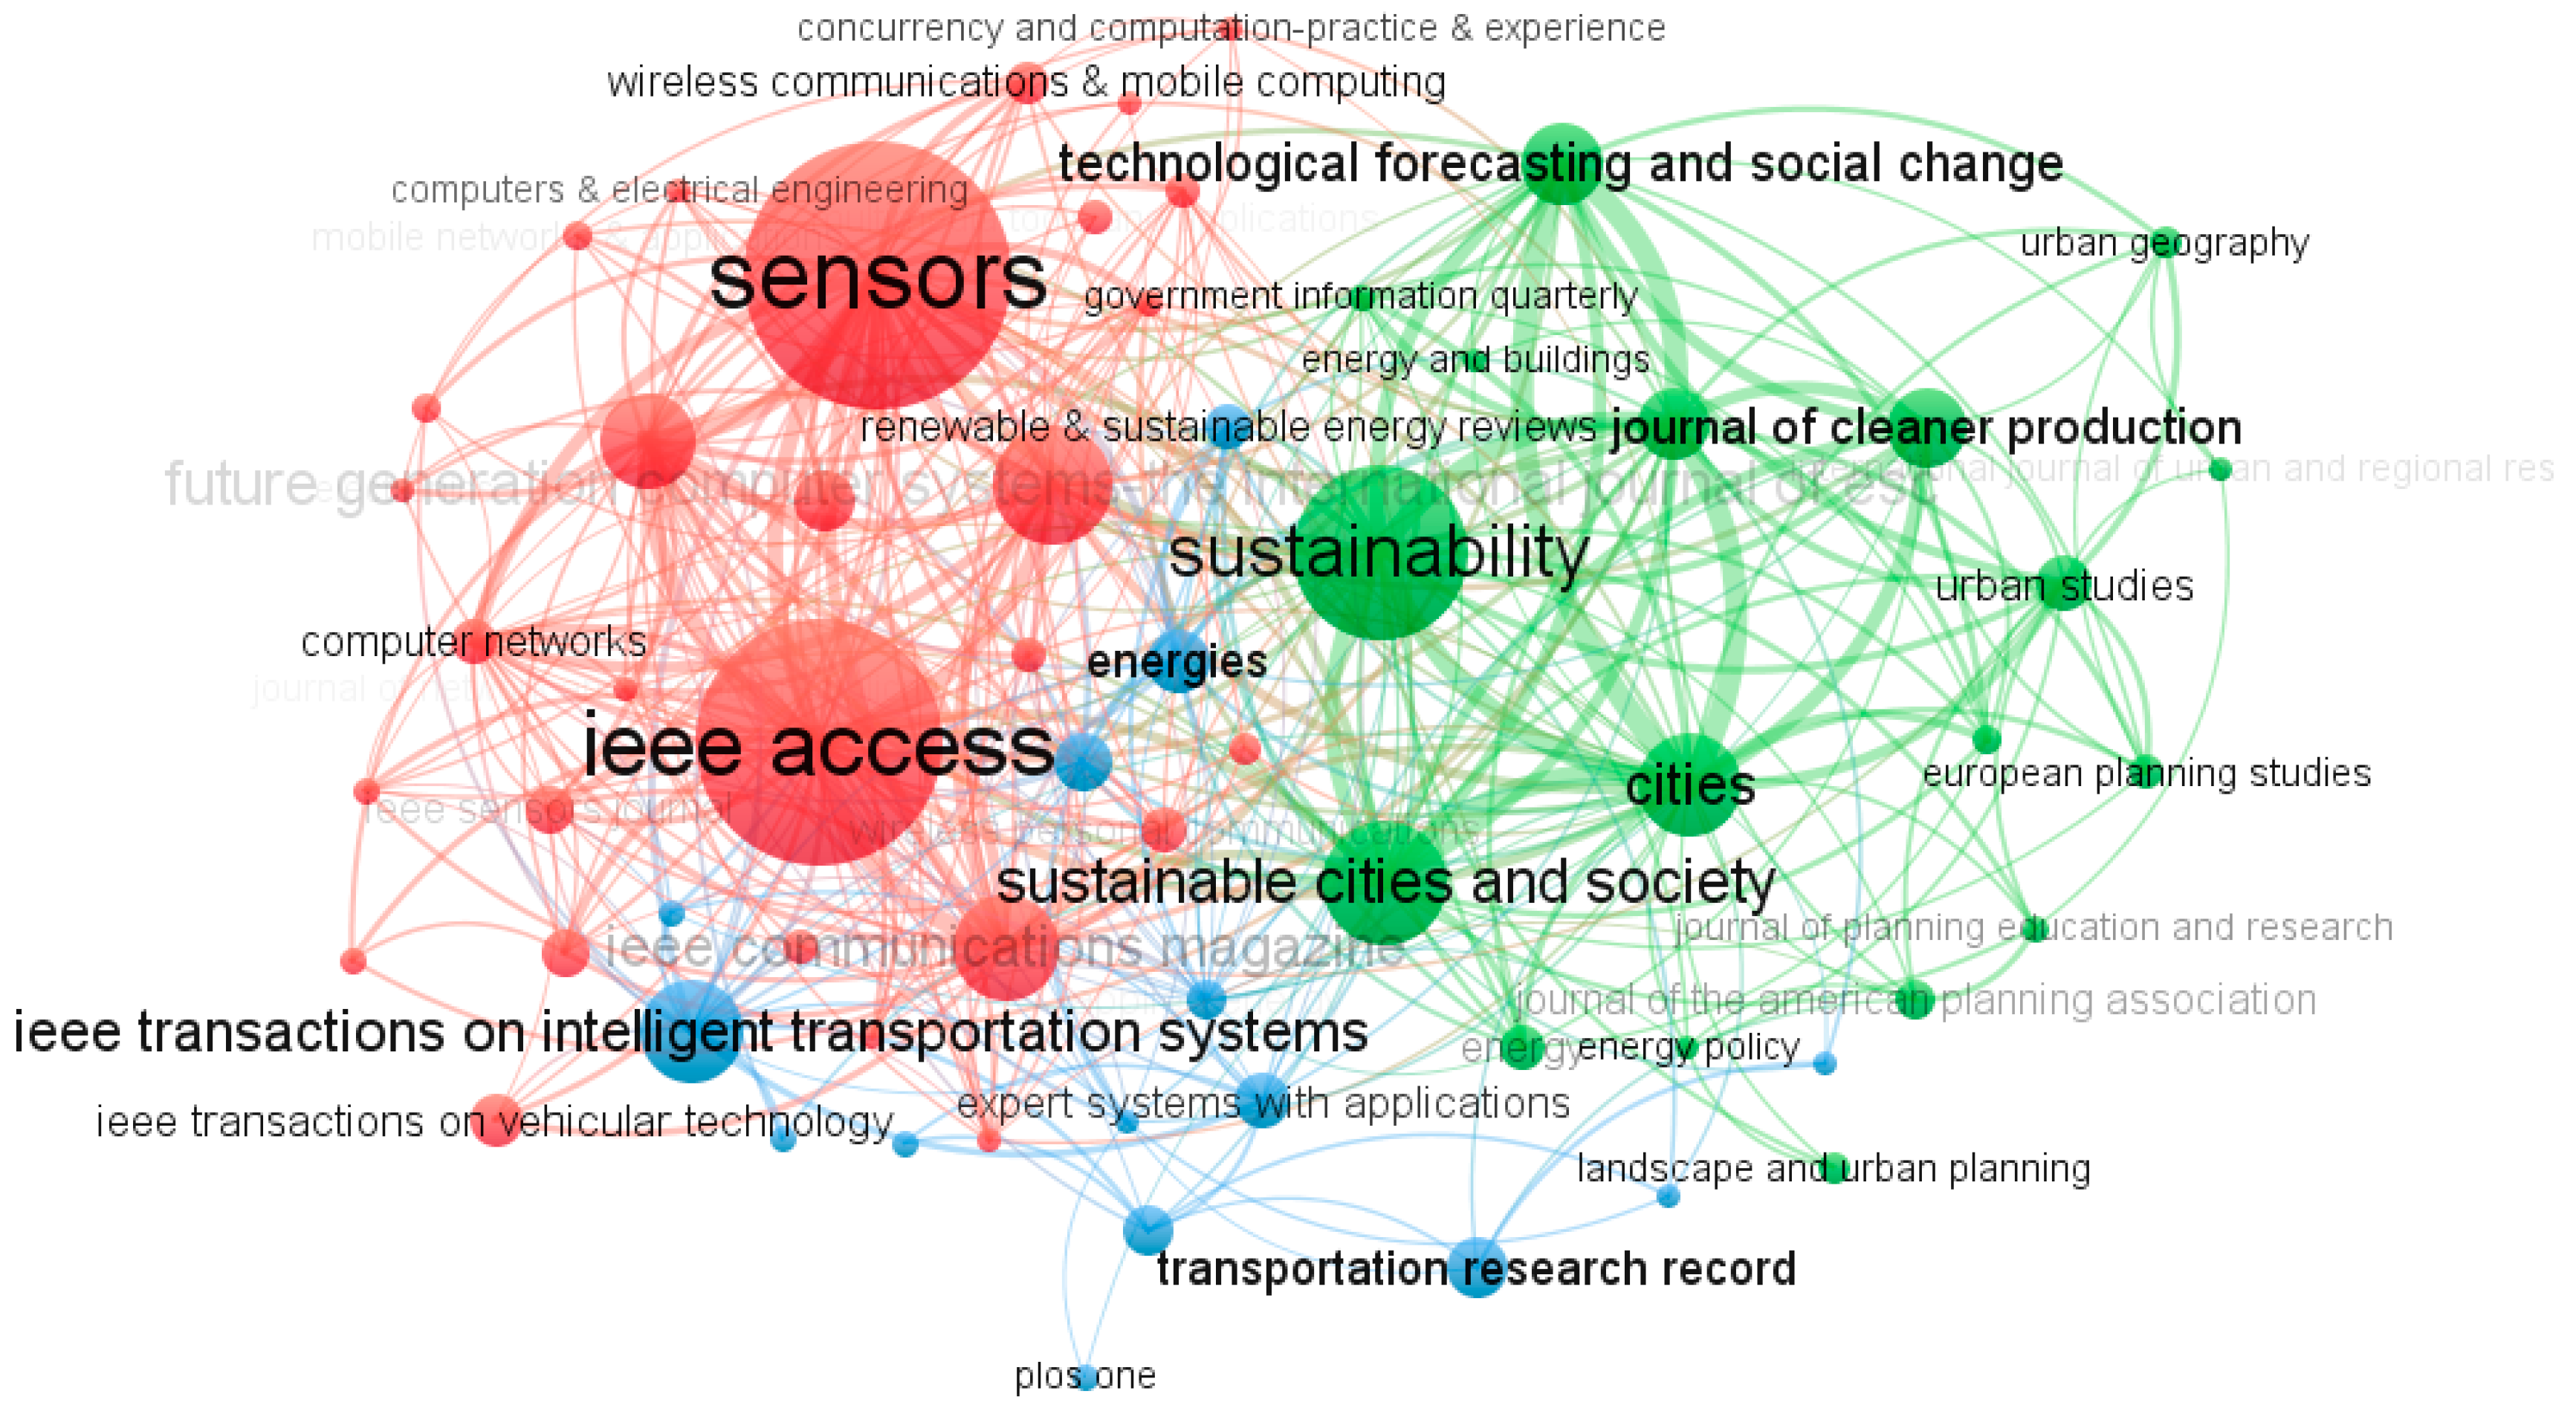
3.6. Journals Publishing on Smart Cities

In total, there were 4409 publications in 1086 different journals. Although a lot of journals supported a wide variety of research themes and the multidisciplinary characteristics of smart city research, 55.34% (n = 601) journals had published no more than two publications. A list of the top 10 most productive journals on smart city research is provided in Table 1. In addition, the journal publications visualization map was produced with VOSviewer (Figure 10), so as to give a more direct impression of the journals.
As is vividly shown in Figure 10, the size of the nodes represents the publication amount of a journal, and the color of the nodes demonstrates the subdomains of smart cities research. In order to explore the relationship and cluster of the most productive journal, the threshold was set at 9, thus only 91 journals out of 1086 were used for analysis. The following conclusion was drawn from Figure 10. The second most productive journals in one cluster were sensors and IEEE, while the second most productive journals cluster included sustainability, cities, and so on. In each cluster, the journals linked densely.

4. Conclusions

This paper evaluated the global research trends in smart city publications from 1986 to 2019. The topic of smart city has been a field with extensive research during the last 20 years, most notably the publication output on smart cities has increased exponentially since 2010. There is a growing interest in the researches related to the smart city, which correspond to the urgent need for urban development and life improvement.
Based on the co-keyword network analysis, the main research areas could be distinguished in the domain of smart cities: (a) smart development; (b) telecommunications and computer science; (c) smart strategy for sustainable development; (d) public administration.
Keyword bursts analysis showed that the theme of the study changed quickly as time went on, and many branches of smart city research were synchronously thriving. New research hotspots mainly concentrated on the Internet, IoT, model, management, system and “things”. The mushroomed new keywords with the strongest citation bursts and the less strong citation keywords that might reflect “smart city” were becoming an independent research domain. In some way it corroborated the view that there was an urgent transformation trend from data intelligence to service intelligence in the vision of smart cities due to the living requirements of citizens.
Co-authorship analysis showed there were less than 40.21% authors (n = 1773/4, 409) credited in two publications on the topic of smart cities. This might reflect that a large number of authors were just entering the smart city research domain.
Author cooperation network analysis led to a conclusion that, the productive author, strongly linked author and most cited author was often the same person who may be the pioneer in the field of smart cities research.
Through countries/regions cooperation analysis, VOSviewer separated the 55 analyzed countries/regions into six research strong-linked camps that were respectively led by USA, China, England, Spain, Italy and Australia. They were also leading the cooperation in smart city research. Either in author cooperation or in country cooperation, the USA and China both ranked in the top two. However, the two main countries in smart city researches had different attitudes on the intellectual environment, and China held a more collaborative attitude. China is in fact one of the new research centers in the world. Countries/regions with large co-author intensity hold a strong co-citation regime.
The cooperation of organizations on smart cities implies that research on smart city has attracted a great deal of attention, but most organizations (66.7%) are still staying at a primary exploration stage. Organizations in the European region had a much stronger cooperation in comparison with organizations in the Asian region.
Limitations of this bibliometric study should be addressed. Firstly, the datum collection was limited to the core collection of WoS and refinements such as “document types” and “languages” were employed. Other authority international databases (e.g., PubMed or Scopus) should have been combined. However, the WoS is one of the largest global databases and most widely used for scientific publications analysis [23]. Secondly, the bibliometric analysis method could only be done for the existing classifications included in the WoS. Although the datum contained a full record and cited references, other valuable information (e.g., distinction between theoretical and empirical papers, etc.) was omitted/excluded in this paper. Based on these limitations, a deeper content analysis is recommended for further research when characterizing the bibliometric analysis.

Author Contributions

Conceptualization, Y.-M.G. and Z.-L.H.; methodology, J.G.; software, H.L.; validation, X.-R.G.; writing—original draft preparation, Y.-M.G.; writing—review and editing, J.G. and M.J.N.; visualization, Z.-L.H.

Funding

This research was funded by Ministry of Education Humanities and Social Science Planning Fund Project (No.17YJCZH054); Key Project of National Social and Scientific Fund Program (18ZDA052); Project of National Social and Scientific Fund Program (17BGL142); Shanghai Philosophy and Social Science Planning Education Youth Project,2019, grant number B19005.

Acknowledgments

Thanks for Xian-Hua Wu for his conceptualization guidance; the authors are indebted to Jie Li for his technical support.

Conflicts of Interest

The authors declare no conflict of interest.

References

  1. Silva, B.N.; Khan, M.; Han, K. Towards sustainable smart cities: A review of trends, architectures, components, and open challenges in smart cities. Sustain. Cities Soc. 2018, 38, 697–713. [Google Scholar] [CrossRef]
  2. Jia, X.F.; Dai, T.; Guo, X.B. Comprehensive exploration of urban health by bibliometric analysis: 35 years and 11,299 articles. Scientometrics 2014, 99, 881–894. [Google Scholar] [CrossRef]
  3. Mohanty, S.P.; Choppali, U.; Kougianos, E. Everything you wanted to know about smart cities: The internet of things is the backbone. IEEE Consum. Electron. Mag. 2016, 5, 60–70. [Google Scholar] [CrossRef]
  4. Yigitcanlar, T.; Kamruzzaman, M.; Foth, M.; Sabatini-Marques, J.; Da Costa, E.; Ioppolo, G. Can cities become smart without being sustainable? A systematic review of the literature. Sustain. Cities Soc. 2019, 45, 348–365. [Google Scholar] [CrossRef]
  5. Bibri, S.E.; Krogstie, J. Smart sustainable cities of the future: An extensive interdisciplinary literature review. Sustain. Cities Soc. 2017, 31, 183–212. [Google Scholar] [CrossRef]
  6. Tan, Y.; Kamruzzaman, M.; Buys, L.; Ioppolo, G.; Sabatini-Marques, J.; Costa, E.M.D.; Yun, J.H.J. Understanding ‘smart cities’: Intertwining development drivers with desired outcomes in a multidimensional framework. Cities 2018, S0264275117313367. [Google Scholar]
  7. Neirotti, P.; Marco, A.D.; Cagliano, A.C.; Mangano, G.; Scorrano, F. Current trends in smart city initiatives: Some stylised facts. Cities 2014, 38, 25–36. [Google Scholar] [CrossRef]
  8. Darby, G.E. Can digital kiosks for travelers bring digital services to the local loop and make a city, or village, smart? A development strategy. In Proceedings of the Pacific Telecommunications Council Sixteenth Annual Conference Proceedings, Honolulu, HI, USA, 16–20 January 1994; pp. 230–233. [Google Scholar]
  9. Pelley, J. Building smart-growth communities. Environ. Sci. Tech. 1999, 33, 28A–32A. [Google Scholar] [CrossRef]
  10. Rosborough, D.; Cacy, K.; Amer Public Transit, A.; Amer Public Transit, A. Achieving Bus Route Efficiency through Smart Growth Land Use: Bus Transit’s Stake in Smart Growth Land Use; American Public Transit Assoc: Washington, DC, USA, 1998; pp. 214–218. [Google Scholar]
  11. Meer, A.V.D.; Winden, W.V. E-governance in cities: A comparison of urban information and communication technology policies. Reg. Stud. 2003, 37, 407–419. [Google Scholar] [CrossRef]
  12. Albino, V.; Berardi, U.; Dangelico, R.M. Smart cities: Definitions, dimensions, performance, and initiatives. J. Urban Technol. 2015, 22, 3–21. [Google Scholar] [CrossRef]
  13. Ismagilova, E.; Hughes, L.; Dwivedi, Y.K.; Raman, K.R. Smart cities: Advances in research—An information systems perspective. Int. J. Inf. Manag. 2019, 47, 88–100. [Google Scholar] [CrossRef]
  14. Rodrigues, S.P.; Van Eck, N.J.; Waltman, L.; Jansen, F.W. Mapping patient safety: A large-scale literature review using bibliometric visualisation techniques. BMJ Open 2014, 4, e004468. [Google Scholar] [CrossRef] [PubMed]
  15. Meijer, A.; Bolívar, M.P.R. Governing the smart city: A review of the literature on smart urban governance. Int. Rev. Adm. Sci. 2016, 82, 392–408. [Google Scholar] [CrossRef]
  16. Durand, C.P.; Andalib, M.; Dunton, G.F.; Wolch, J.; Pentz, M.A. A systematic review of built environment factors related to physical activity and obesity risk: Implications for smart growth urban planning. Obes. Rev. 2011, 12, e173–e182. [Google Scholar] [CrossRef] [PubMed]
  17. Sayegh, M.A.; Danielewicz, J.; Nannou, T.; Miniewicz, M.; Jadwiszczak, P.; Piekarska, K.; Jouhara, H. Trends of european research and development in district heating technologies. Renew. Sust. Energ. Rev. 2017, 68, 1183–1192. [Google Scholar] [CrossRef]
  18. Shi, W.; Cao, J.; Zhang, Q.; Li, Y.; Xu, L. Edge computing: Vision and challenges. IEEE Internet Things J. 2016, 3, 637–646. [Google Scholar] [CrossRef]
  19. Yang, C.; Huang, Q.; Li, Z.; Liu, K.; Hu, F. Big data and cloud computing: Innovation opportunities and challenges. Int. J. Digit. Earth 2017, 10, 13–53. [Google Scholar] [CrossRef]
  20. Diaz, M.; Martin, C.; Rubio, B. State-of-the-art, challenges, and open issues in the integration of internet of things and cloud computing. J. Netw. Comput. Appl. 2016, 67, 99–117. [Google Scholar] [CrossRef]
  21. Tzafestas, S.G. Ethics and law in the internet of things world. Smart Cities 2018, 1, 98–120. [Google Scholar] [CrossRef]
  22. Ugolini, D.; Bonassi, S.; Cristaudo, A.; Leoncini, G.; Ratto, G.B.; Neri, M. Temporal trend, geographic distribution, and publication quality in asbestos research. Environ. Sci. Pollut. Res. 2015, 22, 6957–6967. [Google Scholar] [CrossRef]
  23. Van Nunen, K.; Li, J.; Reniers, G.; Ponnet, K. Bibliometric analysis of safety culture research. Saf. Sci. 2018, 108, 248–258. [Google Scholar] [CrossRef]
  24. Li, W.; Zhao, Y. Bibliometric analysis of global environmental assessment research in a 20-year period. Environ. Impact Assess. Rev. 2015, 50, 158–166. [Google Scholar] [CrossRef]
  25. Van Eck, N.J.; Waltman, L. Software survey: Vosviewer, a computer program for bibliometric mapping. Scientometrics 2010, 84, 523–538. [Google Scholar] [CrossRef] [PubMed]
  26. Lulewicz-Sas, A. Corporate social responsibility in the light of management science—Bibliometric analysis. Procedia Eng. 2017, 182, 412–417. [Google Scholar] [CrossRef]
  27. Gall, M.; Nguyen, K.H.; Cutter, S.L. Integrated research on disaster risk: Is it really integrated? Int. J. Disaster Risk Reduct. 2015, 12, 255–267. [Google Scholar] [CrossRef]
  28. Wang, X.; Fang, Z.; Sun, X. Usage patterns of scholarly articles on web of science: A study on web of science usage count. Scientometrics 2016, 109, 917–926. [Google Scholar] [CrossRef]
  29. Postranecky, M.; Svítek, M. Dynamic social evolution model in virtual city laboratory. In Proceedings of the 2016 Smart Cities Symposium Prague (SCSP), Prague, Czech Republic, 26–27 May 2016; pp. 1–4. [Google Scholar]
  30. Baig, Z.A.; Szewczyk, P.; Valli, C.; Rabadia, P.; Hannay, P.; Chernyshev, M.; Johnstone, M.; Kerai, P.; Ibrahim, A.; Sansurooah, K.; et al. Future challenges for smart cities: Cyber-security and digital forensics. Digit. Investig. 2017, 22, 3–13. [Google Scholar] [CrossRef]
  31. March, H. The smart city and other ict-led techno-imaginaries: Any room for dialogue with degrowth? J. Clean. Prod. 2018, 197, 1694–1703. [Google Scholar] [CrossRef]
  32. De Jong, M.; Joss, S.; Schraven, D.; Zhan, C.; Weijnen, M. Sustainable–smart–resilient–low carbon–eco–knowledge cities; making sense of a multitude of concepts promoting sustainable urbanization. J. Clean. Prod. 2015, 109, 25–38. [Google Scholar] [CrossRef]
  33. Mora, L.; Bolici, R.; Deakin, M. The first two decades of smart-city research: A bibliometric analysis. J. Urban Technol. 2017, 24, 3–27. [Google Scholar] [CrossRef]
  34. Chen, C. Citespace ii: Detecting and visualizing emerging trends and transient patterns in scientific literature. J. Assoc. Inf. Sci. Technol. 2014, 57, 359–377. [Google Scholar] [CrossRef]
  35. Sun, C.; Ritchie, S.G.; Tsai, K. Algorithm development for derivation of section-related measures of traffic system performance using inductive loop detectors. In Pavement Management and Monitoring of Traffic and Pavements; National Academy of Sciences: Washington, DC, USA, 1998; pp. 171–180. [Google Scholar]
  36. Barrett, P.; Rose, M.H. Street smarts—The politics of transportation statistics in the american city, 1900–1990. J. Urban Hist. 1999, 25, 405–433. [Google Scholar] [CrossRef]
  37. Shehata, E.; Rizkalla, S. Intelligent sensing for innovative bridges. J. Intell. Mater. Syst. Struct. 1999, 10, 304–313. [Google Scholar] [CrossRef]
  38. Dameri, R.P.; Cocchia, A. Smart city and digital city: Twenty years of terminology evolution. In Proceedings of the X Conference of the Italian Chapter of AIS, ITAIS, Milan, Italy, 14 December 2013; pp. 1–8. [Google Scholar]
  39. Jucevičius, R.; Patašienė, I.; Patašius, M. Digital dimension of smart city: Critical analysis. Procedia Soc. Behav. Sci. 2014, 156, 146–150. [Google Scholar] [CrossRef]
  40. Torrie, G.M.; Valleau, J.P. Nonphysical sampling distributions in monte carlo free-energy estimation: Umbrella sampling. J. Comput. Phys. (USA) 1977, 23, 187–199. [Google Scholar] [CrossRef]
  41. Xiang, C.; Wang, Y.; Liu, H. A scientometrics review on nonpoint source pollution research. Ecol. Eng. 2017, 99, 400–408. [Google Scholar] [CrossRef]
  42. Sevinc, A. Web of science: A unique method of cited reference searching. J. Natl. Med. Assoc. 2004, 96, 980–983. [Google Scholar] [PubMed]
  43. Allam, Z.; Newman, P. Redefining the smart city: Culture, metabolism and governance. Smart Cities 2018, 1, 4–25. [Google Scholar] [CrossRef]
  44. Zhou, W.; Kou, A.Q.; Chen, J.; Ding, B.Q. A retrospective analysis with bibliometric of energy security in 2000–2017. Energy Rep. 2018, 4, 724–732. [Google Scholar] [CrossRef]
  45. Huang, L.; Kelly, S.; Lv, K.J.; Giurco, D. A systematic review of empirical methods for modelling sectoral carbon emissions in china. J. Clean. Prod. 2019, 215, 1382–1401. [Google Scholar] [CrossRef]
  46. Xu, H.; Geng, X. People-centric service intelligence for smart cities. Smart Cities 2019, 2, 135–152. [Google Scholar] [CrossRef]
  47. Chiu, W.T.; Ho, Y.S. Bibliometric analysis of tsunami research. Scientometrics 2007, 73, 3–17. [Google Scholar] [CrossRef]
  48. Riva Sanseverino, E.; Riva Sanseverino, R.; Anello, E. A cross-reading approach to smart city: A european perspective of chinese smart cities. Smart Cities 2018, 1, 26–52. [Google Scholar] [CrossRef]
Figure 1. Stages of bibliometric analysis on smart cities research. Note: “*” the WoS core collection was last updated on May 8, 2019.
Sustainability 11 03606 g001
Figure 2. Annual publications and citations of smart city based on Web of Science (WoS) core data base. (a) The publication between January 1 to May 10, 2019; (b) the predicted publication throughout the year 2019.
Sustainability 11 03606 g002
Figure 3. Co-keyword network visualization on smart cities research. Note: (a) co-keyword network visualization was based on occurrences; (b) co-keyword overlay visualization was based on the occurrences and average publication per year scores.
Sustainability 11 03606 g003
Figure 4. Twenty keywords with the strongest citation bursts in smart city research.
Sustainability 11 03606 g004
Figure 5. Authors cooperation network in smart city research. Note: (a) network visualization was based on author link-weights; (b) overlay visualization was based on author link-weights and citation scores; (c) overlay visualization was based on document-weights and average publication year scores.
Sustainability 11 03606 g005
Figure 6. Co-author visualization map of countries/regions. Note: (a) network visualization map was based on document-weights; (b) density visualization map was based on document-weights.
Sustainability 11 03606 g006
Figure 7. Citation visualization map of countries/regions. Note: (a) network visualization map was based on citation-weights; (b) density visualization map was based on citation-weights.
Sustainability 11 03606 g007
Figure 8. Range of target organization under different thresholds. Note: *the selected threshold meets analysis need.
Sustainability 11 03606 g008
Figure 9. The visualization map of research organizations on smart cities. Note: (a) organizational network visualization map was based on document-weights; (b) density visualization map of organizations was based on total link-weights.
Sustainability 11 03606 g009
Figure 10. The visualization map of journal publications.
Sustainability 11 03606 g010
Table 1. Top 10 most productive sources, authors, organization and countries among 4409 publications (time span: 1986—May 8, 2019).
RankingSource TitlesAuthorsOrganizations-EnhancedCountries/Regions
STaPCbNamePCOrganizationsPCCountries/RegionsPC
Top 1Sensors215Zhang Y24Chinese Academy of Sciences101USA1053
Top 2IEEE Access194Liu Y19University of California System60Peoples R China871
Top 3Sustainability131Munoz L17University of London59Spain454
Top 4Sustainable Cities and Society88Song HB15State University System of Florida53Italy421
Top 5Future Generation Computer Systems84Wang Y15Wuhan University51England390
Top 6IEEE Communications Magazine74Li Y14University of Texas System47Australia249
Top 7CITIES72Yigitcanlar T14Delft University of Technology44Canada231
Top 8IEEE Communications Transactions on Intelligent Transportation Systems71Kumar N13Massachusetts Institute of Technology MIT45South Korea222
Top 9IEEE Internet of Things Journal66Li J12Shanghai Jiao Tong University41India161
Top 10Transportation Research Record 56Liu AF/Zhang H c12University of Bologna41Germany160
Note: a ST: source titles; b PC: publication count; c both 12 publications.
Table 2. The link and total link strength of the top 10 occurrence keywords.
RO aKeywordsCluster Number bLinksTotal Link StrengthOccurrencesAPY c
Top 1Smart city23786196612017
Top 2Smart cities23916196522011
Top 3Cities13283884052011
Top 4Internet22662963042017
Top 5City12922552662008
Top 6IoT22372552632017
Top 7Model32982422562008
Top 8Management43072482552016
Top 9System32591982072016
Top 10Things21891741742017
Note: a RO: ranking order; b cluster number (in Figure 3); c APY: average publication year in Figure 3b.
Table 3. The top 10 strong co-authorship linked document-productive authors.
RO aAuthorsLinksTotal Link StrengthDocumentsAC bAPY c
Top 1Song, Houbing172516212017
Top 2Kumar, Neeraj6131372018
Top 3Liu, Anfeng82111152019
Top 4Kantarci, Burak61111132017
Top 5Choo, Kim-Kwang Raymond671182017
Top 6Sangaiah, Arun Kumar581142018
Top 7Foschini, Luca82410362015
Top 8Paul, Anand72410182018
Top 9Lloret, Jaime681062017
Top 10Corradi, Antonio5219372015
Note: a RO: ranking order; b AC: average citations in Figure 5b; c APY: average publication year in Figure 5b.
Table 4. The main countries/regions cooperation characteristics.
RO aCountries/RegionsLinksTotal Link StrengthDocumentsAC bAPY c
Top 1USA48686104916,3382010
Top 2Peoples Republic of China4259487070742017
Top 3Spain4226245343462011
Top 4Italy4429642178792016
Top 5England4441338755462011
Top 6Canada4323322940142006
Top 7Australia4024224833702016
Top 8South Korea3218422221082007
Top 9India361341619292017
Top 10Germany4017816019832016
Note: a RO: ranking order; b AC: average citations (show in Figure 7); c APY: average publication year (counted with VOSviewer).

