Article

In-Plant Logistics Simulation Model for the Catering Service Industry Towards Sustainable Development: A Case Study

1
Department of Industrial Engineering, the Hong Kong Polytechnic University, Hung Hom, Kowloon, Hong Kong, China
2
Department of Information Management and Engineering, Zhejiang University of Finance & Economics, Hangzhou 310018, China
*
Author to whom correspondence should be addressed.
Sustainability 2019, 11(13), 3655; https://doi.org/10.3390/su11133655
Submission received: 24 May 2019 / Revised: 30 June 2019 / Accepted: 2 July 2019 / Published: 3 July 2019
(This article belongs to the Section Sustainable Urban and Rural Development)

Abstract

:
An increasing number of people are conscious of the environmental awareness in various industries, particularly in city areas. It is now a popular trend for the urban catering service industry to outsource its labor-intensive activities, such as dishwashing, to a central dishwashing facility, in which labor force management and optimization are essential. Moreover, the increasing labor cost and fluctuating labor supply drive the increasing need for labor force optimization. This research develops an in-plant logistics simulation model for a central dishwashing facility with the purpose of improving its labor force utilization rate. A discrete event simulation model is established to simulate the tableware washing process, and this model is employed in a one-stop environmentally hygienic dishwashing service provider for trial implementation. The simulation result has been compared with actual situations, identifies the main bottlenecks of the tableware washing process, optimizes the utilization rate of the labor force, and further helps to improve the productivity.

1. Introduction

In recent years, the consciousness in regard to sustainability has been growing tremendously in terms of government regulations, consumer awareness, market competition, etc. Sustainability aims to create and maintain a harmonious balance between human activities and natural resources, without sacrificing and compromising the needs of future generations [1,2]. The concept of sustainability in the manufacturing and service industry has been materialized, as an increasing number of people have been paying attention to environmental issues, such as global warming, environment deterioration, and resource and energy conservation [3,4]. Also, the public has realized the side effects of the manufacturing and service industry and the adverse impact of disposing of nonbiodegradable products [5]. The manufacturing and service industry holds the potential to lessen the adverse impact of environmental pollution in terms of all levels of material flow, from raw materials acquisition, to product manufacturing, to product packaging, to product distribution, to product consumption and, finally, to product disposal [6]. Moreover, the demand for environmentally hygienic services, green products, and substitution of nonrenewable resources is increasing significantly, and such a trend in the manufacturing and service industry drives the core of industrial economies from cost-effective strategies to sustainable strategies in production scheduling, network design, implementation of reverse logistics, and other aspects [7,8,9]. In other words, various green activities and green operations can contribute to the improvement of the environmental, economic, and social development by means of preserving natural resources, introducing competitive innovations and providing higher standards of living [10]. The necessity of deploying green operations arouses the awareness of academic researchers and industrial practitioners in seeking green solutions in the manufacturing and service industry [11,12].
The catering service industry is a special category in the manufacturing and service industry, which emphasizes the provision of food, beverages and other services. The requirement for catering services increases significantly in metropolitan cities along with the development of the economy, and various catering service providers have arisen, such as large catering corporations, small restaurants, and even individuals. Apart from providing high quality food, catering service providers face some other challenging problems, such as food waste, unhygienic tableware, and overuse of disposable tableware. In order to reduce the overuse of disposable tableware, catering service providers prefer to use recyclable tableware. However, the dishwashing of dirty tableware is a time-consuming and labor-intensive job for catering service providers. Therefore, an increasing number of catering service providers tend to outsource their dishwashing activities by choosing a professional dishwashing service provider, which provides a centralized dishwashing service for the large amount of dirty tableware from restaurants, using their professional machines and human operations. However, facing an increasing amount of dirty tableware, the increasing labor force cost, and fluctuating labor supply, dishwashing service providers need to improve their operational performance by enhancing the labor force utilization rate and balancing the labor force cost and labor workload [13]. Given this consideration, this research explores the major challenges faced by dishwashing service providers towards the environmental development of this industry.
In order to explore the challenges facing the dishwashing service industry, the simulation approach was employed in this research, which is a practical approach to anticipate possible effects and to measure operational efficiency. The simulation approach acts as a comparable counterpart to explicitly demonstrate the functions and operations of the system [14]. A simulation model with distinct goals and reliable processes can imitate the practical scenarios and generate reasonable suggestions for decision makers, and can be iteratively implemented with necessary adjustments for continuous improvement [15]. To be more specific, discrete event simulation (DES), in contrast to continuous simulation, modelling the activities of a specific system as a discrete sequence of events is employed in this research. DES has the capability of shaping up virtual computational experiments with guided processing sequences [16], which is a useful tool for decision makers to measure the efficiency of a production system and identify key components for productivity improvement.
In this research, an in-plant logistics DES model was implemented to measure the efficiency of a dishwashing factory in terms of identifying the main bottlenecks and key operations in the dishwashing process. The contribution of this research is threefold. First, it is a pilot application of DES into the dishwashing service process, and this successful implementation can provide useful insights for DES application in other scenarios. Second, the comparison between simulation results and the actual situation provides valuable suggestions for decision-making concerning labor force optimization and productivity improvement in this specific dishwashing factory. Third, such a labor optimization approach in a dishwashing factory can inspire similar exploration in other labor-intensive manufacturing and service industries towards both performance improvement and sustainable development.
The remainder of this paper is organized as follows. In Section 2, a literature review is conducted in view of the application of simulation modelling. Section 3 describes the operations and processes of the targeted factory. In Section 4, a simulation model is built and executed, in which the result analysis is provided and analyzed. Finally, Section 5 concludes this research.

2. Literature Review

Simulation modelling has been widely used in the manufacturing and service industry in order to acquire managerial insights from existing or proposed systems, among which DES is a popular method for modelling complex dynamic systems by abstracting discrete events, and has been widely used in various industrial settings. For example, Chen et al. [17] used DES modelling to classify the inventory level for a chemical plant. Iannoni and Morabito [18] employed DES to evaluate the cross-docking operation within a supply chain. Bergero and Kofman [19] introduced power discrete event system specification (PowerDEVS) for hybrid modelling. Bonaventura et al. [20] introduced a CD++Builder, which aimed at providing user-friendly graphical modelling tools to simplify the model construction and simulation execution. Wang et al. [21] designed a DES system for multiple resources and materials allocation to resolve job-shop scheduling problems. Seebacher, Winkler, and Oberegger [16] studied the in-plant logistics efficiency considering the downtime of each machine and the duration of an empty run using DES. Leonardo and Emre [22] evaluated alternative resource allocation in a hospital emergency department using DES. Zupan et al. [23] conducted a layout optimization study of a production cell using DES. Yentl and Hans [24] provided an overview of different DES tools by identifying their supported formalisms, compliance, features, and performance.
In this research, simulation modelling approach is employed to measure the operational performance, identify the key components, and further improve the productivity. To be more specific, ProModel, which is a powerful windows-based DES tool, is used to develop the in-plant logistics simulation model, considering its capability to streamline and alter existing processes for continuous improvement. The ProModel simulation tool has also been employed in a number of research studies. For example, Yu et al. [25] employed ProModel to simulate the production operations for an automotive assembly workstation. Tearwattanarattikal et al. [26] conducted a case study regarding the plant layout design and planning in a plastic packaging factory using ProModel. Sandanayake et al. [27] used ProModel to simulate different experimental scenarios for just-in-time (JIT) manufacturing environment.

3. Case Study

In order to better understand the practical situation of dishwashing services in the catering service industry, a case study was conducted in a one-stop environmental hygiene catering service provider. This service provider has been facing an ever-increasing demand in dishwashing services. The obligation of the service provider is to provide a hygienic dishwashing service to its customers within the required time periods. To be more specific, customers usually request a one-day cycle of dishwashing service, which includes the time to deliver dirty dishes to factory, to execute dishwashing processes, and to return cleaned dishes to corresponding customers. Due to the high customer demand, the factory has to operate 16 h per day on normal working days and may need extra overtime work on holidays. The service provider faces severe challenges in maintaining a high service level considering the labour workload cost and customer demand.
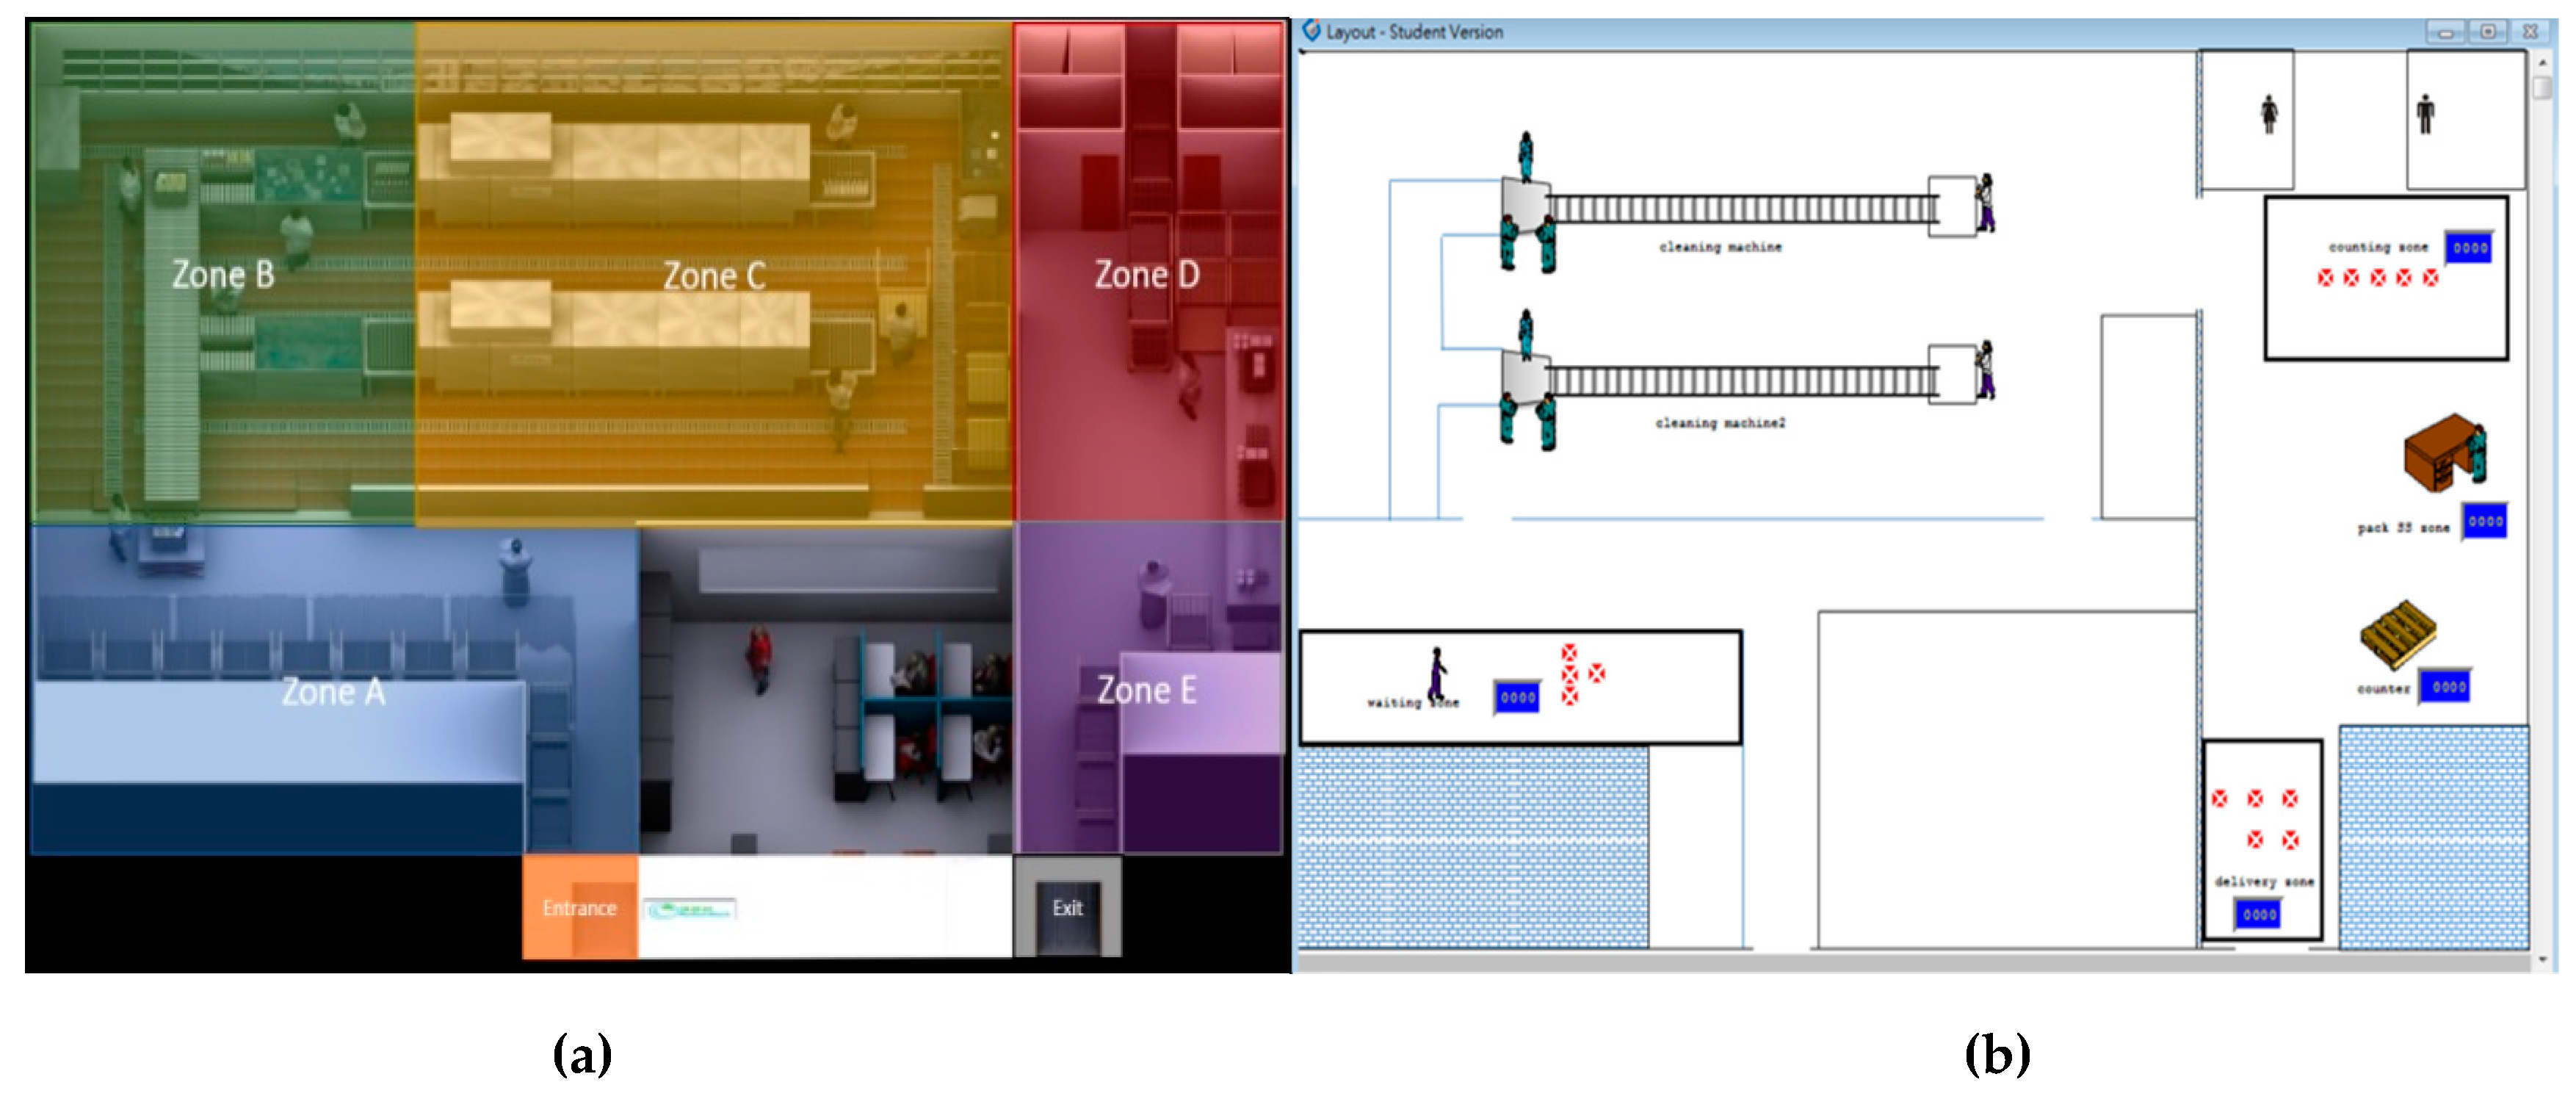
The current operational scenario is described in Figure 1, which consists of four major processes, i.e., (1) solid waste removal, (2) hygienic dishwashing, (3) output enumeration, and (4) packing. The operational flow of this case company can be described as follows. Firstly, soiled dishes are collected by truck from restaurants, and then delivered to this factory. Then, the soiled dishes are stored temporarily in Zone A until the availability of the next process. After that, workers transfer the soiled dishes to Zone B for the process of solid waste removal. This process, which is highly labour intensive, removes observable wastage before feeding the dishes into the automated hygiene dishwashing machine. The automated hygiene dishwashing machines, which are essential for dish sterilisation, subsequently provide deep-cleaning to ensure the cleaning quality. Following the self-propelling cleaning system in Zone C, an enumeration process is conducted in Zone D by workers to calculate the number and weight of each box of tableware for data recording and service-fee charging. The cleaned dishes are eventually packed on pallets in Zone E, and ready for distribution.

4. Simulation Model

4.1. Input Parameters

This study aims to design and formulate an in-plant logistics simulation model for the catering service industry to optimize the resource utilization rate. For this purpose, a case study is conducted in a one-stop environmentally hygienic catering service provider. In this case, the dirty tableware are collected from customers and delivered to this factory in a daily pattern. For example, 60 boxes of dirty dishes and 15 boxes of dirty cutlery are delivered to this factory at 17:30 and 20:00 and they are planned to be returned to customers at 18:00 and 22:30 the next day, respectively. More details regarding the input dirty tableware are shown in Table 1.
Two operations, i.e., pre-washing and machine_cleaning, are the most critical operations among all the cleaning operations. Table 2 shows the operational time for cleaning dirty dishes and dirty cutlery, respectively, in these two operations. For example, the operational time of cleaning dirty dishes in the pre-washing operation follows a normal distribution with mean value at 4.99 min and standard deviation at 1.14 min. Table 3 lists the operational time for the packing and counting operations. The raw data is collected from the actual operations and then processed by the “Stat::fit” function of ProModel, which is a distribution fitting software package designed to transform the raw data into a single distribution.

4.2. Workflow Modelling

As mentioned in the previous section, the proposed in-plant logistics simulation model for human resource optimization is developed using ProModel. The simulation settings of the locations and entities are shown in Table 4 and Table 5. In total, 9 locations are determined and the tableware has to pass through these locations during the cleaning process. The capacity of “Waiting_zone,” “Counting_zone,” and “Delivery_zone” are assumed to be infinite. The status of the tableware is changed from “dirty” to “pre-washed,” then to “clean” and finally “counted” along with the movement passing through these locations. The “Oldest” rule refers to the earliest arrived entities being selected first, while the “FIFO” rule means “first in, first out.”
The simulation settings of processing dishes and cutlery are shown in Table 6 and Table 7, respectively. Step 1 means that the dirty tableware is transferred from the waiting zone to locations “Pre-washing_1” and “Pre-washing_2.” Since two dishwashing machines are available in this factory, two groups of pre-washing workers are defined in the simulation model. The output of step 1 is dirty tableware, as no cleaning processes are involved. Two rules, “FIRST 1” and “First,” are employed in step 1. “FIRST 1” means that the first available locations are set to the primary routing. In this study, the dirty tableware from the waiting zone is transferred to “Pre-washing_1” first. If “Pre-washing_1” is working, the dirty tableware is transferred to “Pre-washing_2”. The “Move Logic” of “Move with mover” means the dirty tableware is transferred by the mover from the waiting zone to the pre-washing locations.
In step 2, dirty tableware is washed by the pre-washing workers after being transferred from the waiting zone. The pre-washing workers wash the dirty dishes by hand, and the pre-washing process regarding dishes follows a normal distribution as N ( 4.99 ,   1.14 ) , while the pre-washing process regarding cutlery follows an exponential distribution as E ( 7.5 ,   20.5 ) . The output of step 2 is the pre-washed dishes and pre-washed cutlery. In step 3, the pre-washed dishes and cutlery are then put into the cleaning machines for cleaning. The cleaning time for a box of dishes and cutlery is 6 min and 3 min, respectively. The “Move Logic” of “Move with collector_1/ collector_2” means that the clean tableware is transferred by collector_1/collector_2 from the cleaning machines to the counting zone.
In step 4, the clean dishes are transferred from the counting zone to the counter for counting, while the clean cutlery in the counting zone is transferred to the cutlery packing zone by the packer. In step 5, the counting process follows a normal distribution as N ( 2.47 ,   1.08 ) . The counted dishes are transferred to the delivery zone, waiting for delivery. The clean cutlery in the cutlery packing zone is assumed to be packed based on a lognormal distribution as L ( 6.9 ,   54.1 ) . After packing, the cutlery are weighed and counted by the packer in a process assumed to follow a normal distribution as N ( 2.47 ,   1.08 ) . After counting, the cutlery is transferred to the delivery zone by the packer for delivery. In step 6, a batch of tableware including 60 boxes of dishes and 15 boxes of cutlery are packed and transferred back to the customers after counting. For simulation settings, the “Run time” of the simulation model is set as 480 h. As there are 16 working hours every day, the run time of the simulation 480 h equals 30 days.

4.3. Model Validation

The results of the simulation model are compared with the actual situation. Table 8 shows the actual data collected based on observation. For example, the pre-washing process takes 5 min on average to pre-wash the dirty dishes. The utilization rate is calculated as the actual performance divided by the optimum performance. Table 9 shows a comparison of the utilization rates from the actual situation and simulation model. The developed simulation model is proven to be effective and efficient for modelling the real situation in this dishwashing factory, as the results are similar within ±5% difference. Table 10 shows the simulation results, which indicate that more than 92% of jobs can be completed based on current conditions in this factory. The simulation results show that the service provider cannot finish all the jobs. However, in some extreme situations, the service provider can extend the operational time or increase the number of workers of each zone so as to improve productivity to finish the jobs and deliver the clean tableware to customers on time.

4.4. Results Analysis

Table 11 shows the results of the simulation model in this factory after simulating the washing process (30 days, 480 working hours). The total number of boxes of dirty dishes and cutlery are 8550 and the total output in “Delivery_zone” is 7943. Therefore, the productivity is calculated as 92.9%. During the peak cleaning period, the average number of boxes in the “Waiting_zone” is around 389 (maximum numbers is 787 boxes), while the daily incoming dirty tableware is 285 boxes. This indicates that the service provider cannot completely clean all the dirty tableware delivered every day. Moreover, the results show that, in the working days, the service provider can finish the daily jobs; however, not in a stable and efficient way. Occasionally, overtime working and increasing the number of workers to finish jobs is necessary. The results also highlight that the bottleneck in the cleaning process work is the pre-washing process. In the “Waiting zone,” the maximum number of dirty tableware boxes is 787, and the average waiting time is around 22 h. The utilization rate in the pre-washing zone is around 90%, which means that the pre-washing zone reaches a high level of productivity and it cannot cope with the incoming dirty tableware.
The labour force is adjusted to investigate the relationships between the tableware output and the labour force. The simulation results indicate that the main bottleneck is the pre-washing process; therefore, the number of pre-washing workers has been changed and the dishes and cutlery have been analysed correspondingly. The speed of the pre-washing is assumed to be changed in a proportional way when the pre-washing workers change. The numbers of pre-washing workers are assumed to be evenly divided into two cleaning lines. The maximum number of pre-washing workers for each washing line is six, considering the limited standing place on site. Figure 2 shows that the output of tableware increases when the number of pre-washing workers increases from one to six. The output remains at an optimal level (around 270 boxes) when the number of pre-washing workers is more than five. When the pre-washing workers are more than five, one to two workers are required in order to speed up the counting process. According to the current contract between the customers and the service provider, the amount of dirty dishes is 240 boxes and the existing six pre-washing workers are adequate to meet this requirement.
Regarding the cutlery, as shown in Figure 2, the output of clean cutlery increases steadily when the number of pre-washing workers increases from one to twelve. The maximum output is 341 boxes when there are twelve pre-washing workers. The amount of dirty cutlery based on the contract is 45 boxes. One to two additional pre-washing workers are needed for cleaning dirty cutlery as the existing six pre-washing workers are only adequate to complete the cleaning process of the dirty dishes. Table 12 shows the optimal solutions, while Table 13 shows the corresponding simulation results. In the original solution with six pre-washing workers, the productivity is around 92%. In new solution, the productivity can reach 96.26% with seven pre-washing workers and 99.40% with eight pre-washing workers. The results show that it is an optimal solution to keep the pre-washing workers at a level of eight. Table 14 shows a comparison of workers between the original and new solutions.

5. Conclusions

This study analyzes a challenging problem arising from environmental issues in the catering service industry. Due to the fluctuating labor supply, it is difficult for enterprises to sustain green operations and high-quality services without a dynamic and efficient human resource management approach. For this purpose, this study provides an approach to construct an in-plant logistics simulation model for green service providers to solve the bottleneck of production and optimize human resources utilization. Apart from the analysis and optimization of current processes, the proposed model is capable of visualizing the operational processes through realistic animation. Useful information can be provided for decision makers to streamline and alter the existing processes for improvement. A case study using simulation is conducted in a one-stop environmentally hygienic catering service provider. The simulation results highlight that the pre-washing process is a main bottleneck in tableware washing work. Moreover, the simulation results show that productivity can increase 7% and no overtime work is required if two additional workers are present. The outcome of this study can not only improve the productivity of the tableware washing factory, but also can allow green service providers to optimize their labor forces and resources in a more dynamic, efficient, and systematic way.
Even though the proposed model is capable of providing useful suggestions for decision makers, there are still some limitations and future work, which can improve the quality of this study. One of the limitations is related to human working performance. Individual workers have their own capability and working experience. They have different working performance in completing the tasks. The long working hours also greatly affect working performance and lessen productivity. However, in the simulation model, the workers are assumed to work in a constant way. In some cases, the simulation model may vary with the real situation. Another limitation concerns data collection. In this study, two months were spent on data collection without considering the increasing demand before or after holidays. To improve the situation, data regarding particular periods should be collected and investigated. Further research can be considered in adopting emerging technologies, e.g., Internet of Things, Cloud Computing and Cyber Physical System, to upgrade the traditional manufacturing or industrial processes to smart factories and enable Industry 4.0.

Author Contributions

Conceptualization, C.K.M.L.; methodology, K.K.H.N. and S.Z.Z.; software, K.K.H.N. and S.Z.Z.; validation, K.K.H.N. and S.Z.Z.; Writing—Original draft preparation, K.K.H.N. and S.Z.Z.; Writing—Review and editing, C.K.M.L.

Funding

This work was funded in part by the Humanities and Social Science Foundation of Ministry of China under grant number 19YJC630216, in part by the Natural Science Foundation of Zhejiang Province, China under the grant number LY19G010003, and supported by a grant from a collaboration research project of the Department of Industrial and Systems Engineering, the Hong Kong Polytechnic University (Project No. H-ZDAK).

Conflicts of Interest

The authors declare no conflict of interest.

References

  1. Mahler, D. The sustainable supply chain. Supply Chain. Manag. Rev. 2007, 11, 59–60. [Google Scholar]
  2. Lee, C.K.M.; Lv, Y.; Ng, K.K.H.; Ho, W.; Choy, K.L. Design and application of Internet of things-based warehouse management system for smart logistics. Int. J. Prod. Res. 2018, 56, 2753–2768. [Google Scholar] [CrossRef]
  3. Lee, C.K.M.; Keung, K.L.; Ng, K.K.H.; Lai, D.C.P. Simulation-based Multiple Automated Guided Vehicles Considering Charging and Collision-free Requirements in Automatic Warehouse. In Proceedings of the 2018 IEEE International Conference on Industrial Engineering and Engineering Management (IEEM), Bangkok, Thailand, 16–19 December 2018; pp. 1376–1380. [Google Scholar]
  4. Hu, H.; Ng, K.K.H.; Qin, Y. Robust Parallel Machine Scheduling Problem with Uncertainties and Sequence-Dependent Setup Time. Sci. Program. 2016, 2016, 13. [Google Scholar] [CrossRef]
  5. Zhang, Q.; Shah, N.; Wassick, J.; Helling, R.; van Egerschot, P. Sustainable supply chain optimisation: An industrial case study. Comput. Ind. Eng. 2014, 74, 68–83. [Google Scholar] [CrossRef]
  6. Krajčovič, M.; Hančinský, V.; Dulina, Ľ.; Grznár, P.; Gašo, M.; Vaculík, J. Parameter setting for a genetic algorithm layout planner as a toll of sustainable manufacturing. Sustainability 2019, 11, 2083. [Google Scholar] [CrossRef]
  7. Hutchins, M.J.; Robinson, S.L.; Dornfeld, D. Understanding life cycle social impacts in manufacturing: a processed-based approach. J. Manuf. Syst. 2013, 32, 536–542. [Google Scholar] [CrossRef]
  8. Zhang, S.; Lee, C.K.M.; Chan, H.K.; Choy, K.L.; Wu, Z. Swarm intelligence applied in green logistics: A literature review. Eng. Appl. Artif. Intell. 2015, 37, 154–169. [Google Scholar] [CrossRef]
  9. Lee, C.K.M.; Ng, K.K.H.; Kwong, C.K.; Tay, S.T. A system dynamics model for evaluating food waste management in Hong Kong, China. J. Mater. Cycl. Waste Manag. 2018, 21, 433–456. [Google Scholar] [CrossRef]
  10. Jayal, A.D.; Badurdeen, F.; Dillon, O.W., Jr.; Jawahir, I.S. Sustainable manufacturing: Modeling and optimization challenges at the product, process and system levels. CIRP J. Manuf. Sci. Technol. 2010, 2, 144–152. [Google Scholar] [CrossRef]
  11. Murphy, P.R.; Poist, R.F. Green logistics strategies: An analysis of usage patterns. Transp. J. 2000, 40, 5–16. [Google Scholar]
  12. Ng, K.K.H.; Lee, C.K.M.; Zhang, S.Z.; Wu, K.; Ho, W. A multiple colonies artificial bee colony algorithm for a capacitated vehicle routing problem and re-routing strategies under time-dependent traffic congestion. Comput. Ind. Eng. 2017, 109, 151–168. [Google Scholar] [CrossRef]
  13. Li, M.; Wu, G.D.; Lai, X.D. Capacity coordination mechanism for supply chain under supply-demand uncertainty. Int. J. Simul. Model. 2014, 13, 364–376. [Google Scholar] [CrossRef]
  14. Höppe, N.; Seeanner, F.; Spieckermann, S. Simulation-based dispatching in a production system. J. Simul. 2016, 10, 89–94. [Google Scholar] [CrossRef]
  15. Centobelli, P.; Cerchione, R.; Murino, T.; Gallo, M. Layout and material flow optimization in digital factory. Int. J. Simul. Model. 2016, 15, 223–235. [Google Scholar] [CrossRef]
  16. Seebacher, G.; Winkler, H.; Oberegger, B. In-plant logistics efficiency valuation using discrete event simulation. Int. J. Simul. Model. 2015, 14, 60–70. [Google Scholar] [CrossRef]
  17. Chen, E.J.; Lee, Y.M.; Selikson, P.L. A simulation study of logistics activities in a chemical plant. Simul. Model. Pract. Theory 2002, 10, 235–245. [Google Scholar] [CrossRef]
  18. Iannoni, A.P.; Morabito, R. A discrete simulation analysis of a logistics supply system. Transp. Res. Part E Logist. Transp. Rev. 2006, 42, 191–210. [Google Scholar] [CrossRef]
  19. Bergero, F.; Kofman, E. PowerDEVS: A tool for hybrid system modeling and real-time simulation. Simulation 2011, 87, 113–132. [Google Scholar] [CrossRef]
  20. Bonaventura, M.; Wainer, G.A.; Castro, R. Graphical modeling and simulation of discrete-event systems with CD++ Builder. Simulation 2013, 89, 4–27. [Google Scholar] [CrossRef]
  21. Wang, C.; Liu, X.B.; Zhao, G.Z.; Chin, K.O. Multi-objective integrated production planning model and simulation constrained doubly by resouce and materials. Int. J. Simul. Model. 2014, 13, 243–254. [Google Scholar] [CrossRef]
  22. Leonardo, B.V.; Emre, K. Evaluating alternative resource allocation in an emergency department using discrete event simulation. Simulation 2016, 92, 1041–1051. [Google Scholar] [Green Version]
  23. Zupan, H.; Herakovic, N.; Zerovnik, J.; Berlec, T. Layout optimization of a production cell. Int. J. Simul. Model. 2017, 16, 603–616. [Google Scholar] [CrossRef]
  24. Yentl, V.T.; Hans, V. An evaluation of DEVS simulation tools. Simulation 2017, 93, 103–121. [Google Scholar]
  25. Yu, Q.; Duffy, V.; McGinley, J.; Rowland, Z. Productivity simulation with promodel for an automotive assembly workstation involving a lift assist device. In Proceedings of the 38th conference on Winter simulation, Monterey, CA, USA, 3–6 December 2006; pp. 1935–1939. [Google Scholar]
  26. Tearwattanarattikal, P.; Namphacharoen, S.; Chamrasporn, C. Using ProModel as a simulation tools to assist plant layout design and planning: Case study plastic packaging factory. Songklanakarin J. Sci. Technol. 2008, 30, 117–123. [Google Scholar]
  27. Sandanayake, Y.G.; Oduoza, C.F.; Proverbs, D.G. A systematic modelling and simulation approach for JIT performance optimisation. Robot. Comput. Integr. Manuf. 2008, 24, 735–743. [Google Scholar] [CrossRef]
Figure 1. Operation layout of actual factory (a) and simulation model (b).
Sustainability 11 03655 g001
Figure 2. Output of dishes and cutlery against number of pre-washing workers.
Sustainability 11 03655 g002
Table 1. The input settings.
Arrival TimeDeparture TimeFrequencyDirty Dishes (Boxes)Dirty Cutlery (Boxes)
117:3018:0016015
222:0022:3016015
322:3023:00112015
Table 2. The operational time for pre-washing and machine cleaning (minutes).
Dirty DishesDirty CutleryAverage Number of Workers
Pre-washing N ( 4.99 ,   1.14 ) E ( 7.5 ,   20.5 ) 3
Machine-cleaning63N/A
Table 3. The operational time for packing and counting (minutes).
Clean DishesClean CutleryAverage Number of Workers
PackingN/A L ( 6.9 ,   54.1 ) 2
Counting N ( 2.47 ,   1.08 ) N ( 2.47 ,   1.08 ) 1
Table 4. Simulation setting of locations.
Location NameCapacityUnitsRules
Zone AWaiting_zoneInfinite1Oldest, FIFO
Zone BPre-washing_131Oldest
Pre-washing_231Oldest
Zone CMachine-cleaning_111Oldest, FIFO
Machine-cleaning_211Oldest, FIFO
Zone DCounting_zoneInfinite1Oldest
Counter11Oldest
Zone EPack_cutlery_zone11Oldest
Delivery_zoneInfinite1Oldest
Note: FIFO is First In First Out.
Table 5. Simulation setting of entities.
Entity NameDirty_DishesPre-washed_DishesClean_DishesCount_Dishes
Speed50505050
Entity NameDirty_cutleryPre-washed_cutleryClean_cutleryCount_cutlery
Speed50505050
Table 6. Simulation settings of processing dishes.
StepEntityLocationOperationBlockOutputDestinationRuleMovie Logic
1Dirty_dishesWaiting_zoneN/A 1Dirty_dishesPre-washing_1FIRST 1Move with mover
Dirty_dishesWaiting_zoneN/A 1Dirty_dishesPre-washing_2FIRSTMove with mover
2Dirty_dishesPre-washing_1WAIT N   ( 4.99 ,   1.14 ) 1Pre-washed_dishesMachine_cleaning_1FIRST 1N/A
Dirty_dishesPre-washing_2WAIT N   ( 4.99 ,   1.14 ) 1Pre-washed_dishesMachine_cleaning_2FIRST 1N/A
3Pre-washed_dishesMachine_cleaning_1WAIT 61Clean_dishesCounting_zoneFIRST 1Move with collector_1
Pre-washed_dishesMachine_cleaning_2WAIT 61Clean_dishesCounting_zoneFIRST 1Move with collector_2
4Clean_dishesCounting_zoneN/A 1Clean_dishesCounterFIRST 1Move with counter
5Clean_dishesCounterWAIT N   ( 2.47 , 1.08 ) 1Count_dishesDelivery_zoneFIRST 1Move with counter
6Count_dishesDelivery_zoneGROUP batch 1Count_dishesExitFIRST 1N/A
Table 7. Simulation settings of processing cutlery.
StepEntityLocationOperationBlockOutputDestinationRuleMovie Logic
1Dirty_cutleryWaiting_zoneN/A1Dirty_cutleryPre-washing_1FIRST 1Move with mover
Dirty_cutleryWaiting_zoneN/A1Dirty_cutleryPre-washing_2FIRSTMove with mover
2Dirty_cutleryPre-washing_1WAIT E   ( 7.5 ,   20.5 ) 1Pre-washed_cutleryMachine_cleaning_1FIRST 1N/A
Dirty_cutleryPre-washing_2WAIT E   ( 7.5 ,   20.5 ) 1Pre-washed_cutleryMachine_cleaning_2FIRST 1N/A
3Pre-washed_cutleryMachine_cleaning_1WAIT 31Clean_cutleryCounting_zoneFIRST 1Move with collector_1
Pre-washed_cutleryMachine_cleaning_2WAIT 31Clean_cutleryCounting_zoneFIRST 1Move with collector_2
4Clean_cutleryCounting_zoneN/A1Clean_cutleryPack_cutlery_zoneFIRST 1Move with packer
5Clean_cutleryPack_cutlery_zoneWAIT L   ( 6.9 , 54.1 )
WAIT N ( 2.47 ,   1.08 )
1Count_cutleryDelivery_zoneFIRST 1Move with packer
6Count_cutleryDelivery_zoneGROUP batch1Count_cutleryExitFIRST 1N/A
Table 8. Actual data collection.
Average Time (Min)Optimum Number of BoxesObserved Number of Boxes
Pre-washingDishes5793745
Cutlery28121108
Machine_cleaningDishes33967745
Cutlery3575108
Dishes counting1.41628745
Cutlery packing6.9238108
Table 9. Results comparison between observation and simulation.
Utilization RateFrom ObservationFrom Simulation
Pre-washing93.33%89.32%
Machine_cleaning18.78%23.25%
Dish counting45.76%41.54%
Cutlery packing45.38%42.81%
Table 10. Results from simulation.
Cleaned and Counted BoxesDirty BoxesUtilization Rate
Dishes681449793.20%
Cutlery132810592.67%
Table 11. Detailed results of simulation.
NameTotal EntriesAverage Time (Minutes) Average BoxesMaximum Boxes
Waiting_zone85501309.78388.84787
Pre-washing_1396719.422.673
Pre-washing_2398819.382.683
Machine_cleaning_139646.260.861
Machine_cleaning_239866.260.871
Counting_zone794829.218.0646
Counter66981.790.421
Pack_cutlery_zone12459.900.431
Delivery zone7943111.2330.6874
Table 12. Optimal Solution.
Total Number of Boxes in Existing ContractsNumber of Pre-washing Workers
Dishes2405-6
Cutlery451-2
Table 13. Simulation results of the optimal solution.
Number of pre-washing Workers
78
Cleaning speed of dishes1511.25
Cleaning speed of cutlery22.516.88
Total input85508550
Total output82038450
Productivity96.26%99.40%
Table 14. Comparison of workers for original and new solutions.
WorkersOriginal SolutionNew Solution
Pre-washing 68
Collecting22
Counting12
Packing22
Total1114

