Article

Study on Safety Control of Composite Roof in Deep Roadway Based on Energy Balance Theory

1
Key Laboratory of Deep Coal Resource Mining, Ministry of Education of China, School of Mines, China University of Mining and Technology, Xuzhou 221116, China
2
WA School of Mines: Minerals, Energy and Chemical Engineering, Curtin University, Kalgoorlie, WA 6430, Australia
*
Authors to whom correspondence should be addressed.
Sustainability 2019, 11(13), 3688; https://doi.org/10.3390/su11133688
Submission received: 12 June 2019 / Revised: 2 July 2019 / Accepted: 3 July 2019 / Published: 5 July 2019
(This article belongs to the Special Issue High Performance Supercapacitors for Green Energy Storage)

Abstract

:
Improving the safety and stability of composite roof in deep roadway is the strong guarantee for safe mining and sustainable development of coal mines. With three roadways of different composite roofs in Hulusu Coal Mine and Menkeqing Coal Mine as the research background, this paper explores the mechanical properties and energy dissipation law of coal-rock structures with different height ratios from the perspective of energy release and dissipation through lab experiments. The results indicate that the key to the stability of coal-rock structures lies in maintaining relatively low dissipation energy. Based on experimental results and the energy balance theory, two support principles were put forward and applied to experimental roadways. The field monitoring results show that the anchoring force on different composite roof displays different characteristics, proving that the work done by the support can adjust timely to the energy release and conversion so as to improve the safety and stability of roadways with different composite roofs. This study provides a reference for the deformation control in deep roadways with composite roofs under similar conditions.

1. Introduction

The resource endowment of China which is featured by “rich coal, meager oil, and little gas” and the booming demand for energy inevitably lead to high-intensity mining of coal resources. With the constant mining of shallow resources, deep mining has become the inevitable trend of coal mining in China [1]. As the mining depth increases, the complicated geological environment and the intense mining pressure cause the development of severe roadway- surrounding rock fracture, which in turn triggers the sharp decline of bearing capacity. In this case, the roadway support difficulty would increase remarkably, and roadway deformation and instability become a high-probability event. What is worse, large-scale dynamic disasters like roof fall may occur within a range of several hundred meters. Therefore, the key to safe and efficient mining production consists of the roof stability of deep roadway [2,3].
There are many factors that influence roof stability [4,5,6,7,8,9], such as ground stress, surrounding rock property, support strength, and roof structure. The focus of this paper is placed upon the composite roof structure of the coal-rock combination. Since coal measure strata are usually layered sedimentary strata, composite roof, as a comparatively common rock occurrence, is widely distributed in coal mines. Currently, the safety control of composite roof has become one of the research hotspots both at home and abroad [10,11,12]. The composite roof is composed of two or more layers of coal and rock. Due to the weak inter-layer cohesion of composite roof, energy accumulates and dissipates in the roof as a result of stress disturbance, which in turn may cause layer separation on the interface between coal and rock. Meanwhile, the deformation and failure characteristics of coal and rock strata are different as well [13]. The uneven thickness of coal seam brings forth many coal-rock combinations of roadway roof, including the composite roof of different lithology, of thin coal and thick rock, of thick coal and thin rock, and of the pure coal seam. Consequently, the study of the mechanical characteristics and energy evolution law of different coal-rock structures is of great significance to roadway support design and rock-burst prevention [14,15].
Scholars both at home and abroad have conducted much research on the analysis of energy conversion in singular rock body or coal body and made remarkable achievements [16,17,18,19,20,21,22,23,24,25]. Xie [17] discussed the internal relation between energy dissipation, energy release, rock strength, and structural failure in the process of rock deformation. He pointed out that the deformation and failure of rock was the comprehensive result of energy dissipation and energy release. Steffler [18] maintained that the energy accumulated in the rock would be released at the crack tip, which in turn promoted the whole crack sliding. Huang [19] observed that the magnitude of initial confining pressure and unloading rate significantly influenced rock failure modes and strain energy conversion (accumulation, dissipation and release) during unloading. Hua [20] discussed the fracturing and failure mechanism during unloading, and its application to underground rock burst control. Zhao [21] put forward the least-energy principle of dynamic failure of rock mass—what is consumed in the process of dynamic failure is always the failure energy in a uniaxial stress state. Bagde [22] analyzed the relation between energy release and loading frequency and amplitude. Ferro [23] explored the influence of scale effect on dissipated energy density theoretically. Krzysztof [24] concluded that the balance of energy changes was related to energy density. However, the studies on energy evolution in the process of loading are quite rare at present. The existing studies mainly focus on the mechanical characteristics of coal-rock structure in the process of loading [26,27,28,29,30,31,32]. Zuo [26,27,28] conducted uniaxial, triaxial, and acoustic emission tests on the coal-rock structure and studied systematically its mechanical property and destruction characteristics in the loading and unloading cycle. Chen [29] conducted uniaxial compression tests on five groups of roof sandstone—coal pillar structures with different height ratios to explore the corresponding mechanical characteristics and progressive failure mechanism. Lu [30] studied the outburst proneness evolution law of roof-coal-floor combinations of different types and the testing results indicated that the outburst proneness increased when the strength and thickness of coal samples and rock mass increased. Liu [31] analyzed the influence of rock strength on the mechanical behavior and acoustic emission characteristics of coal-rock structures. Guo [32] used Particle Flow Code (PFC) 2D analytical software to simulate the test on coal-rock structures of different strength ratios and height ratios. On this basis, he further analyzed from a micro-perspective the influence of strength ratio and height ratio on the outburst proneness, failure mode, and compressive strength characteristics. In a word, research on the failure process of coal-rock structures of different height ratios from energy conversion perspective is still quite rare. The studies on the application of test results to roadway bolt support design are even rarer.
This study conducted uniaxial loading tests on coal-rock structures of different height ratios by Manager Testing Solution (MTS) testing system and revealed the mechanical properties and energy dissipation of different coal-rock combinations. On this basis, two support principles of the coal-rock composite roof were put forward and tested in three types of roadways. The variation law of anchorage force of different roof anchor cables indicated that the support system could control effectively the composite roof deformation of deep roadway.

2. Energy Dissipation Characteristics of Coal-Rock Structure in the Process of Loading

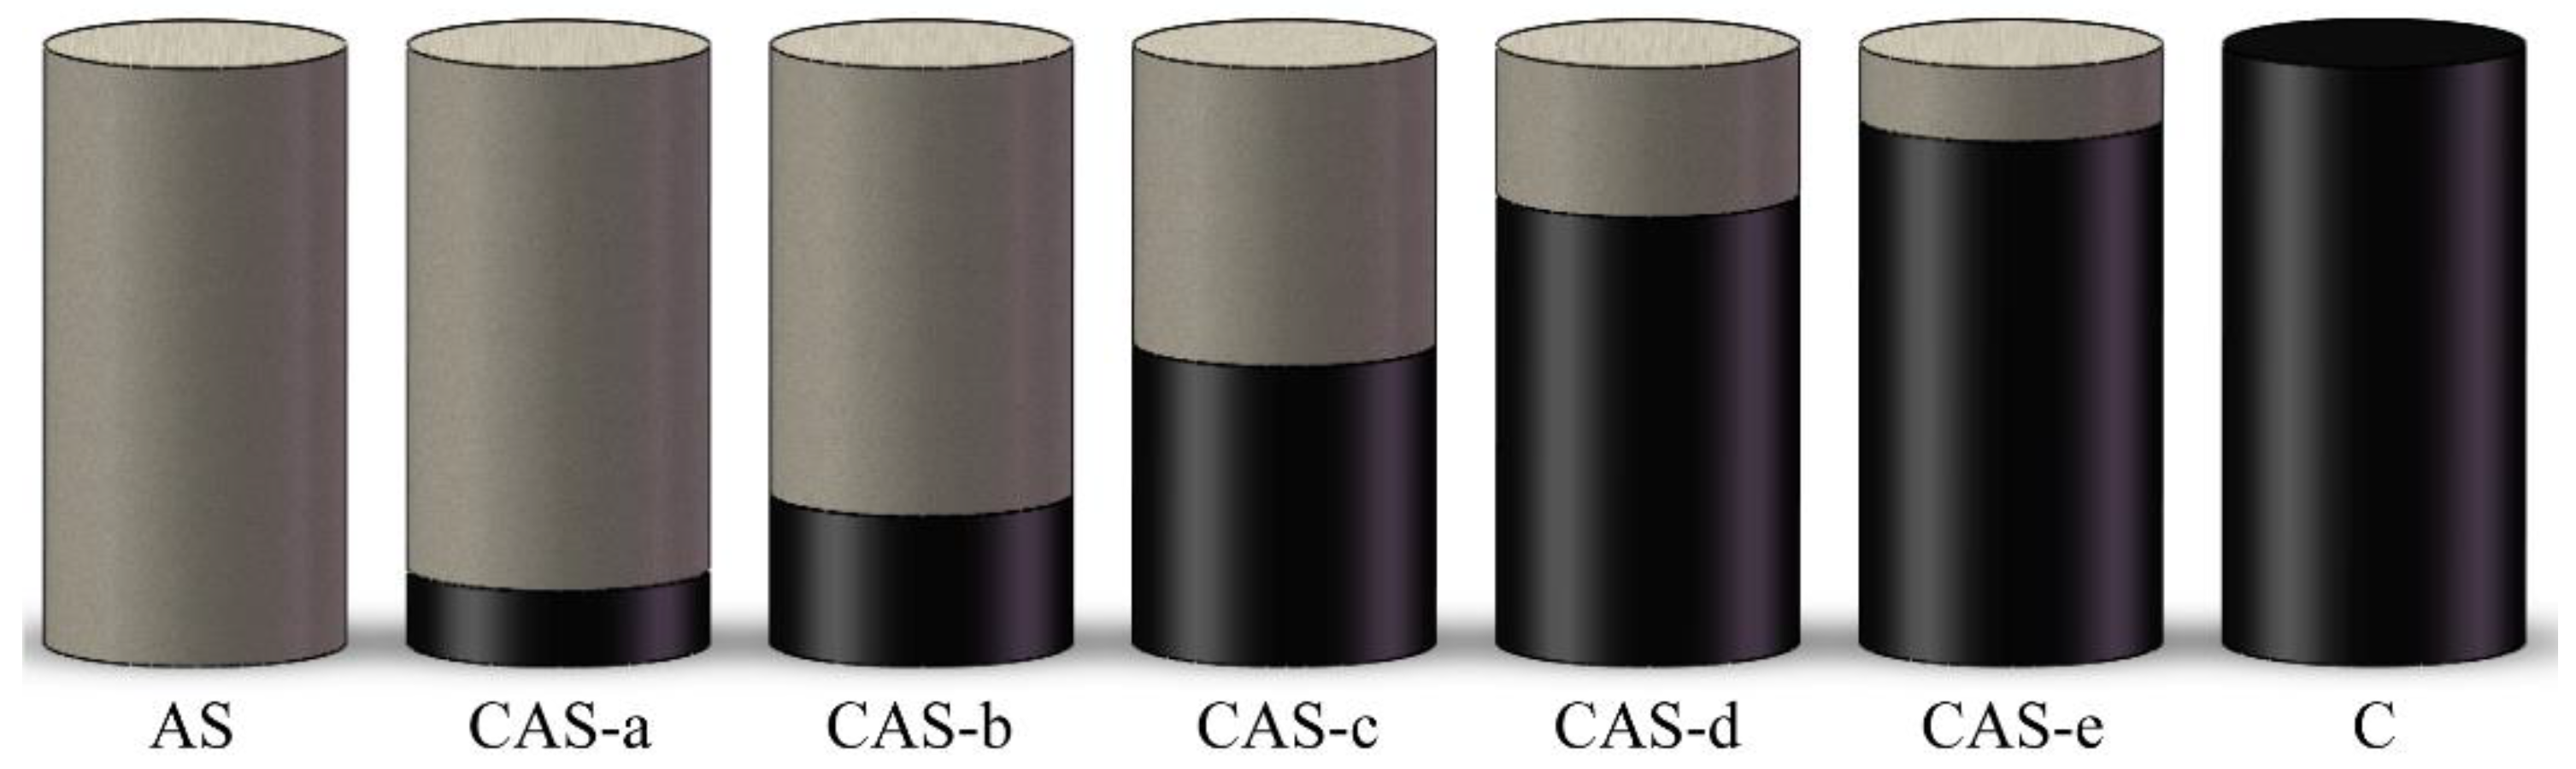
2.1. Sample Preparation and Experimental Method

The coal samples and roof rock samples were all taken from the Hulusu Coal Mine located in Ordos, Inner Mongolia Autonomous Region of China. The seam is located at a depth greater than 650 m. The immediate roof is argillaceous sandstone. At first, the nonstandard samples were processed to coal and rock samples whose diameter is 50 mm by core-drilling machines. Then these processed samples were cut to the heights needed in the experiments by rock cutting machines. The two end faces of the samples were then polished by rock polishing machines. The actual polishing specifications were as follows: the non-parallelism of the two-end faces should be no larger than 0.01 mm, and the diameter deviation of the two end faces no larger than 0.02 mm. Finally, the coal and rock samples of different heights were stuck together by glue in accordance with the specification of the standard samples. In the experiment, the coal-rock height ratios were set as 0:1, 1:7, 1:3, 1:1, 3:1, 7:1, and 1:0, respectively (as listed in Table 1). The seven types of coal-rock structures were represented as AS, CAS-a, CAS-b, CAS-c, CAS-d, CAS-e, and C. To ensure the accuracy of the experiments, three samples of each type were tested. The seven coal-rock structures are shown in Figure 1.
The loading control system used in the experiments was MTS Electro-hydraulic servo universal testing machine. The actual model is C64.106/1000 kN, whose maximum bearing capacity is 1000 kN, maximum stroke, velocity is 250 mm, and 0.5–90 mm/min, respectively. This machine, driven by AC servo motors, is featured by its high stability, accuracy, and data reliability. The force loading control was used in the experiment until the coal-rock structure sample failure occurred. The loading rate was set at 200 N/s. The stress exported from the machine was the overall stress of the coal-rock structure, and the strain was the sum of the axial strain of rock mass and coal mass.

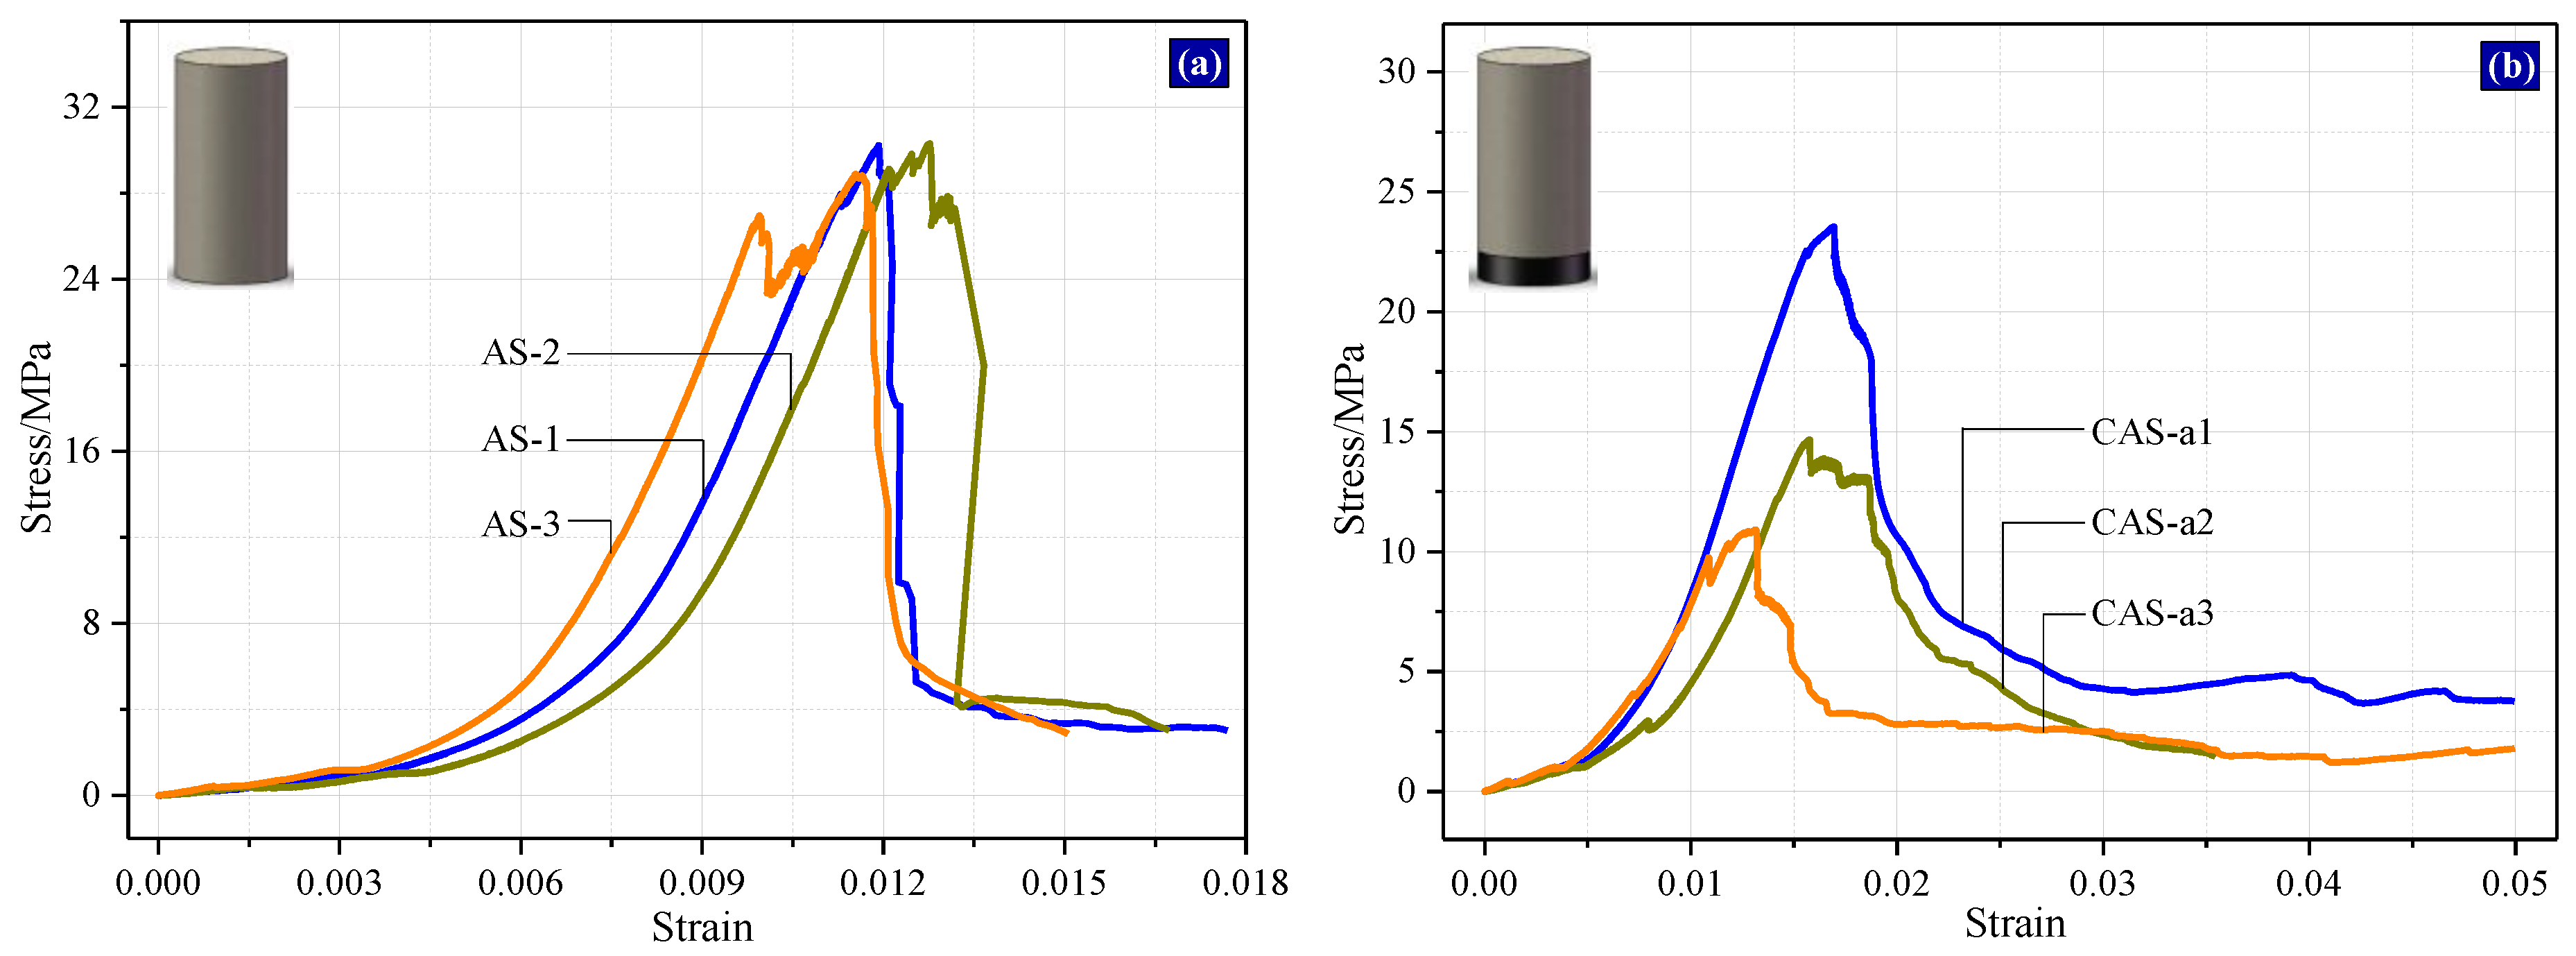
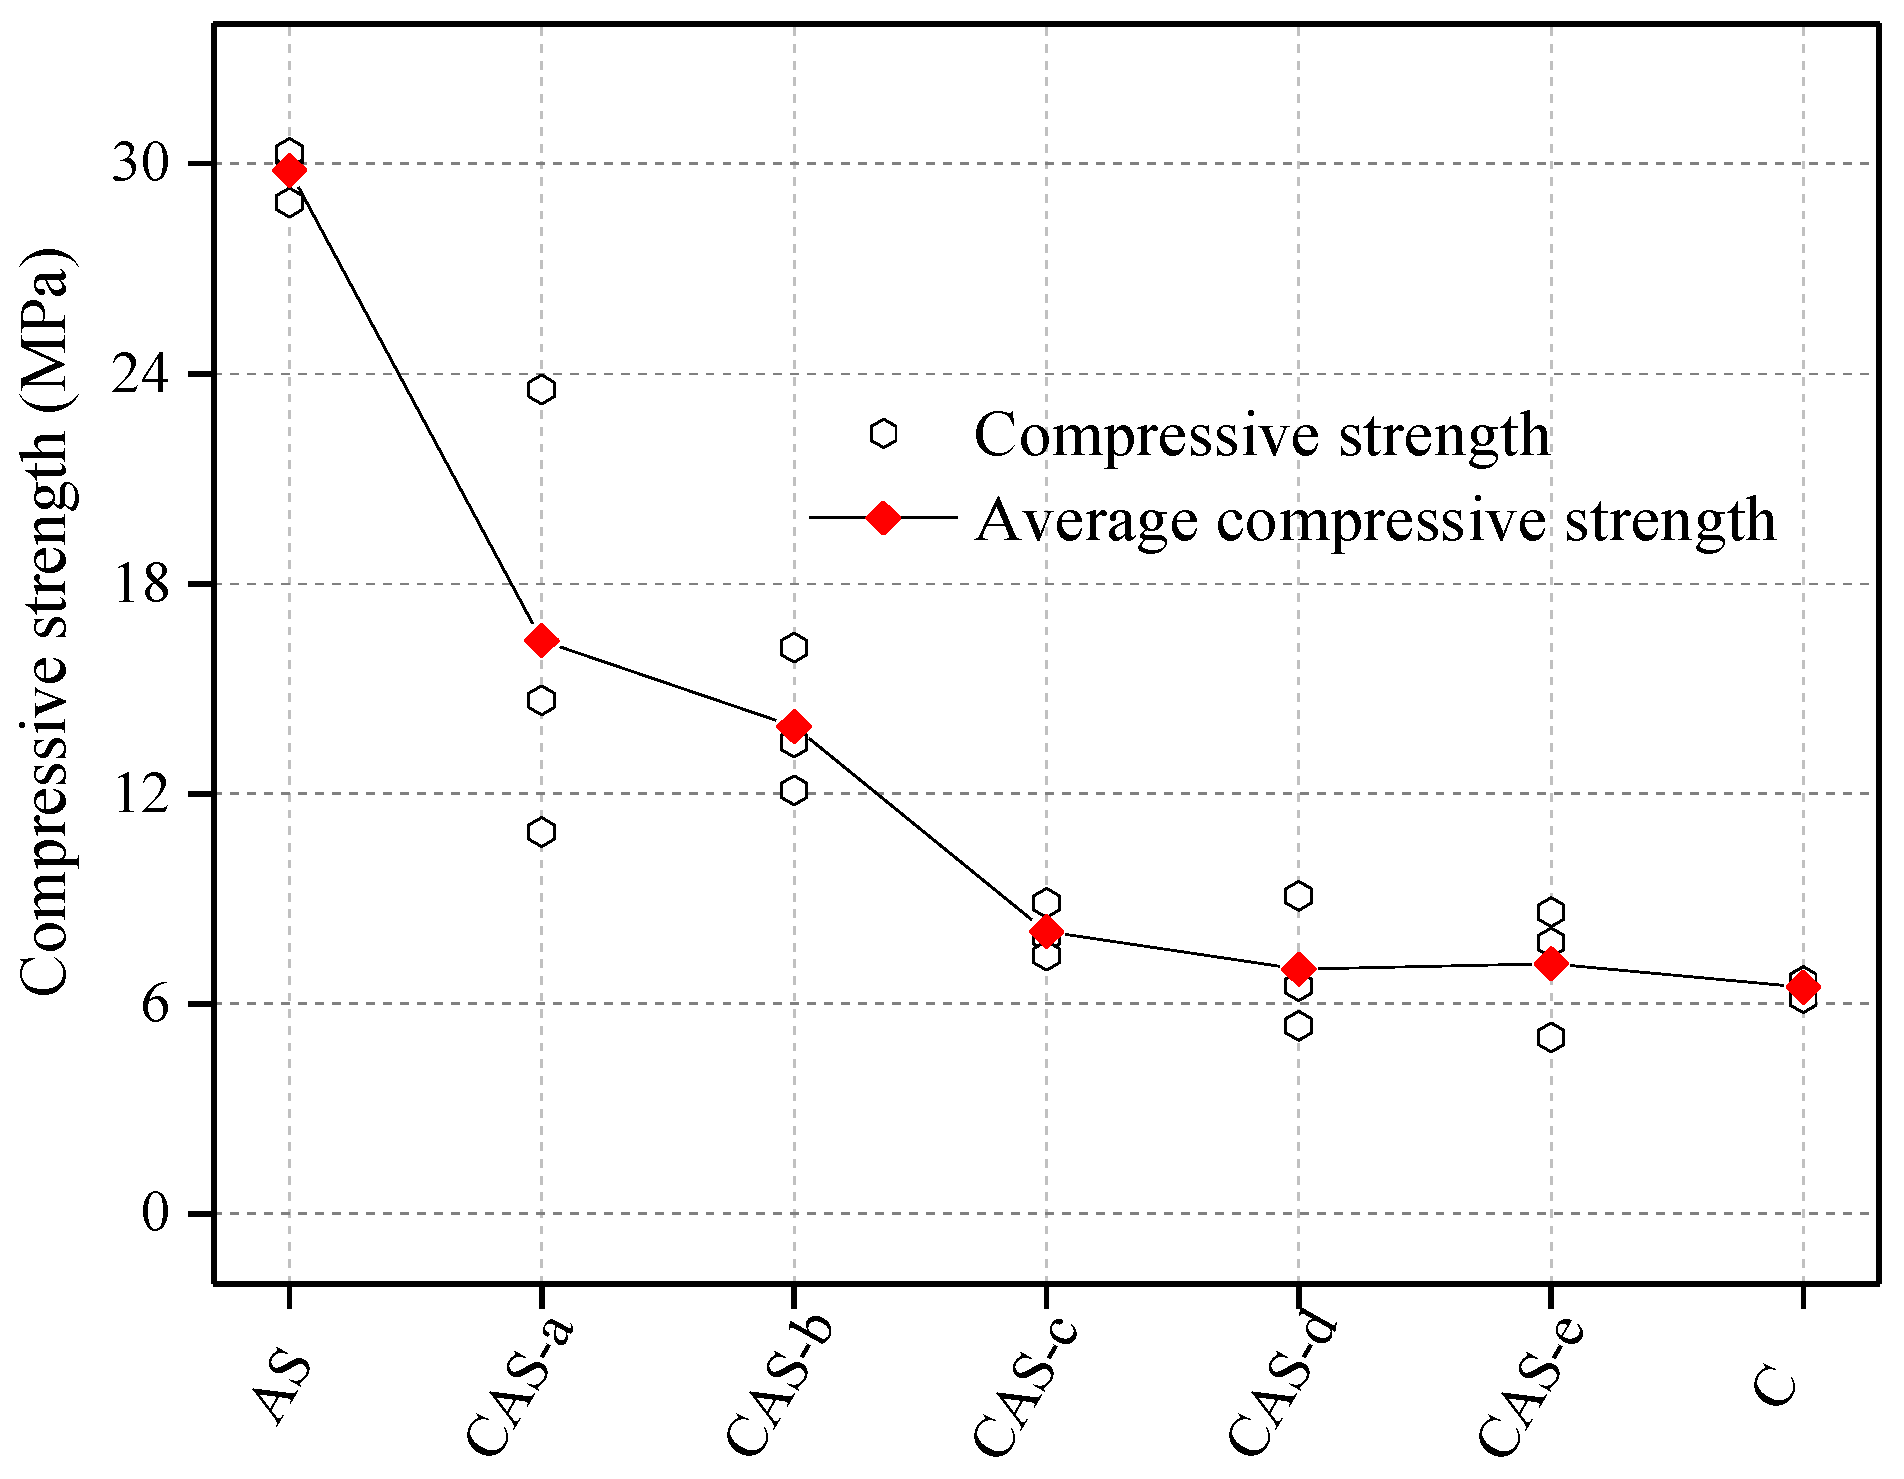
2.2. Mechanical Properties of Coal-Rock Structures

During the experiment, the coal-rock structure was set with coal end at the bottom and rock end on the top to simulate the composite roof of the roadway. When the test machine exerted force loading, the lower test bed moved upward while the upper test bed remained still. Figure 2 displays the stress-strain curves of seven coal-rock structures. As can be seen from Figure 2, the stress-strain curves of coal-rock structures with different height ratios are elastic in essence. The deformation of the samples is divided into three stages: compressive stage, elastic stage, and post-peak stage. The deformation characteristics of the coal-rock structures with different height ratios also differ from each other in the three stages. As the height of coal increases gradually, the deformation increases accordingly in the compressive stage; the gradient tends to decrease during the elastic stage, and the deformation decreases during the post-peak stage. It can be obtained from Figure 2a and Figure 3 that the change trends of stress-strain curves of three groups of sandstone samples are quite similar, and the peak loads (30.22 MPa, 30.31 MPa, 28.89 MPa, respectively) are close to each other. The average strain value corresponding to the peak load is 0.012, and the failure of the samples is mainly tensile failure. As is shown in Figure 2b and Figure 3, when the coal-rock height ratio is 1:7, the stress-strain curves of the samples are different from that of pure rock mass. The peak loads decrease sharply to 23.55 MPa, 14.67 MPa, and 10.91 MPa, respectively. In the coal-rock structures (CAS-a1–a3), failure firstly occurs in the coal mass. As the loading force increases gradually, the coal mass deforms constantly until it is crushed into pieces. The rock mass bears the loading in the process of deformation, which indicates that the CAS-a coal-rock structure displays a long-term loading characteristic. As is shown in Figure 2c and Figure 3, when the coal-rock height ratio is 1:3, the peak loads further decrease to 12.10 MPa, 13.47 MPa, and 16.18 MPa, respectively. As is shown in Figure 2d and Figure 3, when the coal-rock height ratio is 1:1, the peak loads decrease to 5.37 MPa, 9.09 MPa, and 6.51MPa, respectively; the average strain value corresponding to the peak load rises to 0.016. As for the coal-rock structure, CAS-b and CAS-c, failure mainly occurs within the coal mass, with a large number of fractures developing and distributing evenly in both the side and end faces of the coal mass. The failure, in this case, is mainly splitting failure. When the load exceeds peal load, and structural failure occurs in the sample, the fracture in the interface between coal and rock mass extends into the rock mass, which causes tensile failure. The fracture extension produces a larger amount of energy, which primarily justifies the local failure in the upper rock mass. As is shown in Figure 2e,f, when the thickness of coal mass continues to increase and the coal-rock height ratios reach 3:1 and 7:1, respectively, the average peak loads of CAS-d and CAS-e are 6.99 MPa and 7.14 MPa, with no remarkable difference observed. This is because when the height of the coal mass exceeds that of the rock mass, the load is mainly borne by the coal mass, and the failure is mainly splitting and tensile failure. The energy released by the fracture extension does not lead to the failure of the rock mass. From Figure 2g, it can be observed that the peak loads of pure coal samples are 6.63 MPa, 6.65 MPa, and 6.16 MPa, respectively, and the average strain value corresponding to the peak load is 0.018. After the peak load, many perforating fractures are generated within the coal mass, and the failure, in this case, is tensile failure. As is shown in Figure 3, the peak load of the coal-rock structure is correlated positively with the thickness of the rock mass, and negatively with the thickness of the coal mass. When the thickness of the coal mass exceeds that of the rock mass, the peak load of the coal-rock structure tends to be that of the coal mass.

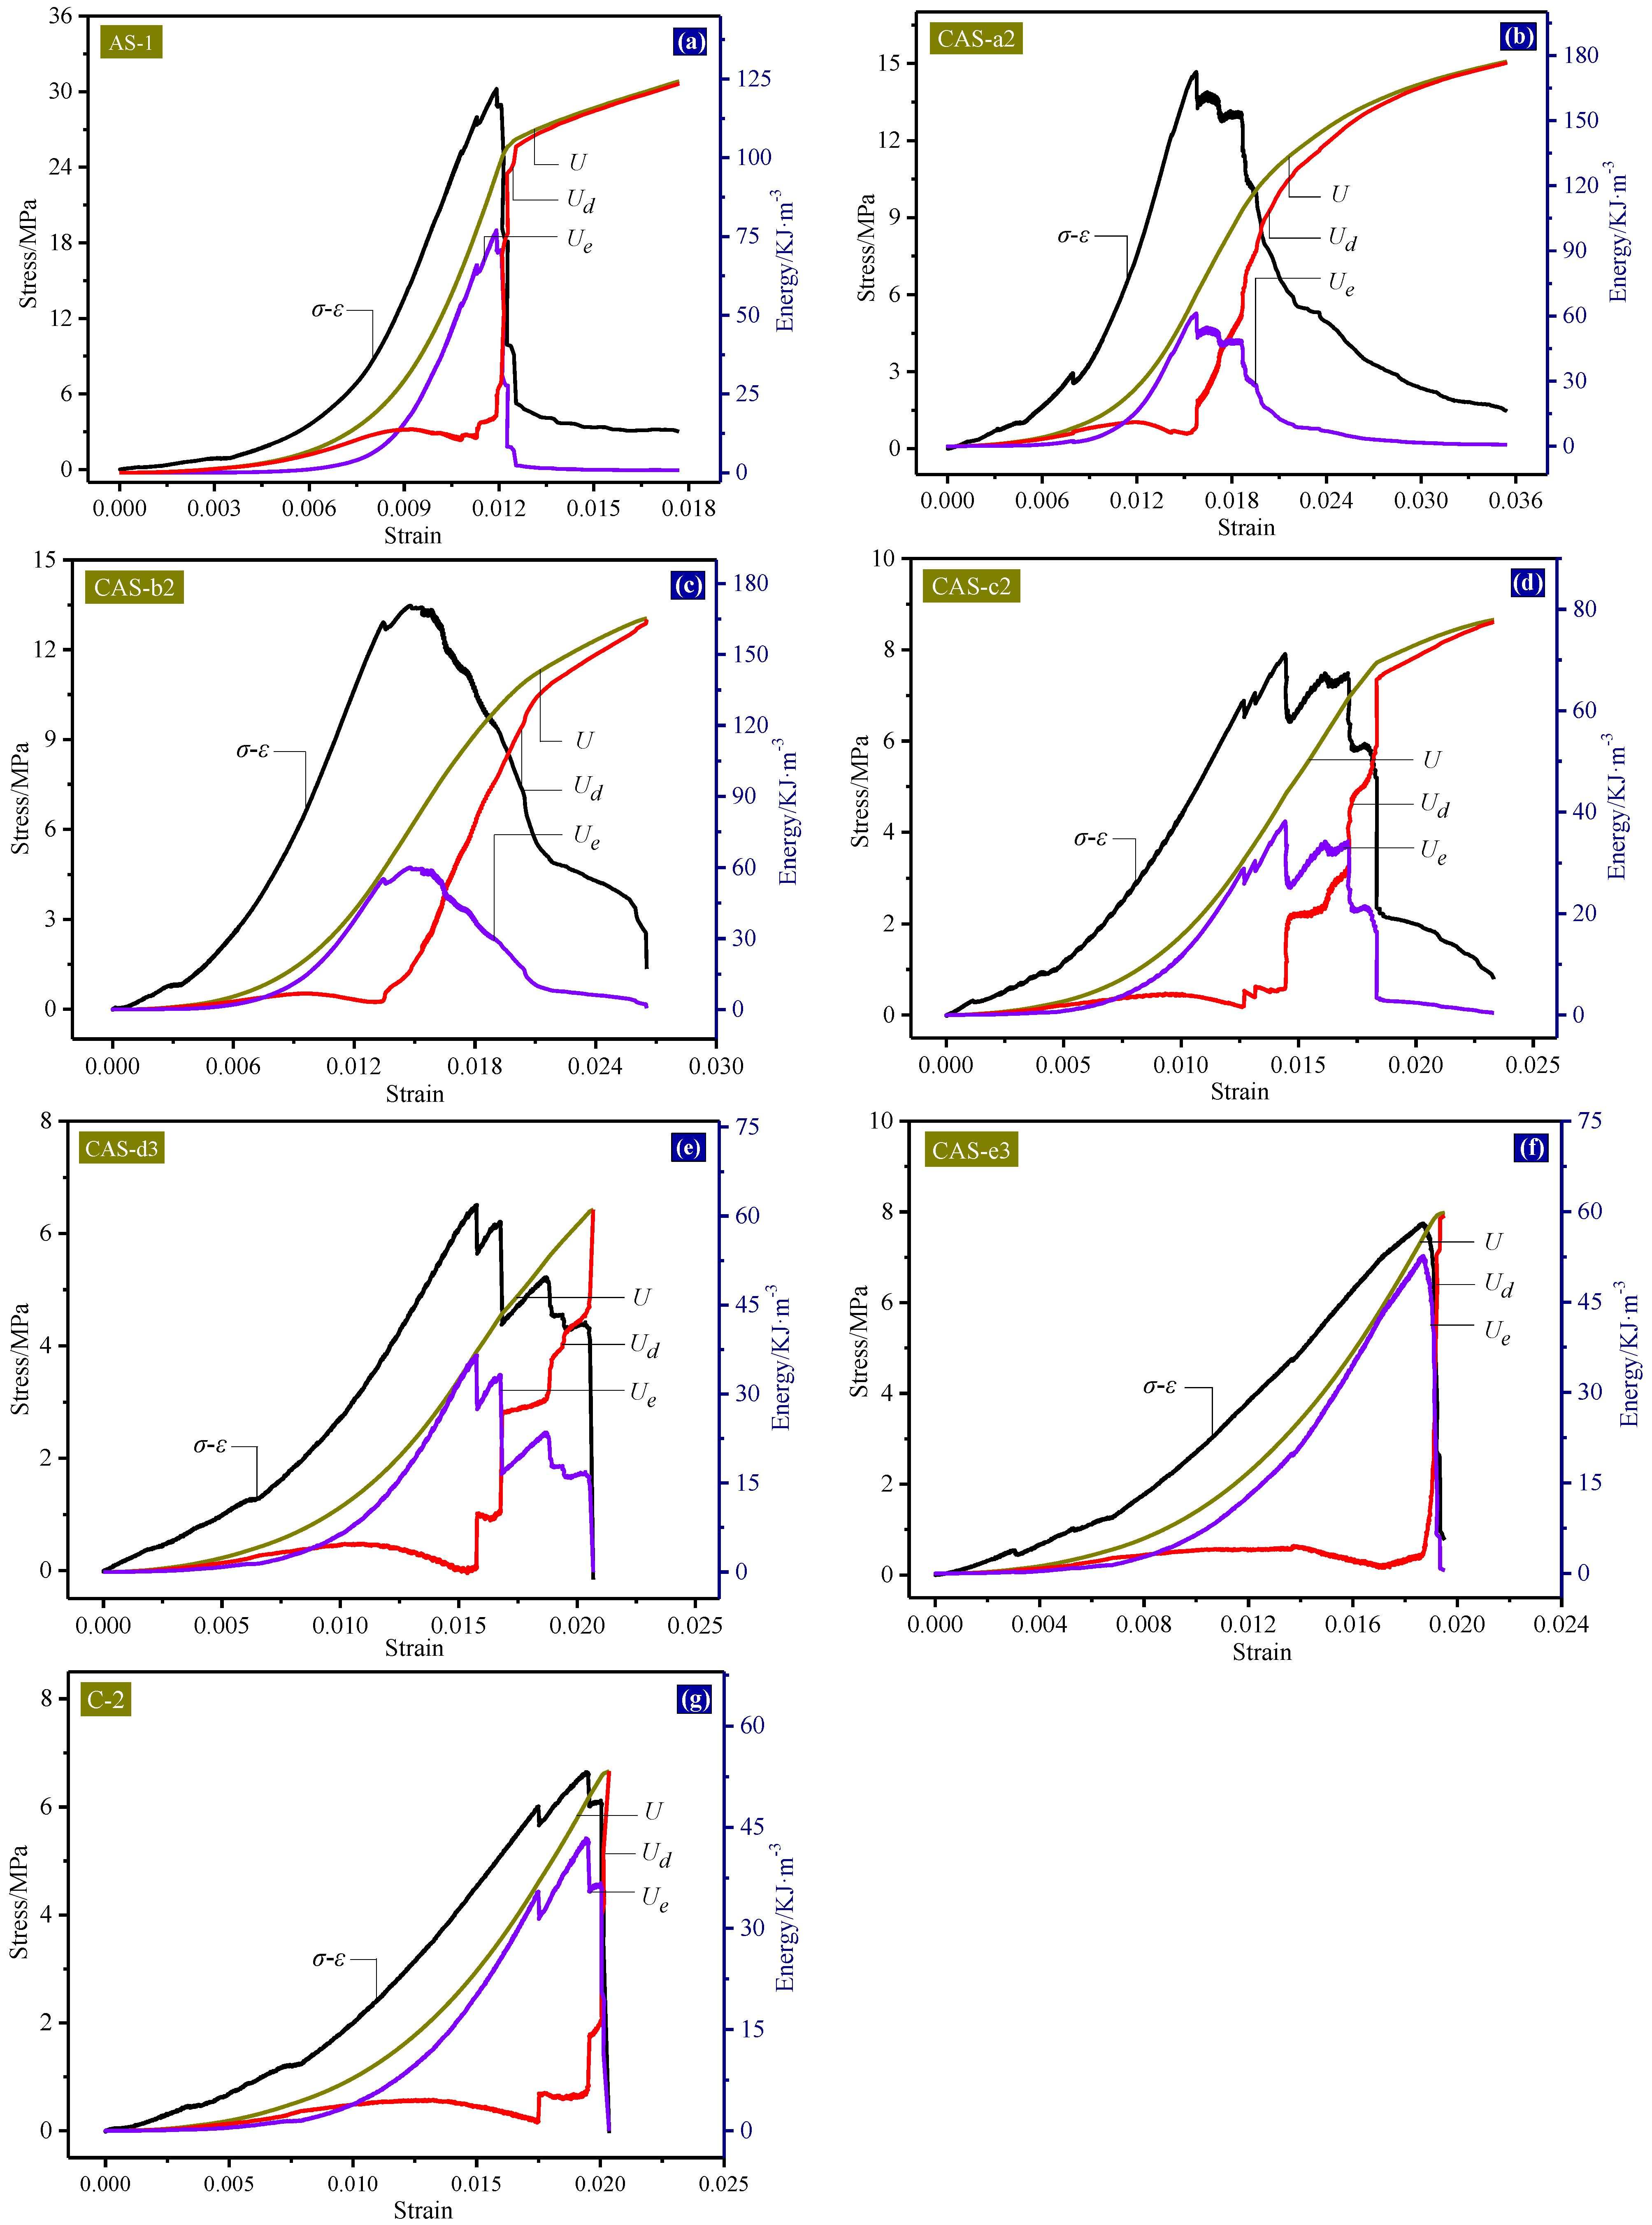
2.3. Energy Analysis and Energy Dissipation Law of Typical Samples in the Loading Process

2.3.1. Energy Analysis of Coal Samples in the Loading Process

According to the energy balance theory, energy cannot be generated or destroyed. It can only be converted from one form to another or from one object to another. The total amount of energy remains unchanged in the process of conversion or transformation [33]. Take a unit volume of coal-rock structure as an example. Suppose that the experiment is a closed system without heat exchange with the outside. Then according to the first law of thermodynamics [17,34], in the process of experiment, the input energy U generated by the work W which is done by the outside upon the coal-rock structure can be expressed as follows:
U = U d + U e
where U d denotes the dissipation energy and U e stands for the elastic strain energy.
Figure 4 shows the stress-strain curve of the rock mass unit. The shaded area U d denotes the dissipation energy, indicating the energy consumed in the process of failure and plastic deformation. The blue triangle area U e refers to the elastic strain energy released after the unloading of the rock unit, indicating the releasable strain energy accumulated in the rock unit. The dissipation energy is one-way and irreversible whereas the elastic strain energy is two-way and reversible under certain conditions.
In the uniaxial compression experiment, the coal-rock structure is compressed in the uniaxial direction. Therefore, there is only the axial stress and strain and the input energy U can be expressed as follows:
U = σ d ε = i = 1 n 1 2 ( σ i + σ i 1 ) ( ε i ε i 1 )
where σ and ε denote the axial stress and strain of the coal-rock structure respectively; σ i and ε i stand for the stress value and strain value of every point of the stress-strain curve.
The elastic strain energy U e can be expressed with the following equation:
U e = σ i 2 / 2 E
where E denotes the elasticity modulus of coal-rock structure in the pre-peak elastic stage.
Accordingly, dissipation energy U d can be expressed as follows:
U d = U U e = i = 1 n 1 2 ( σ i + σ i 1 ) ( ε i ε i 1 ) σ i 2 / 2 E

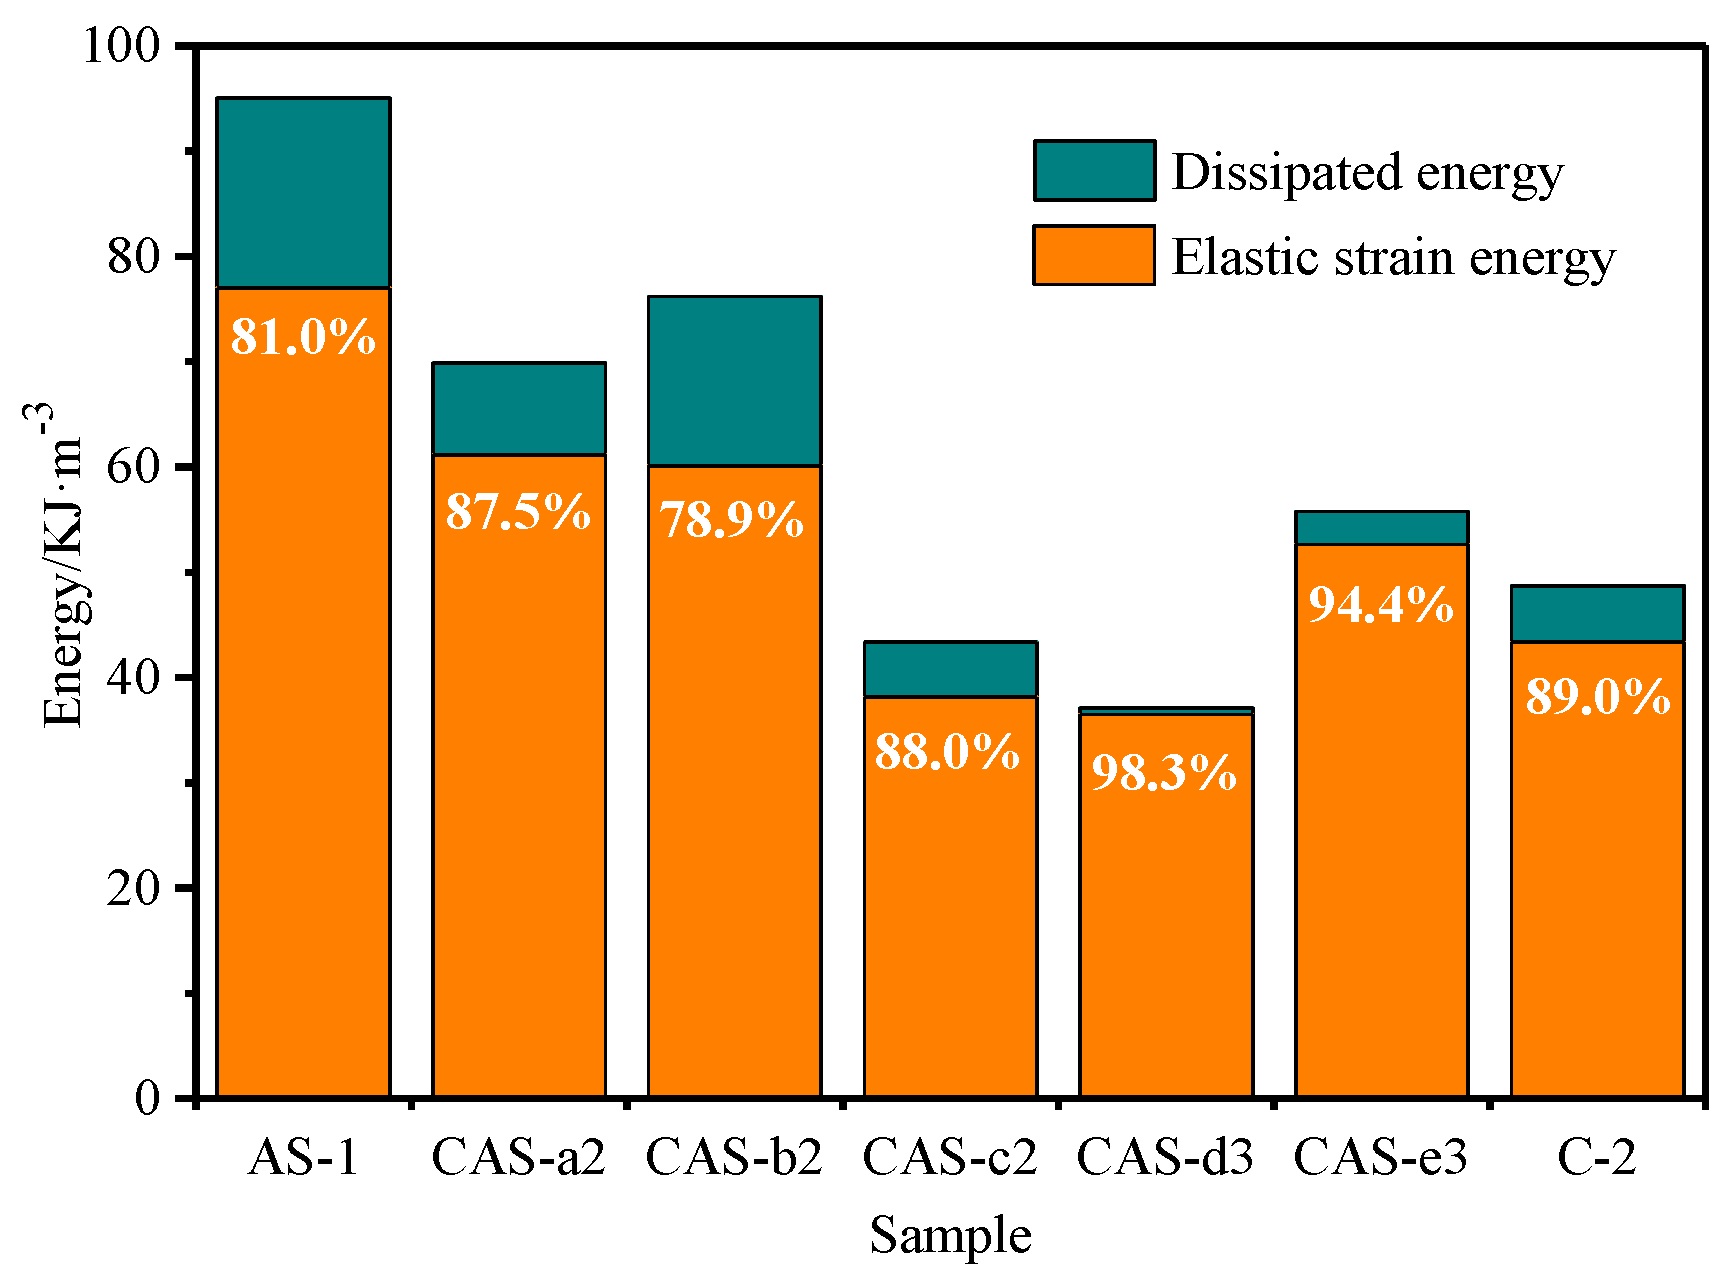
2.3.2. The Energy Dissipation Law during the Failure of Typical Samples

According to Equation (1)–(3), the input energy, dissipation energy, and the elastic strain energy could be calculated. Combined with the experimental data of typical samples, the energy evolution curve of the coal-rock structure can be drawn, as is shown in Figure 5. From Figure 5 it can be observed that the energy evolution curves of different coal-rock structures display certain similarity. The energy evolution can be divided into two stages according to the peak stress: pre-peak stage and post-peak stage.
During the pre-peak stage, the input energy assimilated by the coal-rock structure mostly converts into elastic strain energy, accounting for 81–98.3% of the total energy amount. By contrast, the dissipation energy in the coal-rock structure only takes up a small percentage, mainly consumed in the occlusion of micro defects inside the coal and the rock mass and the development of new fractures. As the height of the coal mass increases gradually, the input energy tends to drop while the elastic strain energy displays a rising trend in its proportion of the total amount of energy. As is shown in Figure 6, the input energy of the AS-1 sample is 95.05 KJ/m3, 81.0% of which is elastic strain energy; the input of CAS-c2 sample is 43.35 KJ/m3, 88.0% of which goes to elastic strain energy; the input of the C-2 sample is 48.72 KJ/m3, 89.0% of which is elastic strain energy. The compressive strength of the coal body is inferior to that of the argillaceous sandstone. Correspondingly, the strain of the coal mass is smaller than that of the argillaceous sandstone, which in turn leads to the inferiority of the coal mass to argillaceous sandstone in terms of assimilating the input energy. The input energy of the coal-rock samples is mainly distributed between that of coal and argillaceous sandstone. However, the severe development of fractures in some samples also contributes to the deviation in the experimental results.
During the post-peak stage, the input energy experiences a sudden change; the elastic strain energy decreases sharply, and the dissipation energy takes the leading role. When the sample of the coal-rock structure reaches peak strength, the elastic strain energy accumulated in the sample is released quickly and then converted into dissipation energy, which is consumed by the fracture extension and shear failure. Accordingly, the elastic strain energy is reduced to zero at this stage and all input energy converts into dissipation energy.
The energy release of coal-rock structure is featured by instantaneity. The energy is accumulated during the elastic stage and suddenly released in the post-peak stage. Once released, the energy is converted into mechanical energy or other forms of energy.

3. Support Design Principle

Before the roadway excavation, the coal and rock mass is in an energy-balance state under the three-dimensional stress. The elastic strain energy is accumulated in the coal and rock mass. The road excavation breaks the original energy balance and leads to the redistribution of stress. Stress concentrates and energy accumulates in the surrounding rock. For a period of time after the roadway excavation, certain deformation and microfractures occur in the shallow surrounding rock. The energy released at this stage is mainly elastic energy which can be recovered. In the case of untimely surrounding rock control or insufficient support strength, plastic deformation and bulking failure would further occur in the surrounding rock; the energy at this stage is mainly expended in the opening and extension of the microfractures, accompanied by the release of kinetic energy and thermal energy. This part of the energy is irreversible and irrecoverable.
When the occurrence structure and mechanical properties of the roof are different from those of the surrounding rock, the form of energy conversion and transfer changes accordingly. The results of the lab experiments indicate that due to the difference of mechanical properties between coal mass and rock mass, the energy accumulation and energy release varies from sample to sample. Before the sample reaches peak load, the elastic strain energy takes the leading role, whereas the dissipation energy is quite low. As the height of the coal in the sample increases gradually, though the amount of input energy drops slightly, the elastic strain energy still maintains its dominant role. Therefore, when the proportion of dissipation energy is low, the sample would remain intact.
Suppose that the elastic deformation energy accumulated in the in-situ stress field is denoted by E 0 , the elastic energy released by the surrounding rock after roadway excavation is denoted by E e , the dissipation energy released by the surrounding rock after roadway excavation is denoted by E d , the remained elastic deformation energy in the surrounding rock is denoted by E r , and the work done by the support upon the surrounding rock is denoted by W s , then the energy relation after the roadway excavation can be expressed as follows: E r = E 0 E e E d . According to the law of energy balance, the ideal roadway support means that the work done by the support W s happens to be the sum of the elastic energy E e and the dissipation energy E d . In this case, the surrounding rock restores the initial stress balance. However, in practice, two factors make it hard to achieve the ideal support state. One, the unloading occurs instantaneously with the roadway excavation, but the support must lag behind the excavation, which means minor deformation and microdamage must have occurred in the surrounding rock when the support was carried out. Two, the pre-tightening force exerted by the current bolt support is comparatively smaller, which means that the work done by the support is smaller than the energy needed by the surrounding rock. In other words, further deformation and damage are to occur in the surrounding rock to adjust to the current bolt support system by releasing more elastic energy. Based on the above analysis and field experience, the roadway support design should give priority to the following principles: (1) To speed up support construction—the faster the bolt support is constructed, the less the deformation and damage would be, and the less the elastic energy and dissipation energy released by the surrounding rock would be. In this case, it is easier to control the surrounding rock in that the work needed to be done by the bolt is smaller. (2) To improve the strength of bolt support—to improve the support strength, full consideration should be given to the bolt strength and the pre-tightening force exerted upon the bolt. Bolt strength is the foundation of the high pre-tightening force. Theoretically, as long as the pre-tightening force is smaller than the breaking load of the bolts, the bolt support system will function normally to guarantee roadway safety. Therefore, the pre-tightening force should be as high as possible as long as it does not exceed the yield force of the bolts. When the bolt is highly pre-tightened, it is more sensitive to rock deformation. Even the slight deformation can be dealt with quickly and timely. Therefore, the strong support can quickly accumulate the elastic energy released by the surrounding rock and refill the microfractures in the shallow surrounding rock, thus maintaining its integrity and restoring the initial energy balance.

4. Case Study

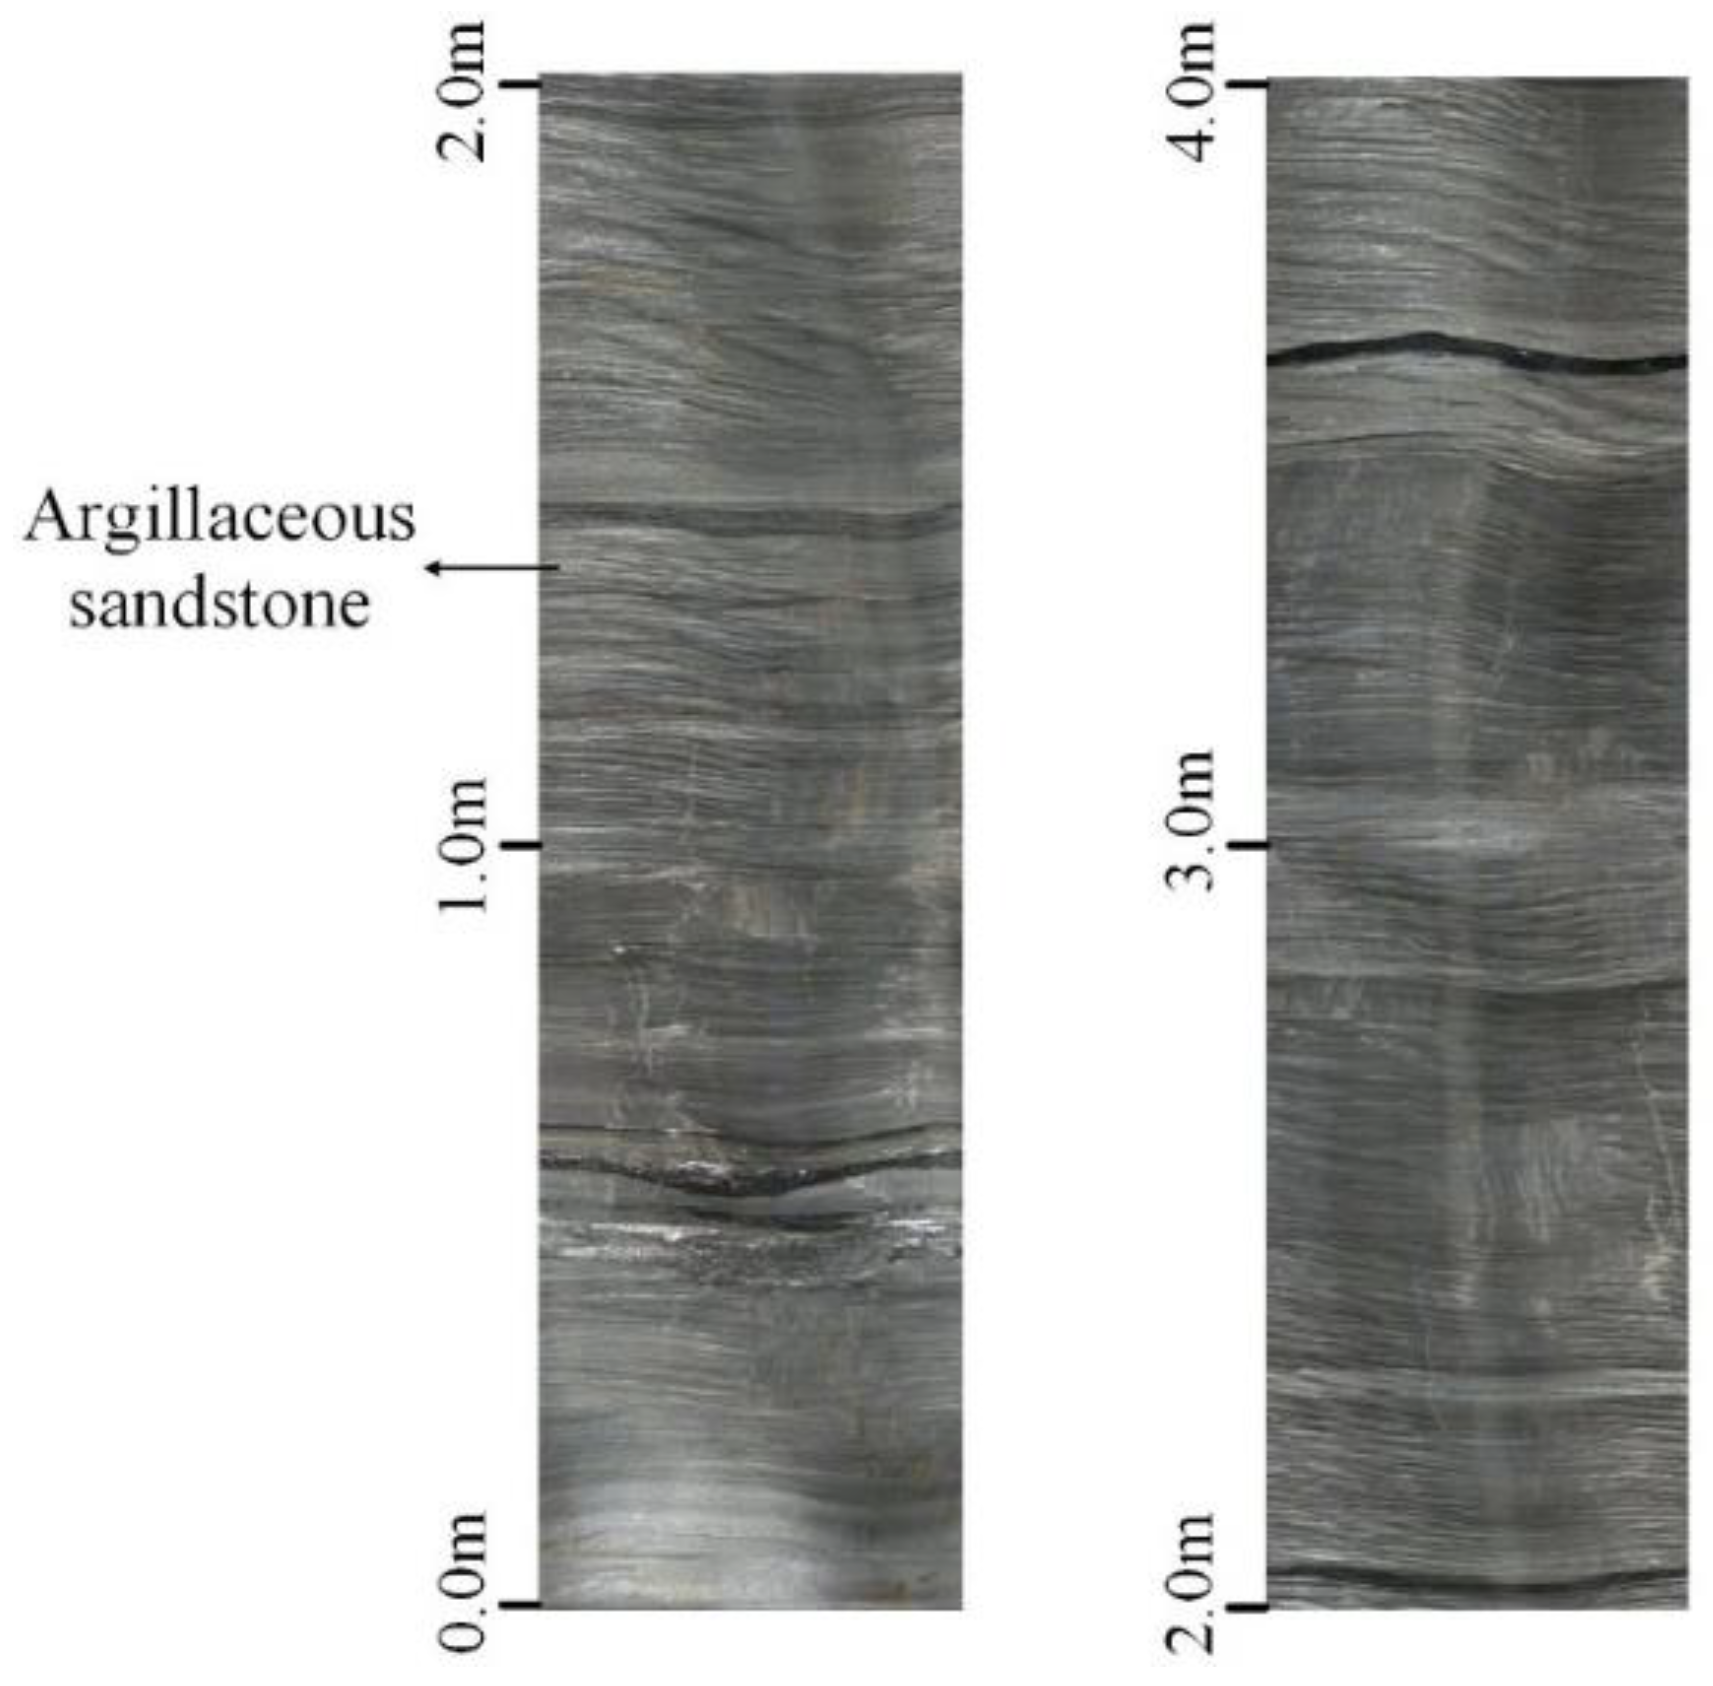
4.1. Geological and Engineering Conditions

The experimental site is located in the two mines of Zhongtian hechuang Energy Co., Ltd., China Coal Group. With an annual production capacity of 25.0 Mt/a, the two mines, Hulusu Coal Mine and Menkeqing Coal Mine, are located in the Ordos, Inner Mongolia Autonomous Region of China. Hulusu Coal Mine has an annual production capacity of 13.0 Mt/a. Its minefield covers an area of 98.08 km2, extending 7.4 km from north to south and 13.4 km from east to west. The main seam being mined is 2–1 coal, the thickness of which ranges from 1.06 m to 5.61 m, with an average of 2.8 m. The seam inclination is nearly flat, averagely smaller than 5°. The burial depth varies from 623 m to 636 m, with an average of 630 m. The mining method employed is long-wall mining. Menkeqing mine has a designed annual production of 12.0 Mt/a. Its minefield covers an area of 94.95 km2, extending 12.3 km from north to south and 7.6 km from east to west. The main seam being mined is 3–1 coal, the thickness of which ranges from 4.25 m to 5.4 m, with an average of 4.8 m. The seam inclination is between 1–4°, averagely about 2°. The burial depth varies from 721 m to 725.8 m, with an average of 724 m.
There are two experimental roadways in Hulusu Coal Mine, ventilation roadway 21204 (hereinafter abbreviated as VR 21204) and haulage roadway 21205 (hereinafter abbreviated as HR 21205). Located in the adjacent working faces and being only 680 m apart, the two roadways share the same lithology in their roof and floor, differing only in the thickness. Above the coal seam (2–1 coal) lie argillaceous sandstone, fine-grained sandstone, medium-grained sandstone, and so on. There is only one experimental roadway in the Menkeqing Coal Mine, namely haulage roadway 3108 (hereinafter abbreviated as HR 3108). Above the coal seam (3–1 coal) lie siltstone, mid-fine grained sandstone, sandy mudstone, and so on. The length of the three experimental roadways is more than 3000 m. The lithology of the roadway roof and floor, as well as the thickness of rock strata, are shown in Table 2.
The size of the VR 21204 is 5.4 m × 3.2 m. As can be seen from Table 2, the thickness of coal seam is 3.2 m and the immediate roof is a 3.7 m thick layer of argillaceous sandstone. The size of HR 21205 is 5.4 m × 3.2 m. Since the coal seam in this area is thicker, the immediate roof is composed of a 0.5 m-thick layer of coal and a 3.5 m thick layer of argillaceous sandstone. The size of HR 3108 is 5.4 m × 3.6 m. Since the 3–1 coal is comparatively thick, with an average thickness of 4.8 m, the immediate roof is composed of a thick coal seam and a 2.3 m thick layer of siltstone. Accordingly, the three deep roadways represent three types of roof structure, namely, rock roof, thin coal roof, and thick coal roof, as is shown in Figure 7.

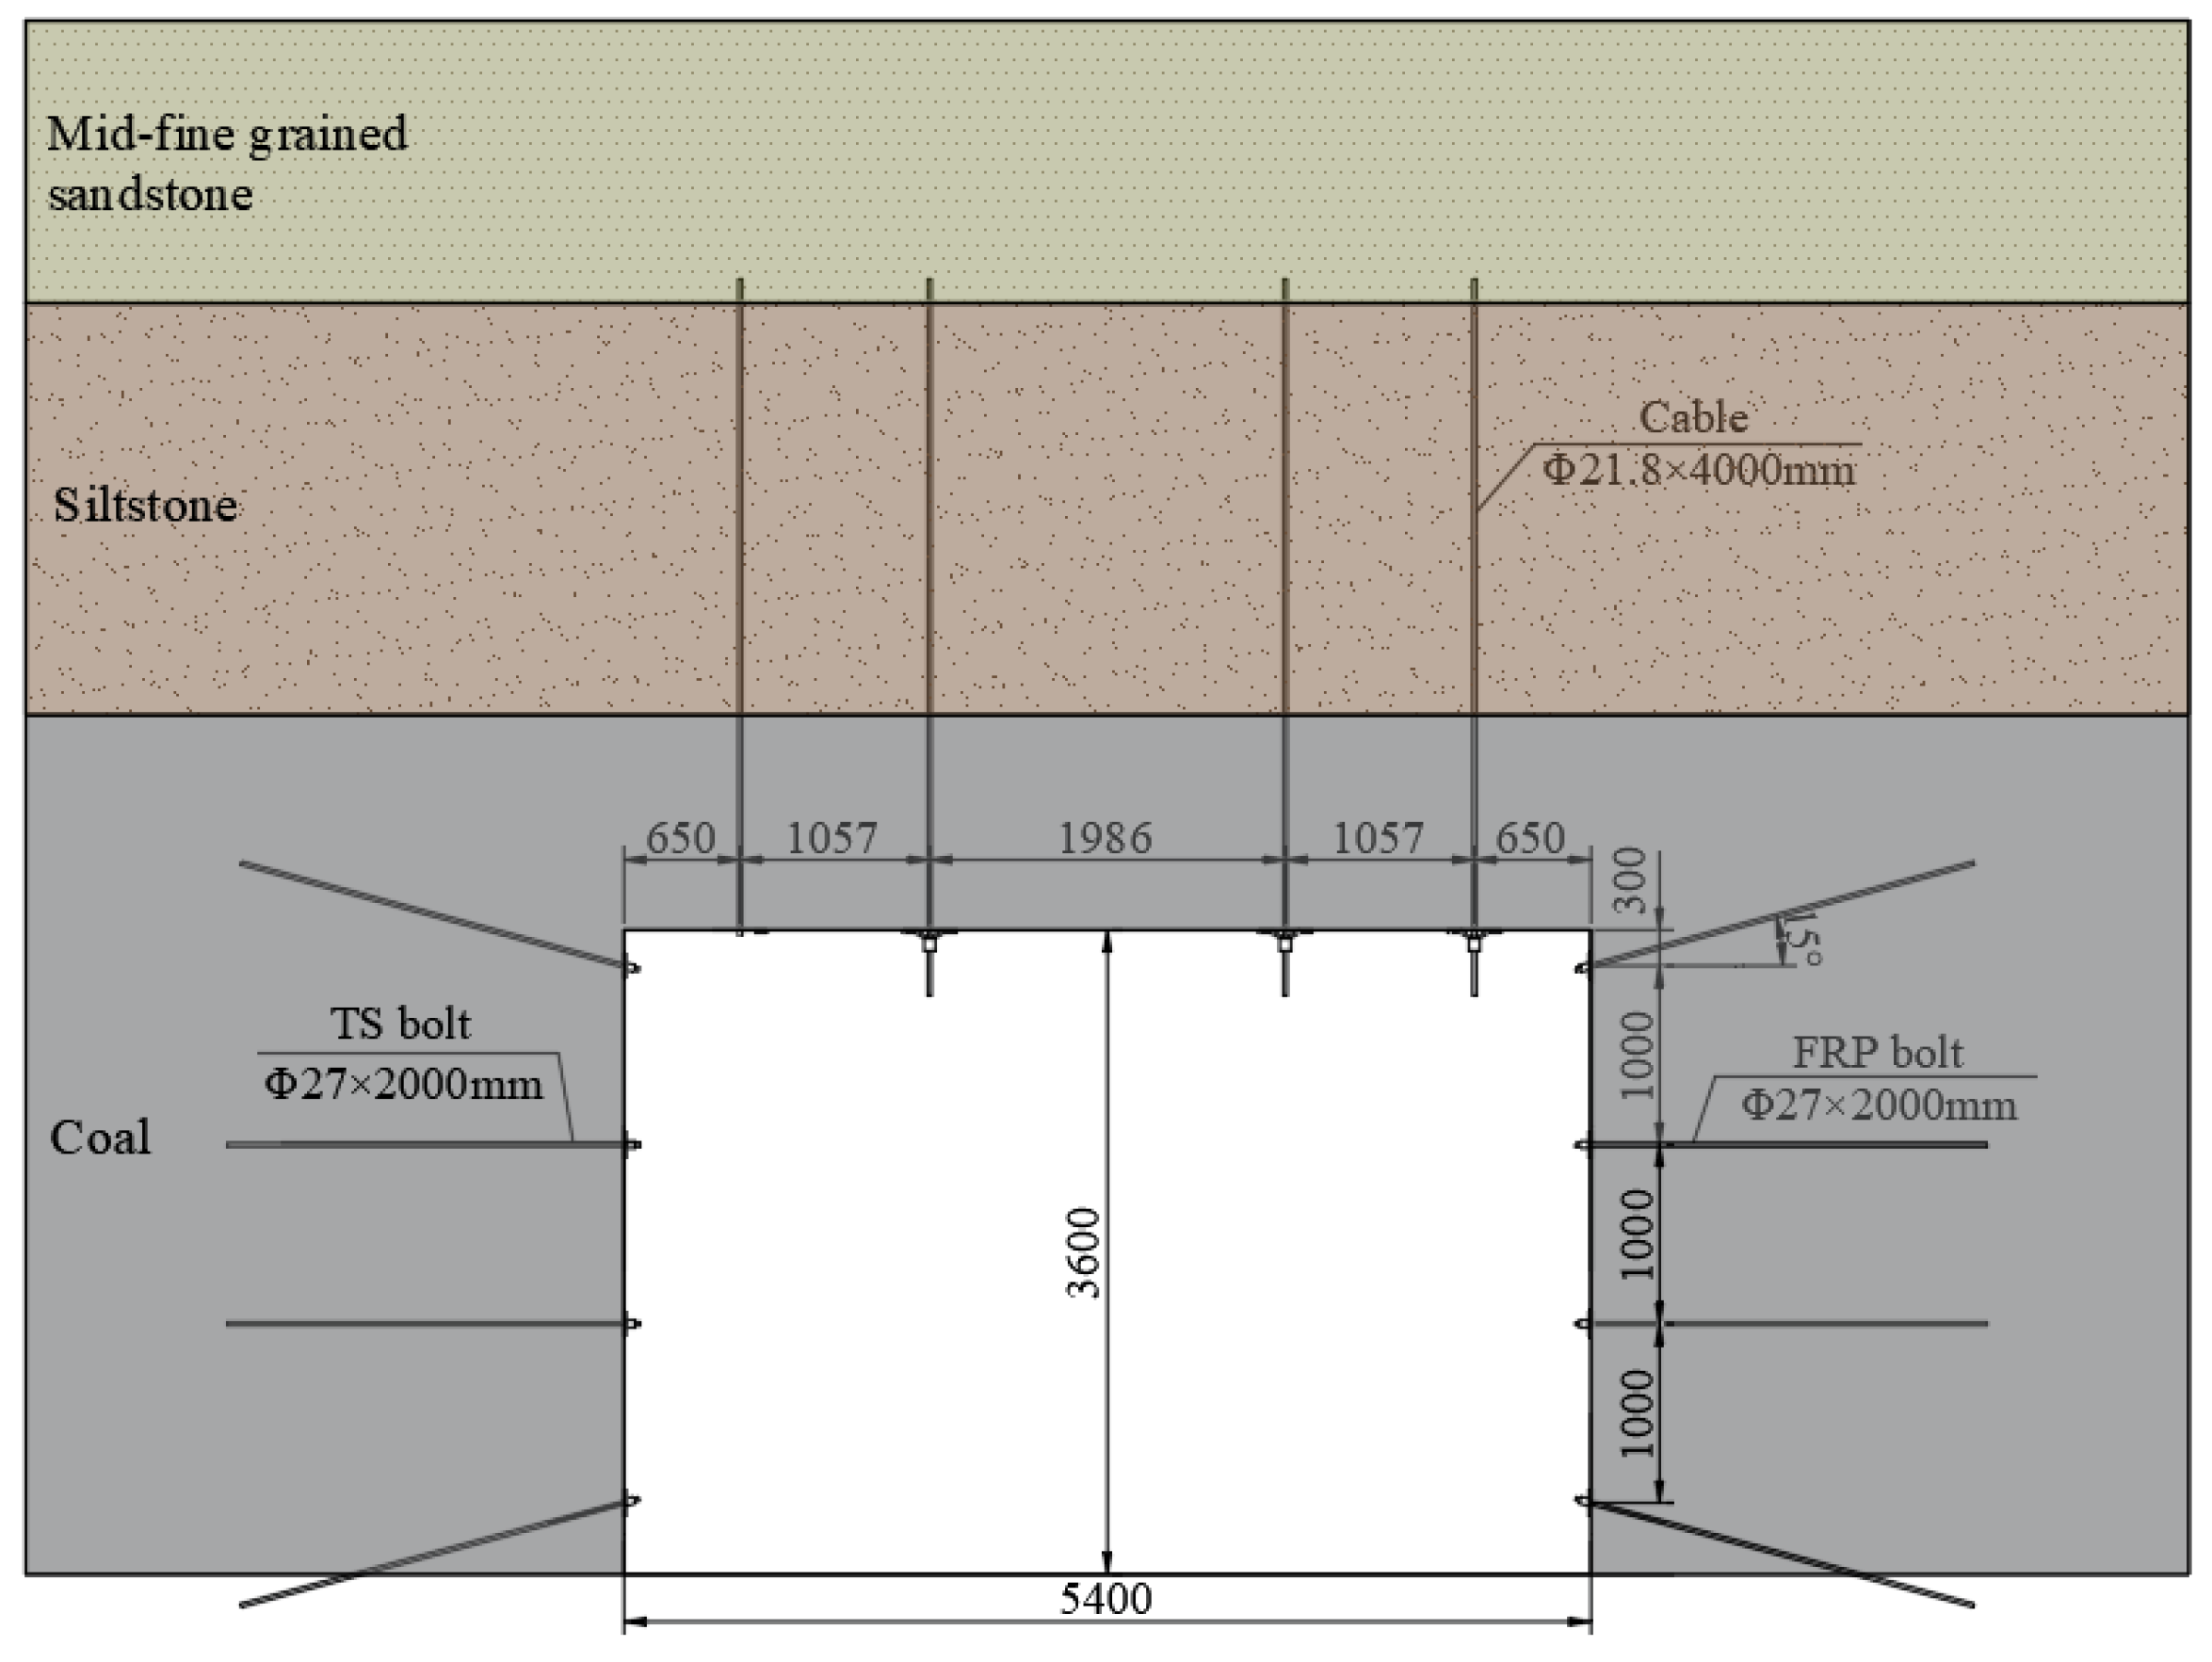
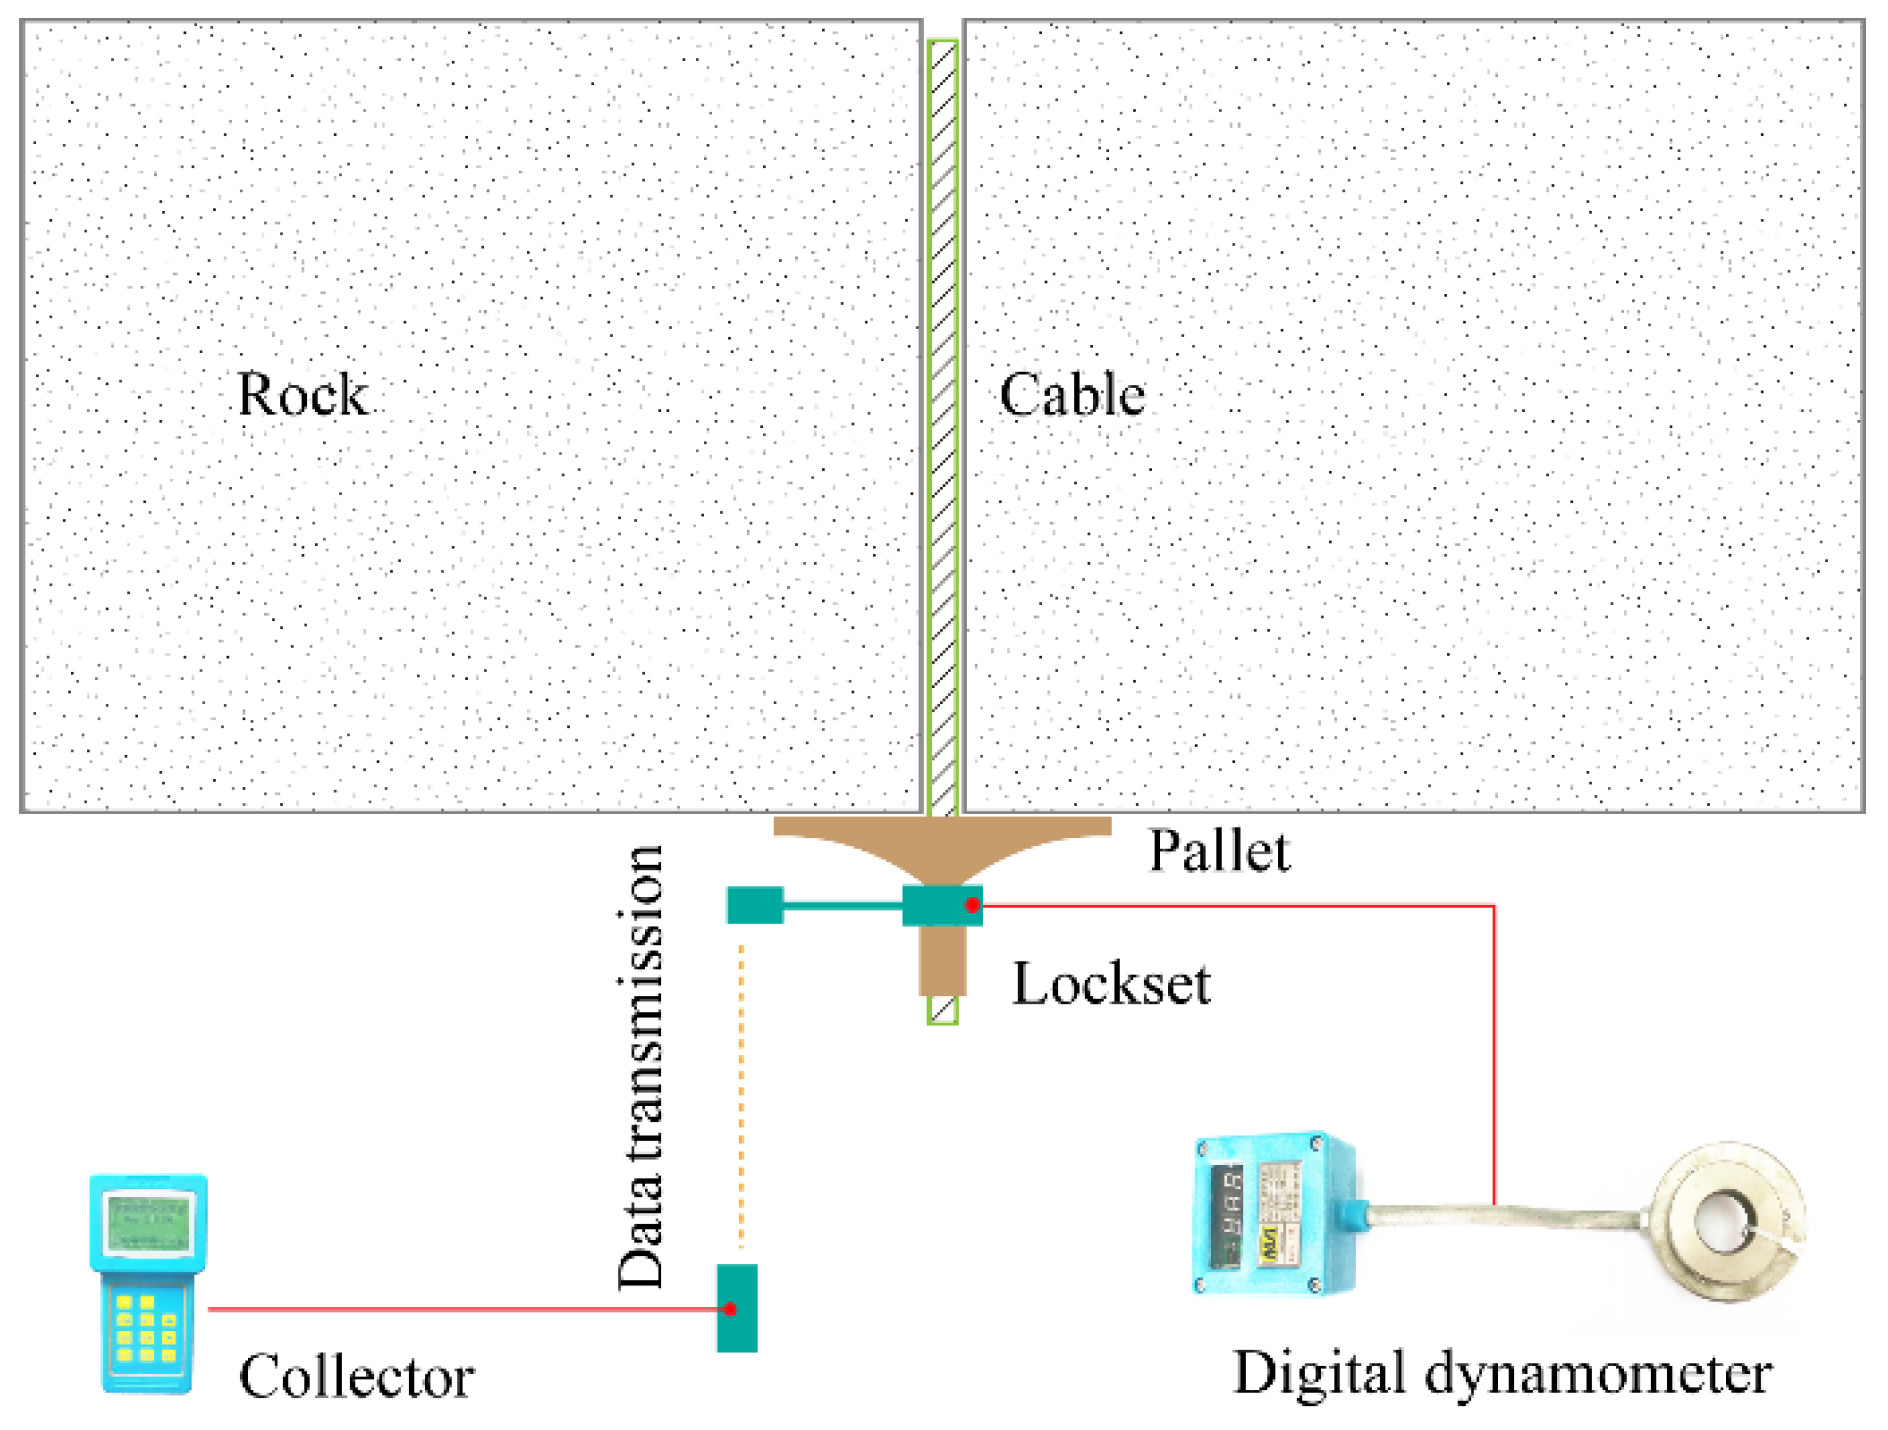
4.2. Support Method and Monitoring Method

To explore the energy evolution law of different types of roof structure after the roadway excavation, the single variable controlling method was employed. To be specific, the roofs of the three roadways were all supported by the same support method—cable-bolt support. Through monitoring of the anchoring force of the anchor cable and bolt, the stress upon the surrounding rock and roof can be measured, thus deducing the energy evolution law of the roof indirectly. The actual roof support design was as follows: four short anchor cables (every row) were anchored vertically to the roof, the row space is 1500 mm. The diameter and length of the anchor cable are 21.8 mm and 4000 mm, respectively. Each anchor cable was assorted with one CK 2370 resin cartridge, one Z 2370 resin cartridge, one arched steel pallet (300 mm × 300 mm × 16 mm), and one KM 22 lockset. Steel mesh (5400 × 1600 mm) was used to reinforce the roof. According to the support design principle, the initial pre-tightening force of anchor cable was set at 180 kN, one-third of the yield force. This support design aimed to restore the initial stress state of the surrounding rock by providing strong roof support.
Due to the different roadway heights, the side support in the three roadways was different from one another. For VR 21204 and HR 21205, three threaded steel (TS) bolts whose diameter and length was 20 mm and 2200 mm, respectively were anchored in a row to the coal pillar side, and the row space was 1500 mm; three fiberglass reinforced plastic (FRP) bolts whose diameter and length was 27 mm and 2000 mm, respectively were anchored in a row to the stope side, and the row space was 1500 mm. For HR 3108, four bolts were anchored in a row to both sides, the bolt type, diameter, and row space being the same; but the length of both the TS bolts and FRP bolts was extended to 2300 mm. Figure 8 shows the support form and bolt parameters of HR 3108 as an example.
A digital dynamometer was used to monitor the change of the anchoring force of the anchor cables, whose working principle is shown in Figure 9. As can be seen from the figure below, the digital dynamometer was installed between the steel pallet and lockset. When the pre-tightening force was exerted on the anchor cable, the force sensor could detect the stress and then transmit it to the strain body, which in turn deformed accordingly. The strainmeter converted the deformation to the voltage signals. Then the transmitter changed the signals to pressure values which were displayed in digital form on the display screen. The sensor stored data every two hours and the data collector would collect the data on the anchoring force of the anchor cables. To ensure data accuracy and reliability, the dynamometer should be installed in a flat area without any crushing. Meanwhile, the dynamometer should be installed on the middle anchor cable in that the surrounding rock in this area deformed more severely. Accordingly, the anchor cable load monitored by the dynamometer would be more statistically remarkable, thus reducing the error rate. The lithology within the range of anchor cables was monitored using a ZKXG30 borehole scanner.

4.3. Variation Law of the Anchorage Force

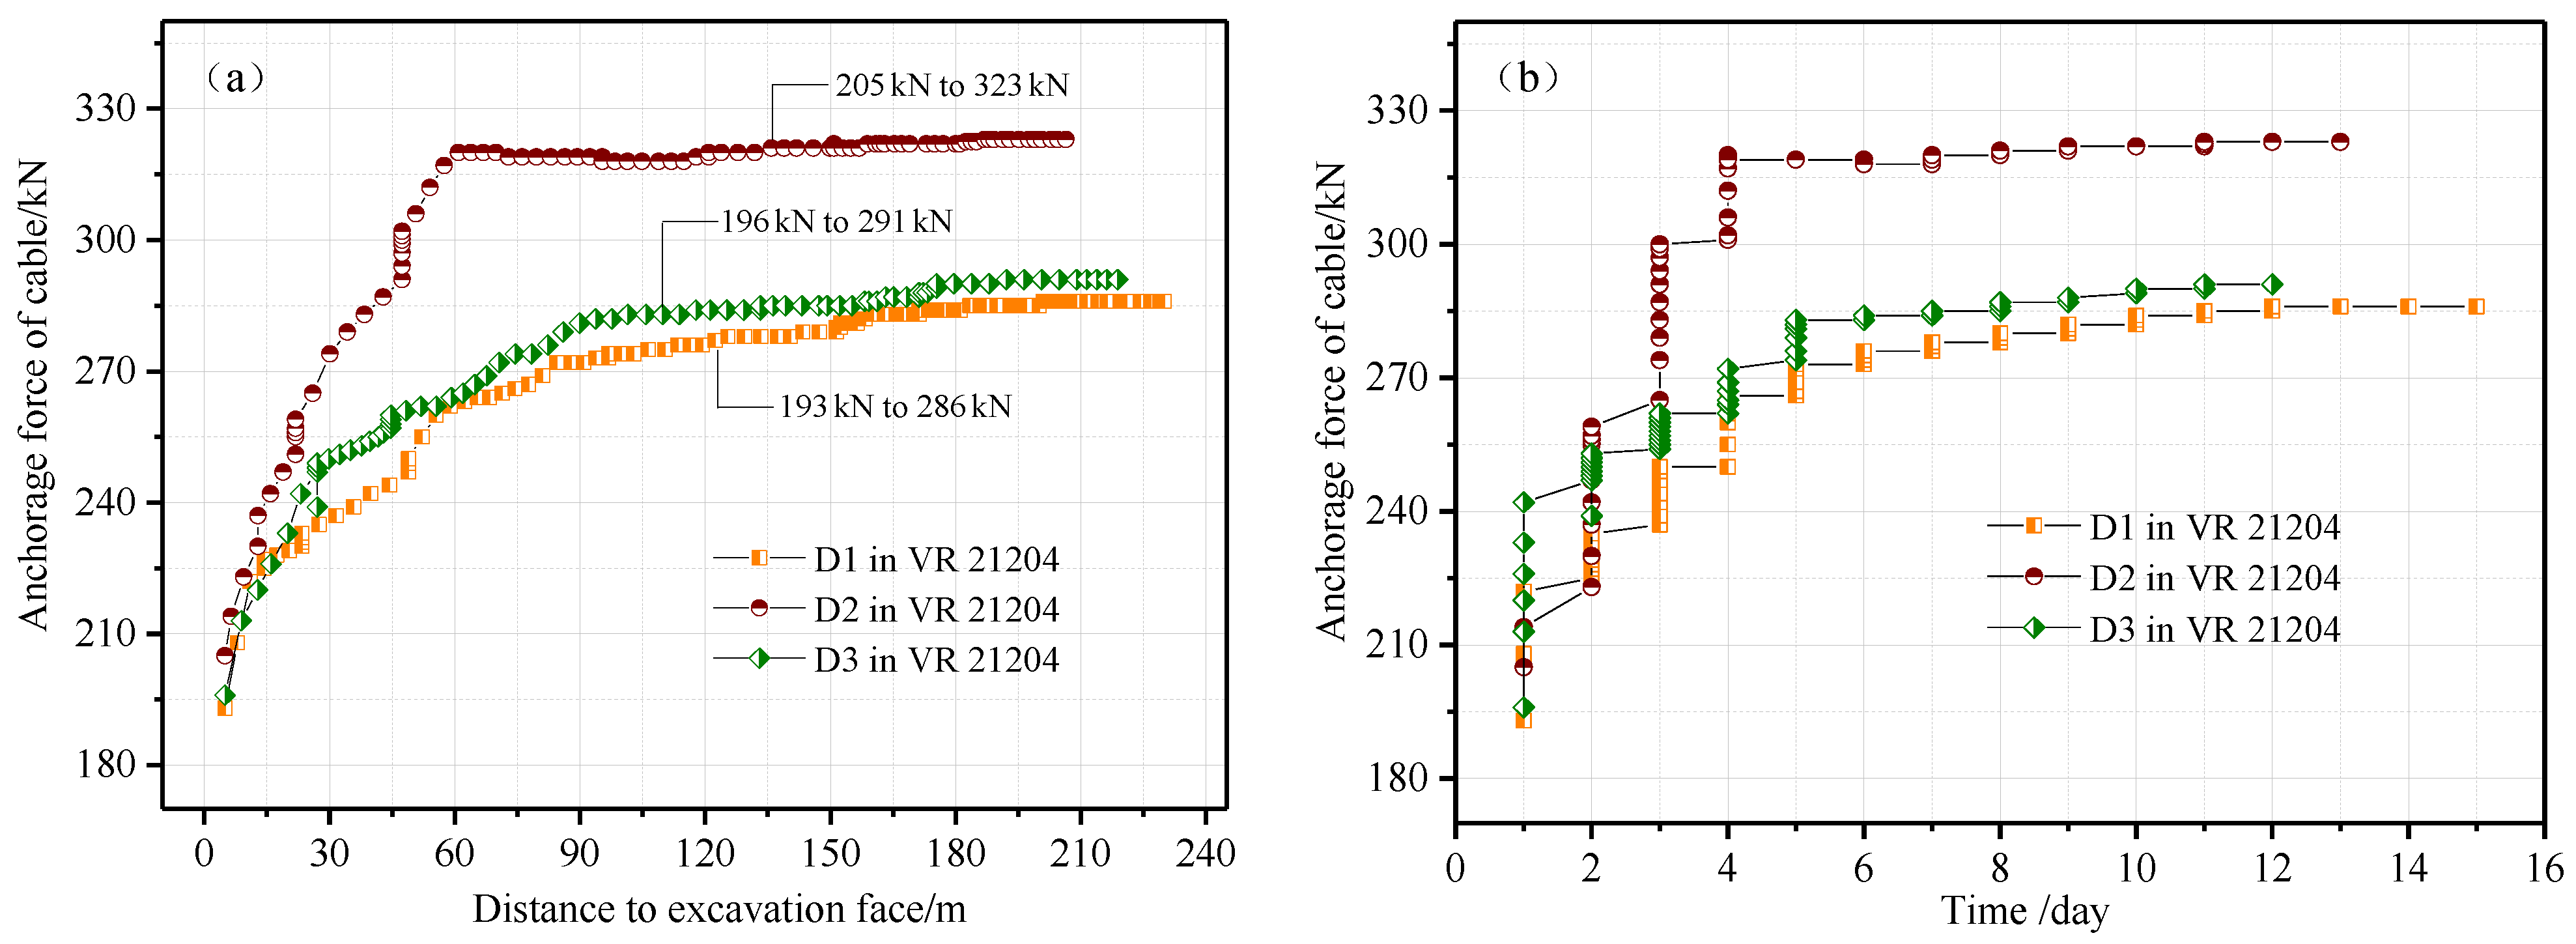
4.3.1. Monitoring Results and Analysis of the Anchorage Force of the Cable in VR 21204

The three groups of dynamometers in VR 21204 were denoted as D1, D2, and D3, respectively. The three groups of dynamometers were all installed on pure rock roof. The lithology within the range of the anchor cables was shown in Figure 10. The monitoring results were shown in Figure 11. As can be seen, the curve of the anchoring force and distance to excavation face displays a similar changing trend with that of the anchoring force and time. To be specific, the curves can be divided into three stages: sharp rise stage, slow-growth stage, and long-term stability stage. From Figure 11a,b, it can be seen that within the range of 60 m to the excavation face and within first four days after excavation, the roof surrounding rock deforms drastically and the anchoring force increases sharply; with the range of 60–100m to the excavation face and within the 4th–6th days after excavation, the roof surrounding rock deforms slightly and the anchoring force increases slowly; within the range of over 100 m to the excavation face and after the 6th day, the roof surrounding rock is in a stable state and the anchoring force remains unchanged. The anchoring force measured by the D1 dynamometer rises from 193 kN to 286 kN, increasing by 48.2%; the anchoring force measured by the D2 dynamometer rises from 205 kN to 323 kN, increasing by 57.6%; the anchoring force measured by the D3 dynamometer rises from 196 kN to 291 kN, increasing by 48.5%. The average growth rate of the three groups is 51.4%.

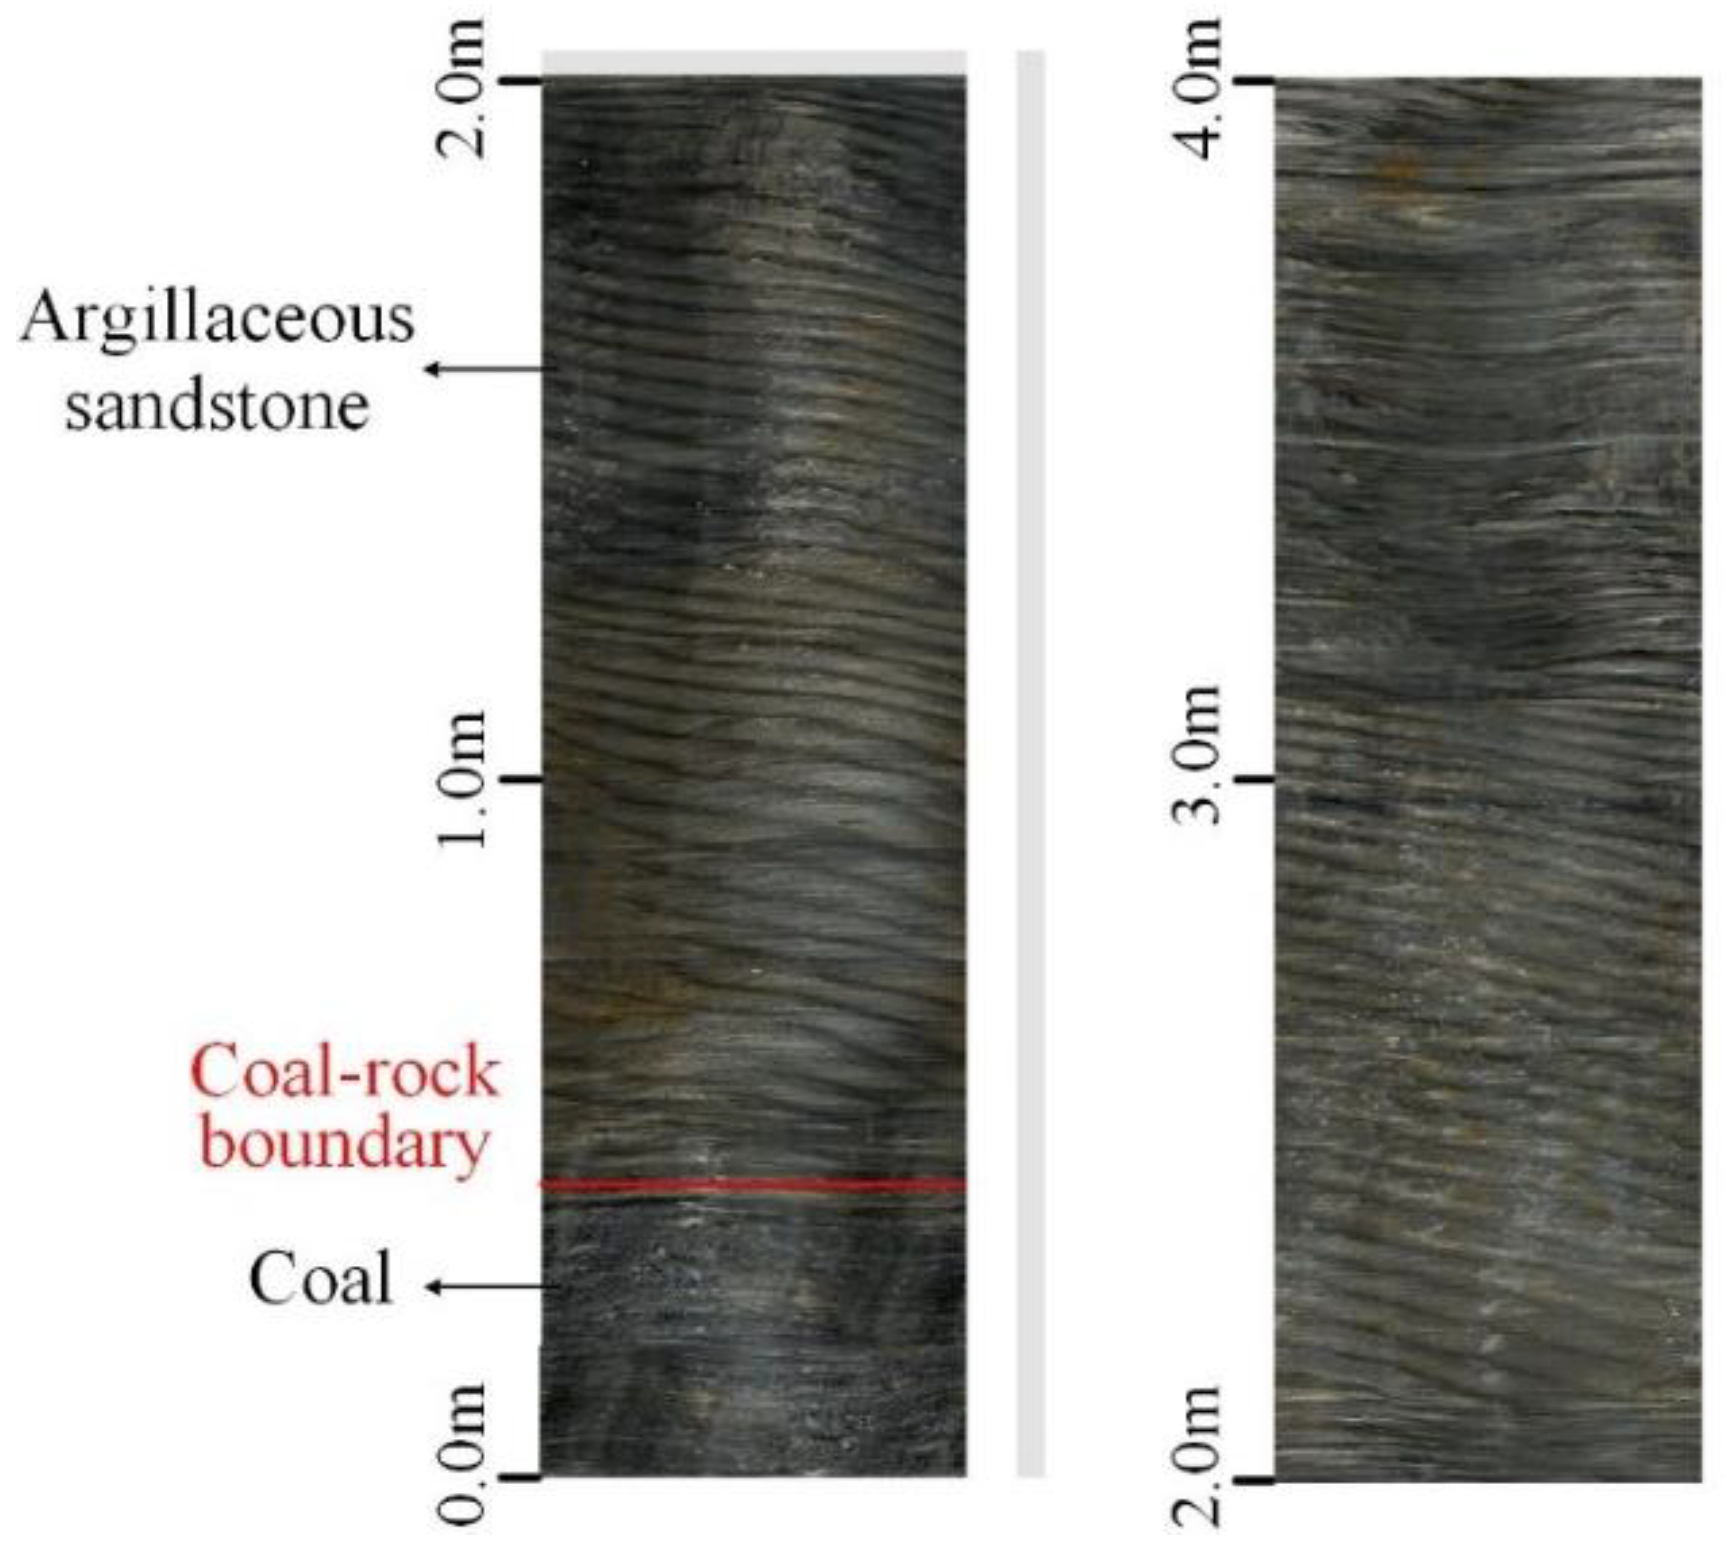
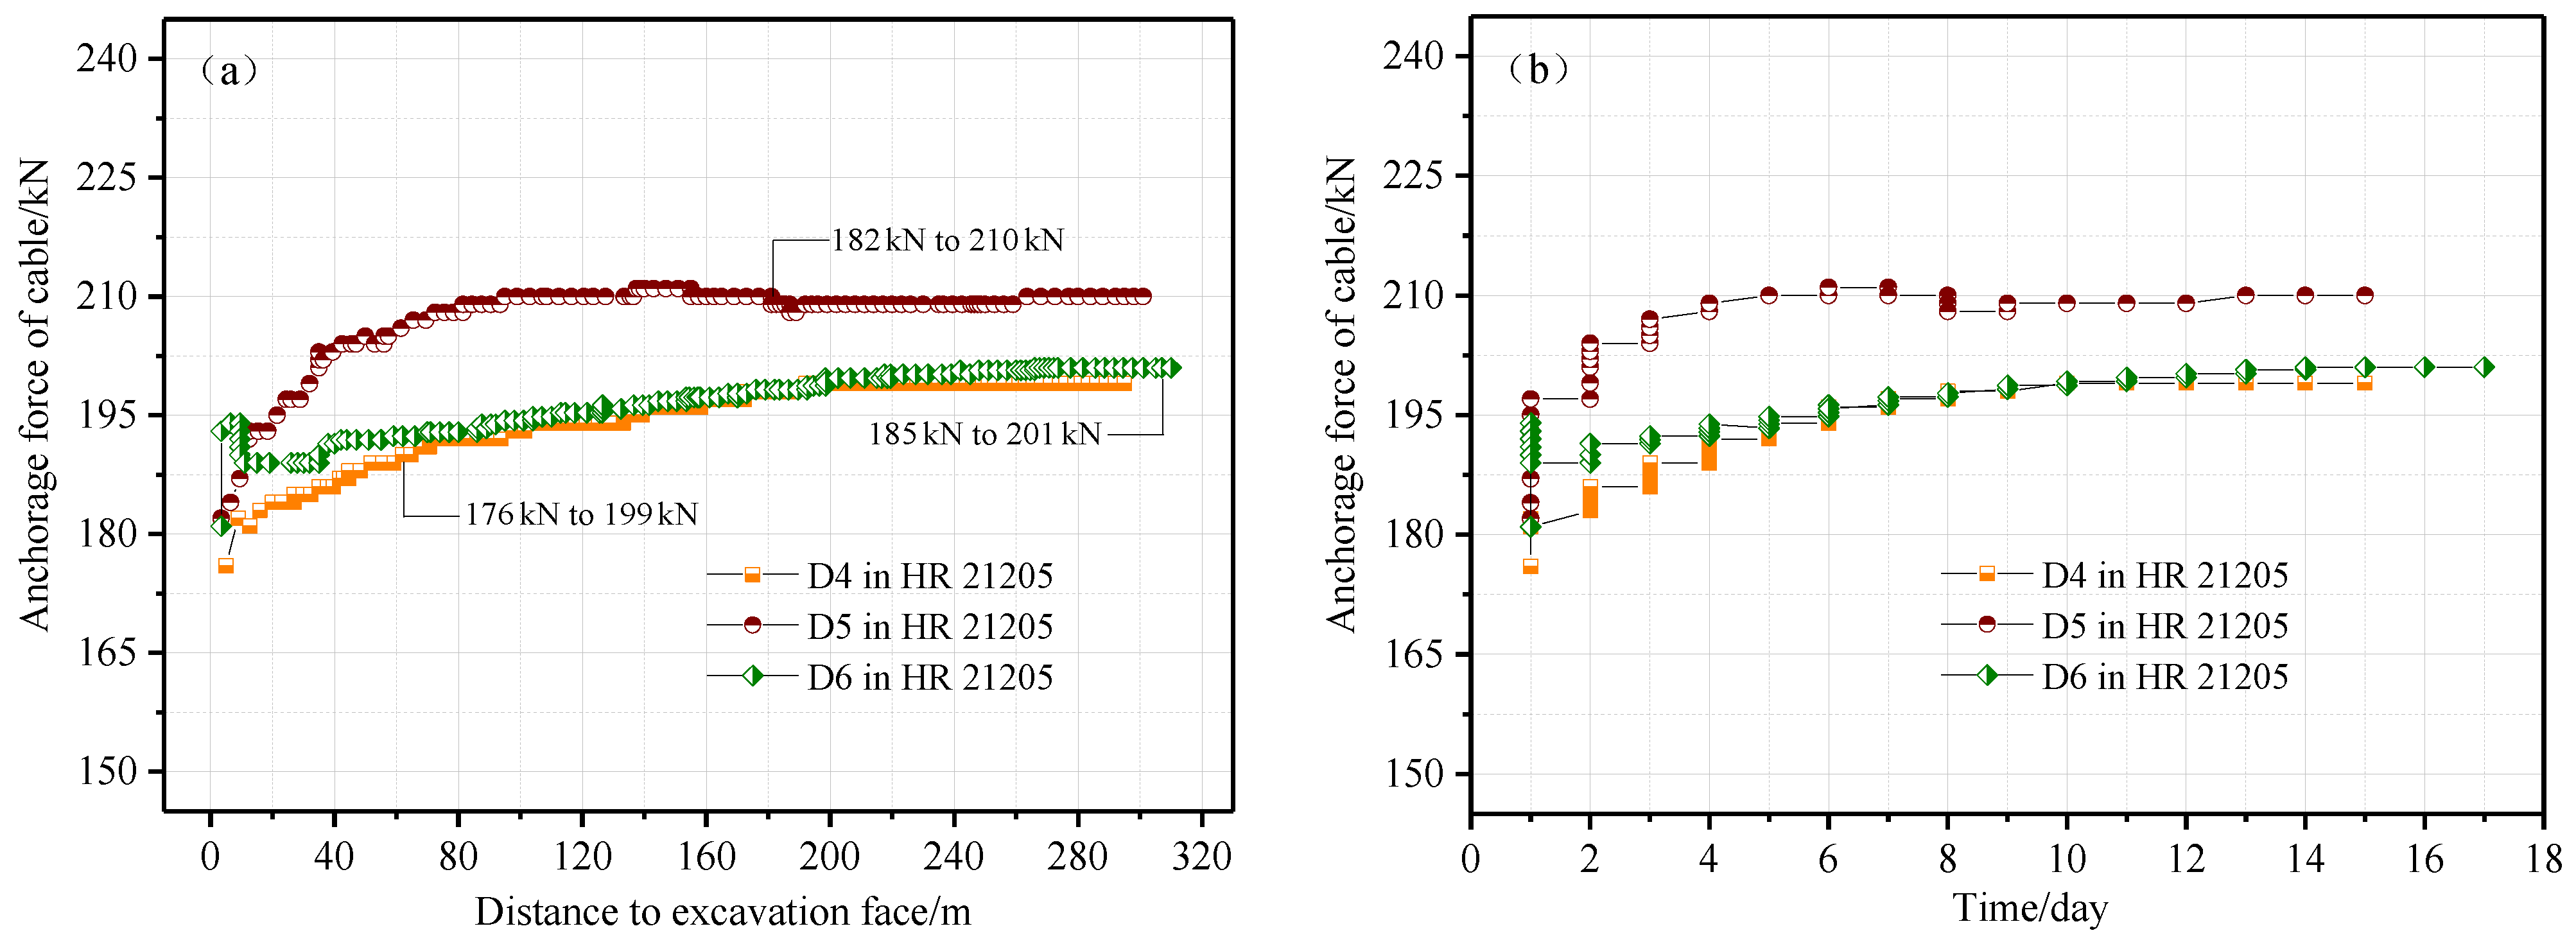
4.3.2. Monitoring Results and Analysis of Anchorage Force of Cable in HR 21205

The three groups of dynamometers in HR 21205 were denoted as D4, D5, and D6, respectively. The three groups of dynamometers were all installed on the thin-coal roof. The lithology within the range of the anchor cables was shown in Figure 12. The monitoring results were shown in Figure 13a,b. As can be seen, the growth trends of the anchoring force in the two figures are quite similar. To be specific, the curves can be divided into three stages: slight increase stage, slow-growth stage, and long-term stability stage. As is shown in Figure 13a,b, within the range of 40 m to the excavation face and within first two days after excavation, the roof surrounding rock deforms slightly and the anchoring force increases mildly compared with that of pure rock roof; in addition, the disturbance distance and time are also shortened. With the range of 40–170 m to the excavation face and within the 2nd–9th days after excavation, the anchoring force grows slowly with slight fluctuation; during this stage, the microfractures in the coal internal joints develop severely. By exerting higher pre-tightening force upon the anchor cable, greater work can be done to foster the fracture closing or evolution, which in turn causes the fluctuation of the anchoring force. Within the range of over 170 m to the excavation face, the anchoring force remains stable. The anchoring force measured by the D4 dynamometer rises from 176 kN to 199 kN, increasing by 13.1%; the anchoring force measured by the D5 dynamometer rises from 182 kN to 210 kN, increasing by 15.3%; the anchoring force measured by the D6 dynamometer rises from 181 kN to 201 kN, increasing by 11.0%. The average growth rate of the three groups is 13.1%.

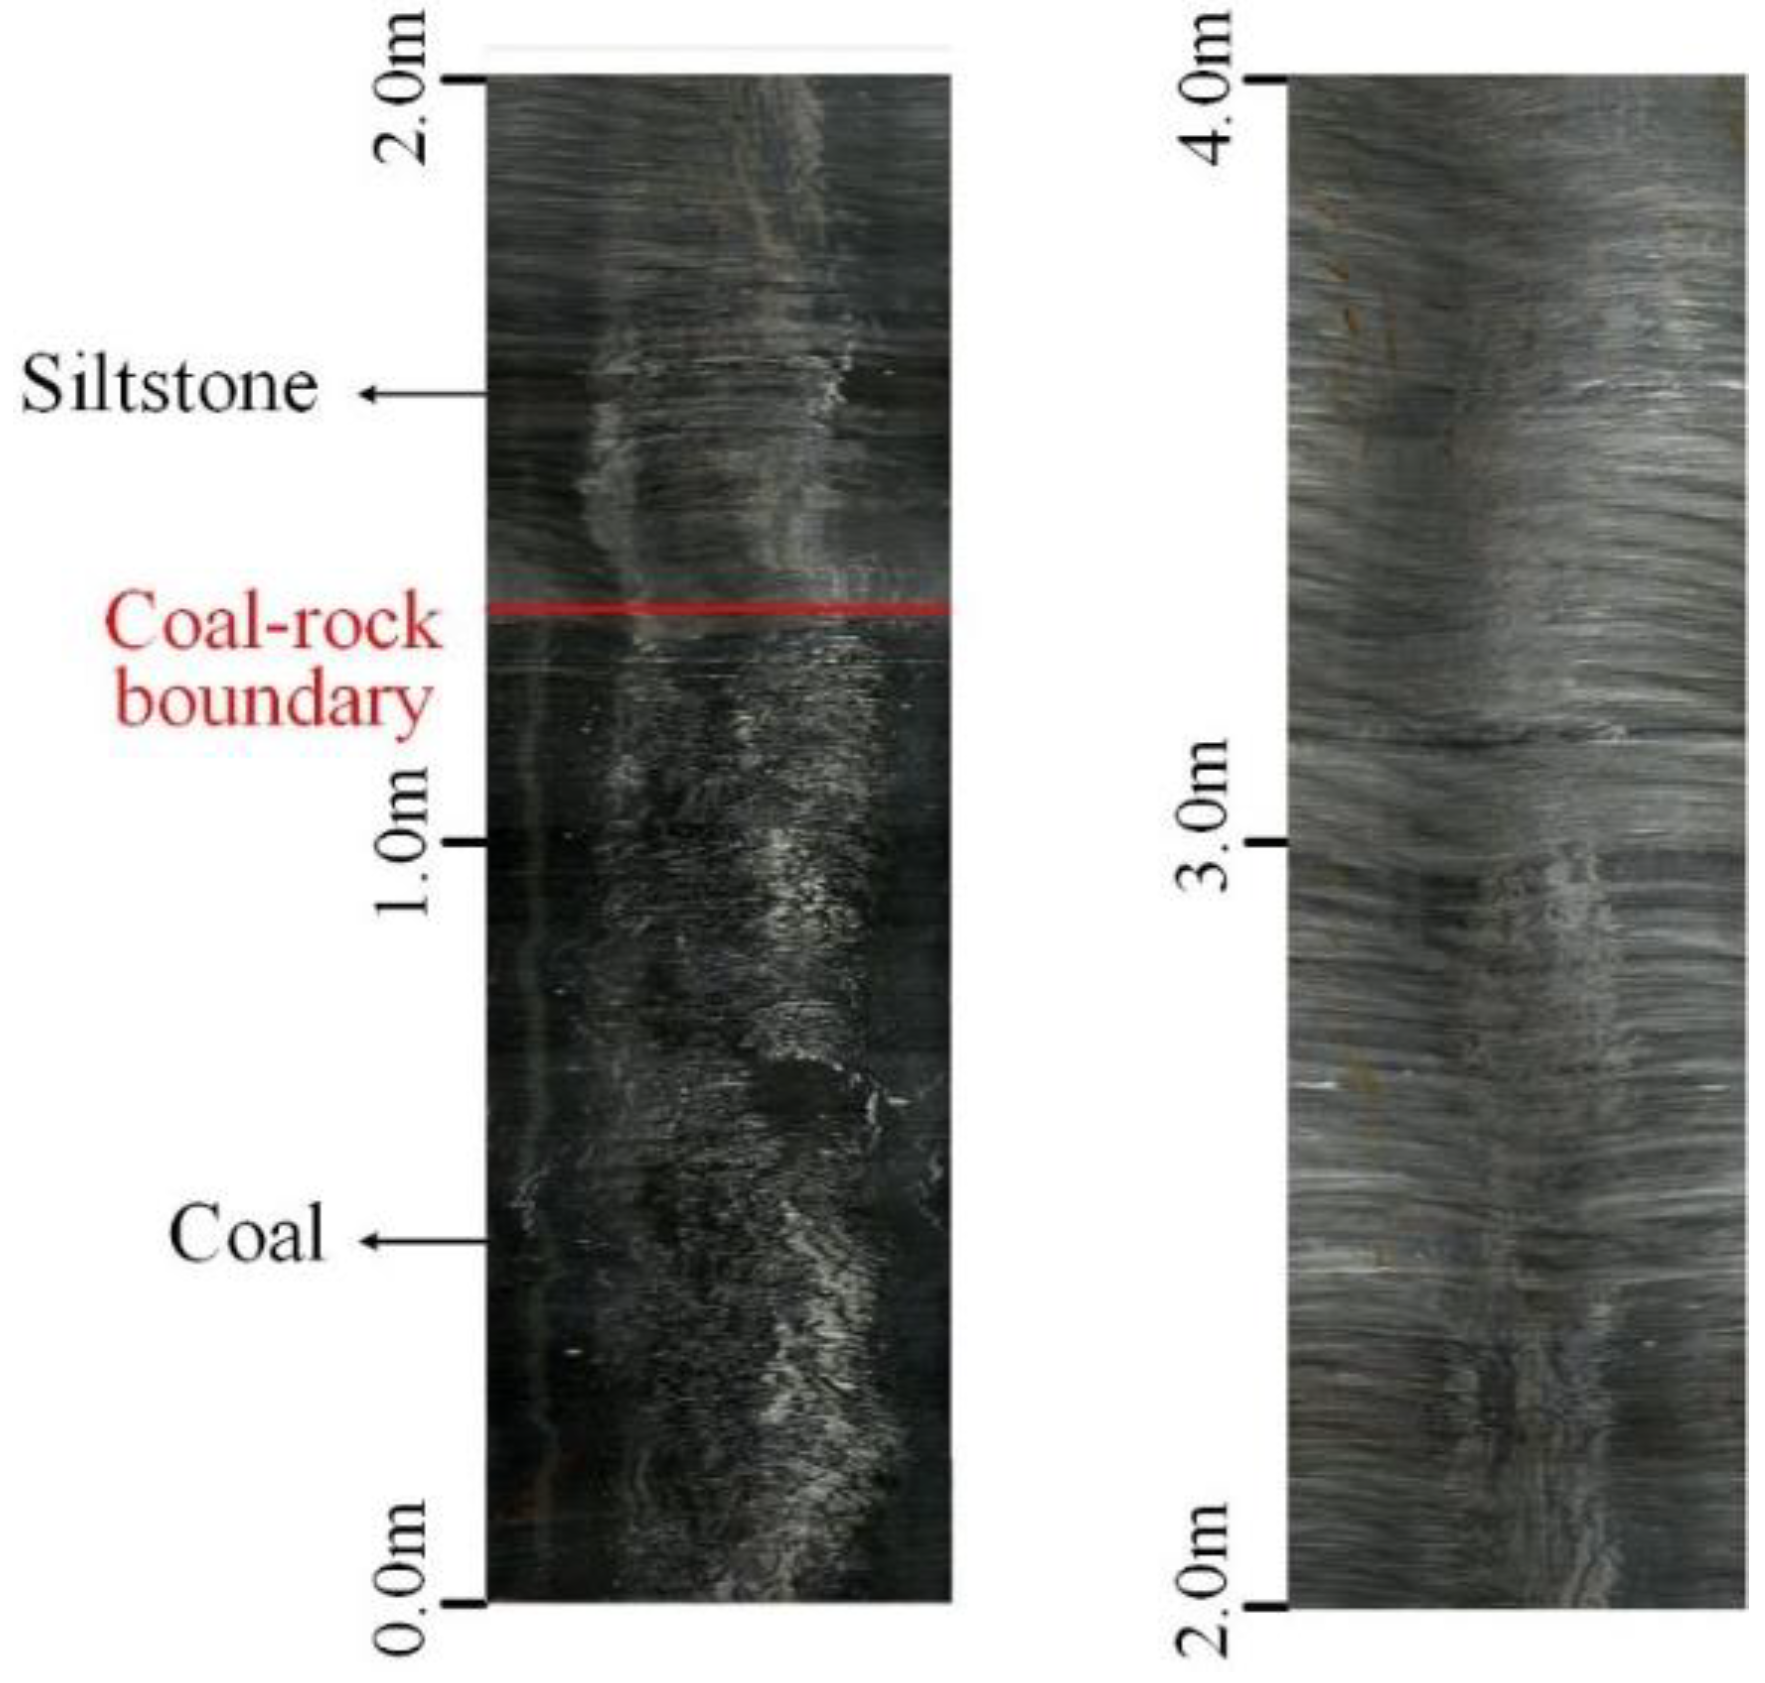
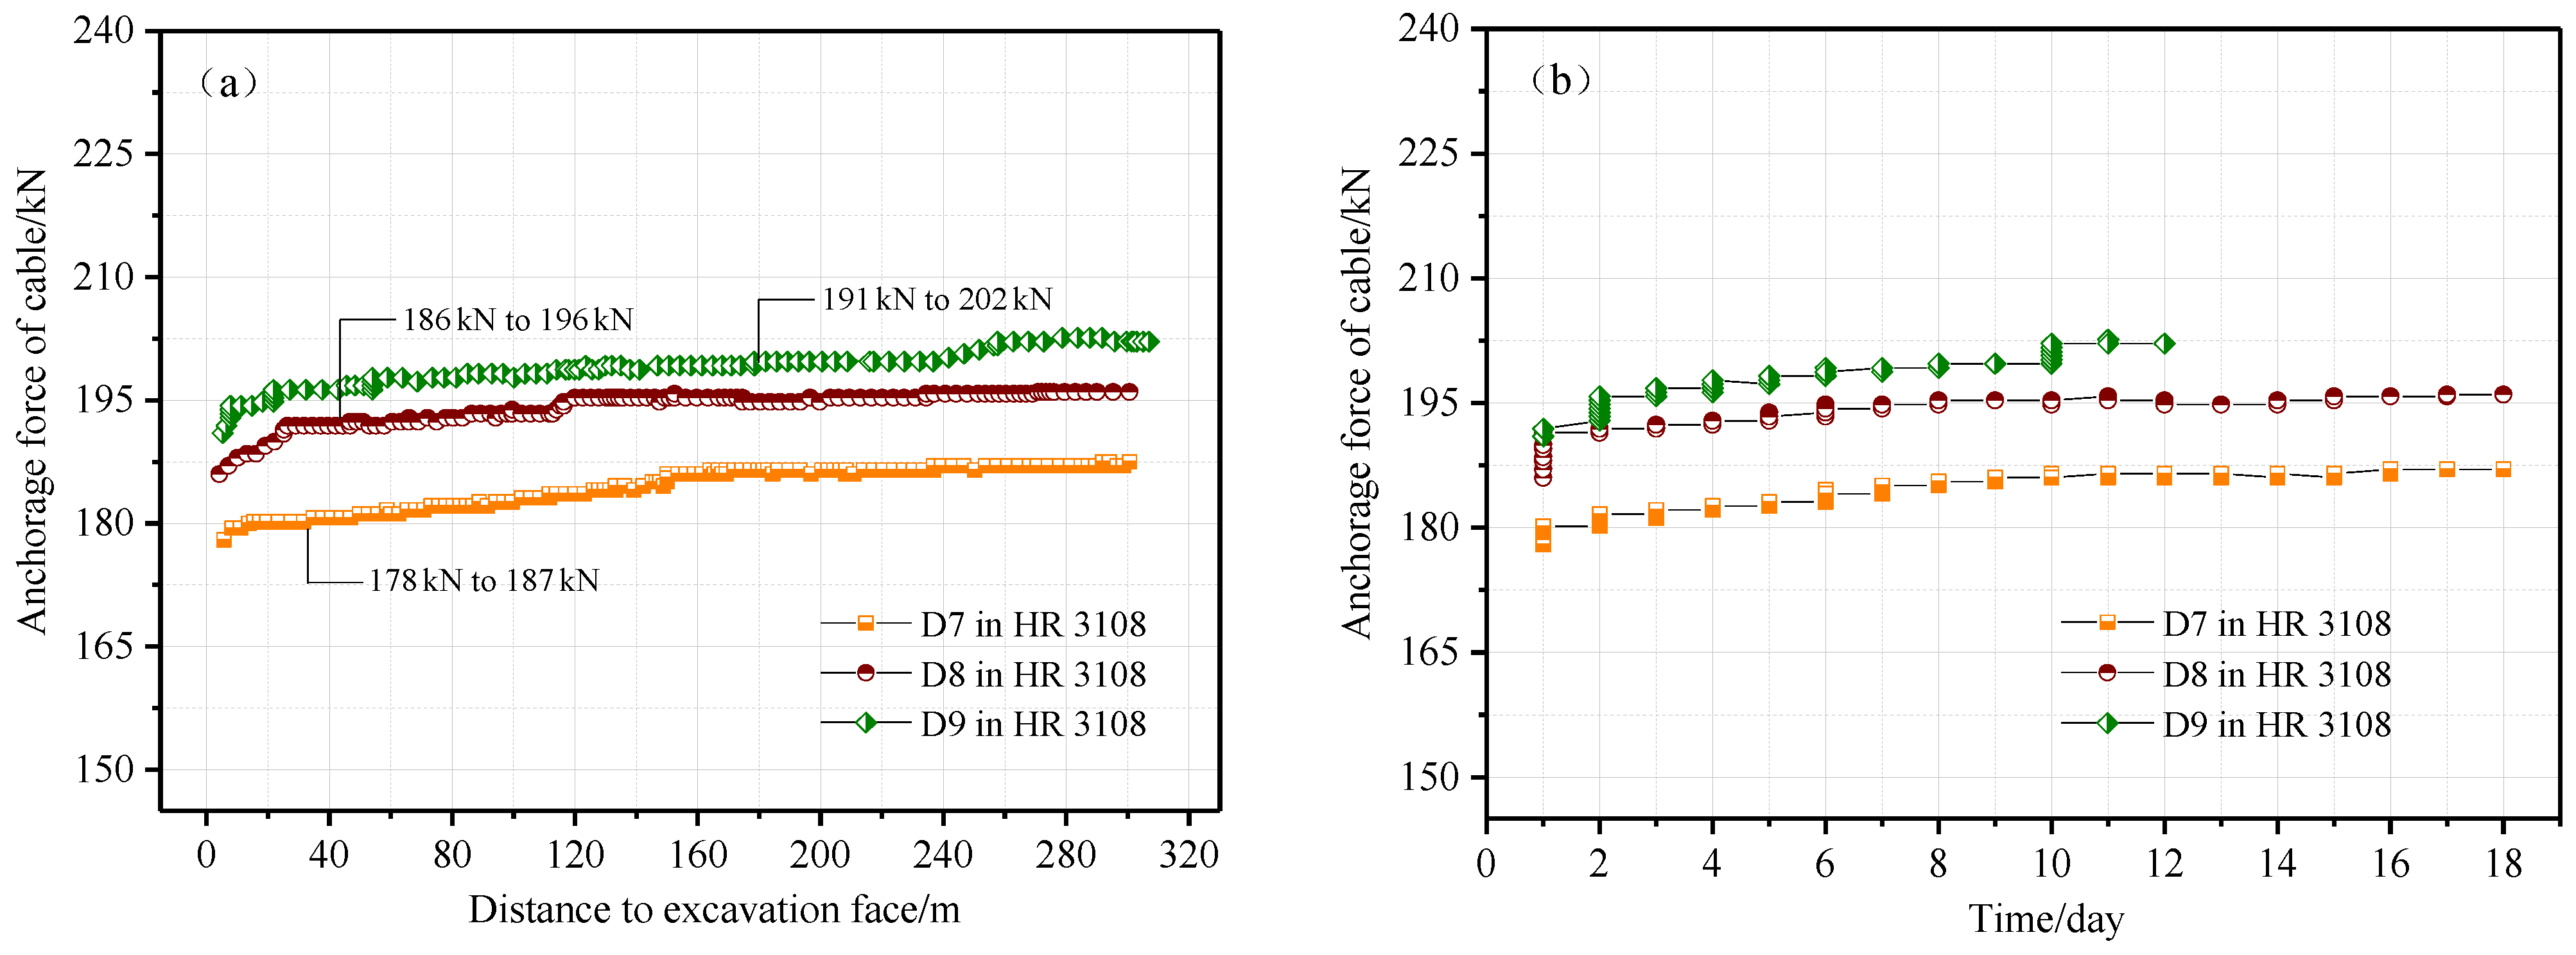
4.3.3. Monitoring Results and Analysis of the Anchorage Force of the Cable in HR 3108

The three groups of dynamometers in HR 3108 were denoted as D7, D8, and D9, respectively. The three groups of dynamometers were all installed on thick-coal roof. The lithology within the range of anchor cables was shown in Figure 14. The monitoring results were shown in Figure 15a,b. As can be seen, the growth trends of anchoring force in the two figures can be divided into two stages: slow-growth stage, and long-term stability stage. Within the range of 200 m to the excavation face and within the first 12 days after excavation, the anchoring force increases slowly. Within the range of over 200 m to the excavation face, the anchoring force remains stable. The anchoring force measured by the D7 dynamometer rises from 178 kN to 187 kN, increasing by 5.1%; the anchoring force measured by the D8 dynamometer rises from 186 kN to 196 kN, increasing by 5.4%; the anchoring force measured by the D9 dynamometer rises from 191 kN to 202 kN, increasing by 5.8%. The average growth rate of the three groups is 5.4%.

4.4. Discussion

The growth rate of the anchoring force displays a remarkable difference in different roof structures. As is shown in Figure 16, the growth rate of the anchoring face in the pure rock roof is much higher than that of the coal-rock roof, reaching 51.4% averagely. As the thickness of the coal seam increases, the growth rate of the anchoring force declines sharply, the lowest is 5.4%. This difference can be mainly attributed to the different forms of energy release and conversion in the roof. The energy released and the work done by the bolt support should be mutually adapted to each other. The energy released by pure rock roof is mainly elastic energy, whereas the dissipation energy only takes a small percentage. In this case, greater work should be done to constrain the elastic energy, thus leading to the largest increase in anchoring force. Comparatively speaking, a large number of microfractures develop in the coal mass of composite roofs, which means the roof releases more dissipation energy. In other words, the work needed to be done by the bolt support is relatively smaller. Consequently, the increase in the anchoring force tends to be remarkably milder. The further increase in the thickness of the coal seam in the immediate roof leads to a further decrease in anchoring force growth. Although fractures and separation layers appear in the coal mass of composite roofs, these fractures will not extend under strong bolt-cable support. To sum up, strong support technology can control coal-rock composite roofs effectively and restore the initial energy balance of surrounding rock to the maximum extent. It can improve the excavation efficiency while ensuring roadway safety, thus displaying a giant application potential.

5. Conclusions

(1)
The loading experiments on the coal-rock structures with different height ratios indicate that the strength of the coal-rock structure falls in between that of pure rock mass and pure coal mass; the strength of samples is determined by the coal-rock height ratio. When the height of the rock mass exceeds that of the coal mass, the sample strength is close to that of the rock mass, and vice versa.
(2)
As the load increases, the pure rock mass, pure coal mass, and coal-rock structures display different energy dissipation laws. During the pre-peak stage, the energy evolution is mainly based on the elastic strain energy. The change rule of elastic strain energy is determined by the stress value of the stress-strain curve. Meanwhile, as the height of the coal mass increases, the input energy tends to drop while the proportion of elastic strain energy to the total energy amount tends to increase. The strength peak point is crucial to the whole energy evolution. Once exceeding the peak point, the elastic strain energy is released suddenly, and the dissipation energy increases sharply, causing the failure in the coal mass in most cases.
(3)
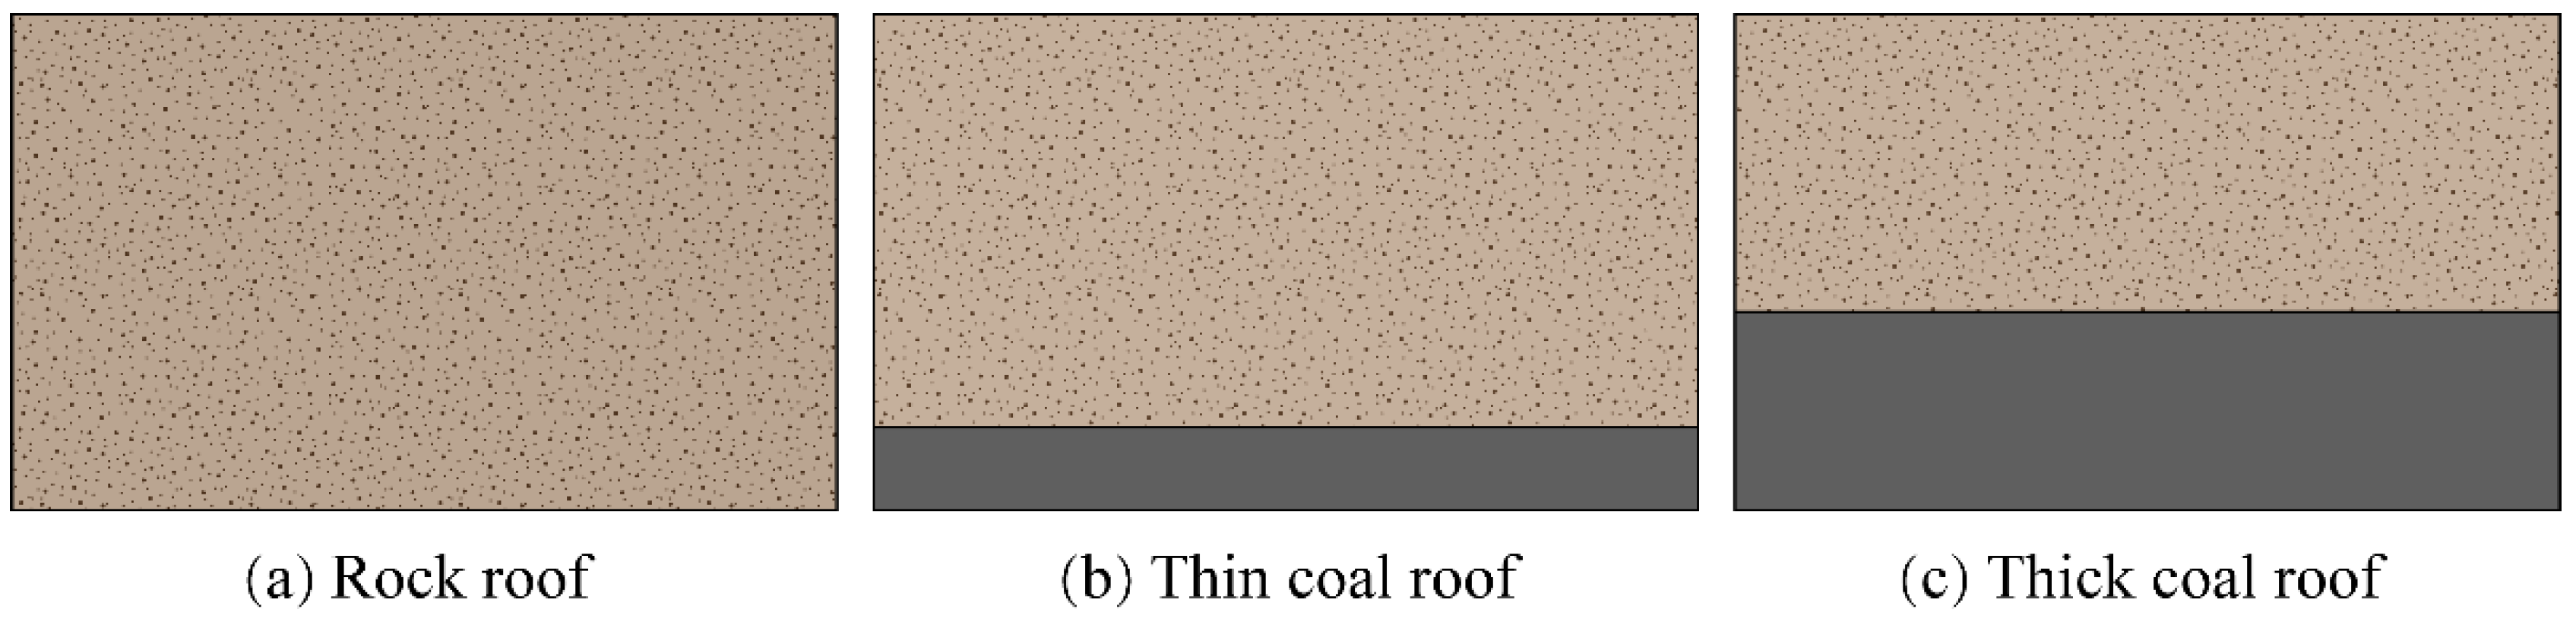
The support principle is put forward based on the energy balance theory in this paper. To achieve the safety control of roadways with a composite roof, two points should be considered. One, to speed up the bolt support construction. To be specific, the bolt support should be carried out before the large-scale energy release by the surrounding rock releases. Two, to improve the strength of the support system so as to restore the initial energy balance of the surrounding rock.
(4)
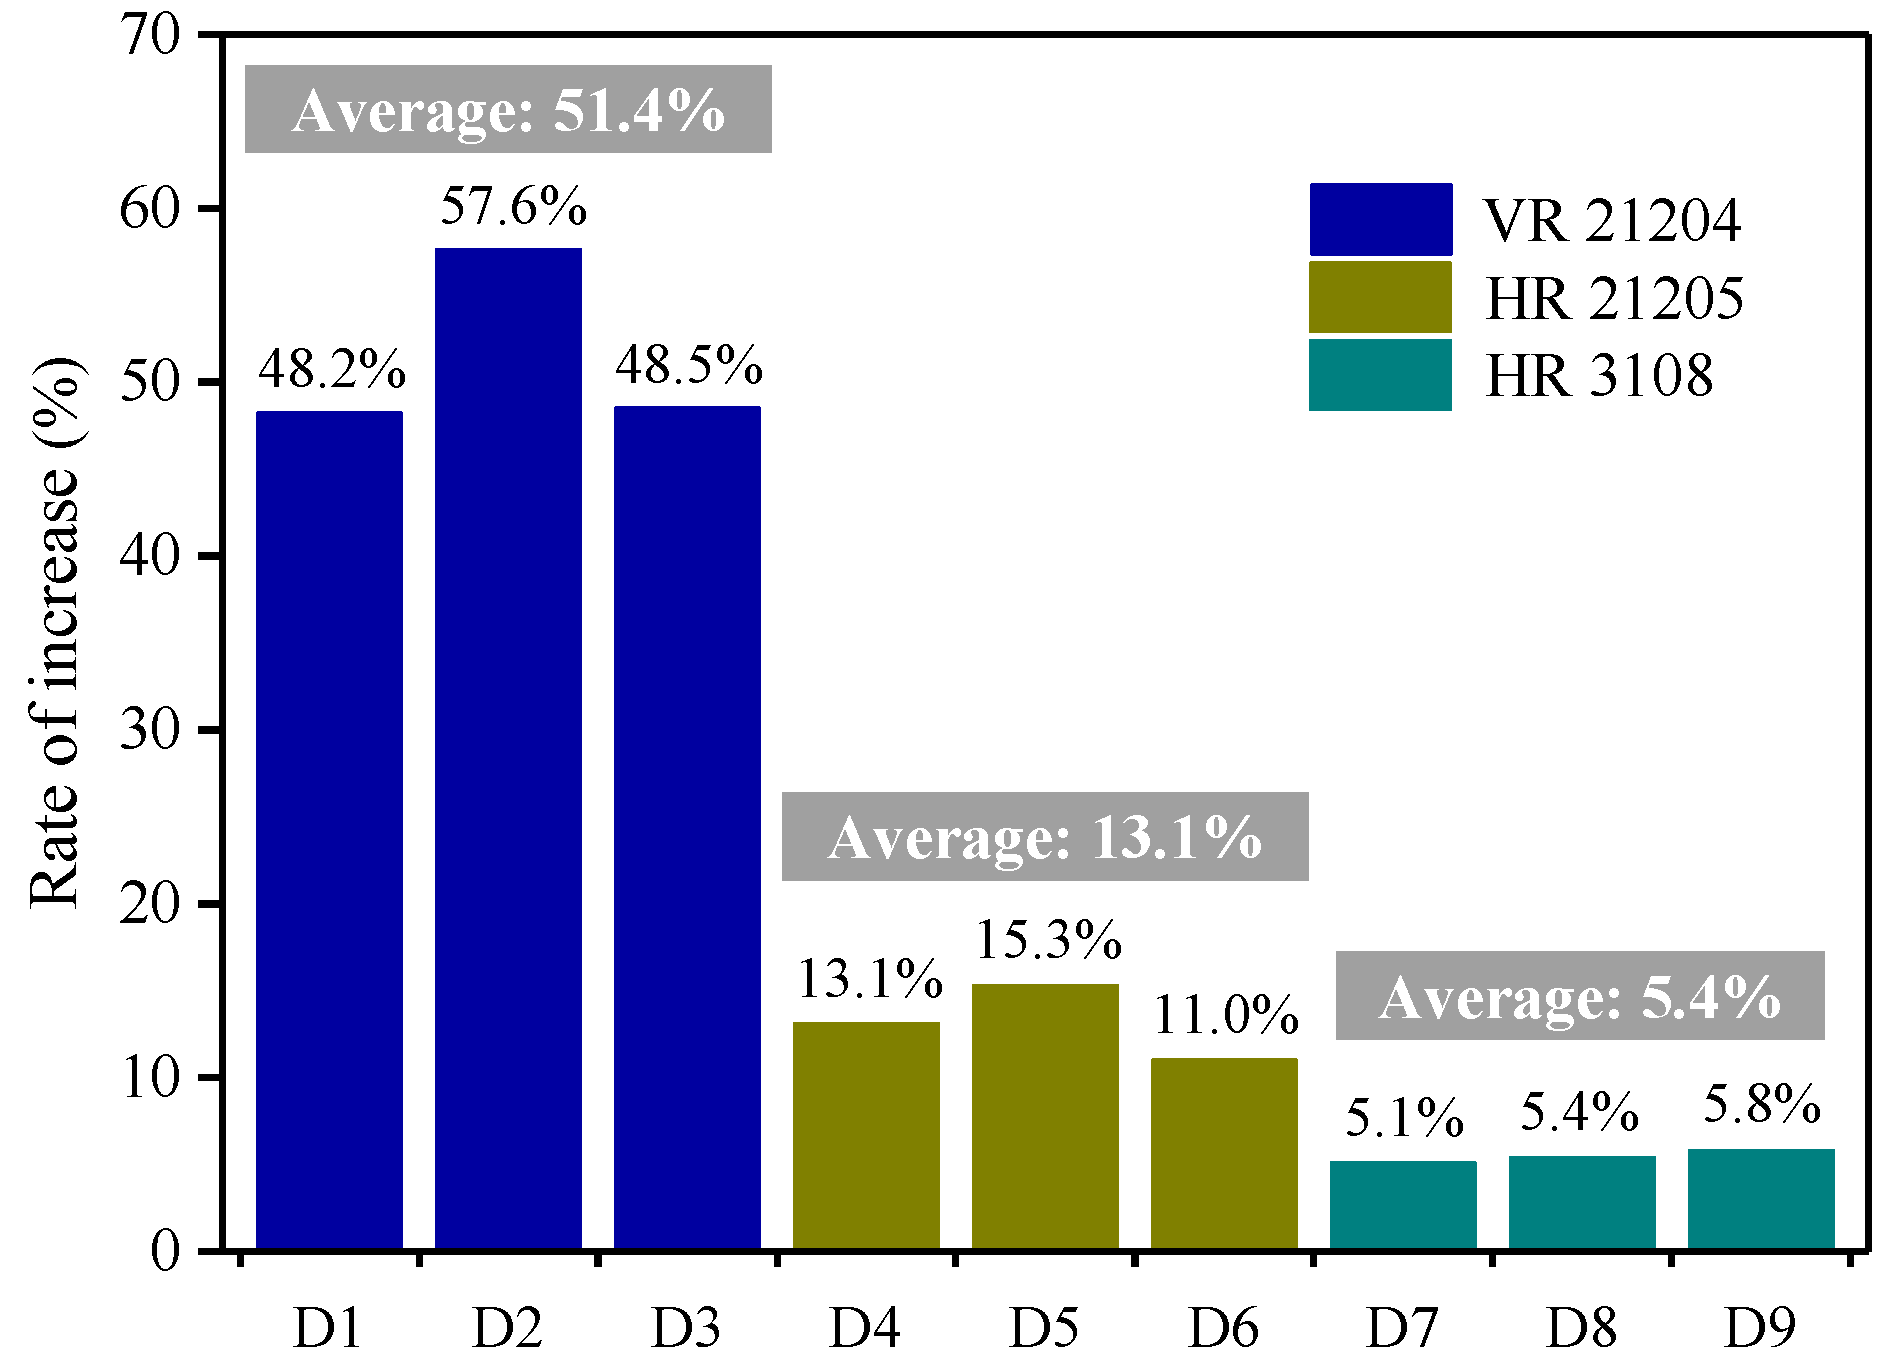
The above-mentioned support principle is applied to the actual roadway support design and industrial tests have been conducted. The monitoring results of the anchoring force indicate that the changing rules of the anchoring force vary remarkably when different types of composite roofs are involved. This can be attributed mainly to the different forms of energy release and the conversion of different types of composite roofs. The coal-rock composite roof would consume large quantities of energy; and as the height of the coal seam increases, more energy is to be consumed. Correspondingly, the work needed to be done by the support declines, which in turn reduces the increase of the anchoring force to adapt to the energy level of the roadway surrounding rock.

Author Contributions

Data curation—Z.X.; Formal analysis—Z.X., Y.Y. and G.X.; Funding acquisition—Z.X.; Investigation—Z.X. and N.Z.; Project administration—N.Z.; Writing—original draft—Z.X.; Writing—review & editing—Z.X., N.Z., G.X. and Q.W.

Funding

This work is financially supported by the Outstanding Innovation Scholarship for Doctoral Candidate of “Double First Rate” Construction Disciplines of CUMT.

Acknowledgments

The authors are grateful to the staff at the Hulusu Coal Mine and Menkeqing Coal Mine for their assistance during the field measurements.

Conflicts of Interest

The authors declare no conflict of interest.

References

  1. Yuan, L. Strategic thinking of simultaneous exploitation of coal and gas in deep mining. J. China Coal Soc. 2016, 41, 1–6. [Google Scholar]
  2. He, M.C.; Xie, H.P.; Peng, S.P.; Jiang, Y.D. Study on rock mechanics in deep mining engineering. Chin. J. Rock Mech. Eng. 2005, 24, 2803–2813. [Google Scholar]
  3. Kang, H.P. Support technologies for deep and complex roadways in underground coal mines: A review. Int. J. Coal Sci. Technol. 2014, 1, 261–277. [Google Scholar] [CrossRef]
  4. Xie, Z.Z.; Zhang, N.; Qian, D.Y.; Han, C.L.; An, Y.P.; Wang, Y. Rapid excavation and stability control of deep roadways for an underground coal mine with high production in Inner Mongolia. Sustainability 2018, 10, 1160. [Google Scholar] [CrossRef]
  5. Wang, Y.Y.; Abbas, T.; Xu, X.B. Application of coal mine roof rating in Chinese coal mines. Int. J. Min. Sci. Technol. 2018, 28, 491–497. [Google Scholar] [CrossRef]
  6. Liu, B.; Yue, Z.; Tham, L. Analytical design method for a truss-bolt system for reinforcement of fractured coal mine roofs-Illustrated with a case study. Int. J. Rock Mech. Min. Sci. 2005, 42, 195–218. [Google Scholar] [CrossRef]
  7. Napa-García, G.F.; Santos, R.A.; Beck, A.T.; Celestino, T.B. Improvement of analytical factor of safety estimation of falling failure mode in roof wedge stability. Int. J. Rock Mech. Min. Sci. 2018, 103, 116–122. [Google Scholar] [CrossRef]
  8. Young, M.; Walton, G.; Holley, E. Investigation of factors influencing roof stability at a Western U.S. longwall coal mine. Int. J. Min. Sci. Technol. 2019, 29, 139–143. [Google Scholar] [CrossRef]
  9. Ghasemi, E.; Ataei, M.; Shahriar, K.; Sereshki, F.; Jalali, S.E.; Ramazanzadeh, A. Assessment of roof fall risk during retreat mining in room and pillar coal mines. Int. J. Rock Mech. Min. Sci. 2012, 54, 80–89. [Google Scholar] [CrossRef]
  10. Ma, X.G.; He, M.C.; Wang, J.; Gao, Y.B.; Zhu, D.Y.; Liu, Y.X. Mine strata pressure characteristics and mechanisms in gob-side entry retention by roof cutting under medium-thick coal seam and compound roof conditions. Energies 2018, 11, 2539. [Google Scholar] [CrossRef]
  11. Guo, W.H.; Chang, Q.L.; Sun, X.K. Instability mechanism and control technology for deep-buried large-span complex roof coal roadway for the prevention of coal pollution. Ekoloji 2019, 28, 1401–1410. [Google Scholar]
  12. Zhang, H.Q.; Han, L.S.; Qi, Y.J.; Zhang, Y.F. Stability control mechanism and integral supporting technology of roadways with thick compound roof strata. In Proceedings of the 2nd ISRM International Young Scholars Symposium on Rock Mechanics, Beijing, China, 14–16 October 2012; pp. 709–712. [Google Scholar]
  13. Wang, H.W.; Xue, S.; Jiang, Y.D.; Deng, D.X.; Shi, S.Z.; Zhang, D.Q. Field investigation of a roof fall accident and large roadway deformation under geologically complex conditions in an underground coal mine. Rock Mech. Rock Eng. 2018, 51, 1863–1883. [Google Scholar] [CrossRef]
  14. Zhou, Z.L.; Chen, L.; Cai, X.; Shen, B.T.; Zhou, J.; Du, K. Experimental investigation of the progressive failure of multiple pillar-roof system. Rock Mech. Rock Eng. 2018, 51, 1629–1636. [Google Scholar] [CrossRef]
  15. Huang, W.P.; Yuan, Q.; Tan, Y.L.; Wang, J.; Liu, G.L.; Qu, G.L.; Li, C. An innovative support technology employing a concrete-filled steel tubular structure for a 1000-m-deep roadway in a high in situ stress field. Tunn. Undergr. Space Technol. 2018, 73, 26–36. [Google Scholar] [CrossRef]
  16. Mikhalyuk, A.V.; Zakharov, V.V. Dissipation of dynamic-loading energy in quasi-elastic deformation processes in rocks. J. Appl. Mech. Tech. Phys. 1997, 38, 312–318. [Google Scholar] [CrossRef]
  17. Xie, H.P.; Ju, Y.; Li, L.Y. Criteria for strength and structural failure of rocks based on energy dissipation and enegy release principles. Chin. J. Rock Mech. Eng. 2005, 24, 3003–3010. [Google Scholar]
  18. Steffler, E.D.; Epstein, J.S.; Conley, E.G. Energy partitioning for a crack under remote shear and compression. Int. J. Fract. 2013, 12, 563–580. [Google Scholar]
  19. Huang, D.; Li, Y. Conversion of strain energy in triaxial unloading tests on marble. Int. J. Rock Mech. Min. Sci. 2014, 66, 160–168. [Google Scholar] [CrossRef]
  20. Hua, A.Z.; You, M.Q. Rock failure due to energy release during unloading and application to underground rock burst control. Tunn. Undergr. Space Technol. 2001, 16, 241–246. [Google Scholar] [CrossRef]
  21. Zhao, Y.S.; Feng, Z.C.; Wan, Z.J. Least energy principle of dynamics failure of rock mass. Chin. J. Rock Mech. Eng. 2003, 22, 1781–1783. [Google Scholar]
  22. Bagde, G.; Petros, V. Fatigue and dynamic energy behavior of rock subjected to cyclical loading. Int. J. Rock Mech. Min. Sci. 2009, 46, 200–209. [Google Scholar] [CrossRef]
  23. Ferro, G. On dissipated energy density in compression for concrete. Eng. Fract. Mech. 2006, 73, 1510–1530. [Google Scholar] [CrossRef]
  24. Krzysztof, S. Laboratory testing of a long expansion rock bolt support for energy-absorbing applications. In Proceedings of the XVIIth Conference of PhD Students and Young Scientists, Szklarska Poreba, Poland, 31 January 2018. [Google Scholar]
  25. Krzysztof, S. A new design of support for burst-prone rock mass in underground ore mining. In Proceedings of the XVIIIth Conference of PhD Students and Young Scientists, Szklarska Poreba, Poland, 5 December 2018. [Google Scholar]
  26. Zuo, J.P.; Xie, H.P.; Meng, B.B. Experimental research on loading-unloading behavior of coal-rock combination bodies at different stress levels. Rock Soil Mech. 2011, 32, 1287–1296. [Google Scholar]
  27. Zuo, J.P.; Pei, J.L.; Liu, J.F.; Peng, R.D.; Liu, Y.X. Investigation on acoustic emission behavior and its time-space evolution mechanism in failure process of coal-rock combined body. Chin. J. Rock Mech. Eng. 2011, 30, 1564–1570. [Google Scholar]
  28. Zuo, J.P.; Xie, H.P.; Wu, A.M.; Liu, J.F. Investigation on failure mechanisms and mechanical behaviors of deep coal-rock single body combined body. Chin. J. Rock Mech. Eng. 2011, 30, 84–92. [Google Scholar]
  29. Chen, S.J.; Yin, D.W.; Zhang, B.L.; Ma, H.F.; Liu, X.Q. Mechanical characteristics and progressive failure mechanism of roof-coal pillar structure. Chin. J. Rock Mech. Eng. 2017, 7, 1588–1598. [Google Scholar]
  30. Lu, C.P. Intensity Weakening Theory for Rockburst of Compound Coal-Rock and its Application; China University of Mining and Technology: Xuzhou, China, 2008. [Google Scholar]
  31. Liu, J.; Wang, E.Y.; Song, D.Z.; Yang, S.L.; Niu, Y. Effects of rock strength on mechanical behavior and acoustic emission characteristics of samples composed of coal and rock. J. China Coal Soc. 2014, 39, 685–691. [Google Scholar]
  32. Guo, W.Y.; Zhou, H.; Xu, N.H.; Chen, W.G.; Wei, P. Simulation study of mechanical properties of coal rock combination. Saf. Coal Min. 2016, 47, 33–35. [Google Scholar]
  33. Gao, M.S.; Zhang, N.; Dou, L.M.; Wang, K.; Kan, J.G. Study of roadway support parameters subjected to rock burst based on energy balance theory. J. China Univ. Min. Technol. 2007, 36, 426–430. [Google Scholar]
  34. Zhang, J.W.; Shi, Q.; Liu, Z.J.; Li, X.W.; Zhao, J.L. Analysis of energy dissipation for stagger arrangement roadway surrounding rock. J. Min. Saf. Eng. 2015, 32, 929–935. [Google Scholar]
Figure 1. The sketch map of the seven coal-rock structures.
Sustainability 11 03688 g001
Figure 2. Stress-strain curves of coal-rock structures with different height ratios: (a) the coal-rock height ratio is 0:1; (b) the coal-rock height ratio is 1:7; (c) the coal-rock height ratio is 1:3; (d) the coal-rock height ratio is 1:1; (e) the coal-rock height ratio is 3:1; (f) the coal-rock height ratio is 7:1; and (g) the coal-rock height ratio is 1:0.
Sustainability 11 03688 g002aSustainability 11 03688 g002b
Figure 3. Uniaxial compressive strength of coal-rock structures with different height ratios.
Sustainability 11 03688 g003
Figure 4. The relation between dissipation energy and elastic strain energy in the loading process of rock mass.
Sustainability 11 03688 g004
Figure 5. Energy evolution curves of coal-rock structures in the loading process: (a) AS-1; (b) CAS-a2; (c) CAS-b2; (d) CAS-c2; (e) CAS-d3; (f) CAS-e3; and (g) C-2.
Sustainability 11 03688 g005
Figure 6. The characteristics of energy distribution.
Sustainability 11 03688 g006
Figure 7. Three types of roof structure: (a) rock roof; (b) thin coal roof, the thickness of coal seam less than 1 m; (c) thick coal roof, the thickness of coal seam more than 1 m.
Sustainability 11 03688 g007
Figure 8. Support design of HR 3108.
Sustainability 11 03688 g008
Figure 9. Working principle of the digital dynamometer.
Sustainability 11 03688 g009
Figure 10. Borehole image in the roof of VR 21204.
Sustainability 11 03688 g010
Figure 11. Monitoring results of D1, D2, and D3 in VR 21204: (a) the relation between the anchoring force and the distance to the excavation face; (b) the relation between the force and time.
Sustainability 11 03688 g011
Figure 12. Borehole image in the roof of HR 21205.
Sustainability 11 03688 g012
Figure 13. Monitoring results of D4, D5, and D6: (a) the relation between anchoring force and distance to excavation face; (b) the relation between anchoring force and time.
Sustainability 11 03688 g013
Figure 14. Borehole image in the roof of HR 3108.
Sustainability 11 03688 g014
Figure 15. Monitoring results of D7, D8, and D9: (a) the relation between the anchoring force and the distance to the excavation face; (b) the relation between the anchoring force and time.
Sustainability 11 03688 g015
Figure 16. The growth rate of the anchoring force in different roadways.
Sustainability 11 03688 g016
Table 1. The lithology combinations and coal-rock height ratios of the samples.
IDLithologyCoal-Rock Height RatioCoal Height/mmRock Height/mmNumber
ASArgillaceous sandstone0:101003
CAS-aCoal-argillaceous sandstone structure1:712.587.53
CAS-b1:325753
CAS-c1:150503
CAS-d3:175253
CAS-e7:187.512.53
CCoal1:010003
Note: argillaceous sandstone (AS), coal (C), coal-argillaceous sandstone (CAS).
Table 2. The lithology of roadway roof and floor and the thickness of the rock strata.
VR 21204HR 21205HR 3108
LithologyThicknessLithologyThicknessLithologyThickness
Medium-grained sandstone18.2 mMedium-grained sandstone13.2 m//
Argillaceous sandstone2.6 mArgillaceous sandstone10.7 mSandy mudstone9.4 m
Fine-grained sandstone5.3 mFine-grained sandstone5.4 mMid-fine grained sandstone19.8 m
Argillaceous sandstone3.7 mArgillaceous sandstone3.5 mSiltstone2.3 m
Coal3.2 mCoal3.7 mCoal4.8 m
Siltstone6.5 mSiltstone6.8 mSiltstone9.5 m
Argillaceous sandstone7.5 mArgillaceous sandstone8.0 mmid-fine grained sandstone21.2 m

