Abstract
A large proportion of the academic literature about the agency problem focuses on corporate governance or the instruments that can be used to balance the incentives of shareholders and debt holders. Following the real options company valuation framework, one method to increase shareholder value involves increasing the intrinsic risk of the firm; however, such a practice reduces the bondholder value. We analyzed an innovative balance sheet instrument, the mandatory convertible bond, as a means to increase financial sustainability of companies, improving the value for shareholders without increasing the perceived default risk. The results of the empirical analysis illustrate that for companies in a weak credit position, the agency problem can be mitigated by the issuance of mandatory convertible bonds, which allows managers to increase company risk without being detrimental for bondholders. However, when the probability of distress is small, shareholders have less incentive to increase company risk than in a company funded by mandatory convertible bonds, being more aligned with bondholders. A better alignment of debt holders and shareholders incentives reduces inefficiencies, mitigates the probably of distress, and improves the long-term financial sustainability of companies and can promote stable growth and innovation.
1. Introduction
The classical agency problem between shareholders, debt holders, and company management arises when the objectives of the company managers are different from the interests of the owners of the company—the shareholders. This misalignment of objectives generates inefficiencies and costs that reduce the investments in innovation and affect the longer-term financial sustainability of companies. Company owners hire managers to run the company for them. However, in some cases, company managers can favor stable cash flows and try to reduce the risk of bankruptcy of the company, as their positions and salaries are at risk in distressed situations. Company managers can therefore be incentivized to primarily defend the interests of bondholders instead of shareholders, and projects with a higher risk profile that could maximize the equity value of the company and induce innovation are discarded [1]. With the objective of aligning company managers with shareholders, stock options plans and other incentives are designed [2]. Conversely, if the objectives of managers are predominantly aligned with shareholders, companies may invest in extremely risky projects that can easily drive companies into distress. A sustainable balance is necessary. The inefficient resource allocation caused by the agency problem may negatively affect the profitability of companies, and ultimately be harmful to a firm’s sustainability, creating defaulted or debt-dependent companies that do not contribute to the stable economic growth, innovation, or social development.
A large part of the agency problem literature focuses on determining the optimal balance between risk-taking and risk avoidance and the instruments to achieve that balance [3], with corporate governance [4,5], or company audit [6]. Those instruments can include management motivation agreements. Company boards design compensation schemes aimed to incentivize company managers and to align them with shareholders, as presented in Murphy [7] and Core et al. [8], but in some cases, the compensation schemes are limited by regulation, market, or society [9]. Those schemes offer incomplete solutions since they do not always address the fundamental issue of excessive leverage, or excessive risk, or the long-term financial sustainability of companies. Our research follows a different path by analyzing a balance sheet instrument as a means to align the incentives of managers, shareholders, and debt holders. We contribute to the sustainable development literature by studying whether a relatively new type of convertible instrument, mandatory convertible bonds (MCBs), can reduce the agency problem costs and increase the efficiency and long-term financial sustainability of firms.
The academic literature about mandatory convertible bonds is very scarce and the approach of the existing studies about this capital instrument is basically theoretical. The main objective of this paper is to present an empirical research using real market data to fill this gap. To the best of our knowledge no previous research has studied empirically the influence of the issuance of mandatory convertible bonds in the motivations of managers and shareholders and in the firm’s financial sustainability.
The real options theory, first described by Myers in 1977 [10], is generally used to value new projects and ventures within a company; however, it also offers a different perspective on the asymmetry of incentives between shareholders and bondholders. Under the real options company valuation framework, shareholders can also be considered holders of an American call option on the assets and projects of the underlying firm, with strike equal to the present value of the debt. Under this model, debt holders have a fixed claim on the assets of the firm and can also be considered as owning a sold put with strike present value of the debt. As signaled by Dorion et al. in 2014 [11], the payoff of the equity call on the company assets owned by shareholders is convex, and the payoff of the straight debt is concave. Shareholders can therefore increase the value of their claim by augmenting the volatility of the firm’s value, the volatility of both, the firm’s equity, and the firm’s debt. With the objective of increasing such volatility, shareholders can entice managers to invest in riskier projects that can potentially increase the future cash flows and maximize the return of the investment [12]. This company behavior is called risk shifting or investment in riskier projects. Risk shifting has been studied in several management surveys, which indicated that in normal situations, managers do not select riskier projects [13], but Eisdorfer [14] and Hennessy and Tserlukevich [15] illustrated that volatility has a positive relationship with value in distressed firms. That said, bondholders and company managers risk losing part of their investment and claims if projects are not successful and the asset value declines below the debt value. High-risk innovative projects increase the likelihood of positive outcomes that disproportionately benefit the entrepreneur, and bad outcomes that can disproportionately affect debt holders.
According to Modigliani and Miller [16], a debt-financed company is as solid as an equity financed company. New projects can be funded via equity, straight debt, or convertible debt. When issuing debt, company managers can act in their own interests using the proceeds of the debt raised to invest in existing proven projects with well-known future cash flows, choosing suboptimal projects that do not provide an adequate return on equity but that are low risk and benefit bondholders. Company managers can also enjoy equity incentives and invest in the interest of shareholders by making investment decisions that aim to maximize the equity value and not only the firm value and could lead them to make suboptimal choices that could eventually damage debt holders.
However, regarding the funding of new projects with equity, existing shareholders face another constraint, since it is in their interest to reduce the number of new shares to reduce the dilution of their voting rights and controlling power.
As described by Duturdoir et al. in 2014 [17], most empirical studies about instruments that have the potential to reduce the agency costs focus on testing the predictions of the theoretical models of the motivations for issuing standard convertible bonds. This paper is the first empirical study about agency cost mitigation that focuses on mandatory convertible bonds. Based on the previous studies about the impact of MCBs in the motivations of company managers, we performed an empirical analysis using the majority of MCBs issued between 2010 and 2018 to test the influence of modern mandatory convertible bond financing on both the agency problem and risk shifting in companies. However, the empirical study is limited by the reduced number of samples that can be found in the market. Additionally, transactions concurrent in time with the issuance of MCBs may impact the results of the study.
Can MCBs mitigate the agency problem between existing shareholders who wish to maximize the value of the company’s equity, and company managers and debtholders? In this paper we try to answer this question by testing several hypotheses. Our first hypothesis is that the agency problem can be mitigated by the issuance of MCBs, as the investment in riskier projects will be beneficial for shareholders under certain limits and will not be detrimental to bondholders. A company issuing MCBs can invest in riskier projects and increase its risk, and yet the market will not perceive a higher risk of bankruptcy, in the same way as when a company issues new equity. However, in the case of MCBs, the dilution of existing shareholders is limited and there is no profit sharing until maturity. When companies are in a situation close to financial distress, the issuance of MCBs can be equally helpful as a capital increase—the issuance of plain equity—for its bondholders but can be marginally beneficial for existing shareholders that might experience a lower dilution and a higher return by increasing the company risk. The second hypothesis is that after the issuance of MCBs, extrinsic company metrics, namely traded credit spreads, have less influence on the volatility of the firm. Intrinsic credit ratios, which drive managers to make investment decisions, become more important.
Firstly, we designed a theoretical framework based on the real options theory following Dorion et al. [11]. We used this simplified real options framework for company valuation to analyze how (1) shareholders promote corporate investments in riskier projects, (2) bondholders and company managers tend to have a preference for investing in low-risk stable cash flow projects, and (3) whether MCBs can balance both incentives.
The simulation of companies’ value using the simplified real options model suggests that, as with plain equity, companies that include MCBs as a balance sheet funding instrument can marginally increase shareholder value by increasing the company risk without deteriorating credit metrics, which is simultaneously positive for bondholders. MCBs are treated as equity on the balance sheet of the issuing firms, but in some situations, they behave like standard convertible bonds and like debt; MCBs do not dilute shareholders before conversion as the coupons are fixed and do not grant voting rights.
Then, we designed a regression model to test empirically the influence of the issuance of MCBs by companies on their risk or equity volatility and the impact of both their intrinsic (known in advance by management) and extrinsic (observable by the market) credit ratios in the firm’s risk and value. We studied the majority of the public mandatory convertible bonds issued from 2010 to 2018 and the behavior of five financial ratios of the underlying stocks in several periods of time. Finally, we analyzed the average volatility of the underlying shares one year before and one year after the issuance of the MCBs.
The document is structured as follows. Section 2 reviews the existing literature about the motivations and the impact on the agency problem of standard convertible bonds. Then we introduce mandatory convertible bonds and the related literature. In Section 3 we define the real options based company valuation framework and we study the theoretical impact of a balance sheet funded with MCBs in the incentives of shareholders and debt holders. In Section 4 we present the dataset and methods used. In Section 5 we present the empirical model and the analysis of the company ratios before and after the issuance of MCB. In Section 6 we perform the historical and implicit volatility analysis of the dataset before and after the issuance of MCBs. Section 7 and Section 8 present the results and summarize our findings.
2. Literature Review
Several types of research have studied how the issuance of straight convertible debt can mitigate the agency problem of risk shifting, reducing the incentives of shareholders to promote investments in riskier projects. In 1984, Green [3] argued that convertible debt reduces the asset substitution problem, since if equity values are above the conversion price, convertible investors will exercise the option and will dilute the new wealth of old shareholders who must then share the company potential.
In 1998, Lewis et al. [18] produced empirical evidence that high-quality firms, in terms of liquidity and debt ratios, issue straight debt, medium-quality firms issue convertible debt and straight debt, and firms close to a distressed situation with low cash flow generation and high debt to earnings before interest, taxes, depreciation, and amortization (EBITDA) ratios issue equity. Convertible bonds were considered a backdoor equity financing alternative for corporates by Stein [19].
Our paper focuses on the impact of another type of convertibles, the mandatory convertible bonds, in the incentives of company managers, shareholders, and debt holders. The first MCBs were introduced in the market in 1991. Initially, they were structured as preferred stock, but the investor’s claim was mandatorily exchanged for common stock at a pre-specified date. The MCBs evolved in the last years to include optionality in its structure and a variable conversion ratio between the initial conversion ratio and the upper conversion ratio, as described by Arzac [20]. When the stock price is sufficiently low, a lower conversion ratio is guaranteed; when the stock price is sufficiently high, a higher conversion ratio is offered; when the stock price is in the middle range, the conversion ratio is floating accordingly, being the lower conversion ratio into stocks larger than the higher conversion ratio.
Modern MCBs can be decomposed into a fixed coupon regularly paid that can be valued as a strip of cash flows, the underlying stock that will be mandatorily delivered at redemption, and an embedded physically settled call–spread ratio consisting of an at the money call option purchased by the issuer and an out of the money call option sold by the issuer [21]. MCBs can be considered as preferred equity with no voting rights, and with specific conversion features. Additionally, MCBs provide the benefit of partial tax deductibility of the coupons [21].
In 2014, Chemmanur et al. [22] published the first theoretical analysis about the motivations for issuing MCBs. They developed a theoretical model that predicts when a firm should issue debt, equity, or mandatory convertible bonds. Their model shows that companies facing a large asymmetry of information between the market value and its intrinsic value should issue debt of conventional convertibles. Companies facing some financial distress and fair equity market valuation, with low asymmetry of information, should issue MCBs. Modern convertibles do not share all the characteristics of the MCBs issued from 1991 to 2004. Nowadays, dividend protection clauses have become common, coupons paid are, in some occasions, lower than dividends, and the stock price appreciation offered by MCBs is lower than straight equity, but not capped.
In 2018, Weng [23] studied MCBs using the incomplete-contract theories outlined by Coase in 1937 [24] and developed by Kelin et al. in 1978 [25], Grossman and Hart [26], and others. Wang theoretically proved that MCBs can be an efficient financial instrument for companies both in distressed or in a solid credit situation if they are properly designed with a variable conversion ratio between two triggers, like in modern MCBs. Weng’s study deepens the understanding of how to balance the incentives of MCBs for investors, company managers, and straight equity shareholders, and how the variable conversion ratio of MCBs can reduce the agency problem.
Based on the studies of Chemmanur et al. [22] and Weng [23] and following the findings of Dorion et al. [11] about the agency problem mitigation effects of standard convertible bonds, we first developed a simplified company valuation model and then analyzed the market data of the MCBs issued from 2010 to 2018 to try to find empirical support for the model results.
3. Theoretical Model
A company can be valued as the present value of the future free cash flows once debt and other cost are paid. The future cash flows follow a stochastic pattern and can be valued using options theory. According to Dorion et al. [11], a company can be considered as a group of assets financed with a combination of equity (E) and straight debt (D), convertible debt (CD), and MCB. The company value is denoted by V. Equity, straight debt, convertible debt, and mandatory convertible bonds can be viewed as a combination of call and put options. This allowed us to analyze how the company value changes with the volatility of the underlying equity and debt.
A company financed only by straight debt and equity can be valued as:
The model is simplified and only the principals are measured; the coupons of straight debt, convertible debt, and mandatory convertible bonds are not included. The straight debt is defined in Equation (2), where Put is the value of an American put option sold by the bondholders, with strike equal to the face value of the debt (F):
The equity can be considered a call option on the projects of the company once the debt holders and other creditors have been repaid. The equity holders have a limited liability if the company defaults.
where F is the face value of the company debt as a proportion of the company value, which in general is 50%; r is the risk free rate, which is the underlying treasuries or bonds, with a maturity of 10 years; t is the time span used to measure the value of the company, which is three years in our model; and k is the strike of the options or the point where the shareholders lose the value of the equity of the company. The equity starts to have value once the fixed debt claims have been repaid, so, in general, k = F.
A simple graphical representation of the model before the introduction of risk/volatility is illustrated in Figure 1.
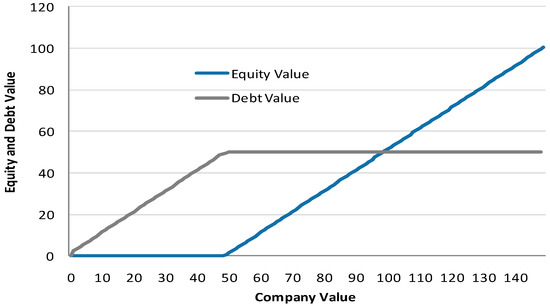
Figure 1.
Equity and debt value before the introduction of risk in the model.
If a company is financed by equity and standard convertible debt (CD), the above equations would be:
where Fc is the face value of the convertible debt (CD) as a proportion of the company value. Notably, existing shareholders will have a lower claim on the equity value if the stock price reaches the conversion price of the convertible bond, here represented as an upper call sold by equity holders. The old shareholders will be sharing value with the new convertible bond shareholders. The strike is divided by the parameter that represents the conversion ratio or the proportion between the convertible notional and number of shares if conversion is reached. At stock prices below the conversion price, convertible bonds behave like straight debt. Note that under the assumed model since the proportion of equity coming from the CD is the Fc divided by the conversion ratio. A graphical representation is provided in Figure 2.
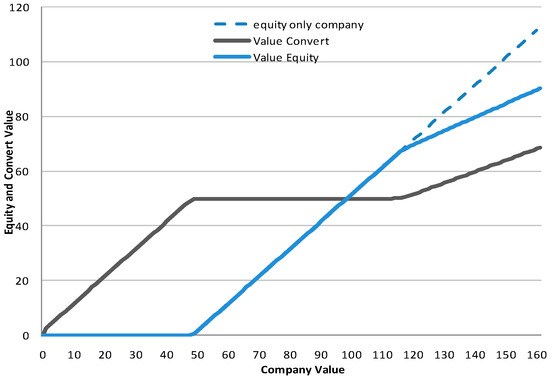
Figure 2.
Equity and plain convertible debt value before the introduction of risk in the model.
Conversely, a company financed by debt, standard MCBs with similar seniority to equity, and equity, when the stock (equity) price is S and where is the proportion of MCB to equity and is the upper conversion ratio, can be valued as:
In general, MCBs have three strikes: , , company value actual spot price, and . A graphical representation is provided in Figure 3.
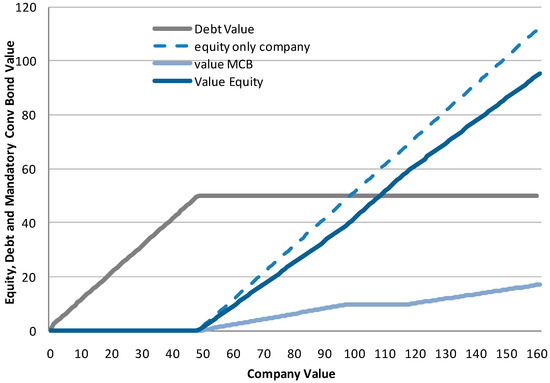
Figure 3.
Equity, debt, and mandatory convertible debt before the introduction of volatility in the model.
3.1. Impact of Risk Incentive
Under the above theoretical model, the value of equity is a convex function of the company value, dependent on the volatility of the underlying equity. We considered the company volatility as a proxy of the shareholders’ incentives to increase risk and of debt holders’ incentives to decrease it.
Following Baharat and Shumway [27], we calculated the volatility of the company value as:
where V is the company value (E + D), D is the proportion of debt, E is the proportion of equity, and is the standard deviation of the logarithmic daily variations of the stock price for one year, and:
The average volatility of equity in our research was 33% for the 81 underlying stocks and for the period between 2009 and 2018. Therefore, the average volatility of the company value in the sample of this study was 23%.
Using the model, we computed the reaction to a specific risk—company volatility—increase of +10 and +20 volatility points in a theoretical company funded with 50% straight debt and 50% equity. Figure 4, Figure 5 and Figure 6 show the effect on volatility on the equity and debt values as a proportion of company value, using the real options valuation model with calculation parameters: volatility () = 23%, time (t) = 3 years, face value of debt (F) = 50, proportion of equity or point where shareholders lose its value (K) = 50, and risk-free interest rate (r) = 1%. The increase in risk was implemented in the model as a company volatility increase of +10 and +20 points.
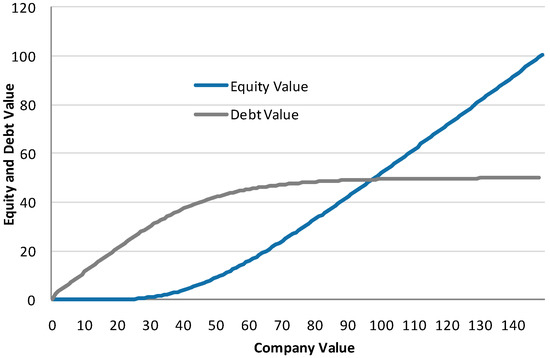
Figure 4.
Equity value and debt value using options valuation model.
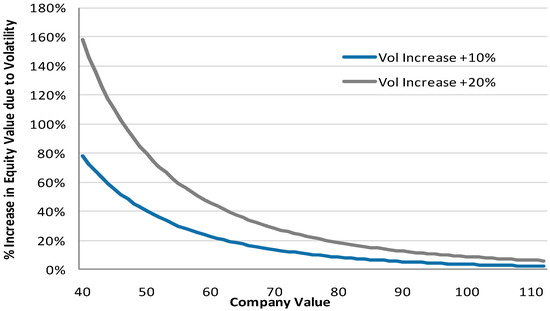
Figure 5.
Equity value percentage increase in a company funded by equity and debt with different risk increases.
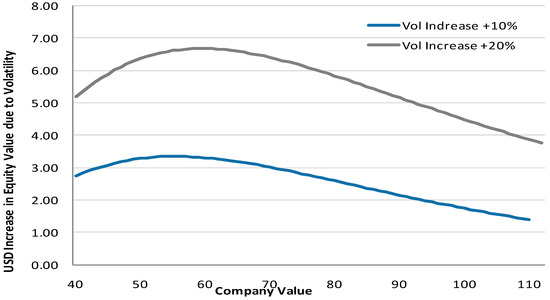
Figure 6.
Equity value monetary units in a company funded by equity and debt with different risk increases.
As displayed in Figure 5 and Figure 6, an increase in the perceived risk of the companies favors shareholders at any company value, albeit particularly when companies are close to distressed situations. Conversely, any volatility increase is detrimental for bondholders who see their claim value deteriorate, particularly at levels close to 50, which is the level where bondholders recover their investment.
3.2. Introduction of Mandatory Convertible Bonds in the Model
If a company is financed with straight debt, equity, and MCBs, the situation changes. Firstly, debt holders are more protected against default, since they have a preferential claim on the company assets, senior to MCB bondholders and equity holders. Secondly, company owners are more levered, meaning that they have more managing power and a higher potential return with less invested capital. Thirdly, equity holders will suffer a lower dilution if the company value increases above the conversion ratio. The theoretical values for equity, debt, and MCB predicted by the options model can be seen in Figure 7. The inputs of the model were a company value volatility of 23%, time length of 3 years, which is the standard market MCB maturity, upper conversion trigger of the MCB of 120%, proportion of equity 40%, proportion of MCB 10%, and risk-free rate 1%.
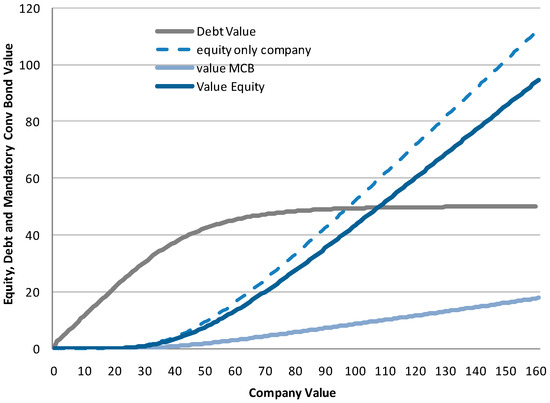
Figure 7.
Equity value and debt value in a company funded with equity, debt, and mandatory convertible bonds (MCBs) using options valuation model.
As highlighted in Figure 7, when the company volatility was introduced in the model, the value of the debt decreased compared with the static model, and the value of MCB and equity increased. According to this model, at lower company value levels, companies funded with MCBs tend to increase the volatility more than in companies funded with equity and straight debt, since the lower leverage ratios allow them higher risk (Figure 8). However, at higher company values, the incentive to increase risk (entering into riskier projects) decreases [11] due to the potential dilution if the company value reaches the conversion level (Figure 11); at those levels, MCBs behave like standard convertible bonds [28] (Gillet).
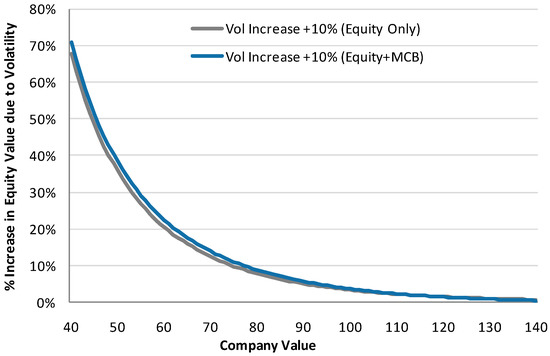
Figure 8.
Equity value percentage increase in a company funded by equity and in a company funded by equity debt and MCB.
Figure 8 represents the increase in the value for shareholders of a company funded with equity, debt, and MCB motivated by the investment in riskier projects. A deeper look at the results of the model offers more detail that allows the extraction of conclusions. At lower company values, a company risk increase of +10 points produces an increase in equity value of +4%. However, if the company volatility (risk shift) is +20 volatility points, the increase in equity value reaches +16%, which is four times more, as can be seen in Figure 9 and Figure 10.
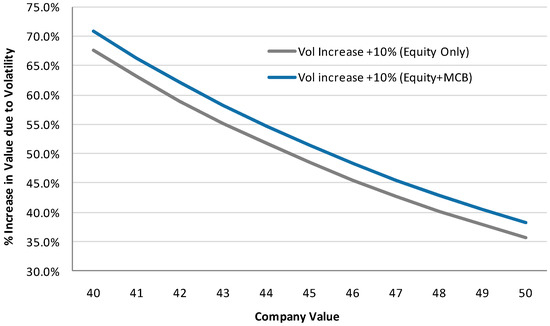
Figure 9.
Percentage increase in equity value in a company funded by equity and in a company funded by equity, debt, and MCB close to distress where the risk increases +10%.
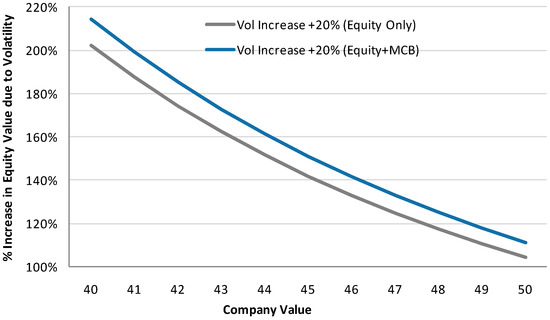
Figure 10.
Increase in equity value in a company funded by equity and in a company funded by equity, debt, and MCB, close to distress, where the risk increases +20%.
However, as mentioned before, when the company value is higher, the situation reverts and an increase in the company risk does not produce a larger equity value increase; it produces a reduction compared with a company funded with straight equity (Figure 11). This is consistent with, at higher equity values, an MCB behaving like a standard convertible bond, and the probability of a conversion into new shares at maturity increases, diluting existing shareholder value [11].
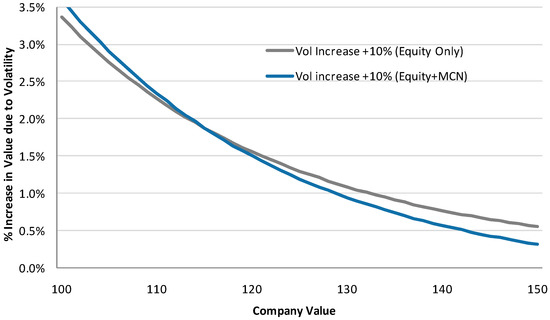
Figure 11.
Increase in equity value percentage in a company funded by equity and in a company funded by equity debt and MCB at high company values.
The first hypothesis that can be extracted from the real options simplified model is that companies that issue MCBs can invest in riskier projects and increase their volatility at low company values when their credit metrics are weak with the objective of increasing the return to shareholders. The return will be higher than for companies funded only by equity. Additionally, the issuance of MCBs will improve the perception of the credit market participants, who will react positively to the announcement of the issuance and the possibility of distress will decrease. When company credit ratios are good and company value is high, the issuance of MCBs reduces the agency problem, since the incentive of shareholders and company managers to increase the value is limited due to the potential dilution that materializes when the equity value rises [11]. This induced shareholder behavior increases the long-term financial sustainability of companies. In summary, when shareholders are confronted with the possibility of losing the totality of their investment, they will push companies to accept riskier projects that can damage bondholders, with the objective of obtaining some benefit. In such situations, the issuance of mandatory convertible bonds will reduce the impact to bondholders and the agency problem will be mitigated. Shareholders are prepared to suffer a dilution of their assets, since their other option would be to lose their investment. At higher company values, the issuance of MCBs also reduces the agency problem since it diminishes the benefit for shareholders of a risk increment due to the potential dilution they face if the equity value exceeds the conversion trigger.
Following this hypothesis, when a company is in a close-to-distress situation and issues MBCs, shareholders, bond holders, and company managers will have more incentives to allow leveraged investments in riskier projects. Firstly, MCBs improve the company’s credit ratios; secondly, more volatility would increase the shareholder value; and finally, if the stock rises, the dilution will be lower than in the case of a capital increase or share sale. If a company is in a solid credit situation and the incentives of a risk increase are high for shareholders, the issuance of both MCBs and plain convertible bonds can help reduce the incentives and the agency problem, inducing more balanced and sustainable company value growth.
4. Dataset and Methods
The mandatory convertible bonds universe is reduced. The study dataset was composed of 81 public MCBs issued between 2010 and 2018 in the U.S. and Europe. More details about the MCBs in the dataset can be found in Appendix A. There are substantial differences in the factors driving European and U.S. standard convertible and MCB issuance, as demonstrated by Dutordoir and Van de Gucht [29]. However, we assumed that the effects on the agency conflict are similar in both continents. Despite the limited number of samples, the dataset included the majority of the public MCBs issued during that time period with individual notional amounts per issuance above USD $100 million. All the underlying firms analyzed were corporations and financial institutions listed on the main stock exchanges. We analyzed 69 different stocks analyzed. In the period studied of 2010 to 2018, Nextera issued six MCBs, Crown Castle two MBCs, Hochdorf two MCBs, Volcan Holdings two MCBs, PPL Corp two MCBs, Stanley Black & Decker two MCBs, Telefónica two MCBs, and Vodafone two MCBs. The rest of the companies analyzed issued only one MCB.
We analyzed the 90 days’ historical and the three months’ implicit volatility of all the MCBs for a period between one year before and one year after the issuance of the security. The aspects that drive the issuance of MCBs and their impact on company ratios and on the underlying volatility do not last more than two accounting periods. The implicit volatility was extracted from the three-month traded options on the studied stocks. Three months is a liquid maturity period for listed options that allows the accurate calculation of the implicit volatility. The historical volatility was calculated as the annualized volatility of the logarithmic variations of the equity prices. More than 81,600 volatility data points were used in the calculations.
For the regression analyses, we collected a set of six independent variables that can define the credit quality and the potential incentives to issue MCBs of the above mentioned companies: senior credit spread, dividend yield, equity volatility, debt to market cap, cash ratio, and net debt to EBITDA. The dataset included 972 points.
As a data source for company ratios, volatility, and asset prices, we used the Bloomberg databases. We used the Black–Scholes [30] and Merton [31] option valuations model for the calculations of the risk shifting and company valuations. We analyzed the data using multinomial logit regression and linear multinomial regressions.
5. Regression Analyses
To test the hypotheses, we statistically analyzed five company credit metrics one quarter before the issuance of the MCB, and the same metrics one year after the issuance of the MCB (Table 1). Equity volatility is the annual historical volatility of a market observable variable. One of the independent variables, the senior credit spread, is an extrinsic or market variable tradeable by debt holders. The rest are intrinsic non-tradeable ratios of the company that are published quarterly, but where insiders have more information than external investors. The objectives were (1) to assess how the independent variables impact company risk shifting before and after the issuance, and (2) to measure which independent variables are a good predictor for the issuance of MCBs.

Table 1.
Description of the dependent and independent variables.
The first conclusion that can be extracted from Table 2 is that three months before the issuance of MCBs, the credit metrics of the 61 companies studied were relatively weak. Before the issuance of MCBs, companies had a high net debt to EBITDA ratio. The average net debt to EBITDA ratio for the SP500 index on the period was 1.48. Additionally, their average three year senior credit spread over risk-free rate was 2.54% compared with a 2010–2018 average of 0.93% for the companies included in the Itraxx Euro Investment grade five-year credit default swap (CDS) index, compared with 1.09% for the Markit CDX U.S. investment grade five-year credit default swap index on the same period. Note that CDS credit spreads are generally wider than senior debt credit spreads. This result is in line with other studies that found that the issuance of MCBs increases debt capacity and improves credit quality. The issuance can be considered as delayed new equity for firms [22,32].
Table 2.
Descriptive statistics of model variables three months before the issuance of MCB.
The results of Table 3 show that on average, one year after the issuance of MCBs, the debt capacity (debt to market cap) had improved from 1.08 to 1.77 and the credit spread decreased on average from 2.54% to 2.10%, reflecting the debtholders’ improvement. As predicted by the theoretical model, the volatility of the underlying equity increased from 34.58% to 35.53%, and this occurred despite an increase in the leverage and the general market volatility reduction that all underlying assets experienced since the start of the quantitative easing programs of the U.S. Federal Reserve, the European Central Bank, the Bank of England, and the Bank of Japan. Table 4 and Table 5 present the correlations between the variables.
Table 3.
Descriptive statistics of model variables one year after the issuance of MCB.
Table 4.
Summary of Pearson correlations between model variables three months before issuance.
Table 5.
Summary of Pearson correlations between model variables one year after issuance.
Multinomial Linear Regressions and Multinomial Logit Regressions
A multinomial linear regression model was used to study the effect of the independent variables on volatility at two moments of time: three months before and one year after the issuance of an MCB.
We used the following linear regression model (Model 1):
As illustrated in Table 6, the credit spread on the equity volatility has more of an impact before the issuance of MCBs and less afterward. After the issuance of MCBs, company investors find company leverage is less relevant for the volatility. Chemmanur et al. [22] introduced the concept of asymmetric information for MCBs, where insiders have more information about the intrinsic value of their company compared to outside investors. Their model predicts that a company should issue MCBs when it faces a lower asymmetry of information but a greater probability of financial distress. Our results indicate that the credit market perception of the company—the outside bondholders’ concern about the debt repayment capacity of the firm—is less relevant for the firm’s volatility after the issuance of MCBs. The results show that intrinsic information, like net debt to EBIDTA or cash ratio, has more of an effect on company volatility once the MCB has been issued.
Table 6.
Multivariate regression Model 1.
Additionally, we used a logit multinomial regression model to study the effect of the selected variables on the issuance of MCBs. The independent variables were equity volatility, senior credit spread, dividend yield, debt to market cap, cash ratio, and net debt to EBITDA. The dependent variable was Company Issued an MCB, which takes a value of one if the MBC is in the firm’s balance sheet, and zero otherwise.
The logit model is:
The results can be observed in Table 7. Equity volatility, cash ratio, net debt to EBITDA, and dividend yield seem to signal that a company has issued an MCB. Higher volatility, higher leverage (net debt to EBITDA), and better cash ratios are good indicators that a company has issued an MCB. In the sample studied, the selected variables could correctly predict the issuance of MCBs in 63% of the cases.
Table 7.
Logit regression Model 2.
6. Volatility Analysis
To measure the impact of MCB issuance, we analyzed the historical volatility and the implicit volatility extracted from the prices of the listed options on the underlying stocks during a one-year period before and after the issuance of MCBs. The results can be observed in Table 8.
Table 8.
Averaged equity volatilities from one year before to one year after the MCB issuance for the 81 MCBs.
The three month listed equity options tend to be very liquid and can offer a good approximation of the implicit volatility. Additionally, we calculated the average 90-day rolling historical volatility for the underlying shares of the 81 MCBs issued from 2010 to 2018.
The equity indexes’ volatility from 2010 to 2019 was influenced by the quantitative easing from central banks. To avoid the interference of macro trends, we normalized the volatility of every underlying using the reference indexes S&P 500, Euro Stoxx 50, and FTSE 100. The volatility increased after the issuance of MCBs. The average normalized historical volatility (implicit volatility) for the period before the issuance of MCBs was 2.24 (2.18) and the average normalized historical volatility (implicit volatility) after the issuance was 2.40 (2.47).
As illustrated in Figure 12, the results showed an important increase in the implicit volatility in the days after the issuance of the MCB, a 12-point volatility increase. This result could at first sight seem paradoxical, since when a company issues an MBC, in parallel it is also selling options (selling volatility), which should imply a reduction in market volatility. However, it potentially reflects the warrant nature of the implicit options in MCBs; the options implicitly sold are based on new shares yet to be issued by the issuing company. Some MCB investors will access the traded options market to hedge their investment, but the amount of traded options on a specific name, if they exist, remains constant. The abrupt initial implicit volatility increase could reflect the scarcity of traded options on the market and the supply and demand dynamics of the equity options market.
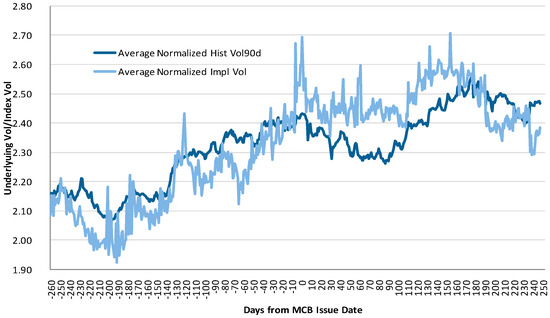
Figure 12.
Average equity volatility one year before and one year after the MCB issuance for the 81 MCBs.
Secondly, the analysis shows that, on average, both the firms’ implicit and historical volatility increased from 120 days before to the MCB issuance date. Then, after the temporary implicit volatility increase at issuance, the company risk remained flat or slightly decreased for 90 days on average. An explanation for this finding is that, in general, before the issuance of MCBs, companies are experiencing deterioration in their credit ratios, in turn impacting equity volatility, as discussed in Section 6. The issuance of MCBs represents a capital injection increasing the equity capital and helping the claim of bondholders. Firm credit ratios, like credit spread or debt to market cap, should improve (decrease) after the issuance. Therefore, in the short term when a company issued an MCB, the volatility stabilized. This result is in line with the multivariate regression results where the credit spread weighed the most, and the cash ratio and debt to market cap were also positively correlated with equity volatility.
Thirdly, after a period of 90 days, the volatility increased newly, although mildly, as predicted by the theoretical model. However, this time was different, as illustrated in Table 3, which presents the descriptive statistics of model variables one year after the issuance of MCBs. On average, company credit spread improved 17%, down from 254 bp to 211 bp one year after the issuance of MCBs, but the rest of the intrinsic credit ratios (debt to market cap, cash ratio, and net debt to EBITDA) remained constant or slightly worse. This can be explained by bondholders being more protected in their claim on the company assets due to the issuance of MCBs and simultaneously, the existing non-diluted shareholders could encourage company managers to invest in riskier projects to increase the equity value.
7. Results Summary and Discussion
First, our dataset shows that, after the issuance of MCBs, external credit perception and intrinsic leverage ratios improve. The amount of slack capital remains constant after the issuance of MCBs, as represented by the cash ratio. Company leverage increases substantially. On average, the company’s value, measured as the inverse of the dividend yield, increases after the issuance.
Second, the linear regression models show that after the issuance of MCBs, the influence on company volatility of market observed ratios related to debt holders decreases (credit spread and the debt to market cap). Lower company value (higher dividend yield) implies higher volatility and higher company value implies lower volatility, as predicted in the hypothesis. Intrinsic information ratios increase its influence on the volatility. The logit regression model reinforces our hypothesis of a lower influence of credit parameters and the increase in company value after the issuance of MCBs. The logit regression model also reflects how better valuation and higher leverage define companies that issued MCBs.
The results of the statistical analysis and of the regressions are in line with the conclusions of the theoretical analysis of Chemannur et al. [21], who say that after the issuance of MCBs, company undervaluation is lower, and that the issuing firm does not increases its chances of going into financial distress, the same as issuing equity.
The theoretical model predicts that when the company value is close to a distressed situation, a balance sheet structure composed of debt, equity, and MCBs offers shareholders more value per unit of increase of volatility than a company funded only by debt and equity. For a company with sound credit ratios where the equity value is very high, existing shareholders will have less incentive to invest in highly risky projects, since at high company values, MCBs convert into shares, triggering the dilution of its shares. At high equity values, MCBs stimulate the same shareholder behavior as plain convertible bonds. Our results seem to be in line with the findings of Dorion et al. [11], who predicted that the issuance of plain convertible bonds reduces the incentive to increase company risk. In our case the volatility increases sharply before the issuance and that increase mitigates or reverts after the company balance sheet includes MCBs, reflecting lower risk shifting incentives.
Finally, a common problem in the relationship between dependent and independent variables in empirical finance is the endogeneity problem, which can be caused by the correlation between the independent variables and the error term or when the dependent variable and one or several of the explanatory variables affect each other [33]. In our case, the dependent variable equity volatility mainly affects the credit spread and the dividend yield but also the other independent variables. We have checked the robustness of our regressions results and performed a simple endogeneity test. Following Abdallah [33] and Badía et al. [34], we performed a lagged dependent variable test in the multi-variable regression models. The results obtained do not change significantly, indicating that the simultaneous endogeneity is low in the studied dataset.
8. Conclusions
The scientific literature about the agency problem is extensive and, in some cases, focuses on management incentives schemes or governance. The agency problem potentially leads to inefficient resource allocation, which may be detrimental to firms’ long-term value, and ultimately to their financial sustainability. However, the empirical research about the influence of capital instruments in the agency problem, and in particular of mandatory convertible bonds, is very scarce.
This research tried to answer the following question: Can MCBs mitigate the agency problem and align the incentives of managers, shareholders who wish to maximize the value of the company’s equity, and debt holders, reducing leverage and increasing long-term corporate sustainability?
To answer the above question, firstly, we developed an options-based theoretical model to measure a firm’s incentives. The model predicts that if a company is in a credit-distressed situation, the issuance of mandatory convertible bonds allows the increase in firm risk by shareholders with less resistance from bondholders. Additionally, for companies in a good credit situation, the model predicts that the issuance of mandatory convertible bonds reduces the incentive of shareholders to increase company risk.
Secondly, we empirically analyzed a set of credit ratios and the equity volatility of a large part of the public mandatory convertible bonds issued from 2010 to 2018. The results show that before the issuance, the companies in our sample tended to have higher-than-average probability of financial distress, and that the credit market perception improves significantly one year after the issuance of MCBs. Additionally, our findings showed that the company’s perceived volatility, a proxy of the shareholders induced risk, increases mildly after the issuance. However, regressions showed that the influence of the bondholders’ perception on equity volatility (credit spreads) decreases, and that intrinsic ratios and asymmetry of information increase its influence. Multinomial logit regressions also showed how companies that have issued mandatory convertible bonds maintain higher leverage, lower dividend yield, and better cash ratios jointly with higher equity volatility.
Finally, we studied the dynamics of company volatility in our dataset, with data from the 81 companies from 2010 to 2018 before and after the issuance of a mandatory convertible bond. Company volatility sharply increased months before the issuance of MCBs, reflecting market concern. Weeks after the issuance, the volatility stabilized although showing increases, potentially reflecting lower default probability, lower market concern, higher company value, and lower shareholder incentive to dramatically increase company risk in order to increase valuation.
Despite the limited number of modern mandatory convertible bonds issued since 2010 and the reduced dataset, the empirical results seem to partially confirm our hypothesis and some of the theories produced by other researchers about mandatory convertible bonds. First, after the issuance, companies can invest in new ventures and riskier projects and the market will not perceive a higher risk of bankruptcy. Companies’ balance sheets are perceived as more sustainable. The equity base remains similar, and the dilution for old shareholders will only materialize at maturity if the stock price reaches the upper conversion ratio. Mandatory convertible bonds are equity instruments that do not have a fixed claim on the assets of the company, just a fixed coupon; therefore, the increase in shareholders’ value occurs at the expense of mandatory convertible bonds holders, not of debt holders. For companies close to distress, the agency problem can be mitigated by the issuance of mandatory convertible bonds since the investment in riskier projects will be beneficial for shareholders and will not be detrimental for debt holders. The results seem to show that MCBs not only enhance the value but also strengthen the sustainability of the firm. Second, in our sample before the issuance, the extrinsic information influenced the company volatility. Once firms have issued mandatory convertible bonds, the asymmetry of information becomes more important and intrinsic value weighs more in the perceived volatility of the company. Finally, at higher company values, mandatory convertible bonds behave like standard convertible bonds, and shareholders seem to have lower incentives to increase risk.
This study contributes to the existing financial sustainability literature by opening a discussion about alternative methods that can be used to mitigate the agency problem, complementary to the traditional corporate governance policies and management compensation programs. As a policy implication, our results indicate that the issuance of a hybrid balance sheet instrument like MCBs can, in certain situations, improve the company valuation, reduce the agency costs, and help in the long-term sustainability of the firm. Additionally, after the issuance of MCBs, the financial robustness of the firm increases since company leverage decreases. Companies can invest in innovative riskier projects, shareholders and debt holders share the new risks with MCBs investors, and the asymmetry of information plays a more important role in company valuation than the company risk perception.
In summary, the results of our empirical analyses suggest that some balance sheet instruments, like mandatory convertible bonds, can potentially align the incentives of the different actors in the firm’s management, reducing the agency problem, increasing the efficiency, increasing sustainability of companies, and promoting the investment in innovative projects without impacting long term economic sustainability.
Author Contributions
Conceptualization, A.H. and C.R.-M.; Data Curation, A.H.; Formal Analysis, A.H.; Investigation, A.H.; Supervision, A.H. and C.R.-M.; Writing—Original Draft, A.H. and C.R.-M.; Writing—Review and Editing, A.H. and C.R.-M.
Funding
This research has received no external funding.
Conflicts of Interest
The authors declare no conflict of interest.
Appendix A
Table A1.
MCB dataset used for the study. Source: Bloomberg.
Table A1.
MCB dataset used for the study. Source: Bloomberg.
| Issuer | MCN Description | Issue Date | Issuer | MCN Description | Issue Date |
|---|---|---|---|---|---|
| Axa | AXASA 7.25 05/15/21 | 09/05/2018 | Southwestern Energy | SWN 6.25 07/15/18 | 15/01/2015 |
| Sempra Energy SER US | SER 6 01/15/21 | 05/01/2018 | T Mobile US | TMUS 5.5 12/15/17 | 12/10/2014 |
| Vistra Energy Corp | VST 7 07/01/19 | 04/04/2018 | Kindred Healthcare | KND 7.5 12/01/17 | 19/11/2014 |
| BUMI | BUMIIJ 6 12/11/24 | 20/09/2017 | William Lyon Homes | WLH 6.5 12/01/17 | 18/11/2014 |
| Volcan Hlngs on Anglo American | VLCHLD 3.875 10/10/20 | 20/09/2017 | McDermott Intl | MDR 6.25 04/01/17 | 04/01/2014 |
| Crown Castle | CCI 6.875 08/01/20 | 21/07/2017 | Post Holdings | POST 5.25 06/01/17 | 22/05/2014 |
| Stanley Black & Decker | SWK 5.375 05/15/20 | 12/05/2017 | Telefonica | TELEFO 4.9 09/25/17 | 11/09/2014 |
| Becton Dickinson | BDX 6.125 05/01/20 | 11/05/2017 | Tyson Foods | TSN 4.75 07/15/17 | 30/07/2014 |
| Golden Close Maritime | GOLDCL 0 03/29/22 | 29/03/2017 | Telefonica on TIM | TELEFO 6 07/24/2017 | 17/07/2014 |
| Volcan Hlngs on Anglo American | VLCHLD 4.125 4/11/20 | 15/03/2017 | Stanley Black & Decker | SWK 6.25 11/17/16 | 26/11/2013 |
| Hochdorf | HOCNS·3.5 03/30/20 | 14/03/2017 | Telecom Italia TIM | TITIM 6.125 11/15/16 | 07/11/2013 |
| Virtus Investments Partners | VRTS 7.25 02/01/20 | 27/02/2017 | Crown Castle | CCI 4.5% 11/01/16 | 22/10/2013 |
| Parker Drilling | PKD 7.25 03/31/20 | 22/02/2017 | Banco Sabadell | SABSM 5 10/28/17 | 03/10/2013 |
| Unicredit | UCGIM 0 12/15/19 | 08/12/2016 | Maiden Holding | MHLD 7.25 09/15/16 | 26/09/2013 |
| Rexnord Corp | RXN 5.75 11/15/19 | 01/12/2016 | Nextera | NEE 5.799 09/01/16 | 20/09/2013 |
| Envision Healthcare | EVHC 5.25 07/01/17 | 28/11/2016 | Adler Real Estate | ADLERR 6 06/30/17 | 01/07/2013 |
| Bayer | BAYNGR 5.625 11/22/19 | 16/11/2016 | Intelsat | I 5.75 05/01/16 | 18/04/2013 |
| DTE Energy | DTE 6.5 10/01/19 | 29/09/2016 | Arcelor Mittal | MTNA 6 01/15/16 | 09/01/2013 |
| Great Plains | EVRG 7 09/15/19 | 27/09/2016 | Volkswagen | VW 5.5 11/09/15 | 05/11/2012 |
| Dominion Energy | D 6.75 08/15/19 | 10/08/2016 | Genesee Wyoming | GWR 5 10/01/15 | 13/09/2012 |
| Rayonier Adv Materials | RYAM 8 08/15/19 | 05/08/2016 | Nextera | NEE 5.889 09/01/15 | 06/09/2012 |
| Nextera Energy | NEE 6.123 09/01/19 | 02/08/2016 | Beazer Homes | BZH 7.5 07/15/15 | 11/07/2012 |
| Belden | BDC 6.75 07/15/19 | 21/07/2016 | United Techno | UTX 7.5 08/01/15 | 13/06/2012 |
| Dynegy | DYN 7 07/01/19 | 16/06/2016 | Nextera | NEE 5.599 06/01/15 | 01/05/2012 |
| MTS Systems | MTSC 8.75 07/01/19 | 10/06/2016 | Hochdorf | HOCNS· 3 05/30/16 | 26/05/2011 |
| Mand Exchang Trust on BABA | METUSA 5.75 06/01/19 | 02/06/2016 | PPL Corporation | PPL 8.75 05/01/14 | 11/04/2011 |
| Vodafone | VOD 2 02/25/19 | 19/02/2016 | Goodyear Tire & Rubber | GT 5.875 04/01/14 | 29/03/2011 |
| Vodafone | VOD 1.5 08/25/17 | 19/02/2016 | Metlife | MET 5 10/08/14 | 03/03/2011 |
| Hess Corporation | HES 8 02/01/19 | 04/02/2016 | Unisys Corp | UIS 6.25 03/01/14 | 22/02/2011 |
| Uniti Group | UNIT 3 05/01/24 | 07/01/2016 | molycorp | MCP 5.5 03/01/14 | 11/02/2011 |
| Teva | TEVA 7 12/15/18 | 03/12/2015 | Hovnanian | HOV 7.25 02/15/14 | 03/02/2011 |
| Black Hills | BKH 7.75 11/01/18 | 18/11/2015 | Nielsen Holdings | NLSN 6.25 02/01/13 | 21/01/2011 |
| Stericycle | SRCL 5.25 09/15/18 | 10/09/2015 | Cemex | CEMEX 10 11/28/19 | 12/11/2009 |
| Nextera | NEE 6.371 09/01/18 | 11/09/2015 | Banco Popular | POPSM 7 11/25/15 | 25/05/2012 |
| WPX Energy | WPX 6.25% 07/31/18 | 16/07/2015 | Caixabank | CABKSM 7 06/30/15 | 19/05/2011 |
| Frontier Communications | FTR 11.125 06/29/18 | 05/06/2015 | Bankinter | BKTSM 7 05/11/14 | 16/03/2011 |
| Anadarko Apc | APC 7.5 06/07/18 | 04/06/2015 | Cliffs Natural Resources | CLF 7 02/01/16 | 14/02/2011 |
| America Movil on KPN | AMXLMM 5.5 09/17/18 | 20/05/2015 | Nextera Energy | NEE 7 09/01/13 | 15/09/2011 |
| Anthem INC | ANTM 5.25 05/01/18 | 05/05/2015 | Apache Corporation | APA 6 08/01/13 | 22/07/2010 |
| American Tower | AMT 5.5 02/15/18 | 25/02/2015 | PPL Corporation | PPL 9.5 07/01/13 | 23/06/2010 |
| Allergan | AGN 5.5 03/01/18 | 25/02/2015 |
References
- Hart, O. Corporate Governance: Some Theory and Implications. Econ. J. 1995, 105, 678. [Google Scholar] [CrossRef]
- Jensen, M.C.; Meckling, W.H. Theory of the firm: Managerial behavior, agency costs and ownership structure. J. Financ. Econ. 1976, 3, 305–360. [Google Scholar] [CrossRef]
- Green, R.C. Investment Incentives, Debt and Warrants. J. Financ. Econ. 1984, 13, 115–136. [Google Scholar] [CrossRef]
- Kanagaretnam, K.; Lobo, G.J.; Whalen, D.J. Does good corporate governance reduce information asymmetry around quarterly earnings announcements? J. Account. Public Policy 2007, 26, 497–522. [Google Scholar] [CrossRef]
- Lee, J.; Park, J.-H.; Hyeon, J. Co-CEOs and Asymmetric Cost Behavior. Sustainability 2019, 11, 1046. [Google Scholar] [CrossRef]
- Lee, S.C.; Rhee, M.; Yoon, J. Foreign Monitoring and Audit Quality: Evidence from Korea. Sustainability 2018, 10, 3151. [Google Scholar] [CrossRef]
- Murphy, K. Executive Compensation. In Handbook of Labor Economics; Ashenfelter, O., Card, D., Eds.; Elsevier: Amsterdam, The Netherlands, 1999; pp. 2485–2563. [Google Scholar]
- Core, J.; Guay, W.; Larker, D. Executive Equity Compensation and Incentives: A Survey. Econ. Policy Rev. 2003, 9, 1. [Google Scholar] [CrossRef]
- Jensen, M.C.; Murphy, K.J. Performance Pay and Top-Management Incentives. J. Political Econ. 1990, 98, 225–264. [Google Scholar] [CrossRef]
- Myers, S. Determinants of Corporate Borrowing. J. Financ. Econ. 1977, 5, 147–175. [Google Scholar] [CrossRef]
- Dorion, C.; Francois, P.; Grass, G.; Jeanneret, A. Convertible debt and shareholder incentives. J. Corp. Financ. 2014, 24, 38–56. [Google Scholar] [CrossRef]
- Smith, C.; Warner, J. On financial contracting: An analysis of bond covenants. J. Financ. Econ. 1979, 7, 117–161. [Google Scholar] [CrossRef]
- De Jong, A.; Van Dijk, R. Determinants of Leverage and Agency Problems: A Regression Approach with Survey Data. Eur. J. Financ. 2007, 13, 565–593. [Google Scholar] [CrossRef]
- Eisdorfer, A. Empirical Evidence of Risk Shifting in Financially Distressed Firms. J. Finance 2008, 63, 609–637. [Google Scholar] [CrossRef]
- Hennessy, C.A.; Tserlukevich, Y. Taxation, Agency Conflicts, and the Choice Between Callable and Convertible Debt. J. Econ. Theory 2008, 143, 374–404. [Google Scholar] [CrossRef]
- Miller, M.H.; Modigliani, F. Dividend Policy, Growth, and the Valuation of Shares. J. Bus. 1961, 34, 411. [Google Scholar] [CrossRef]
- Dutordoir, M.; Lewis, C.; Seward, J.; Veld, C. What we do and do not know about convertible bond financing. J. Corp. Financ. 2014, 24, 3–20. [Google Scholar] [CrossRef]
- Lewis, C.M.; Rogalski, R.J.; Seward, J.K. Agency Problems, Information Asymmetries, and Convertible Debt Security Design. J. Financ. Intermed. 1998, 7, 32–59. [Google Scholar] [CrossRef]
- Stein, J. Convertible Bonds as a Backdoor Equity Financing. J. Financ. Econ. 1992, 32, 3–21. [Google Scholar] [CrossRef]
- Arzac, E.R. Percs, Decs, and Other Mandatory Convertibles. J. Appl. Corp. Financ. 1997, 10, 54–63. [Google Scholar] [CrossRef]
- Huerga, A.; Rodríguez-Monroy, C. Mandatory Convertible Notes as a Sustainable Corporate Finance Instrument. Sustainability 2019, 11, 897. [Google Scholar] [CrossRef]
- Chemmanur, T.; Nandy, D.; Yan, A.; Jiao, J. A Theory of Mandatory Convertibles. J. Bank. Finance 2014, 42, 352–370. [Google Scholar] [CrossRef]
- Weng, S. A Theory of Mandatory Convertibles: Distinct Features for Large Repeated Financing. Eur. J. Financ. 2018, 24, 347–362. [Google Scholar] [CrossRef]
- Coase, R.H. The Nature of the Firm. Economica 1937, 4, 386–405. [Google Scholar] [CrossRef]
- Klein, B.; Crawford, R.; Alchian, A. Vertical Integration, Appropriable Rents and the Competitive Contracting Process. J. Law Econ. 1978, 21, 297–326. [Google Scholar] [CrossRef]
- Grossman, S.J.; Hart, O.D. The Costs and Benefits of Ownership: A Theory of Vertical and Lateral Integration. J. Politi-Econ. 1986, 94, 691–719. [Google Scholar] [CrossRef]
- Bharath, S.T.; Shumway, T. Forecasting Default with the Merton Distance to Default Model. Rev. Financ. Stud. 2008, 21, 1339–1369. [Google Scholar] [CrossRef]
- Gillet, R.; De La Bruslerie, H. The Consequences of Issuing Convertible Bonds: Dilution and/or Financial Restructuring? Eur. Financ. Manag. 2010, 16, 552–584. [Google Scholar] [CrossRef]
- Dutordoir, M.; Van De Gucht, L. Why Do Western European Firms Issue Convertibles Instead of Straight Debt or Equity? Eur. Financ. Manag. 2009, 15, 563–583. [Google Scholar] [CrossRef]
- Black, F.; Scholes, M. The Pricing of Options and Corporate Liabilities. J. Political Econ. 1973, 81, 637–654. [Google Scholar] [CrossRef]
- Merton, R. Theory of Rational Option Pricing. Bell J. Econ. Manag. Sci. 1973, 4, 141–183. [Google Scholar] [CrossRef]
- Lewis, C.M.; Verwijmeren, P. Convertible security design and contract innovation. J. Corp. Financ. 2011, 17, 809–831. [Google Scholar] [CrossRef]
- Abdallah, W.; Goergen, M.; O’Sullivan, N. Endogeneity: How Failuer to Correct for it can Cause Wrong Inferences and Some Remedies. Br. J. Manag. 2015, 26, 791–804. [Google Scholar] [CrossRef]
- Badía, G.; Pina, V.; Torres, L. Financial Performance of Government Bond Portfolios Based on Environmental, Social and Governance Criteria. Sustainability 2019, 11, 2514. [Google Scholar] [CrossRef]


© 2019 by the authors. Licensee MDPI, Basel, Switzerland. This article is an open access article distributed under the terms and conditions of the Creative Commons Attribution (CC BY) license (http://creativecommons.org/licenses/by/4.0/).