Article

“Seeing” or “Being Seen”: Research on the Sight Line Design in the Lion Grove Based on Visitor Temporal–Spatial Distribution and Space Syntax

1
College of Landscape Architecture, Nanjing Forestry University, Nanjing 210037, China
2
Centre of Co-Innovation for Sustainable Forestry in Southern China, Nanjing Forestry University, Nanjing 210037, China
*
Author to whom correspondence should be addressed.
Sustainability 2019, 11(16), 4348; https://doi.org/10.3390/su11164348
Submission received: 11 June 2019 / Revised: 6 August 2019 / Accepted: 7 August 2019 / Published: 12 August 2019
(This article belongs to the Section Tourism, Culture, and Heritage)

Abstract

:
Research on the sight line design of the Classical Chinese Garden (CCG) is an important issue of CCGs’ sustainable development. Taking the Lion Grove as a case, GPS data loggers and questionnaires were employed to collect visitor temporal–spatial data and visiting motivations. We then calculated the “Revisiting Proportion” and “Average Speed” values. Furthermore, we selected the “Visual Control” values analyzed by Depthmap as an indicator of visibility. The statistical analysis of the relationship among “Revisiting Proportion”, “Average Speed”, and “Visual Control” values of each space showed that the spatial visual characteristic affected the visitor temporal–spatial distribution. Scenery spots in and around the large water pool, within one-step visual depth of each other, occupying the visual advantage of both “seeing” and “being seen”, can facilitate the transformation of sight lines and form the visual effect of “one step, one scene”. This research also proved that the sight line design of the Lion Grove was more intentional than random.

1. Introduction

After the mid-Ming Dynasty (around the 16th century), the size of private gardens in the urban area of Suzhou was shrinking [1]. In the Qing Dynasty (1616–1911), one of the main gardening challenges in Suzhou was to create as rich as possible spatial visual hierarchy on limited land [2]. Here, the design of the spatial layout and the visual effects were important. We often use “one step, one scene” as a summary of the visual experience in Chinese Classical Gardens (CCGs) to emphasize the picturesque visual effects in the ever-changing viewing [3]. For a long time, the visual characteristic analysis of CCGs remained at the level of qualitative description [4,5,6]. In recent years, scholars have tried to employ quantitative methods. Some founded the landscape visual quality evaluation model based on the perspective of psychology and phenomenology [7]. This model can be divided into the presence or absence of landscape elements [8] and the components of the visual image based on psychological feelings [9]. Others quantified the space itself, using ArcGIS or space syntax to analyze and calculate spatial visual characteristics [10,11,12,13]. The application of space syntax in CCGs, besides exploring spatial structure and visual characteristics [14,15], can also study the social and historical laws implied by the spatial structure and the relationship between visitor behavior and space characteristics [16,17]; however, relevant research on the latter is little at present.
Researchers used GPS trajectories, real-time observations, or questionnaires to collect visitor temporal–spatial behavior data [18,19,20,21] and then analyzed visiting preferences [22], route selections [23,24], and the trajectory visualization model [25]. Results demonstrated that the GPS track recorder has higher accuracy, which can save manpower and help avoid deviations caused by the decline in memory of visitors and subjective impressions, compared with real-time observations and questionnaires [26]. Studying visitor temporal–spatial behavior is conducive to tourism management; more specifically, it prevents overcrowding, optimizing the signages and understanding of the satisfaction of visitors [27,28]. Previous studies analyzed the correlation between GPS trajectory data and demographic information to distinguish the touring preferences of different participant types [29,30,31]. However, there are few research studies on the relationship between visitor temporal–spatial behavior and spatial characteristics.
Researchers can study the correlation between the spatial complexity of CCGs and human’s behavior by combining spatial characteristic values analyzed by Depthmap with visitor behavioral and cognitive data [14]. By converting GPS trajectories into point data and then using the kernel density analysis of ArcGIS, researchers could find the correlation between the tourist distribution and the classifications of garden nodes [32]. The significant correlations between visitor temporal–spatial behavior data and the visual characteristic values of Visible Layer in Depthmap indicate that the visibility of garden elements is more effective in guiding visitors compared to the layout of the tour route [33,34]. Previous studies showed that the exhibition of a certain space can affect the visiting speed of tourists [18,35] while the moving and staying variables of urban walking tourists differ by season [36]; yet, research on how visual factors affect visiting behavior is rare.
How is the visual effect of “one step, one scene” presented by the garden layout or spatial structure? How does the spatial structure of CCGs influence visitor behavior? Combining the sight line design with visitor temporal–spatial behavior data in a certain garden can answer the above questions [37]. With many famous CCGs being open to the public as tourist attractions and the development of the tourism industry, increased numbers of tourists exerted pressure on their environmental capacity, destroyed historic landmarks and sites, and reduced the satisfaction of visitors [38,39]. CCGs are irreplaceable cultural heritage; therefore, studies on tourist distribution and its influencing factors are much-needed and contribute to adjusting the numbers of tourists, preventing overcrowding in popular areas, and optimizing signage design to guide tourists to the less popular areas. [40,41].
Based on the visitor temporal–spatial behavior data of the Lion Grove (狮子林), and combining these with visual analysis of the space syntax, we explored how the spatial layout and the sight line design of CCGs influence visitor temporal–spatial distribution. This research will help improve understanding of the design law of CCGs, and the results can be a reference for the garden management department to avoid overcrowding in the popular areas during peak seasons and promote sustainability of historic sites.

2. Materials and Methods

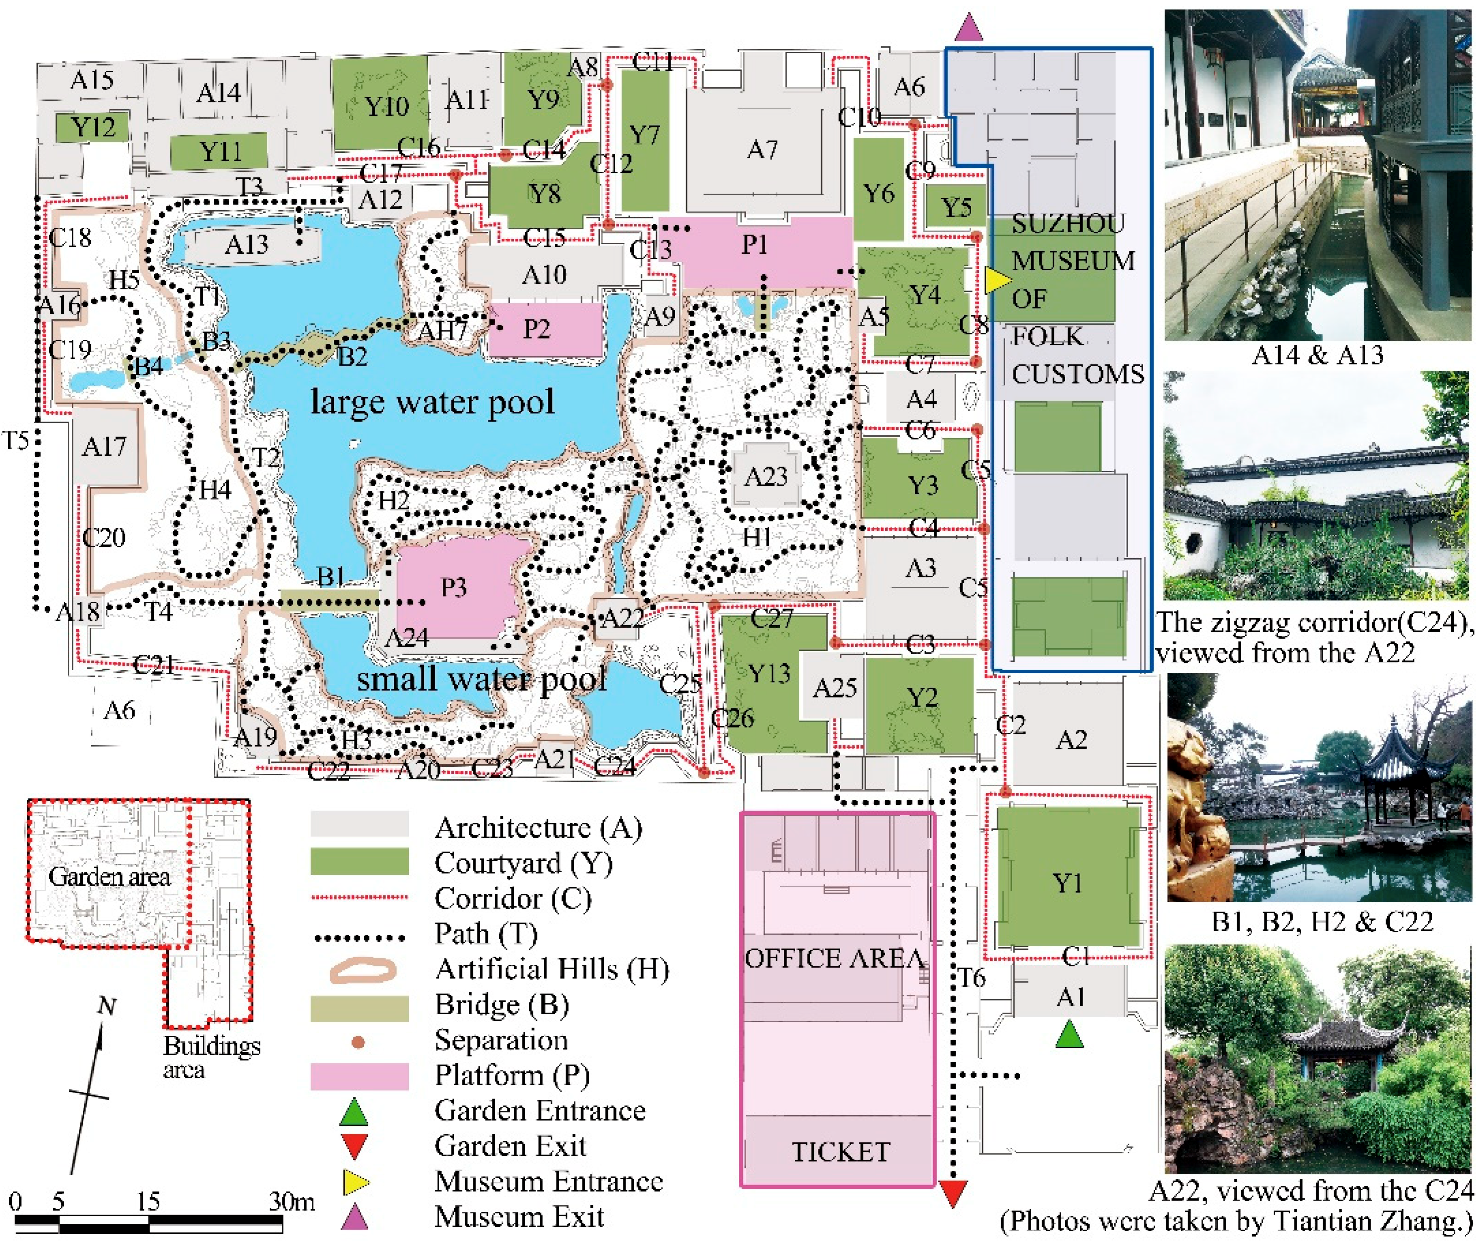
2.1. Description of the Case Study

Today, many famous Suzhou Private Gardens (SPGs) are public as scenic spots. In the Ming and Qing Dynasties, there were also many SPGs being opened to the public chronically or periodically, particularly, the Lingering Garden (留园), as described in Xiang Chan Ri Ji (香禅日记) of Pan Zhongrui (潘钟瑞), a literary giant in Qing dynasty: “Today, the Lingering Garden was far more crowded than ever, we couldn’t find any place to sit down.” (园中游人如涌, 更甚于前日, 各处兜抄, 竟无空地可坐). In the Ming and Qing Dynasties, people in Suzhou enjoyed visiting gardens [42]. According to the description of Yuan Xuelan (袁学澜) in Records of Famous Suzhou Gardens (吴下名园记), at the touring season, the numbers of visitors in certain SPGs were huge, such as the Lingering Garden, the Humble Administrator’s Garden (拙政园), the Lion Grove, and the Canglang Pavilion (沧浪亭) [43].
The Lion Grove was built at the end of the Yuan Dynasty in Suzhou, China. After several reconstructions and renovations in the Ming and Qing Dynasties, at present, it covers an area of 1.4 ha, including 0.88 ha open to the public [44]. The garden area is on the west side of the building area, centered on a large water pool and countless Taihu Stone rockeries and surrounded by pavilions, verandas with windows, and corridors. It has a compact layout and a complex three-dimensional space, with most typical SPG elements of the Qing Dynasty. Lion Grove is one of the most famous CCGs and one of the top three most popular scenic spots in Suzhou. The Bei family began to rebuild it in 1917, and it took them seven years to complete it. At the beginning of the design and construction, the Bei family considered a vast amount of people would visit the garden after they opened it to the public. Because of the war, the plan to open the garden was shelved [45]. Hence, it is reasonable to use modern technologies to analyze the relationship between visitor temporal–spatial behavior and the sight line design in SPGs.

2.2. Survey Method

The survey was conducted from 26 April 2018 to 23 May 2018, during which time the weather was either sunny or cloudy, without rainy days or high wind, with an average temperature of 27.35 °C (SD 3.58), a relatively comfortable weather for touring [46]. As the survey period did not include any major holidays and was off-season for tourists, the average number of daily visitors was stable at 3981.19 (SD 646.67), according to information from the Lion Grove management office.
Lion Grove has a large area of climbable rockeries, so elderly people and visitors with babies were not enrolled as study subjects. Between 9:00 and 16:00, at the ticket office, we randomly asked young and middle-aged visitors without babies for their consent to survey participation. We asked visitors who volunteered to take part in the survey to carry a handheld GPS data logger (Victor Technology Co., Ltd., Shenzhen, China) which provided a 2.5-m accuracy for 95% of all points with differential correction and a log interval of 1 s. Participants returned to the ticket office to complete their questionnaires as soon as they exited the garden.

3. Data Processing and Results

3.1. Basic Information of Participants

A total of 404 GPS trajectories were obtained, of which 353 trajectories without data loss, disconnection, excessive accuracy deviation, or overall drift were used for further analysis. Statistics results of the corresponding 353 questionnaires are shown in Table 1.
Participants were mainly young people with a balanced gender ratio. Most of them came to the Lion Grove for the first time without a specific purpose. Beautiful scenery was the first satisfaction factor over others, while overcrowding and poor signage were the main reasons for an unsatisfactory touring experience.

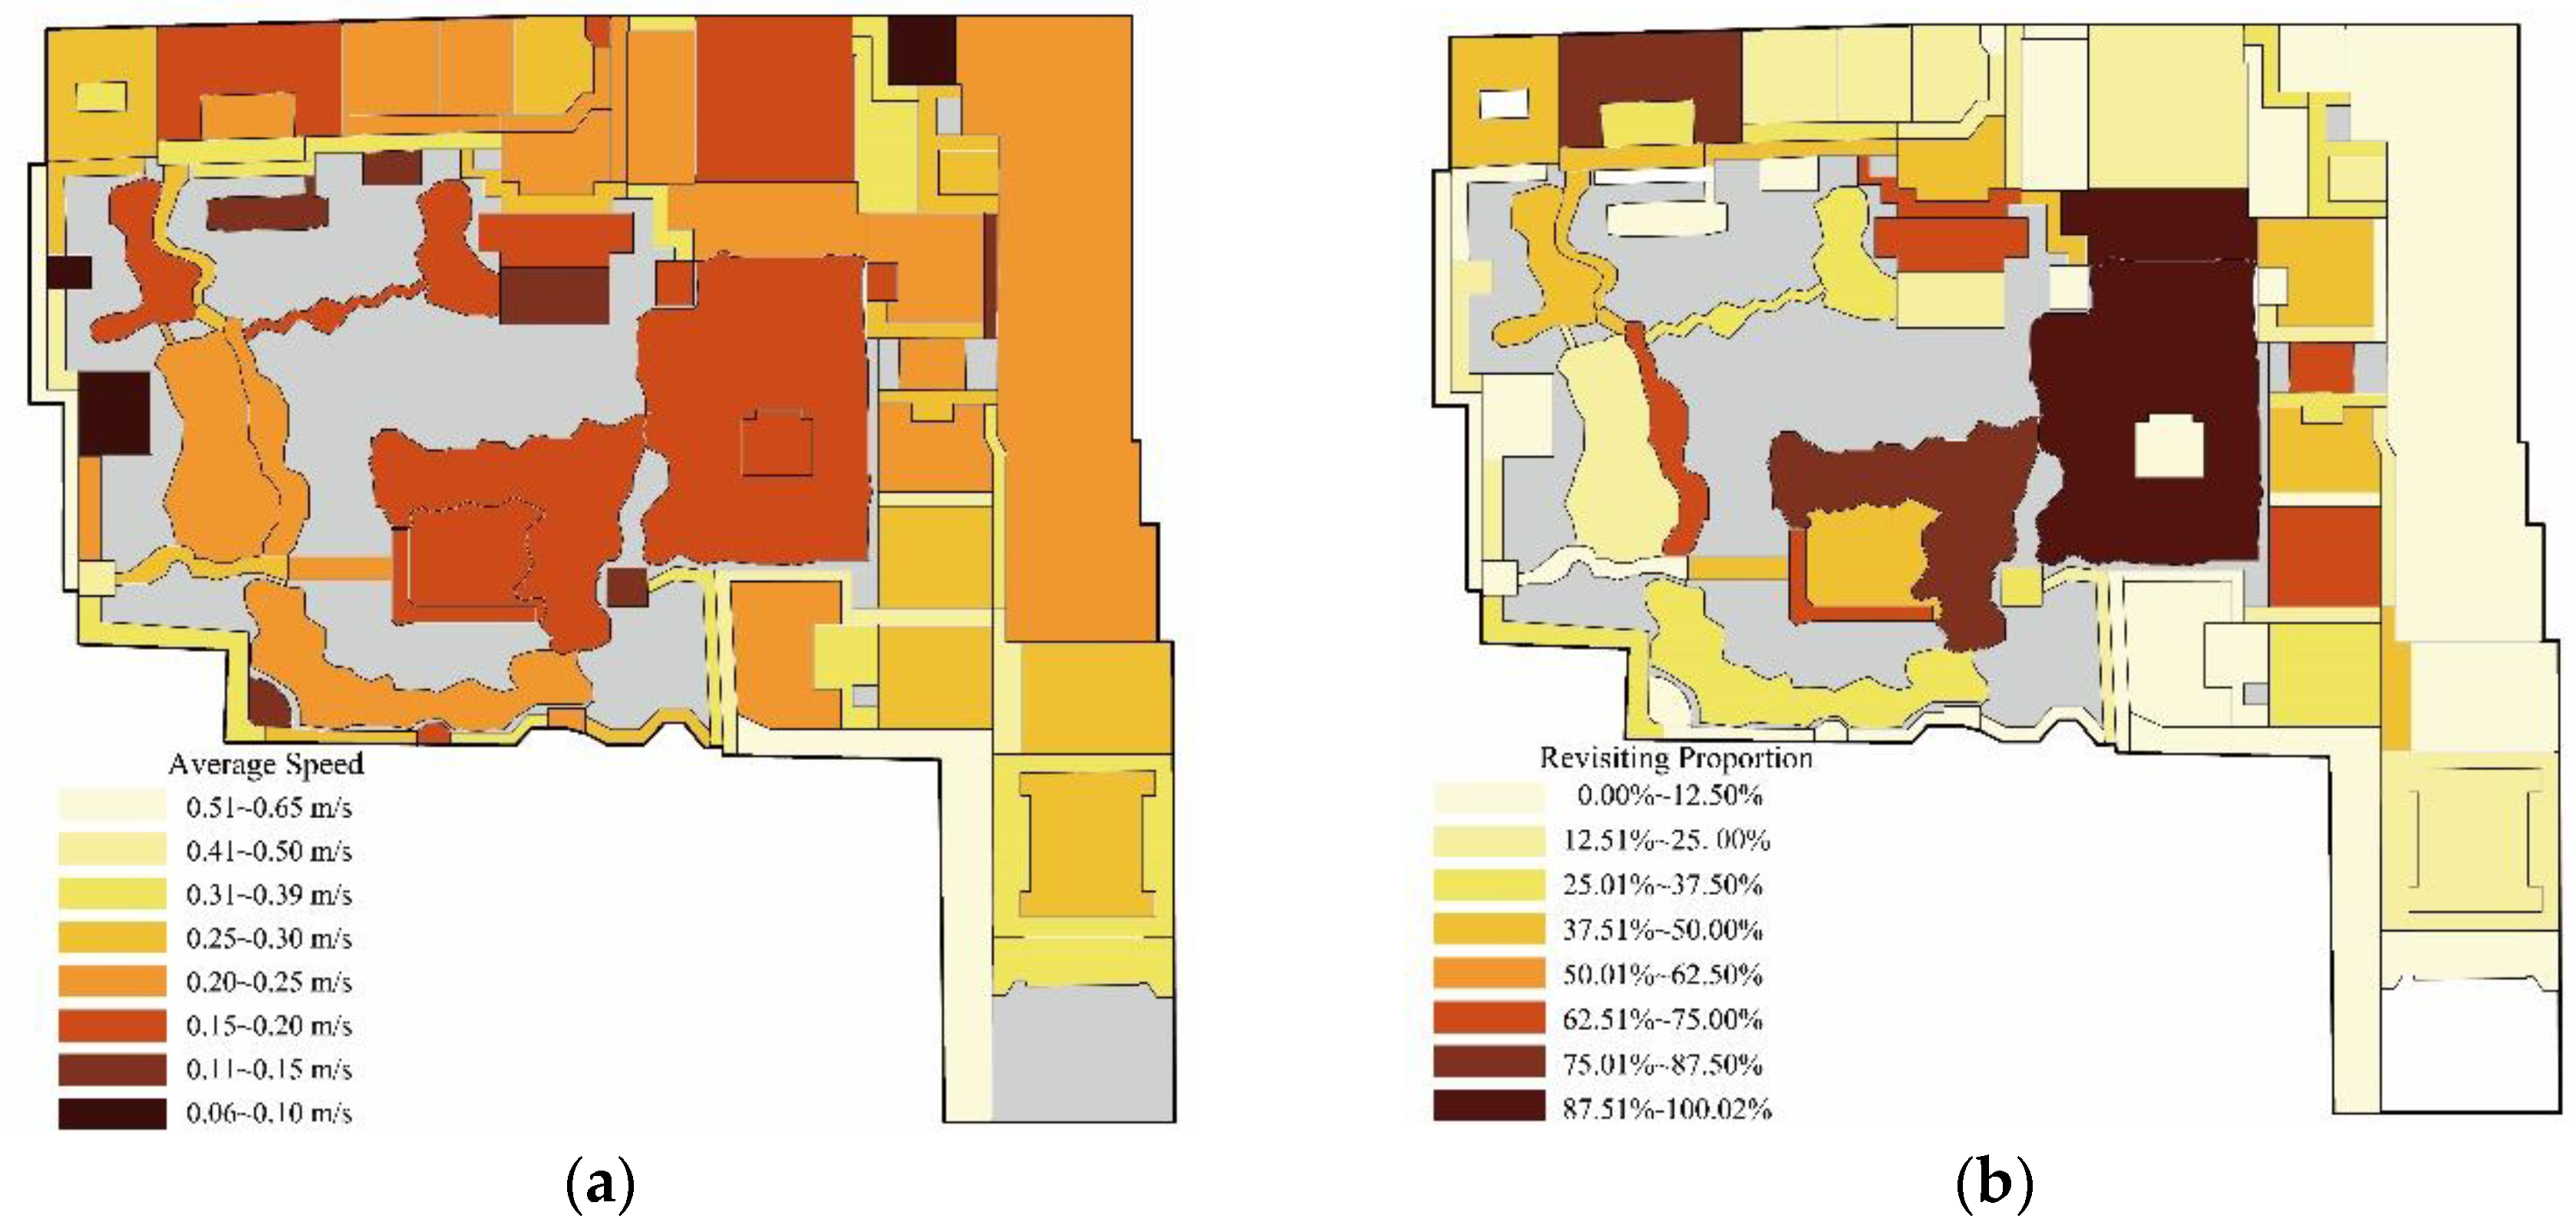
3.2. Preliminary Analysis of the Visitor Temporal–Spatial behavior Data

We divided the layout of the Lion Grove into 85 spaces according to different gardening element types (Figure 1), then calculated the length of stay, the number of visiting times, and the visiting distance generated by every trajectory in each space, respectively, and obtained the Average Speed and Revisiting Proportion values, as indicators reflecting the attraction of a certain space [47,48]. The Revisiting Proportion value of a certain space is equal to the ratio of the number of people who visited the space a second time to the number of people visiting the space for the first time. Figure 2 shows the results of the Average Speed and the Revisiting Proportion values.

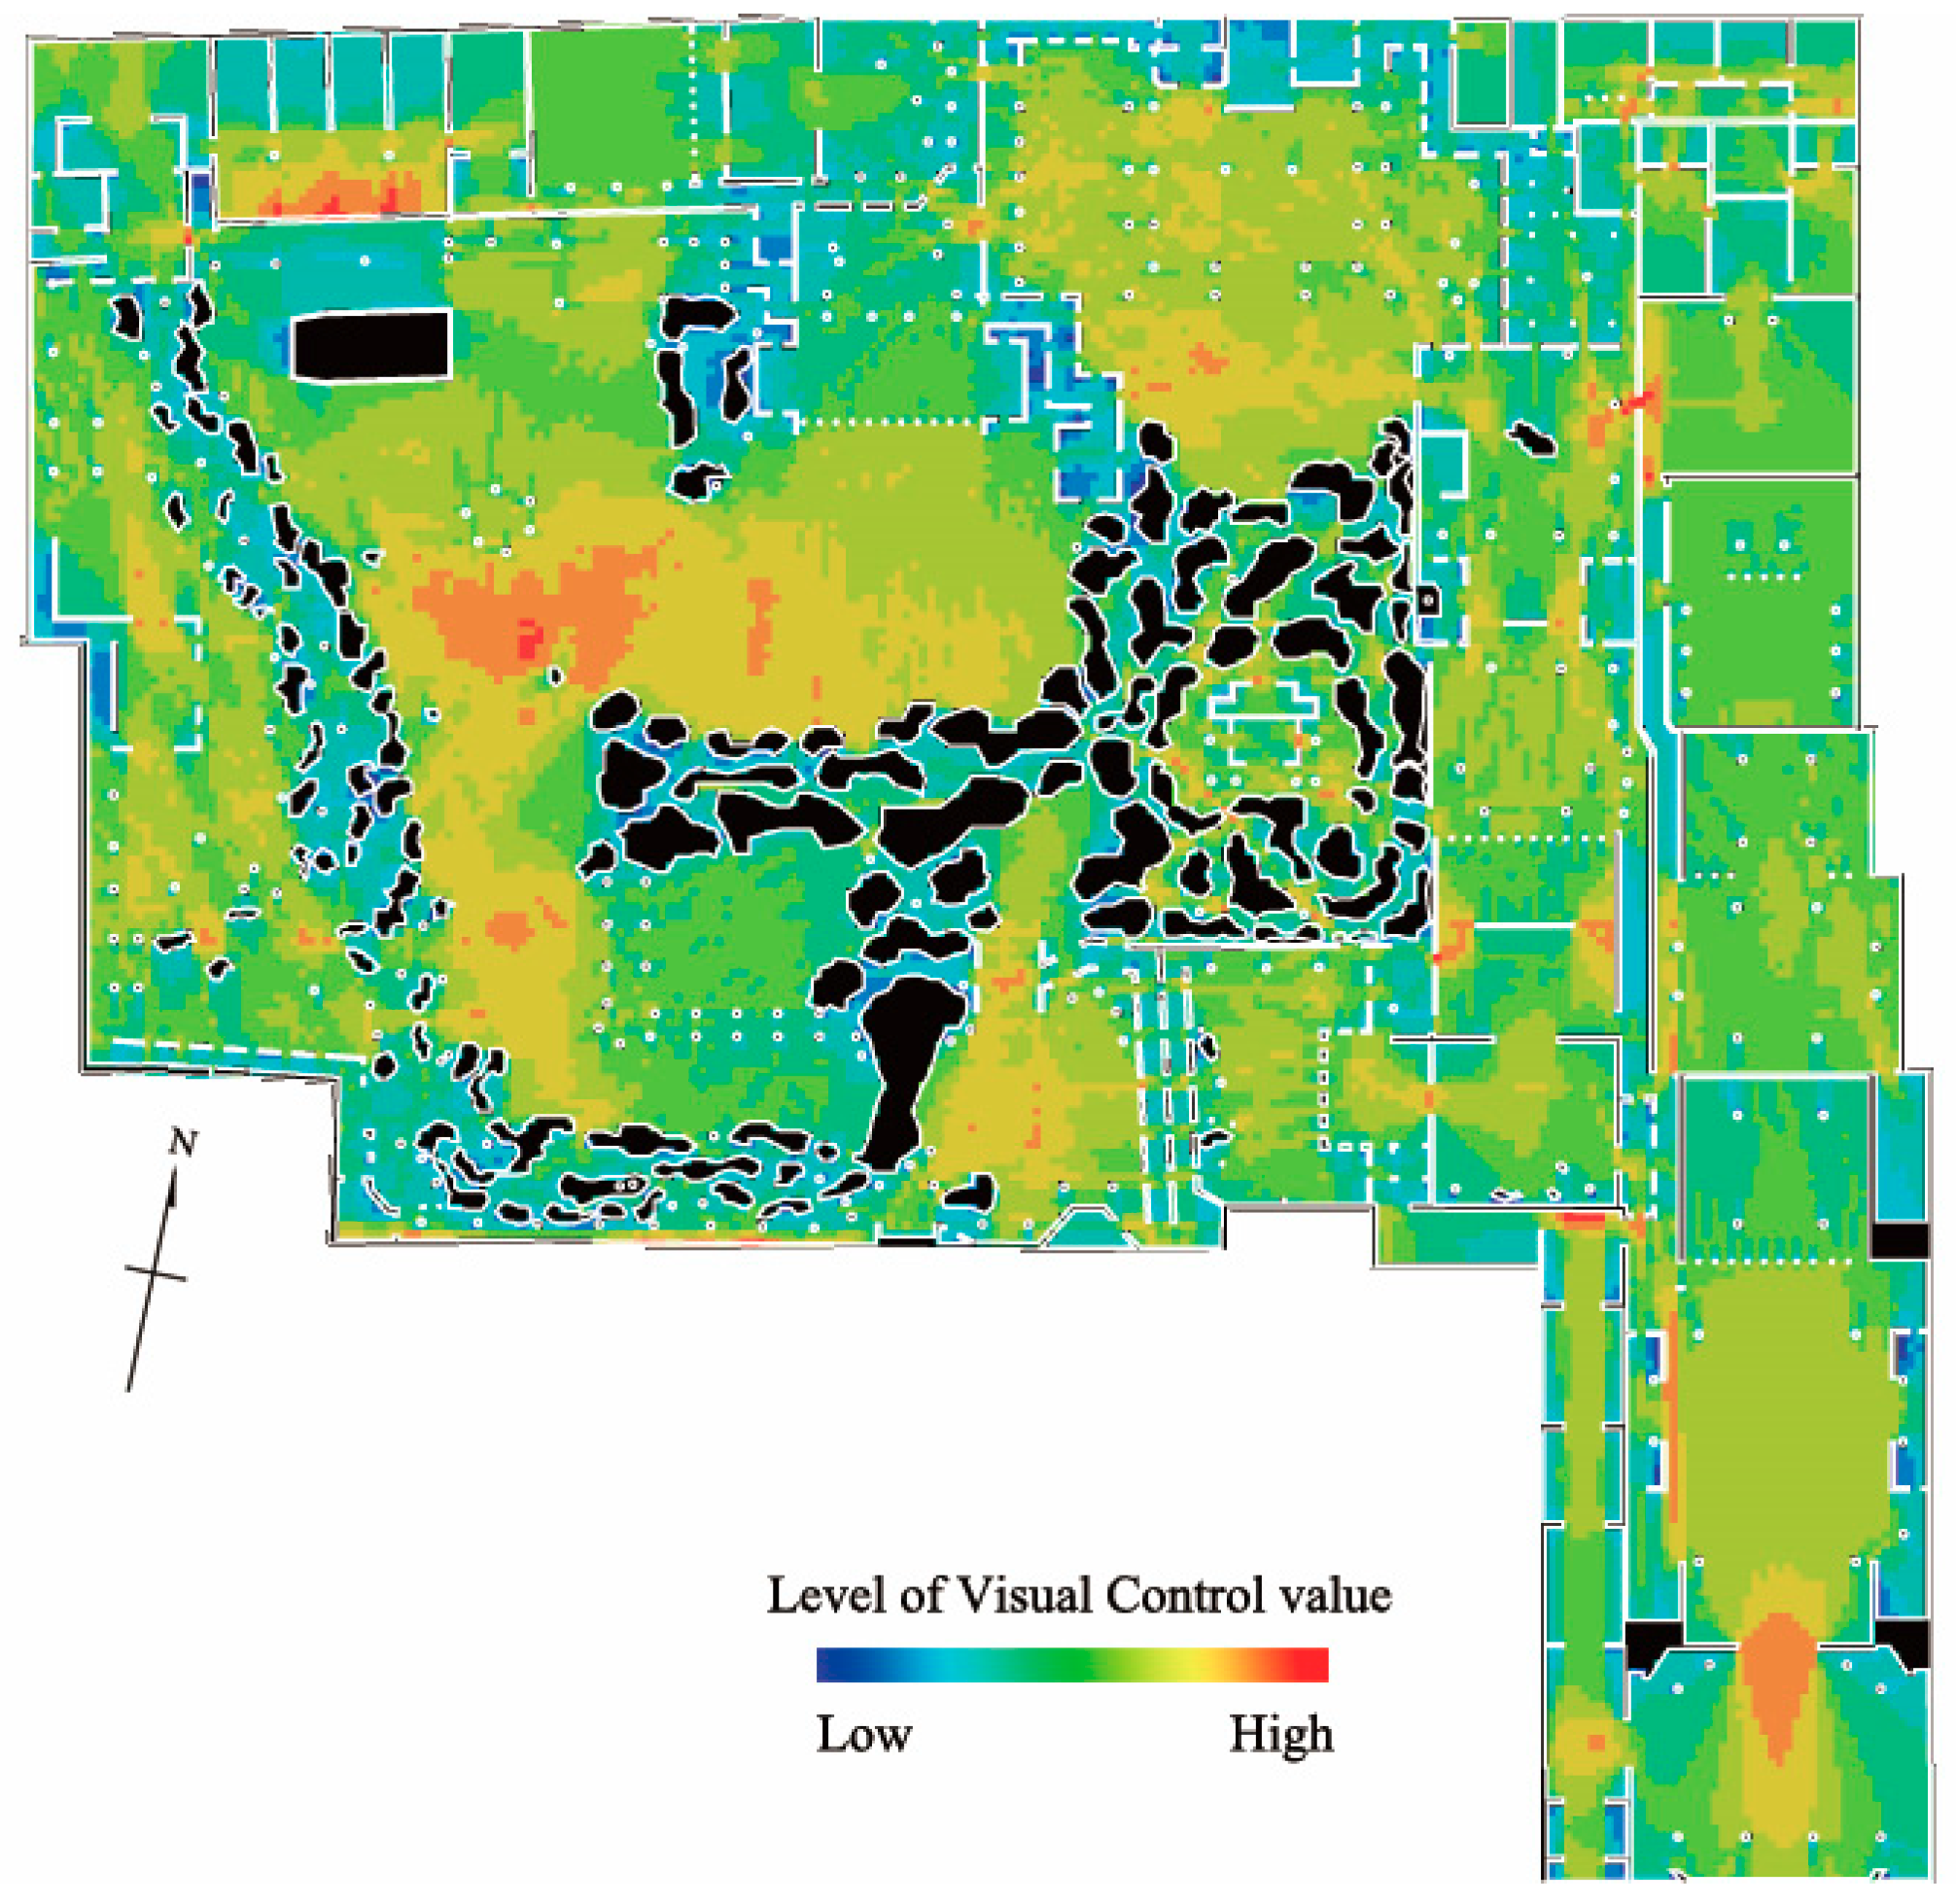
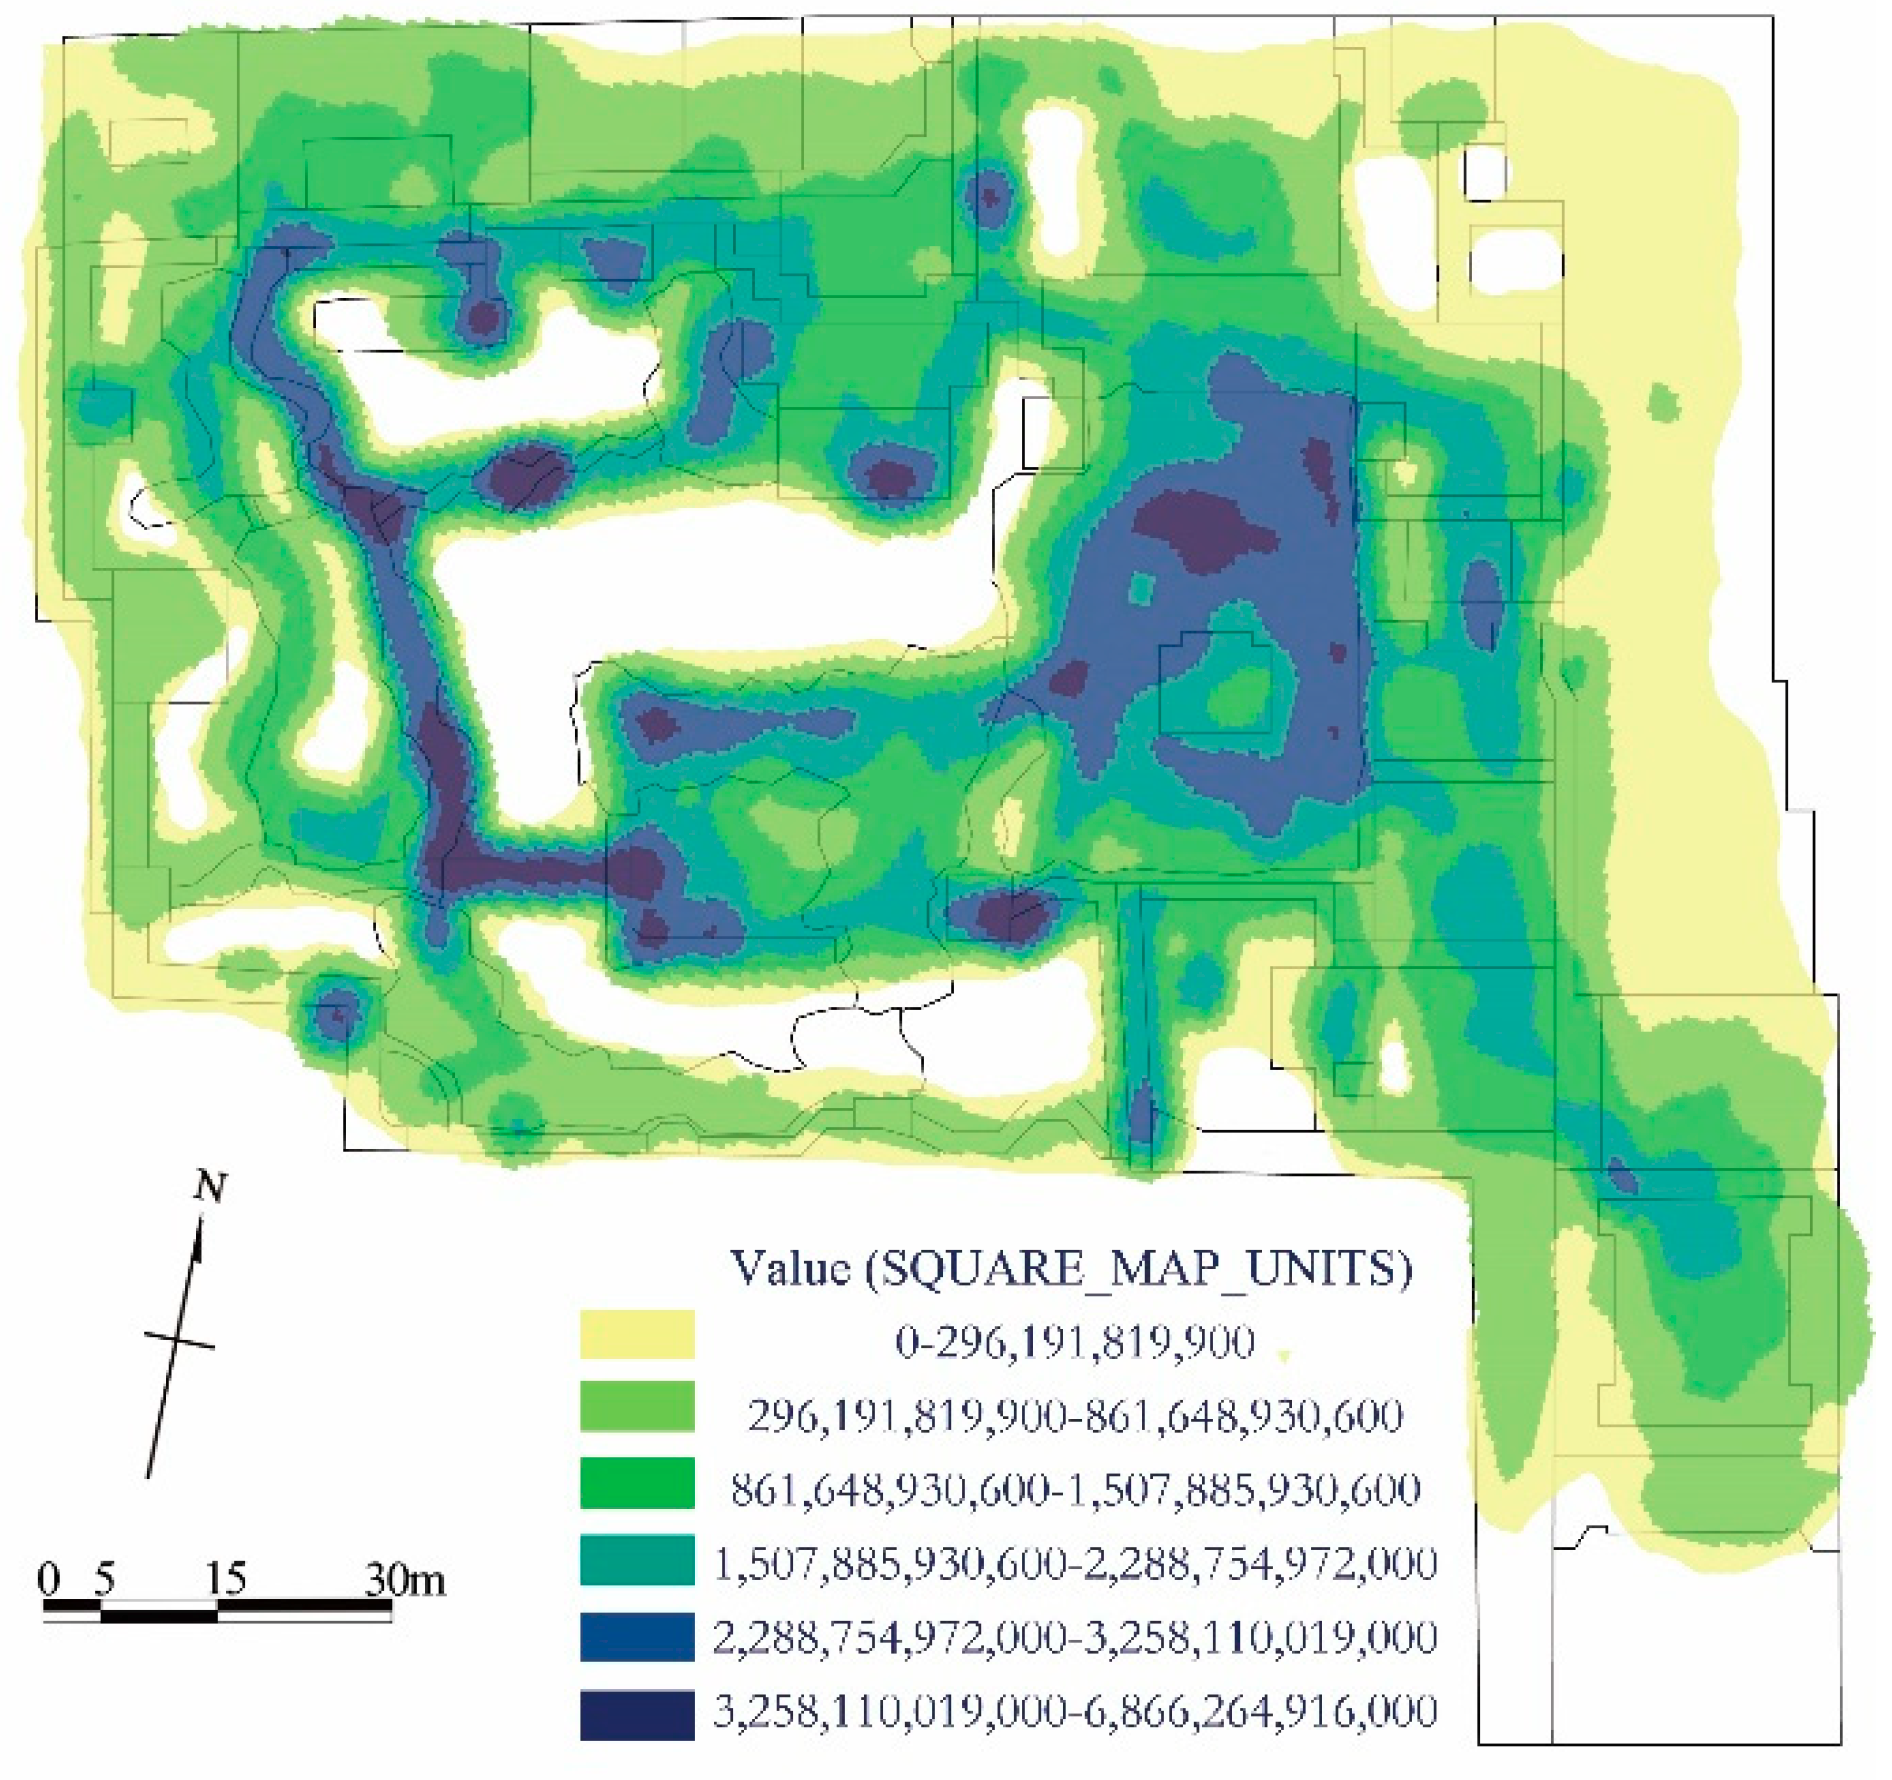
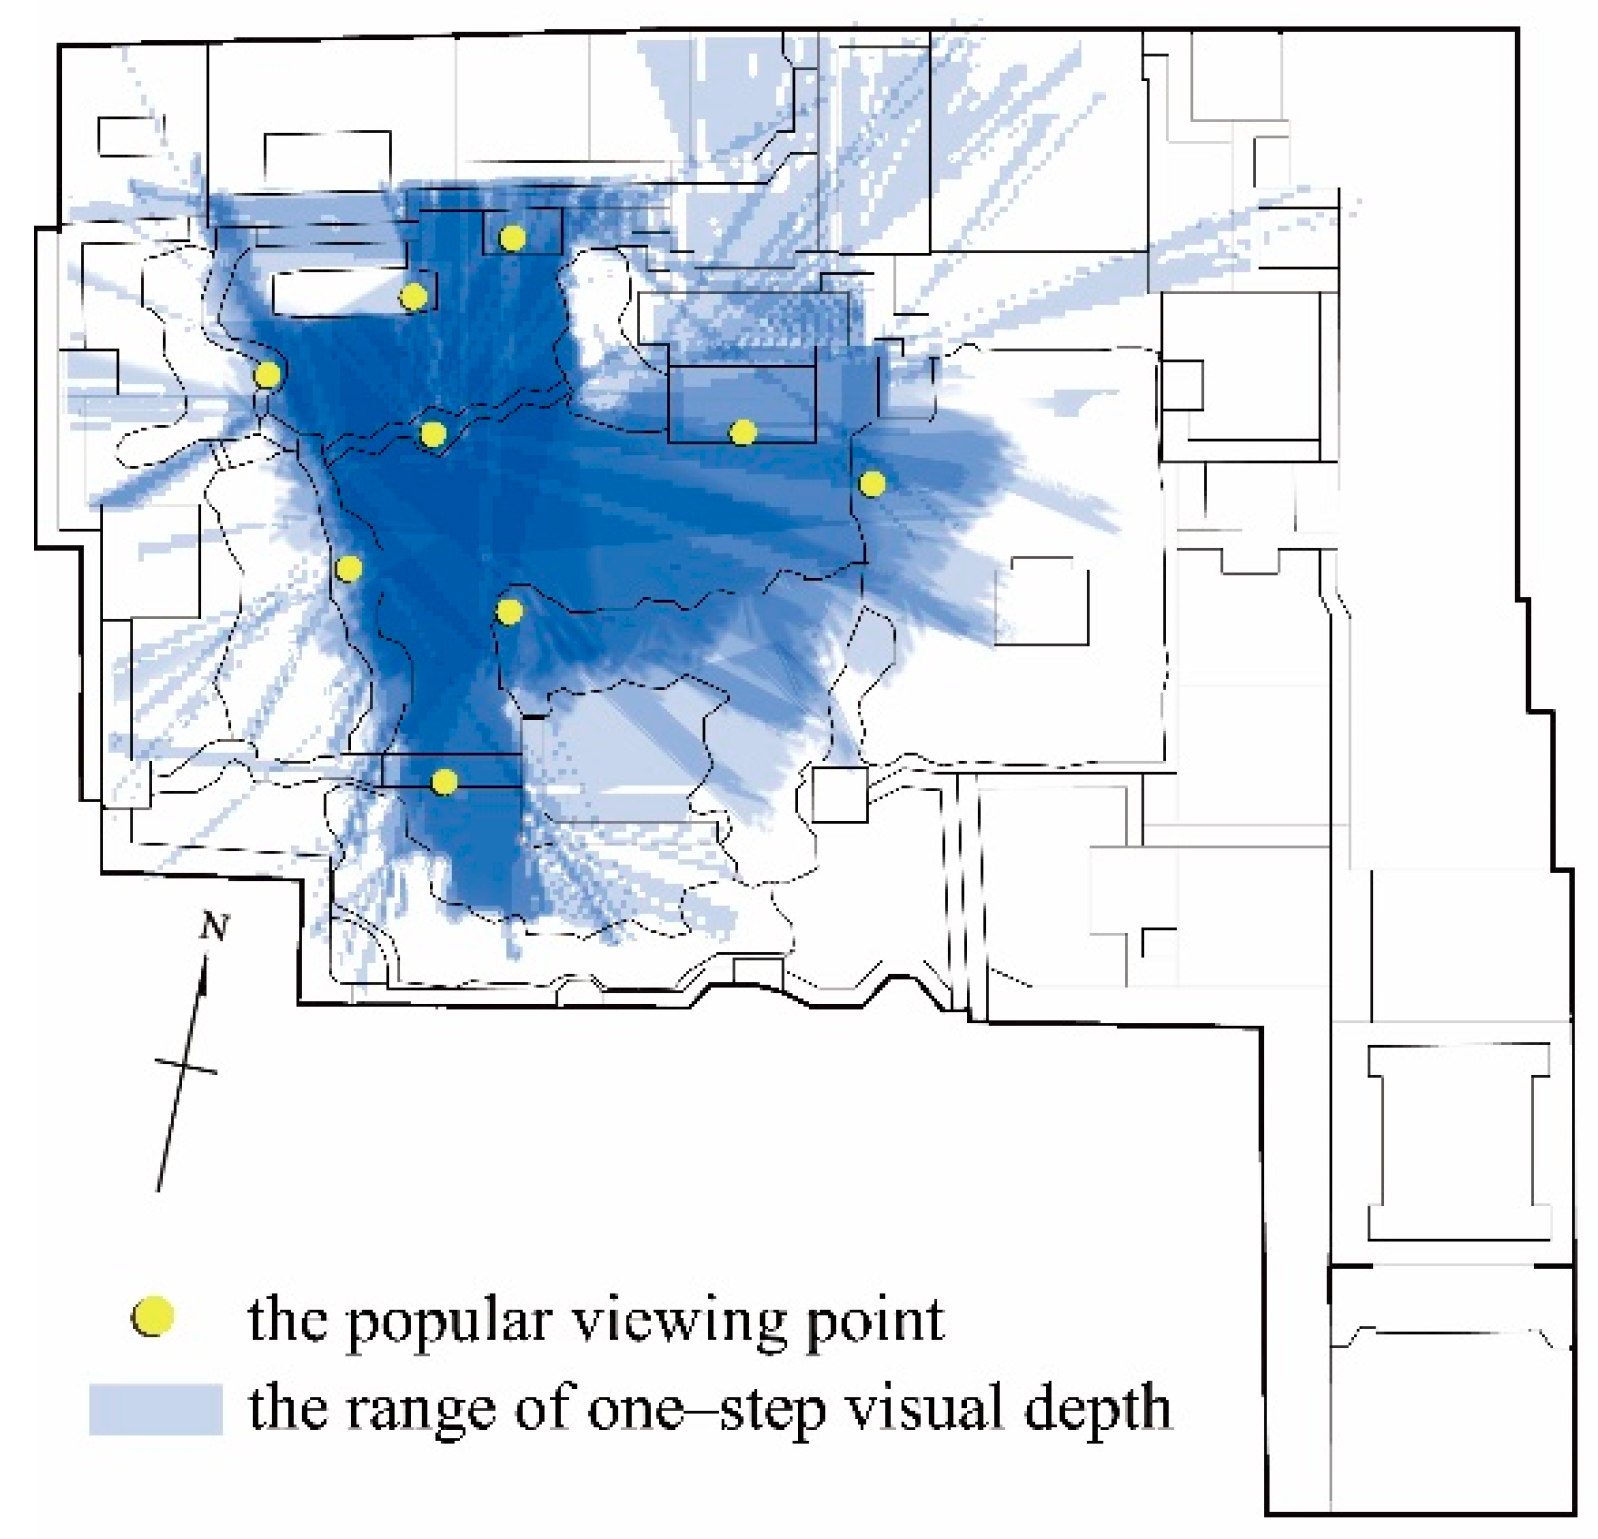
3.3. The Correlation between the Visual Characteristics and Visitor Temporal–Spatial Distributions in the Garden

1.6 m was set as the sight line height, based on the Chinese average height [49]. In accordance with the results of field studies, we treated rockeries, tree trunks, and leaking windows, those blocking the sight lines, as equated with the wall, while rocky gaps and leaking windows with penetrable sight lines were considered as blank to draw the Visible Layer of the Lion Grove. Figure 3 shows the results of the visibility analysis by using the Visual Control parameters in the VGA (Visibility Graph Analysis) function of Depthmap, setting the grid side length at 600 mm. The warmer the hue, the higher the Visual Control value is. According to Hillier and Hanson in Space is the Machine (1996), the higher the Visual Control value of a certain space, the larger the range of visibility is, and the easier it can be seen by those around it [50]. Therefore, the higher the Visual Control value, the easier “seeing” and “being seen” is for a certain space. For the convenience of statistical analysis, the maximum Visual Control value (Visual Control (max)) of each space was taken. We used SPSS software (version 24) to analyze the correlation between the Visual Control (max) values and the Average Speed and the Revisiting Proportion (Table 2).
The Visual Control (max) values had a significant correlation with the Revisiting Proportion and the Average Speed of visitors. Therefore, visual space mainly affected visitor activities in the garden. The more convenient the sight line of a certain space was and the more convenient it was to communicate with other spaces, thus, the more attractive the space was for visitors to stay and revisit.

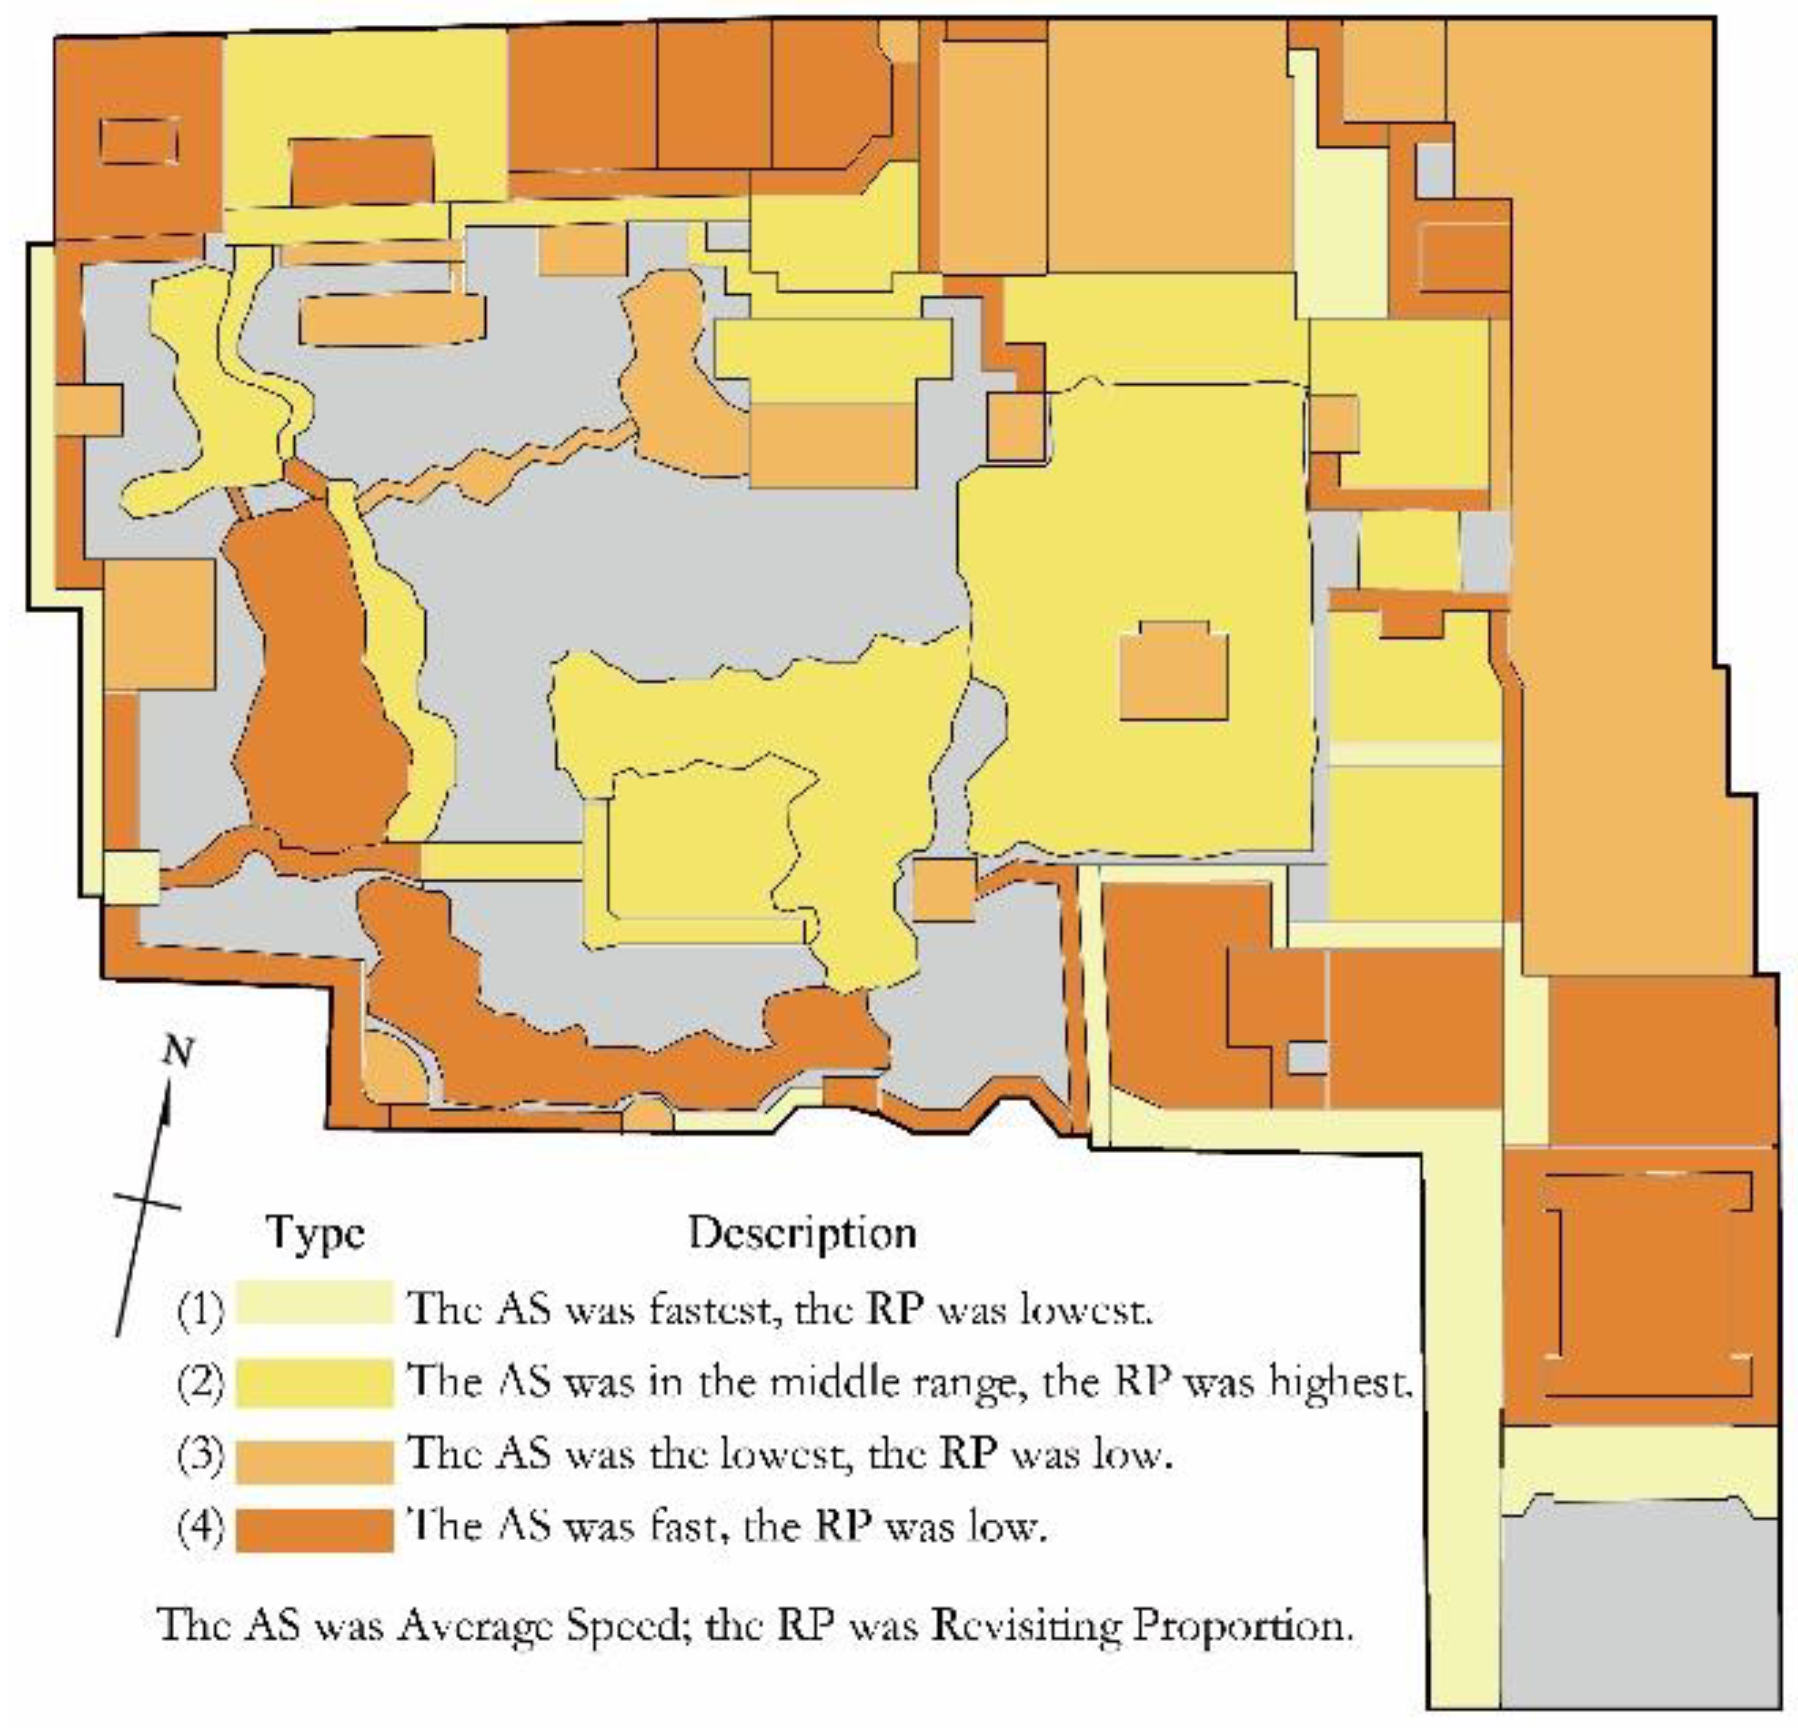
3.4. The Cluster Analysis of Visual Features of 85 Spaces in the Lion Grove

We used ArcGIS 10.2 to merge 353 trajectories and then selected a full-image search and a 500 × 500 mm2 for the output pixel in the kernel density analysis tool (Figure 4). The layout of buildings, rockeries, pavilions, etc. seems to be random in the garden; however, most of the high kernel density areas are in and around the large water pool.
The original data of the Revisiting Proportion and the Average Speed had different scales and units. Therefore, a standardized step was required to pre-process the data for the cluster analysis. We processed the z-score standardization on the Revisiting Proportion and the Average Speed values of each space and then obtained new values for these two variables:
New value = (preliminary value-mean value)/(standard deviation).
The K-means clustering in Figure 5, through which the new values of the Revisiting Proportion and the Average Speed were analyzed in SPSS, displays four types of visitor temporal–spatial behavior patterns. As an exception, an unexpected Revisiting Proportion showed up in A14. Because it encloses a courtyard (Y11), participants would walk back and forth between them. Regardless of the interference of Y11, A14 should belong to Type 4.
Combining Figure 3 and Figure 5, we can also explain the relationship between visual characteristics and visitor temporal–spatial distributions in the Lion Grove.
In Type 1, the Average Speed was the fastest, while the Revisiting Proportion was the lowest. This type was concentrated near the entrance and exit and the secret tunnel (T5). These are usually long passageways with a narrow range of vision. It is neither convenient to “seeing” outwards nor conducive to “being seen” and thus was unable to attract tourists to stay and revisit. Participants passed these areas at a faster speed (0.44 ± 0.07 m/s); the sum of the average visiting time of 11 spaces was 6.30 min, only 6.36% of the average total visiting time of the garden.
In Type 2, the Average Speed was in the middle range, while the Revisiting Proportion was the highest. This type was equipped with both characteristics of “seeing” and “being seen” and was thus suitable for “in-motion viewing”, which is also known as dynamic viewing. It means to constantly change the viewpoint of the tour routes to see the garden scenery. When visitors move, scenery changes follow; therefore, visitors receive a rich visual experience and enjoy revisiting. This type covered the main visiting areas of the participants, and the Revisiting Proportion was 71.34% (SD 15.56%).
In Type 3, the Average Speed of participants was the lowest, and the Revisiting Proportion was low. This type was more suitable for viewing rather than being viewed. The average length of stay in Type 3 was 1.75 ± 1.30 min, and the average visiting speed was the lowest (0.15 ± 0.04 m/s). Therefore, participants were mainly viewing and resting in these spaces.
In Type 4, the Average Speed of visitors was fast, while the Revisiting Proportion was low. As discussed above, the spatial characteristics “seeing” and “being seen” of Type 4 were less pronounced than they were in Type 2 and Type 3, while they were more pronounced than they were in Type 1. The visiting proportion of Type 4 was low, resulting from low walking accessibility [35].
Comparing Figure 4 and Figure 5, the high-density areas in the former overlap Type 2 and Type 3 in the latter, and the second-high-density areas overlap Type 4.

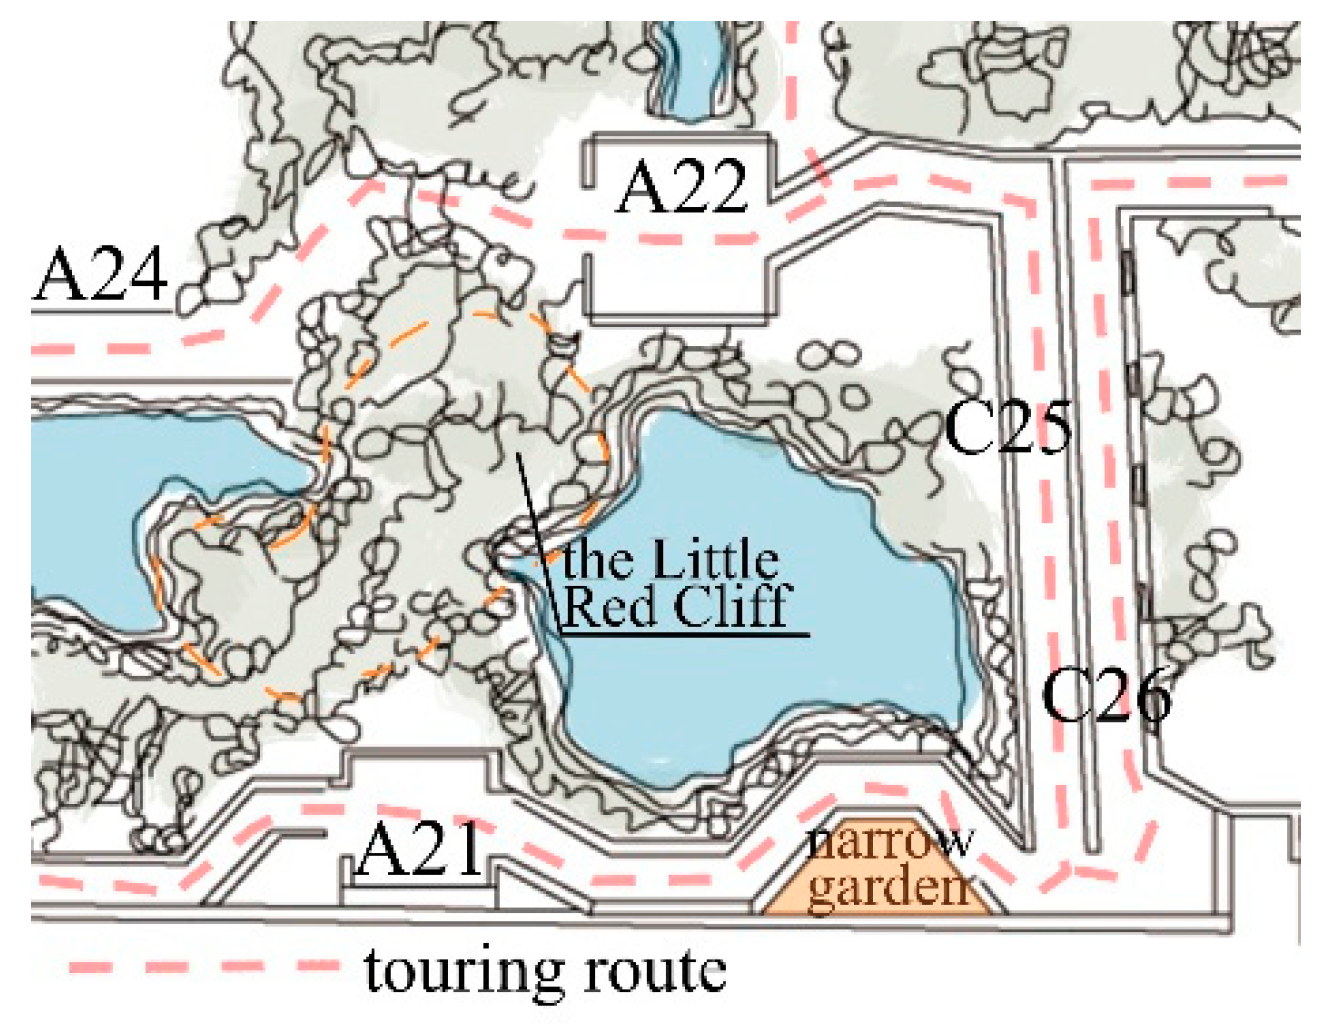
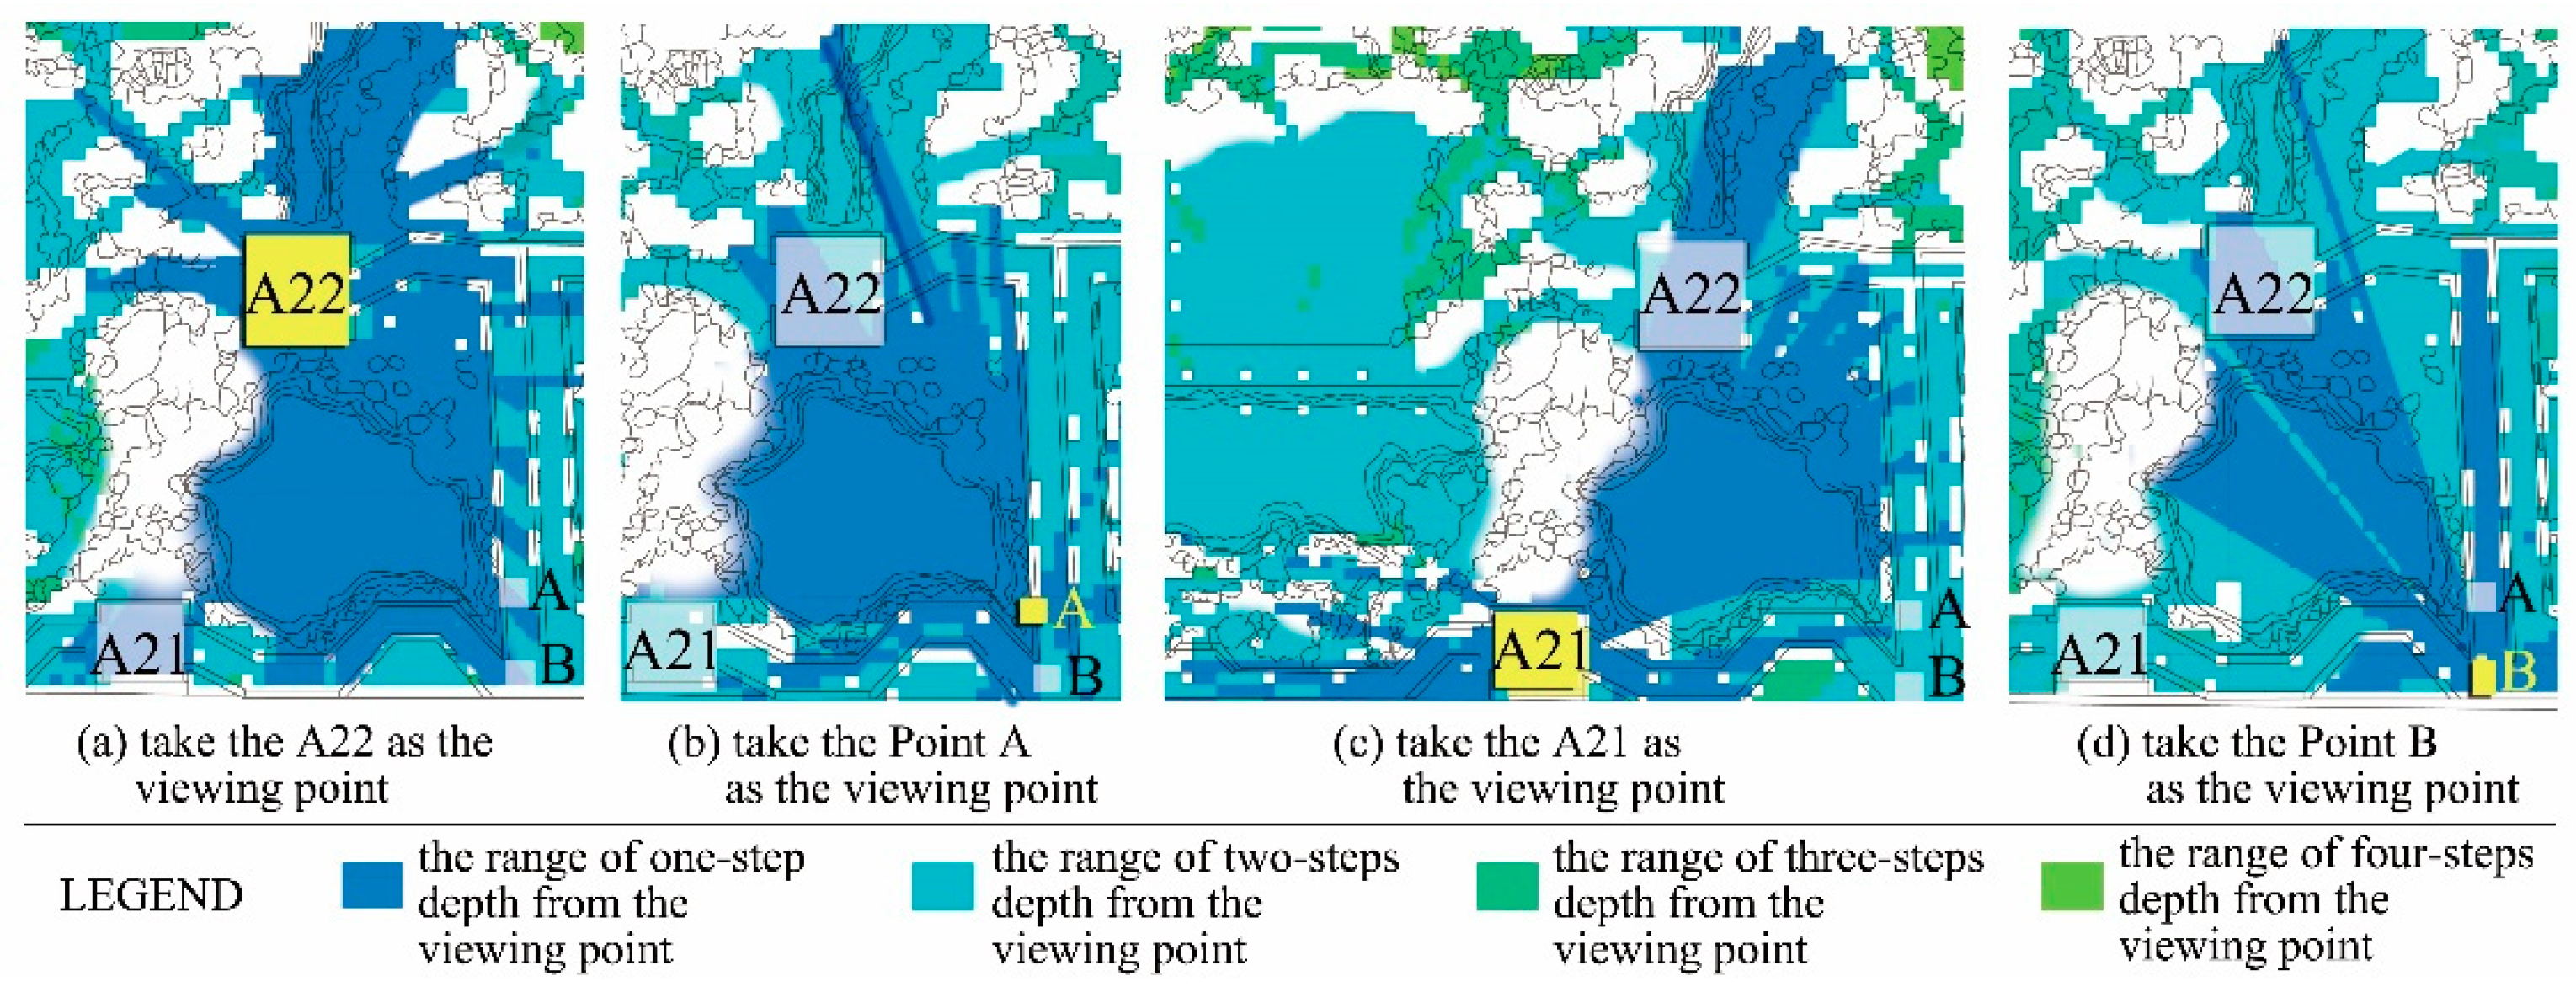
3.5. Visual Characteristic Analysis of a Part Area in the Lion Grove

For the Visibility Step analysis of the VGA function in Depthmap, one-step visual depth represents direct sight line exchange between two spaces without translocation: Two-step visual depth indicates that visitors in these two spaces need one translocation, and so on [50]. Eight points in and around the large water pool were selected. They were high kernel density points as shown in Figure 4 and belonged to Type 2 or Type 3 as shown in Figure 5. Each range of one-step visual depth of these eight points was overlapped (Figure 6); it turned out that they were all within one-step visual depth of each other, and their sight lines met at the pavilion in the center of the large water pool (B2). Therefore, visitors could gain interactive visual experience in any one of these eight points, whether visitors were engaging in “in-position viewing” (It is also known as at-rest viewing, and means enjoying the scenery from a fixed viewing point. The composition of the picture seen by the viewer is still, like watching a landscape painting) or in “in-motion viewing”.
In Figure 6, most of the areas which were over one-step visual depth from the eight points belonged to Type 1 or Type 4, such as the hall building (A17), the pavilions (A16, A18, A19, A20, A21), and the long corridors (C18, C19, C20, C21, C22, C23, C24) on the west or south edge of the garden. Because of poor visibility, their average first-time visiting proportions were low (10.95% ± 6.99%); however, their low Average Speed values infer that these spaces were suitable for viewing. There are series of buildings connected with corridors on the western and southern garden edges, such as the “C18-A16-C19-A17-C20-A18” and the “A19-C22-A20-C23-A21-C24”, respectively. The average Revisiting Proportion values of each space of these two series were low, with the former being 9.97% ± 8.40% and the latter being 4.41% ± 3.57%. However, the average value of Average Speed of corridors was higher (0.31 m/s ± 0.04) and the average value of Average Speed of pavilions and hall buildings was lower (0.19 m/s ± 0.12). A16 and A17 are at the highest level from which visitors can overlook the entire garden. Their Average Speed was slower compared to A20 and A21 which were blocked by the rockeries with 0.06 m/s, 0.07 m/s, 0.32 m/s, and 0.36 m/s, respectively.
Take the “A22-C56/C26-C24-A21” as another example; there are twelve routes in this area, which could be classified into four types (Figure 7). Table 3 shows the route selection results of 233 participants; A22 was the most attractive space in the area, which can be proved by its high kernel density value in Figure 4.
Point A (the leakage window of C25) and Point B in Figure 8 were selected for further analysis because the kernel density of Point A is relative higher (Figure 4), and Point B is the inflexion from the double corridor (C25/C26) to C24. We used the “Visibility Step” in Depthmap to analyze the visual depth of A22, A21, Point A, and Point B. The result shows that A21 was the two-step visual depth from Points A and B, while A22 was within the range of one-step visual depth. The corridor (C24) twists to the north, forming a trapezoidal narrow garden (A narrow garden is usually small in size, and enclosed by buildings, walls, and corridors in private gardens.), which obscures the sight line from Points A and B. That means that participants cannot see A21 at Points A and B directly, without changing their position. The higher Visual Control value of A22 made it more attractive to visitors than A21 (Figure 3); meanwhile, the range of one-step visual depth of A22 was larger than that of A21 (Figure 8). Therefore, most participants chose to reach A22 via C25 or C26. Thus, A22 can be regarded not only as a point to “seeing” C24, A21, Point A, and Point B but also as a point to “being seen” from others, becoming the most popular sight attraction for visitors in this area.

4. Discussion and Conclusions

4.1. The Intentional Visual Design Guides Visitor Behavior in the Lion Grove

The higher land in the west and south of the Lion Grove was built by Bei Renyuan (贝仁元) in the early 20th century [51]. However, there was not any higher land in the west or south of the garden, only flat land with rockeries, compared with the text literature and paintings about the Lion Grove in the 18th century, such as The Travel Note of the Lion Grove (游狮子林记) of Yuan Xuelan, The Grand Ceremonies of Touring the South China (南巡盛典), and A Panorama of the Lion Grove (狮子林全景图) of Qian Weicheng (钱维城). Research shows that the theory and technology of Suzhou gardens in the Qing Dynasty were mature [52], and that gardeners arranged every scene to get a best visual effect [53]. Furthermore, according to the description of Bao Xicheng in the Rebuild the Lion Grove [54]:
Bei was very eager to manage, plan, and design all the scenes in the Lion Grove by himself, and he would not hesitate to destroy any construction which was slightly dissatisfying, then rebuilt it. (主人意匠经营, 躬自规画, 少不当意, 虽毁之重劳不惜).
We inferred that the Bei intentionally raised the land, in the west and south of the garden, to be higher, to enrich the spatial visual hierarchy. The higher land could increase the visibility of the west and south of the garden, which was conducive to “seeing” and “being seen”. Hence, we have drawn the following conclusion:
First, researchers have argued that the garden elements of CCGs were not distributed by the law of the axis or symmetry, and that they seemed to be random [55]; however, the Bei family arranged the garden layout intentionally at the beginning of its reconstruction to enrich the spatial visual hierarchy.
Second, the visitor spatial–temporal behavior in the garden was guided by visual characteristics. Visitors mainly concentrated at spaces in and around the large water pool, where each was within one-step visual depth of others. These spaces were equipped with both characteristics of “seeing” and “being seen”, and their sight lines met at the pavilion in the center of the large water pool (B2). Therefore, visitors could get an interactive visual experience of “one step, one scene” while they were moving in these spaces.

4.2. Garden Planning and Management

In Figure 4, the kernel density analysis of all GPS points shows the popular and less popular areas in the Lion Grove. Because of the GPS log interval of 1 s, the number of visitors and their length of stay were both reasons for the formation of high kernel density areas. Besides regular garden history exhibitions, A14 hosts occasional thematic exhibitions and events; however, it had low kernel density values. Its visiting proportion was in the middle level (57.80%), with the highest being 96.03%, and the lowest being 0.08%. Yet, the Average Time was the shortest (98.09 s) compared to the longest which was 395.63 s. While A14 is close to the large water pool, the most popular area in the garden, its visiting proportion was low. We found that two reasons could contribute to this phenomenon: First, there was no obvious signage guiding visitors to A14 (top right corner of Figure 1); second, being blocked by A13 (a Marble Boat), it was hard to see A14 from B3, B2, and H7. Hence, we recommend that the garden management department uses the “Visual Step Depth” or the “Visual Control” function of Depthmap to simulate where the most visible site for the signage is [56].
Figure 5 shows that most corridors belonged to Type 1 and Type 4 with a high Average Speed, which means that visitors have a lower interest in these spaces; hence, these spaces should not be used as exhibition areas but as circulation areas.
H1 was made of Taihu Stones rockeries, the most attractive garden element to participants according to Table 1, with a visiting proportion of 92.35% and Average Time of 395.63 s. However, due to its special structure and the damage caused by the excessive number of tourists, it is already cracked [57]. Hence, Real-Time Visitor Monitoring can be employed to count the number of tourists in H1. As the tourist capacity approaches its threshold, alerts will be issued to warn of overcrowding, therefore, enhancing its sustainability [58].
Spaces’ safety, in and around the large water pool (P2, A12, A13, A22, B2) and on top of the rockeries (A16, A19, A20), should be emphasized due to overcrowding resulting from their low visiting speed.

4.3. Limitations and Insights for Future Research

Some limitations of this study deserve further discussion. First, GPS trajectories can improve the accuracy of analyzing visitor behavior; however, the piecewise statistics of each trajectory was a time-consuming job. At present, no software can automatically process GPS trajectories. Hence, its format conversion and segmentation calculation must be done manually. In this research, we spent nearly two hours on each trajectory calculation and double checking. Hence, the manual processing method is hardly applied on large-scale cases with hundreds of segmentations or thousands of trajectories.
Second, in addition to the visual characteristics, other factors such as the theme and the exhibits may also affect visitor behavior in a certain space. Furthermore, personal factors such as phone calls or breaks would create artifacts to GPS trajectories, which can be reduced by combining GPS trajectories and questionnaires or real-time observations in further studies.
Third, GPS trajectories cannot confirm which direction of the scenery is actually attractive at visitor stand points in CCGS. Photo-taking location data could be employed to study this question in further research [59].

Author Contributions

T.Z. and Y.X. designed the research and identified the logical connections of the arguments and counter-arguments; T.Z. collected and organized the data; T.Z. and W.H. analyzed the data; T.Z. wrote the paper; Y.X. supervised this research.

Funding

This research was funded by the National Natural Science Foundation of China (No. 51608271 and No. 31700634).

Acknowledgments

We would like to thank the management department of the Lion Grove Garden for giving us their permission to do this research; we would also like to thank Xuxue Sun for assistance during data collection, Yepeng Liu for help in the use of ArcGIS, and Zefeng Lian for writing suggestions.

Conflicts of Interest

The authors declare no conflict of interest.

References

  1. Wang, Y. The History of Chinese Garden Culture; Shanghai People’s Publishing House: Shanghai, China, 2004. [Google Scholar]
  2. Liu, D.; Wang, J.C. Chinese Classical Gardens of Suzhou; Joseph, C.W., Ed.; McGraw-Hill: New York, NY, USA, 1993. [Google Scholar]
  3. Feng, Y. The scenery changes with paces: The pleasures of Chinese classical gardens. J. Tongji Univ. Soc. Sci. Sect. 1997, 8, 11–14. [Google Scholar]
  4. Peng, Y.G. Analysis of the Traditional Chinese Garden; China Architecture & Building Press: Beijing, China, 1986. [Google Scholar]
  5. Guxi, P. The view point and route of Suzhou gardens. Archit. J. 1963, 6, 16–20. [Google Scholar]
  6. Chen, C.Z. On Chinese gardens. J. Tongji Univ. 1978, 2, 87–91. [Google Scholar]
  7. Yue, Z.; Li, X.N.; Fan, R. The application of landscape visual quality assessment theory in classical gardens of Suzhou. Chin. Landsc. Archit. 2017, 1, 113–118. [Google Scholar]
  8. Linton, D.L. The assessment of scenery as a natural resource. Scott. Geogr. Mag. 1986, 84, 219–238. [Google Scholar] [CrossRef]
  9. Kaplan, R.; Kaplan, S.; Brown, T. Environmental preference: A comparison of four domians of predictors. Environ. Behav. 1989, 21, 509–529. [Google Scholar] [CrossRef]
  10. Liang, H.L.; Zhang, Q.P. Space opening and closing quantification of private gardens in Southern Yangtze River based on space syntax theory. Mod. Urban Res. 2017, 1, 47–52. [Google Scholar]
  11. Yang, Q.Y.; Zhang, J.L. Analysis on the mystery of the main rockery in Lion Forest Garden based on space syntax. Chin. Landsc. Archit. 2018, 4, 129–133. [Google Scholar]
  12. Chem, Y.; Tu, J. Study on Nanjing late Qing dynasty mansion garden space configuration and quantization—A case of former residence of Ganxi mansion garden space. Chin. Landsc. Archit. 2018, 7, 140–144. [Google Scholar]
  13. Ding, J. Quantitative Analysis of Space Configuration and Intelligibility in Chinese Traditional Garden—Southern Private Garden for Example. Master’s Thesis, Tianjin University, Tianjin, China, 2009. [Google Scholar]
  14. Dai, X.L.; Luo, C.H.; Chen, X.J. The Creation of Complexity in Chinese Garden. Appl. Mech. Mater. 2012, 209, 380–383. [Google Scholar] [CrossRef]
  15. Yu, R.; Ostwald, M.J.; Gu, N. Parametrically Generating New Instances of Traditional Chinese Private Gardens that Replicate Selected Socio-Spatial and Aesthetic Properties. Nexus Netw. J. 2015, 17, 807–829. [Google Scholar] [CrossRef]
  16. Jin, D. The application and development of space syntax in China. In Space Syntax in China; Jin, D., Hillier, B., Eds.; Southeast University Press: Nanjing, China, 2015; Volume 1, pp. 2–21. [Google Scholar]
  17. Tceluiko, D.S.; Bazilevich, M.E. Space syntax. mathematical analysis of traditional Chinese private gardens planning structures. Mater. Sci. Eng. 2018, 463, 022033. [Google Scholar] [CrossRef]
  18. East, D.; Osborne, P.; Kemp, S.; Woodfine, T. Combining GPS & survey data improves understanding of visitor behaviour. Tour. Manag. 2017, 61, 307–320. [Google Scholar] [CrossRef]
  19. Beeco, J.A.; Hallo, J.C.; Brownlee, M.T.J. GPS visitor tracking and recreation suitability mapping: Tools for understanding and managing visitor use. Landsc. Urban Plan. 2017, 127, 136–145. [Google Scholar] [CrossRef]
  20. Van Riper, C.J.; Stamberger, L.; Kuwayama, S.; Lum, C.; Sabrina, S. A Study of Values, Environmental Behavior, and GPS Visitor Tracking in Denali National Park and Preserve; Technical Report Prepared for the National Park Service, Report Number: NPS/7112/2017/7112Affiliation; University of Illinois at Urbana-Champaign: Champaign, IL, USA, 2017. [Google Scholar]
  21. Sugimoto, K.; Ota, K.; Suzuki, S. Visitor Mobility and Spatial Structure in a Local Urban Tourism Destination: GPS Tracking and Network analysis. Sustainability 2019, 11, 919. [Google Scholar] [CrossRef]
  22. Kim, J.; Thapa, B.; Jang, S.; Yang, E. Seasonal Spatial Activity Patterns of Visitors with a Mobile Exercise Application at Seoraksan National Park, South Korea. Sustainability 2018, 10, 2263. [Google Scholar] [CrossRef]
  23. Zheng, W.; Huang, X.; Li, Y. Understanding the tourist mobility using GPS: Where is the next place. Tour. Manag. 2017, 59, 267–280. [Google Scholar] [CrossRef]
  24. Edwards, D.; Griffin, T. Understanding tourists’ spatial behaviour: GPS tracking as an aid to sustainable destination management. J. Sustain. Tour. 2013, 21, 580–595. [Google Scholar] [CrossRef]
  25. Huang, X.T. A Study on temporal-spatial behavior pattern of tourists based on time-geography science—A case study of Summer Palace, Beijing. Tour. Tribune 2009, 6, 82–87. [Google Scholar]
  26. Hartmann, R. Combining field methods in tourism research. Ann. Tour. Res. 1988, 15, 88–105. [Google Scholar] [CrossRef]
  27. Junya, K.; Fumiko, I.; Yohei, K. Predicting when and where tourists have viewed exhibitions from GPS logs by using spatio-temporal data as explanatory variable: A lesson from surveys at Tama Zoological Park. Theory Appl. GIS 2016, 24, 1–11. [Google Scholar] [CrossRef]
  28. Taczanowska, K.; Bielański, M.; González, L.; Garcia-Massó, X.; Toca-Herrera, J.L. Analyzing spatial behavior of backcountry skiers in mountain protected areas combining GPS tracking and graph theory. Symmetry 2017, 9, 317. [Google Scholar] [CrossRef]
  29. Grinberger, A.Y.; Shoval, N.; Mckercher, B. Typologies of tourists’ time-space consumption: A new approach using GPS data and GIS tools. Tour. Geogr. 2014, 16, 105–123. [Google Scholar] [CrossRef]
  30. Bauder, M. Using gps supported speed analysis to determine spatial visitor behavior. Int. J. Tour. Res. 2015, 17, 337–346. [Google Scholar] [CrossRef]
  31. Galí, N.; Aulet, S. Tourists’ space–time behavior in heritage places: Comparing guided and nonguided visitors. Int. J. Tour. Res. 2019, 21, 388–399. [Google Scholar] [CrossRef]
  32. ChengzhaoWu, C.Z.; Liu, W.Q.; Li, S.H. GPS/GIS-based Study on the Difference of Space Distribution of Park Recreationists—Taking Gongqing Forest Park in Shanghai as the Example. Chin. Landsc. Archit. 2017, 9, 98–103. [Google Scholar]
  33. Li, Z.M. Spatial structure and visitor behavior pattern of Chinese classical gardens: A case study of Yi Garden, Suzhou. In Space Syntax in China; Jin, D., Hillier, B., Eds.; Southeast University Press: Nanjing, China, 2015; pp. 137–155. [Google Scholar]
  34. Zhang, T.T.; Lian, Z.F.; Xu, Y.N. Combining GPS and space syntax analysis to improve understanding of visitor temporal–spatial behaviour: A case study of the Lion Grove Garden in China. Landsc. Res. Rev. under review.
  35. Davey, G. Visitor behavior in zoos: A review. Anthrozoös 2006, 19, 143–157. [Google Scholar] [CrossRef]
  36. Yun, H.J.; Kang, D.J.; Lee, M.J. Spatiotemporal distribution of urban walking tourists by season using GPS-based smartphone application. Asia Pac. J. Tour. Res. 2019, 23, 1047–1061. [Google Scholar] [CrossRef]
  37. Li, Y.; Xiao, L.Z.; Ye, Y.; Xu, W.T.; Law, A. Understanding tourist space at a historic site through space syntax analysis: The case of Gulangyu, China. Tour. Manag. 2016, 52, 330–343. [Google Scholar] [CrossRef]
  38. Zhao, H.H. Probe into the problem of Suzhou tourism environmental capacity. City Plan. Rev. 1983, 3, 46–53. [Google Scholar]
  39. Chen, X.; Wang, H.T.; Guo, M.Y. Suzhou traditional gardens’ environmental carrying capacity: Problems and countermeasures. J. Wuxi Inst. Commer. 2016, 16, 33–37. [Google Scholar] [CrossRef]
  40. Risteskia, M.; Kocevskia, J.; Arnaudov, K. Spatial planning and sustainable tourism as basis for developing competitive tourist destinations. In Proceedings of the XI International Conference, Service Sector in Terms of Changing Environment, Ohrid, Makedonia, 27–29 October 2011; pp. 375–386. [Google Scholar] [CrossRef]
  41. Yazici, K.; Aslan, B.G. GIS Using multi-criteria decision analysis for assessment and map-based indicators for nursery garden management. Int. J. Ecosyst. Ecol. Sci. 2018, 8, 415–428. [Google Scholar]
  42. Wu, R.S. Jiangnan Gardens and Urban Society: A Social-Historical Analysis of Suzhou Gardens During the Ming and Qing Dynasties. Available online: http://www.mh.sinica.edu.tw/PGPublication_Detail.aspx?tmid=3&mid=45&pubid=511&majorTypeCode=2&minorTypeCode=2&major=2&minor=2 (accessed on 12 August 2019).
  43. Yuan, X.L. Famous Suzhou Gardens. In Chronicles of Suzhou Gardens; Yi, X.L., Wang, J.J., Eds.; SXD Joint Publishing Company: Shanghai, China, 2008; p. 286. [Google Scholar]
  44. Suzhou Landscape & Greening Administration Bureau. Local Chronicles of the Lion Grove Garden; Shanghai Wenhui Press: Shanghai, China, 2015; pp. 1–13. [Google Scholar]
  45. Yangxian Lay Buddhist. Record of Rebuilding the Lion Grove. In Chronicles of Suzhou Gardens & Reconstruction Records of Suzhou Gardens; Zhong, S., Ed.; China Forestry Publishing House: Beijing, China, 2004; pp. 315–318. [Google Scholar]
  46. Walton, D.; Dravitzki, V.; Donn, M. The relative influence of wind, sunlight and temperature on user comfort in urban outdoor spaces. Build. Environ. 2007, 42, 3166–3175. [Google Scholar] [CrossRef]
  47. José, D.; Núria, G. First-time versus repeat visitors’ behavior patterns: A GPS analysis. Boletín Asoc. Geógrafos Españoles 2018, 78, 49–65. [Google Scholar] [CrossRef]
  48. Huang, X.T.; Ma, X.J. Study on tourists’ rhythm of activities based on GPS data. Tour. Tribune 2011, 12, 26–29. [Google Scholar]
  49. Yang, X.G.; Li, Y.P.; Ma, G.S.; Hu, X.Q.; Wang, J.Z.; Cui, Z.H.; Wang, Z.H.; Yu, W.T.; Yang, Z.X.; Zhai, F.Y. Study on weight and height of the Chinese people and the differences between 1992 and 2002. Chin. J. Epidemiol. 2005, 26, 489–493. [Google Scholar] [CrossRef]
  50. Hillier, B. Space Is the Machine: A Configurational Theory of Architecture; Cambridge University Press: Cambridge, NY, USA, 1996. [Google Scholar]
  51. Bei, R.Y. Rebuild the Lion Grove. In Chronicles of Suzhou Gardens; Yi, X.L., Wang, J.J., Eds.; SXD Joint Publishing Company: Shanghai, China, 2008; p. 37. [Google Scholar]
  52. Yun, J.; Kim, J. Sociocultural factors of the late Ming and early Qing Chinese garden landscape, based on philosophies seen in Yuanye, Zhangwuzhi, and Xianqingouji. Landsc. Res. 2018, 44, 174–185. [Google Scholar] [CrossRef]
  53. Johnston, R.S. Scholar Gardens of China: A Study and Analysis of the Spatial Design of the Chinese Private Garden; Cambridge University Press: New York, NY, USA, 1991. [Google Scholar]
  54. Bao, X.C. Rebuild the Lion Grove. In Chronicles of Suzhou Gardens; Yi, X.L., Wang, J.J., Eds.; SXD Joint Publishing Company: Shanghai, China, 2008; p. 38. [Google Scholar]
  55. Blundell, J.P.; Jan, W. Social order versus ‘natural’ disorder in the Chinese garden. Stud. Hist. Gard. Des. Landsc. 2014, 34, 151–175. [Google Scholar] [CrossRef]
  56. Mahmoud, A.H.; Omar, R.H. Planting design for urban parks: Space syntax as a landscape design assessment tool. Front. Archit. Res. 2015, 4, 35–45. [Google Scholar] [CrossRef] [Green Version]
  57. JSCHINA. Available online: http://jsnews.jschina.com.cn/sz/a/201703/t20170327_273506.shtml (accessed on 6 July 2019).
  58. Novas, N.; Gázquez, J.A.; MacLennan, J.; García, R.M.; Fernández-Ros, M.; Manzano-Agugliaro, F. A real-time underground environment monitoring system for sustainable tourism of caves. J. Clean. Prod. 2017, 142, 2707–2721. [Google Scholar] [CrossRef]
  59. Sugimoto, K. Use of GIS-based analysis to explore the characteristics of preferred viewing spots indicated by the visual interest of visitors. Landsc. Res. 2017, 43, 345–359. [Google Scholar] [CrossRef]
Figure 1. The Lion Grove layout and space segregation.
Sustainability 11 04348 g001
Figure 2. The calculation results of the Average Speed and Revisiting Proportion values. (a) The Average Speed values; (b) the Revisiting Proportion values.
Sustainability 11 04348 g002
Figure 3. The result of the Visual Control analysis in Depthmap.
Sustainability 11 04348 g003
Figure 4. The kernel density analysis result of 353 GPS trajectories.
Sustainability 11 04348 g004
Figure 5. The clustering analysis result of the two groups of new values.
Sustainability 11 04348 g005
Figure 6. The overlay of the one-step visual depth range of eight viewing points.
Sustainability 11 04348 g006
Figure 7. Touring routes in the area of “A22-C56/C26-C24-A21”.
Sustainability 11 04348 g007
Figure 8. The Visibility Step Analysis result of A21, A22, Point A, and Point B.
Sustainability 11 04348 g008
Table 1. A part of visitor survey results.
ItemStatistical Results
gendermale: 50.42%, female: 49.58%
ageunder 20: 12.43%, 20–40: 87.29%, over 40: 0.28%
education backgroundbelow high school: 5.08%, bachelor degree: 78.81%, graduate degree or above: 16.11%
visiting timesfirst time: 93.22%, two times or more: 6.78%
visiting motivationto browse > to relax > cultural experience > curious > photography > other
the rank of most attractive garden elementsrockeries > waterscapes > courtyards > hall buildings > plants > pavilions > galleries > leaky windows > furniture and furnishing > inscribed board and couplets
the rank of satisfying factorsbeautiful scenery > intact cultural relics > good cultural experience > environmental sanitation > reasonable fare
the rank of unsatisfying factorsovercrowding > poor signage > not beautiful enough > potential safety hazard > expensive entrance tickets
Table 2. Spearman correlation analysis of Visual Control (max) values and the visitor temporal–spatial behavior data of 85 spaces.
Revisiting ProportionAverage Speed
Visual Control (max)Coefficient of association0.271 *−0.298 **
significance (2 tails)0.0120.006
n8585
** at level 0.01 (2 tails), the correlation was significant; * at level 0.05 (2 tails), the correlation was significant.
Table 3. Statistics of the four types of visiting routes.
Types of Visiting RoutesQuantity
from A22 to A211
from A22 to other areas except A21183
from A21 to A223
from A21 to other areas except A2236
total223

