Article

Spatiotemporal Dynamics of Water Yield Service and Its Response to Urbanisation in the Beiyun River Basin, Beijing

State Key Laboratory of Water Environment Simulation, School of Environment, Beijing Normal University, Beijing 100875, China
*
Author to whom correspondence should be addressed.
Sustainability 2019, 11(16), 4361; https://doi.org/10.3390/su11164361
Submission received: 11 June 2019 / Revised: 4 August 2019 / Accepted: 9 August 2019 / Published: 12 August 2019
(This article belongs to the Section Sustainable Urban and Rural Development)

Abstract

:
Water-related ecosystem services are vitally important for growing mega-cities. However, accelerating urbanisation has brought many associated issues, such as rapid population growth, extensive land occupation and landscape pattern changes, which affect both the functions and services of regional ecosystems. To achieve sustainable urban ecological development, it is necessary to determine the impacts of urbanisation on water yield. In this study, the water yield ecosystem service of the Beiyun River Basin in Beijing was simulated by the Integrated Valuation of Ecosystem Services and Trade-offs (InVEST) model and the Geographical Detector method (Geo-detector) was applied to obtain the contributions and temporal regularity of urbanisation impacts on water yield. The results indicated the following: (1) the water yield of the Beiyun River Basin increased from 9.52 × 10⁸ m3 in 2000 to 12.84 × 10⁸ m3 in 2010, with a growth rate of 34.9%; (2) the urbanisation level of the Beiyun River Basin increased from 2000 to 2010, and the selected five landscape indexes varied greatly with the continuously increasing patch density (PD), splitting index (SPLIT) and Shannon’s diversity index (SHDI); (3) during this decade, patch richness density (PRD), SHDI, aggregation index (AI), portion of construction land (CL) and average annual precipitation (AP) were the influencing factors that continuously contributed more than 30% of the spatial variability of water yield in the Beiyun River Basin; and (4) the explanatory power of the interaction between any two driving forces was greater than any single factor. Our results could provide scientific references and constructive advice for city water resource operation from a landscape perspective.

1. Introduction

The urban ecosystem is a highly complicated socio–economic–natural ecosystem, providing the most important habitats for humans since the 20th century [1,2]. Its structural and functional characteristics are closely related to both natural influencing factors and socioeconomic development. In the context of global urbanisation, great changes have been witnessed in urban areas, including land use/cover change, landscape fragmentation and socioeconomic change, which have affected ecosystem functions and services, and these impacts have reached far beyond the city limits [3]. As an essential ecosystem service, water yield represents the maximum water availability for both natural ecosystems and human society, and the amount of water supply will directly influence the sustainable development of the regional economy and ecosystems [4,5,6,7,8,9].
As a rapidly growing ultra-large-scale city, Beijing is one of the most typical urbanised areas in China. Since 2000, the urban built-up area has expanded at an average rate of 109 km2 per year, and the permanent population of Beijing has increased at an annual rate of 0.78 million, reaching 19.61 million by 2010 [10]. Ever since, Beijing has experienced continuously arid conditions, and the water shortage situation has become increasingly severe [11]. As the main river system of Beijing, the Beiyun River has a flow of hundreds of millions of megalitres of water per year, the average annual water flow reached 511 million cubic meters during the period 1998–2006, which could alleviate the water shortage situation in Beijing to a certain extent [12]. However, the Beiyun River Basin is the most densely populated river basin in Beijing, with the highest concentration of industries and the highest level of urbanisation, which have deeply changed the original drainage system and natural landforms and have greatly impacted the runoff. The large-scale housing construction increased the impervious layer and reduced the amount of infiltration [13,14]. Moreover, the continuously rising population of Beijing (from 13.64 million in 2000 to 19.7 million in 2010) has led to more stringent requirements for water resources. The impacts of urbanisation will restrict the sustainable development of the social economy in the basin in the near future. Therefore, it is of great importance to detect the spatial and temporal regularity of the water yield in the Beiyun River Basin and to quantify the impacts from urbanisation and determine the changes in the correlation between urbanisation and water yield at different spatial scales, which could help to make optimal allocations of water resources and support the decision-making process of both city planners and policy makers.
The Integrated Valuation of Ecosystem Services and Trade-offs (InVEST) model has been commonly used to simulate and evaluate ecosystem services all over the world [15]. To assess how land-use change affects ecosystem services, Sánchez-Canales et al. (2012) applied the InVEST model to a stakeholder-defined scenario of land-use/land-cover change and a sensitivity analysis of the ecosystem service valuation in a Mediterranean region basin [16]. Additionally, Goldstein et al. (2012) used the InVEST model to evaluate the environmental and financial implications of seven planning scenarios encompassing contrasting land-use combinations [17]. Huang et al. (2015) employed the InVEST model and economic valuation models as assessment methods to assess the value and spatial distribution of the coastal ecosystem services in Longhai coastal cities over the past 30 years [18]. For water yield ecosystem service valuations, Marquès et al. (2013) used the InVEST model to assess the water yield of the Francolí basin in north-eastern Spain and analysed the impact of changes in climate and precipitation patterns on water ecosystem services in the region [19]. Shoyama and Yamagata (2014) used the InVEST model to map the provision of selected ecosystem services (e.g., water yield, carbon storage, habitat quality) in the rural Kushiro watershed in northern Japan [20]. Matios and Burney (2017) used the InVEST ecosystem service mapping model to estimate water yield and water consumption as functions of land use in Fresno County, a key farming region in California’s Central Valley [21]. Overall, InVEST is a reliable tool to estimate the levels and economic values of multiple ecosystem services [16,22,23].
Previous studies have used various methods to explore the driving forces of ecosystem service changes, including correlation analysis, regression analysis, grey integrated correlation, factor analysis, Geographical Information System (GIS) analysis, principal components analysis and multiple variable analysis [24,25,26,27,28,29,30]. However, most of the methods are inadequate in quantifying the actual contribution of each factor on ecosystem services, not to mention the joint impacts of these factors. Proposed by Wang et al. in 2010, the Geographical Detector method (Geo-detector) is a set of statistical methods consisting of four detectors, including the risk detector, the ecological detector, the factor detector and the interaction detector, for detecting spatial differentiation and revealing the driving forces behind it [31]. The risk detector could be used to calculate the geographical area that supplied the water yield, the factor detector could assess which determinants were responsible for the water yield, the ecological detector was able to determine whether there was a significant difference between the effects of different influencing factors on the water yield, and the interaction detector could analyse the joint impact of multiple determinants on the water yield. Furthermore, from an ecological perspective, investigating the relationship between the landscape pattern and water yield service at multiple spatial scales could provide important information for the optimisation of water supply and the management of urban ecosystems [32,33].
In this study, we used the InVEST model to evaluate the water yield ecosystem services of the Beiyun River Basin in 2000 and 2010. Geo-detector was employed to identify the crucial factors that contributed to the water yield service, and the spatiotemporal regularities and the interaction relationship of the driving forces were also determined. The conclusions could provide scientific references for similar studies on the correlation between water yield and urbanisation, as well as constructive advice for city management, and they could also be a basis for a water environmental protection strategy formulation in future urbanisation processes.

2. Study Area and Data Sources

The Beiyun River is an important main channel of the Haihe River Basin in the North China Plain, and it is also the only water system that originates in Beijing, starting in Haidian and the Changping Mountains and encompassing 4293 km2 (Figure 1). Its watershed includes the Wenyu River, Qinghe River, Bahe River, Tonghui River, Liangshui River. As the main flood discharge channel in Beijing, the Beiyun River receives approximately 90% of the flood discharge in Beijing every year. This area has a prevailing monsoon-influenced humid continental climate with hot and humid summers and cold and dry winters. The average annual temperature is 11 to 12 °C, the annual average rainfall is 581.7 mm, and more than 75% of the rainfall is concentrated between June and September every year [14].
The data mainly included the digital elevation model data (DEM, 30 m resolution); land use/cover type data; average annual precipitation data sets and annual mean potential evapotranspiration in 2000 and 2010; maximum root depth of soil; plant available water fraction (PAWC); and evapotranspiration coefficient (KC). The watershed and subwatershed boundaries of the Beiyun River Basin were acquired by the Soil and Water Assessment Tool (SWAT), based on the terrain data. The specific data sources and pre-treatments are shown in Table 1. The ArcGIS 10.2 software platform was used to process all the data in this study, and the size of grids in all the above raster data sets was 30 m × 30 m.

3. Methodology

To explore the spatial and temporal variation of water yield service in the Beiyun River Basin and determine its response to urbanisation, we performed the following data analysis: (1) we simulated the water yield service using the InVEST model; and (2) analysed the land use and landscape pattern changes due to urbanisation; then (3) an evaluation index system was constructed to represent the impacts of urbanisation in the Beiyun River Basin; and (4) the Geo-detector method was adopted to quantify the contributions of the impacts to water yield. The above steps and the main research contents are shown in Figure 2.

3.1. Simulation of Water Yield Service in the Beiyun River Basin

InVEST is an ecosystem service assessment tool jointly developed by Stanford University, the World-Wide Fund for Nature and the Nature Conservancy (https://naturalcapitalproject.stanford.edu/invest/), for the quantitative evaluation of variable ecosystem services. In this study, we adopted the Water Yield Model to evaluate the annual water yield of the Beiyun River Basin in 2000 and 2010. The Water Yield Model is based on the principle of water balance: The water yield in a grid unit is equal to the amount of rainfall minus the actual evapotranspiration. The total water yield includes surface runoff, soil water content, water holding capacity of litter and canopy interception, and it does not distinguish between surface runoff, soil middle flow and underground runoff. Therefore, the more water yield in a certain area, the more water supply. The annual water yield of each grid (Yx) on the landscape (indexed by x = 1, 2, … X) was defined as follows:
Y x = ( 1 A E T x P x ) × P x ,
where AETx represents the annual actual evapotranspiration of grid x, and Px represents the annual precipitation of grid x.
The evapotranspiration portion can be estimated through Budyko’s Hypothermal Coupling Equilibrium Assumption Formula proposed in 2004 [34],
A E T x P x = 1 + P E T x P x [ 1 + ( P E T x P x ) ω ] 1 ω ,
where PETx indicates potential evapotranspiration and ω(x) indicates non-physical parameters of natural climate–soil properties, which are defined as follows:
P E T x = K c ( l x ) × E T 0 x ,
ω ( x ) = Z A W C x P x + 1.25 ,
A W C x = min ( max   s o i l   d e p t h ,   r o o t   d e p t h ) × P A W C   ,
where E T 0 x represents the reference crop evapotranspiration of grid x, and K c ( l x ) represents the plant (vegetation) evapotranspiration coefficient of the specific soil and land cover type in grid x. A W C x means the plant-available water content (mm) that can be held and released in the soil for plant use, the value of which is determined by the soil texture and effective soil depth. max   s o i l   d e p t h means the maximum soil depth, r o o t   d e p t h represents the root depth coefficient. P A W C is the amount of water used by plants, which is equal to the difference between field capacity and wilting point Z is a seasonality parameter that represents seasonal rainfall depths and distribution, ranging from 1 to 30. According to the InVEST user’s guide, Z is positively correlated with the annual average number of local rain days, N and that Z may be close to N/5 [35].

3.2. Construction of the Evaluation Index System of Urbanisation

3.2.1. Quantitative Assessment of the Urbanisation Level in the Beiyun River Basin

There are two types of methods for measuring the urbanisation level, the single index method and the compound index method. However, the impacts of urbanisation are abundant and complicated, reflecting not only changes in the population characteristics of a region but also changes in the economic development levels, land use structures and evolution of landscape patterns of the region and urbanisation also impacts improvements to people’s quality of life, including social, demographic, spatial and economic transformations and other aspects [36,37,38]. As the single index method has many specific limitations and is unable to fully describe the urbanisation level, we adopted the compound index method. According to the connotation of urbanisation and the availability of data, the evaluation of the urbanisation level in our study was performed from three aspects: economic urbanisation, population urbanisation and spatial urbanisation; the actual indexes were the permanent population (POP), the gross domestic product (GDP) and the proportion of construction land area (CL) of the Beiyun River Basin.

3.2.2. Changes in Landscape Patterns

The temporal and spatial characteristics of landscape pattern changes could reflect the impacts of urbanisation on ecological situations, and the ecological consequences of urbanisation can be assessed by applying landscape metrics to describe and analyse the dynamic changes of regional landscapes [39,40,41]. Referring to previous studies on urbanisation [42,43,44], changes in landscape patterns of the Beiyun River Basin were represented by five landscape indexes, including patch richness density (PRD), Shannon’s diversity index (SHDI), patch density (PD), aggregation index (AI) and splitting index (SPLIT). Among them, PRD and SPLIT could reflect the fragmentation information. AI was used to assess the spatial distribution of patch types. SHDI and PRD were used to quantify the structural components of the diversity situation. The detailed ecological meanings and mathematical expressions of the five landscape indexes are displayed in Table 2. These landscape indexes were calculated by Fragstats 4.0 using the moving window analysis.

3.2.3. The Evaluation Index System of Urbanisation Impacts

To comprehensively assess the impacts of urbanisation, we selected all three urbanisation level indexes and five landscape indexes as potential indicators of urbanisation impacts. As water yield is defined as the difference between precipitation and evapotranspiration, climate factors including the average annual temperature and precipitation were also added as the complementary explanatory variables of water yield [8,45]. In total, 10 indexes were selected to detect the driving forces of water yield service, including the patch richness density (PRD), Shannon’s diversity index (SHDI), patch density (PD), aggregation index (AI), splitting index (SPLIT), permanent population per square kilometre (POP), gross domestic product (GDP), proportion of construction land area (CL), annual average precipitation (AP) and annual average temperature (AT).

3.3. The Geographical Detector

Geo-detector is a method developed by Wang et al. from the Institute of Geographic Sciences and Natural Resources Research, Chinese Academy of Sciences. The method is based on the assumption that if an independent variable has a significant influence on a dependent variable, the spatial distribution of the independent variables and dependent variables should share similar characteristics [31,46]. Geo-detector is a set of statistical methods used to detect spatial stratified heterogeneity and to reveal the driving forces behind it. It can not only quantitatively determine how much a driving force can explain the spatial disparities of the dependent variable but also detect whether there is an interaction between the driving forces and determine the strengths and directions of the interaction. Geo-detector consists of 4 functions: (1) The factor detector measures the influence power of factor X to the spatial distribution of variable Y; (2) the interaction detector indicates whether the factors X1 and X2 (and more X) have an interactive influence on variable Y; (3) the risk detector reveals whether the differences between the mean attribute values of two sub-regions of factor X are significant; (4) the ecological detector determines the differences between the two factors X1 and X2.
In this study, we selected the factor detector and interaction detector to reveal the driving forces and their influencing mechanism of water yield in 2000 and 2010. All the tasks are implementable by q-statistic. The formula is as follows:
q = 1 1 N × σ 2 h = 1 L N h σ h 2
where q represents the explanatory power of driving force X to water yield, ranging from 0 to 1; N and σ 2 stand for the sample size and variance of the study area, respectively; L is the classification number of driving force; N h and σ h 2 , respectively, stand for the sample size and the variance of water yield in class h [47,48].
The main data preparation and treatment processes were as follows: (1) by the zonal statistic tool of ArcGIS 10.2, the raster values of water yield and selected factors of the 69 subwatersheds were extracted and output in the form of Excel; (2) all the numerical independent variables were discretised by the equal interval method in SPSS 20.0; (3) the 69 samples including values of the dependent variable and 10 kinds of stratified factors were input into Geo-detector; (4) click on the “Run” button, we could obtain the detection results.

4. Results

4.1. The Water Yield Service of the Beiyun River Basin in 2000 and 2010

According to statistics from the Beijing Meteorological Bureau (http://bj.cma.gov.cn/), the annual average number of rainy days in Beijing was 66.3, which means the Z value was close to 13.26. Contrasting with the observed data sets acquired from the Beiyun River Waterworks Annual Report (2010), we conducted the calibration and adjustment of Z value and found when the Z value was 12, we obtained the closest results to the actual water yields (12.54 × 10⁸ m3), the relative error was 2.56%.
The spatial distributions of water yields in 2000 and 2010 are shown in Figure 3. The water yield in the Beiyun River Basin increased from 2000 to 2010. The total water yield of this basin increased from 9.52 × 10⁸ m3 in 2000 to 12.84 × 10⁸ m3 in 2010, with an increase of 34.87%. The average water yield of each grid was 203.67 millimetres and 278.2 millimetres in 2000 and 2010, respectively. The areas of low water yield grids were shrinking, while the areas of high water yield grids were expanding. In the same year, the spatial distribution of water yield per unit area was uneven, high water yield areas were concentrated in the central part of the river basin, and the water yield gradually decreased as the areas stretched away from the central basin. Comparing different years, the distribution patterns of water yield in the basin were relatively consistent: Regions with high water yield were accumulated in the middle of basin, and regions with low water yield always occupied the north areas of the basin.

4.2. Changes in the Beiyun River Basin under Urbanisation in 2000 and 2010

4.2.1. The Urbanisation Level Changes in 2000 and 2010

The trends of the three types of urbanisation in the Beiyun River Basin are shown in Table 3, and their spatial distributions are shown in Figure 4. Referring to spatial urbanisation, the proportion of construction land area of the whole basin has increased from 29.6% (in 2000) to 40.1% (in 2010). The GDP of the Beiyun River Basin was 1040.58 RMB in 2000; then, it continuously increased, reaching 6498.25 RMB in 2010. The permanent population in this basin increased by an average of 784 people per square kilometre from 2000 to 2010.

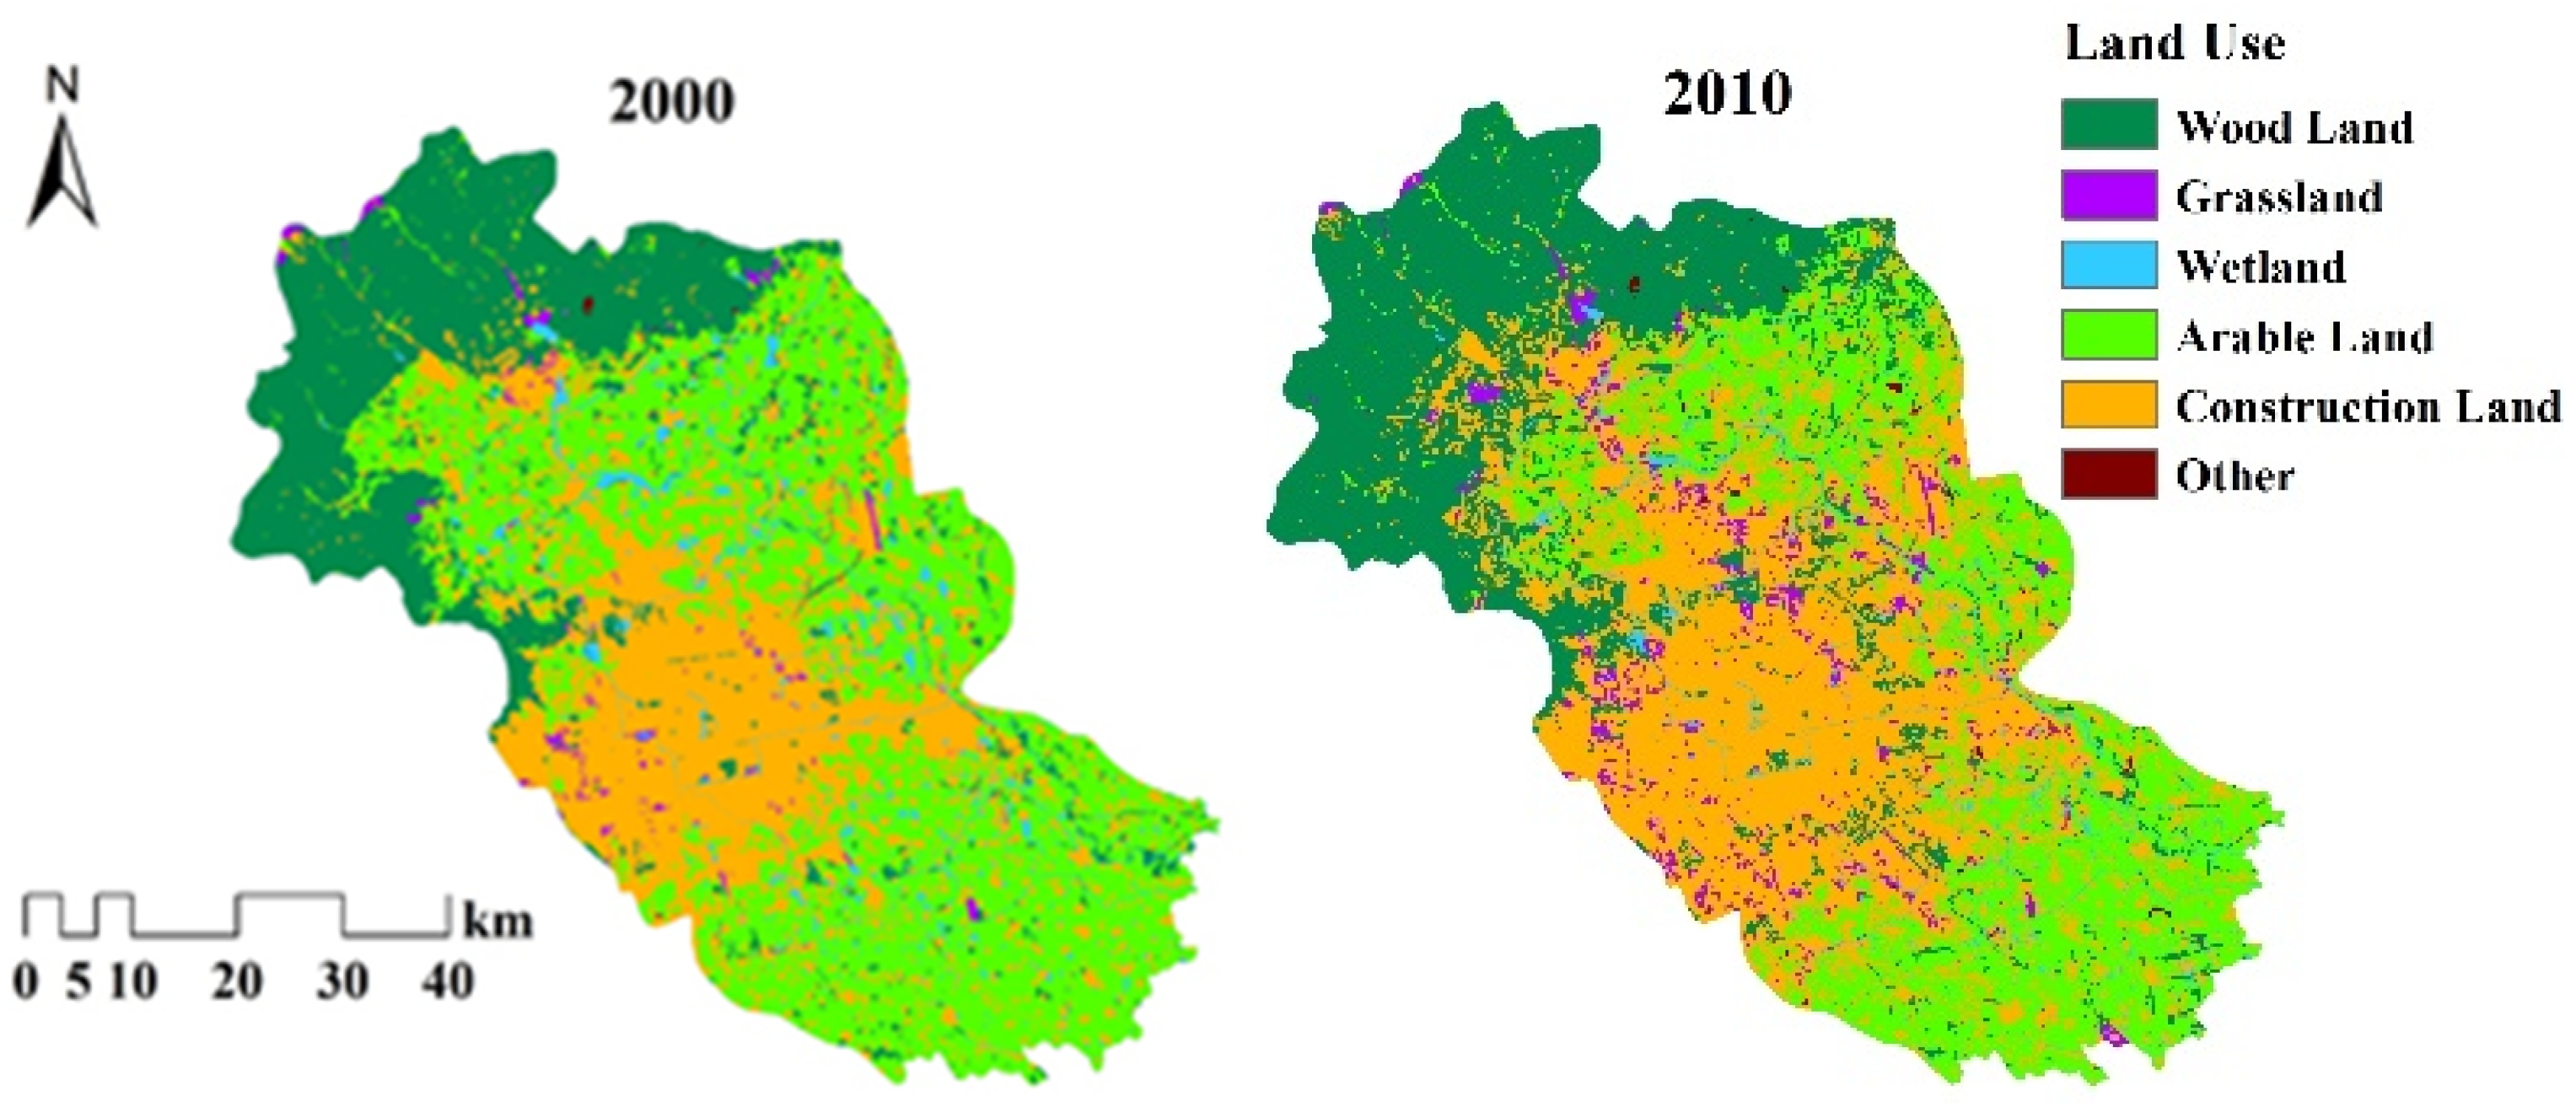
4.2.2. The Land Use and Landscape Pattern Changes in 2000 and 2010

The land use pattern in the Beiyun River Basin changed greatly from 2000 to 2010 (Figure 5). The range of construction land in this river basin continuously expanded from the centre to the north and south areas in 2000 and 2010. The area of woodland spread with the shrinking of grasslands. Meanwhile, the landscape pattern changed substantially (Table 4). PD, SPLIT and SHDI continuously increased, which reflected highly intense human activities during urbanisation that greatly changed the river basin’s landscape patterns. In addition, the basically unchanged PRD and the decreasing AI showed an increase in landscape heterogeneity.

4.3. Results of Geo-Detector

4.3.1. Factor Detection

Using the factor detector in Geo-detector, the q statistic value of each influencing factor is shown in Table 5. The q-value of the driving forces in 2000 can be ranked as CL (0.7020) > SHDI (0.6487) > AP (0.6071) > PRD (0.5257) > AI (0.4525) > SPLIT (0.4355) > PD (0.3652) > AT (0.3329) > GDP (0.2266) > POP (0.1470). CL was the foremost factor in explaining the spatial variability of water yield. In 2010, nearly all the explanatory power of the driving forces showed a decreasing trend when contrasted with those in 2000, except for AP and GDP. During the decade, PRD, SHDI, AI, CL and AP were the driving forces that continuously contributed more than 30% of the spatial variability of water yield in the Beiyun River Basin. The explanatory power of POP was always the weakest factor during 2000 and 2010, at no more than 0.15.

4.3.2. Interaction Detector

The interaction result is shown in Figure 6. Compared with the results of the factor detector, we find that the explanatory power of the interaction between any two driving forces on water yield was greater than that of any single factor. The interaction between CL or AP and any other factors continuously maintained more than 70% explanatory power of water yield from 2000 to 2010. In 2000, the interaction between GDP and SPLIT reached the strongest explanatory power (0.98) among all the interactions. In 2010, the interactions between SPLIT and AT or AP showed the largest contributions of 0.96.

5. Discussion

5.1. The Impact of Landscape Pattern on Water Yield

The five selected landscape indexes (PRD, SHDI, PD, AI and SPLIT) all contributed to the spatial distribution of water yield. Along with the increase in PD, SPLIT and SHDI, the water yield of the Beiyun River Basin had a growth rate of 34.9%. This is mainly because the increasing landscape indexes generally indicated highly intense human activities during urbanisation, which resulted in a dramatic increase in construction lands and landscape fragmentation. When the construction land expanded, the area of the impervious surface increased, which decreased the evapotranspiration and the infiltration of precipitation, consequently increasing the local water yield [15]. According to the research on the effects of urbanisation on vegetation coverage and landscape patterns in the Beijing–Tianjin–Hebei region, the urbanisation process of the Beijing–Tianjin–Hebei urban agglomeration was remarkable from 2000 to 2010 [47]. Due to city expansion, a large amount of cultivated land around the city was converted to impervious surfaces, and the area increased from 1.79 × 10⁴ km2 in 2000 to 2.16 × 10⁴ km2 in 2010.
Comparing the results of Geo-detector in 2000 and 2010, the explanatory power of each landscape index decreased, while the explanatory power of AP increased from 0.6071 in 2000 to 0.7025 in 2010, indicating that the natural factors gradually played a dominant role in water production. According to the obtained meteorological data, the average annual precipitation of the Beiyun River Basin increased from 428.88 mm in 2000 to 509.11 mm in 2010, with a growth rate of 18.7%, and the average temperature for the corresponding year decreased from 12.1 °C to 11.5 °C. The climate change directly influenced the evapotranspiration and accumulation of precipitation and indirectly influenced the water yield. When interacting with other factors, such as CL, GDP, POP, the explanatory power became much stronger than that of a single factor, and this result is consistent with the findings of research on the impacts of urbanisation and associated factors on ecosystem services [43], in which the explanatory power of the interaction of any two socioeconomic or biophysical factors on ecosystem services was greater than that of a single factor. Additionally, the results of Geo-detector confirmed the conclusion that the effect of urbanisation on ecosystem services strongly depends on natural conditions [49].

5.2. The Impact of the Urbanisation Level on Water Yield

Our explorations have shown that the urbanisation level was continuously increasing in this decade. The explanatory power of POP in the Beiyun River Basin was always the weakest among all 10 factors from 2000 to 2010, even though the growth was as high as 51.6%. The potential reason might be that the population was always concentrated in the constructed area of the city; therefore, its growth does not directly influence the formation of water yield, but it can reflect the distribution and change of GDP and construction land area, maintaining the contribution of POP at close to 0.15. The trend of the contribution of GDP and CL was the opposite. In 2000, the explanatory power of CL was far stronger than that of GDP; then, in 2010, the explanatory power of CL decreased to 0.4438 with the increase in the explanatory power of GDP, with a ratio of 0.4154. The impacts of urbanisation on water yield were mitigated by the increase in precipitation. The results showed that the interaction between CL or AP and any other factors continuously provided more than 70% of the explanatory power to water yield from 2000 to 2010, which implied that the urban ecosystem is a highly complicated socio–economic–natural ecosystem [50,51]. To maintain sustainable urban development and ecological balance, we advise that urban planning should clarify the stage and quality of city development, determine the reasonable scale of the city, and test the actual planning effects in different developing stages.

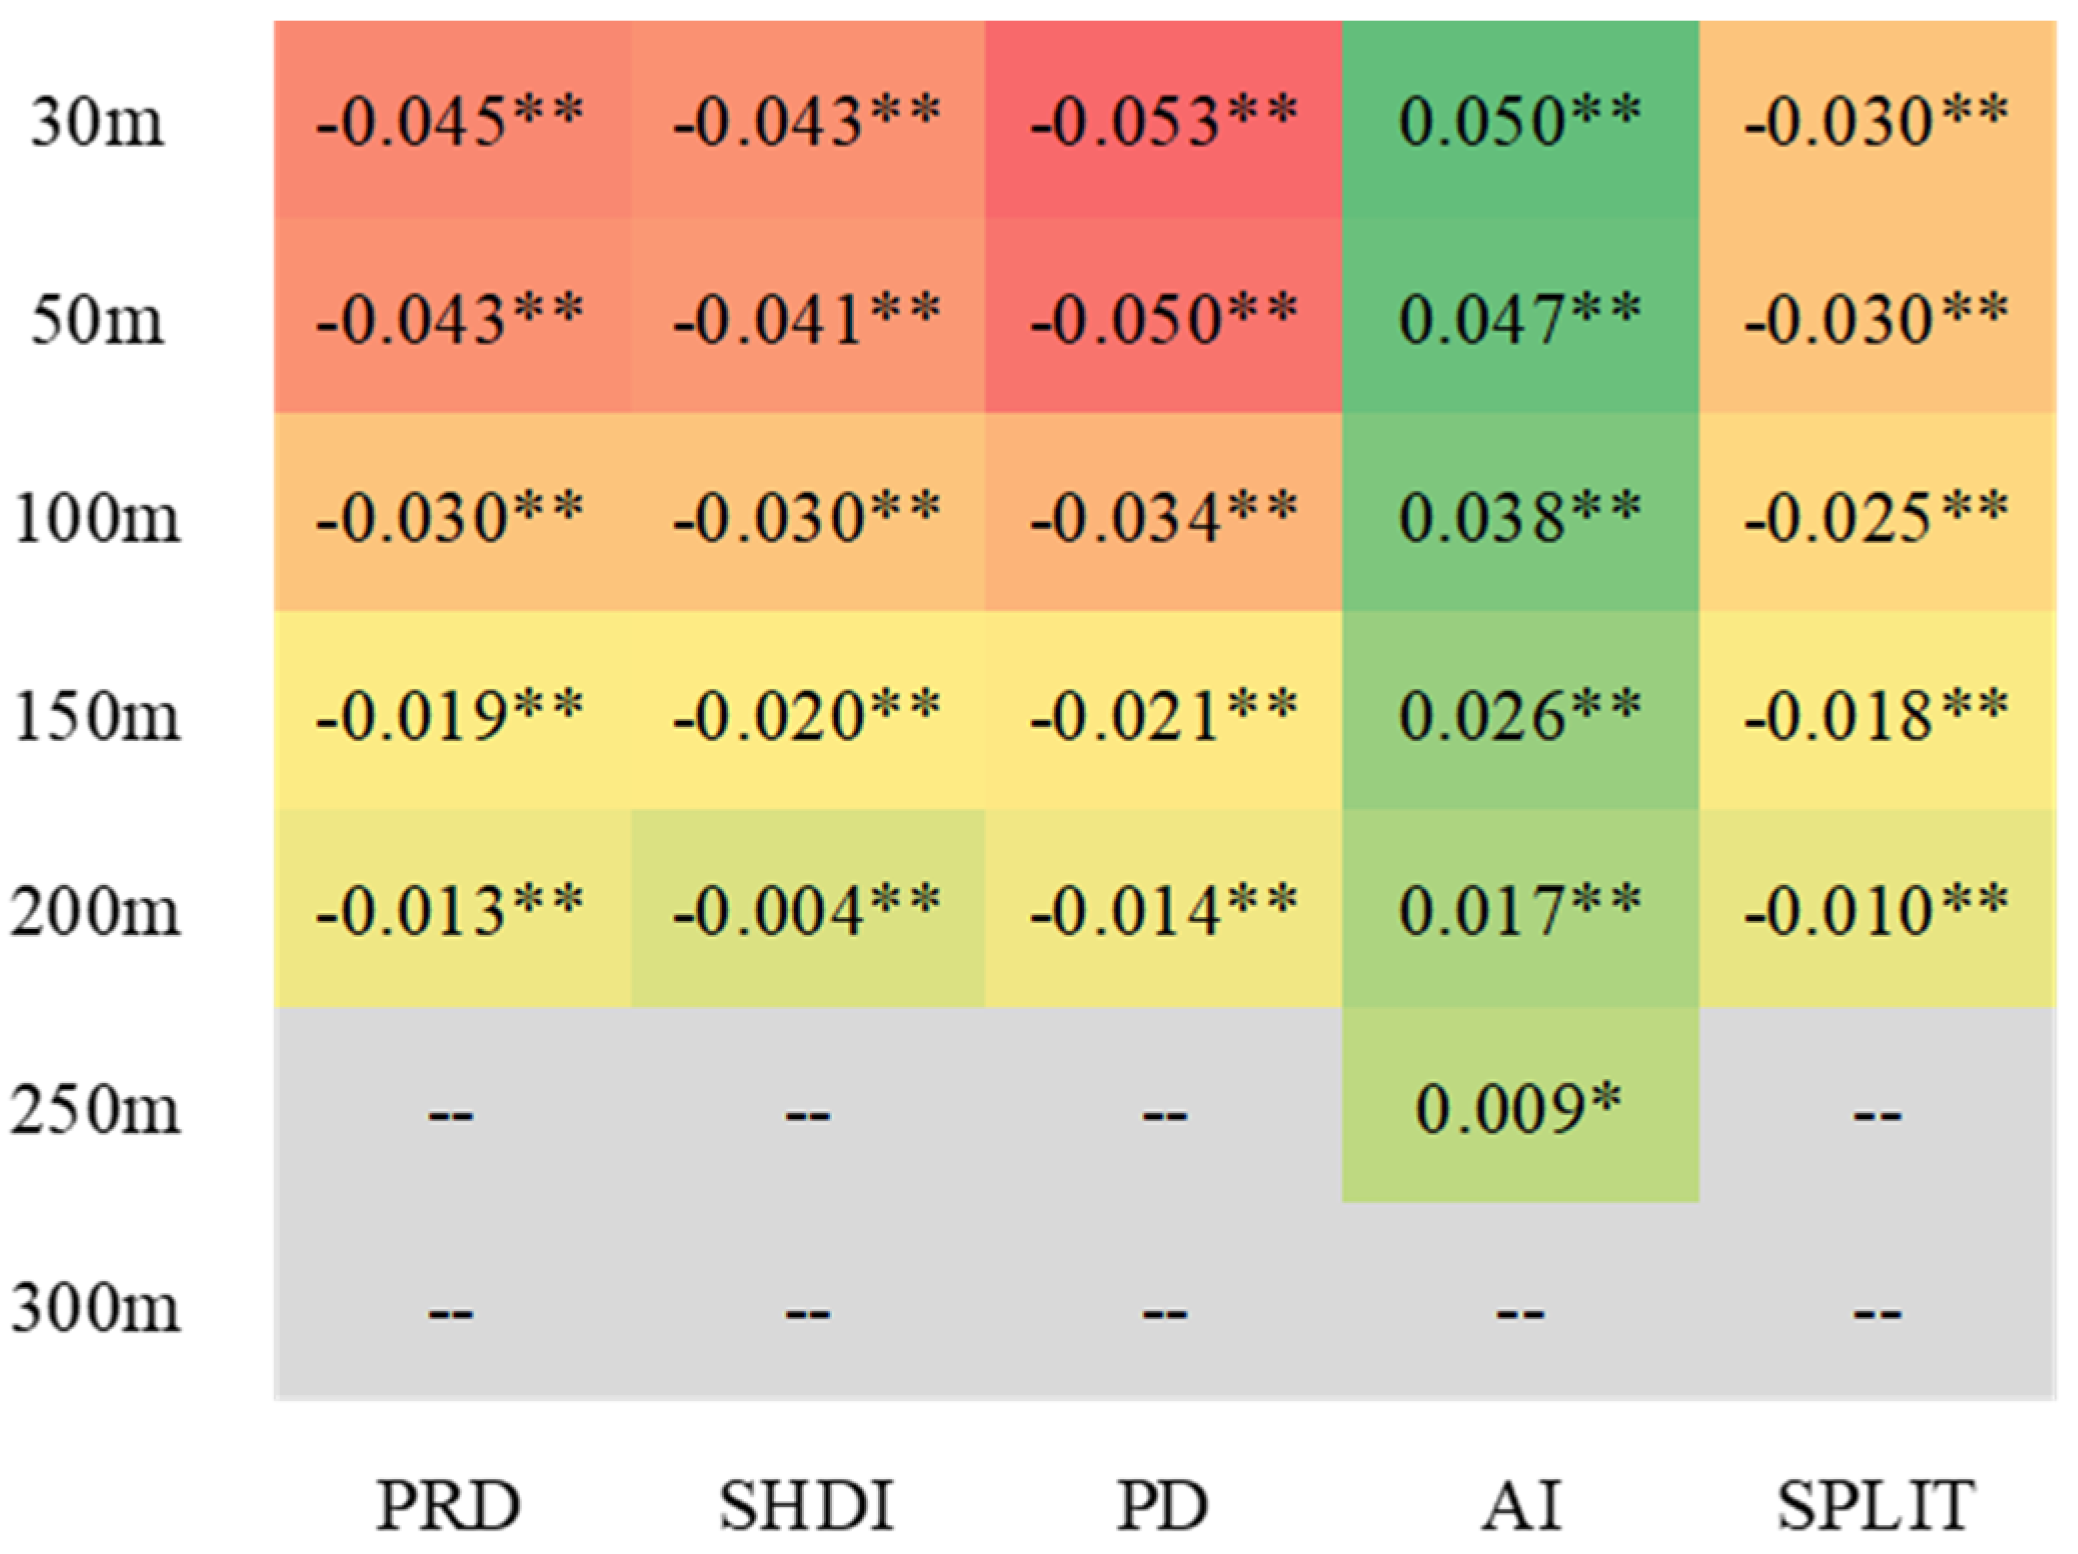
5.3. The Scale Effect of the Correlation between Landscape Index and Water Yield

Our study used five landscape indexes to characterise the landscape pattern of the Beiyun River Basin in 2000 and 2010. The scale was set to 69 subwatersheds with a raster resolution of 30 m. However, many scholars have pointed out that when studying different landscapes or the same landscape at different times, it is necessary to select appropriate landscape indexes and corresponding resolutions because the landscape patterns and processes show different characteristics under different spatial or temporal scales and are regarded as scale effects [52,53,54]. Ecosystem services, as the product of the interaction between natural ecological processes and human processes, also change with scale. Scale issues need to be considered in any aspect of humans changing landscape spatial heterogeneity and affecting the formation and maintenance of ecosystem services. Thus, to obtain a more detailed understanding of the impact of landscape pattern on water yield service, we determined the scale effect of the correlation between landscape pattern and water yield. Operations were conducted as follows: (1) We resampled the land use and water yield raster of the Beiyun River Basin in 2010 into resolutions of 30 m, 50 m, 100 m, 150 m, 200 m, 250 m and 300 m; (2) Fragstats 4.0 was used to calculate the selected five landscape indexes, based on the resampled land use data; (3) values of the raster were extracted to corresponding spatial point data by the Fishnet tool in ArcGIS 10.2; and (4) the correlation between water yield and different landscape indexes was evaluated by means of Pearson correlation coefficients. The results are shown in Figure 7.
As the spatial scale decreased from 300 m to 30 m, the absolute values of the Pearson correlation coefficient gradually increased, and the impacts transformed from not significant to extremely significant, indicating an increase in the correlation between landscape pattern and water yield. At the scale of 300 m and 250 m, nearly all of the factors showed non-significant impacts on water yield, except AI, which shared a significant positive effect on water yield at the scale of 250 m. AI and PD were the two most relevant landscape indexes to annual water yields. Among all indexes, AI was the only one that had a positive correlation with water yield, and all the others were the opposite. The more detailed the spatial scale is, the more significant the correlation is, which indicates that the effect of landscape patterns is stronger when measured in smaller regions. Explicit explanations of this phenomenon need further validation. However, this result also reflects that the scale selection in this research was rational and appropriate.

5.4. Limitations and Future Perspectives

In contrast to the increase in water yield in the Beiyun River Basin, the average water resources of multi-years (1956–2000) decreased from 3.74 billion m3 to 2.23 billion m3 (2001–2009) by approximately 40.3%. Due to the population explosion, the water resources had a considerable reduction from 270 m3 to 114 m3 [55]. To achieve regional sustainable development, it is vital to determine the scale of socioeconomic development that the water resources can carry.
Geo-detector used in our research answered two main questions about the quantification of impacts of urbanisation on water yield in the Beiyun River Basin: (1) which determinants were dominantly responsible for water yield? (2) how did the interactions between the driving forces influence water yield? It enables us to easily take geographical factors into account when analysing correlations between variables with spatial information and to directly reveal the interactions between different factors. However, there are also some limitations to these detectors. One limitation of Geo-detector is that they are not causal. Another limitation is that some driving forces may not present spatial patterns; therefore, our method is not sufficient to reflect all influencing factors, and a field sampling survey for potential factors is necessary to determine the driving forces lacking spatial patterns. Since the explanatory power of driving forces is affected by geographical strata homogeneity, an optimal zonation identified by both optimal classification algorithms and prior knowledge of dependent variables would raise the power of the determinant’s efficiency [31,56].

6. Conclusions

The water yields of the Beiyun River Basin in 2000 and 2010 were simulated based on the datasets of land use, climate, soil properties, terrain and watershed. The results showed that from 2000 to 2010, the water yield of the Beiyun River Basin had an upward trend, and the water yield capacity increased 34.87%. The water yield per unit area in the downstream areas of the basin is obviously higher than that in the upstream areas. The urbanisation levels represented by the three landscapes also increased in this decade. The portion of construction land continuously increased from 29.6% in 2000 to 40.1% in 2010. PD, SPLIT and SHDI continuously increased from 2000 to 2010; PRD was basically unchanged, and the continuously decreasing AI showed that the spatial heterogeneity of the landscape increased. We also found the scale effect in the correlation of the landscape pattern and water yield; that is, as the spatial scale decreased from 350 m to 30 m, the correlation gradually changed from not significant to extremely significant, and the absolute values of the coefficients increased. CL was the predominant factor explaining the spatial variability of water yield in 2000, with a ratio of 0.7020. In 2010, nearly all the explanatory power of the driving forces showed a decreasing trend when contrasted with those in 2000, and AP became the factor with the strongest explanatory power on water yield. From 2000 to 2010, PRD, SHDI, AI, CL and AP were the driving forces whose explanatory powers were always more than 30% for the spatial variability of water yield in the Beiyun River Basin. Our study explored the quantitative relationship between urbanisation and water yield service and provided a framework for analysing the influence of urbanisation on water yield patterns. Conclusions from our study are expected to provide scientific references for similar studies on the correlation between water yield and urbanisation. These would also help reveal the anthropogenic effects of urbanisation on the regional environment and providing support for policymaking in sustainable development.

Author Contributions

Conceptualisation, S.L.; Data curation, J.X.; Formal analysis, J.X.; Funding acquisition, S.L. and Z.S.; Investigation, J.X.; Methodology, J.X.; Project administration, Z.S.; Supervision, S.L.; Validation, J.X.; Visualisation, J.X.; Writing—original draft, J.X.; Writing—review and editing, J.X., S.Z., X.W., X.H. and Y.A.

Funding

This research was funded by the National Natural Sciences Foundation of China grant number [No. 41530635 and No. 41571173] and the National Key Research and Development Project grant number [No. 2016YFC0502103].

Acknowledgments

The research was financially supported by the National Natural Sciences Foundation of China (41530635 and 41571173) and the National Key Research and Development Project (No. 2016YFC0502103).

Conflicts of Interest

The authors declare no conflict of interest.

References

  1. Wang, R.S.; Zhou, Q.X.; Hu, D. Ecological Regulation and Control Measures for Urban Sustainable Development; Meteorological Press: Beijing, China, 2000. [Google Scholar]
  2. Peng, J.; Tian, L.; Liu, Y.X.; Zhao, M.Y.; Hu, Y.N.; Wu, J.S. Ecosystem services response to urbanization in metropolitan areas: Thresholds identification. Sci. Total Environ. 2017, 607, 706–714. [Google Scholar] [CrossRef] [PubMed]
  3. Wu, J.G.; Jenerette, G.D.; Buyantuyev, A.; Redman, C.L. Quantifying spatiotemporal patterns of urbanization: The case of the two fastest growing metropolitan regions in the United States. Ecol. Complex. 2011, 8, 1–8. [Google Scholar] [CrossRef]
  4. Wang, G.F.; Chen, J.C.; Wu, F.; Li, Z.H. An integrated analysis of agricultural water-use efficiency: A case study in the Heihe River Basin in Northwest China. Phys. Chem. Earth 2015, 89–90, 3–9. [Google Scholar] [CrossRef]
  5. Bower, K.M. Water supply and sanitation of Costa Rica. Environ. Earth Sci. 2014, 71, 107–123. [Google Scholar] [CrossRef]
  6. Hess, L.; Meir, P.; Bingham, I.J. Comparative assessment of the sensitivity of oilseed rape and wheat to limited water supply. Ann. Appl. Biol. 2015, 167, 102–115. [Google Scholar] [CrossRef]
  7. Li, Y.X.; Zhang, W.F.; Ma, L.; Huang, G.Q.; Oenema, O.; Zhang, F.S.; Dou, Z.X. An Analysis of China’s Fertilizer Policies: Impacts on the Industry, Food Security, and the Environment. J. Environ. Qual. 2013, 42, 972–981. [Google Scholar] [CrossRef]
  8. Lu, N.; Sun, G.; Feng, X.; Fu, B. Water yield responses to climate change and variability across the North–South Transect of Eastern China (NSTEC). J. Hydrol. 2013, 481, 96–105. [Google Scholar] [CrossRef]
  9. Smith, L.E.D.; Siciliano, G. A comprehensive review of constraints to improved management of fertilizers in China and mitigation of diffuse water pollution from agriculture. Agric. Ecosyst. Environ. 2015, 209, 15–25. [Google Scholar] [CrossRef] [Green Version]
  10. Xie, G.D.; Zhang, B.; Lu, C.X.; Xiao, Y.; Liu, C.L.; Zhang, B.; Xu, Q.; Li, L.J.; Cao, Z.P.; Li, N.; et al. Resource and environment effects of urban expansion in Beijing. Resour. Sci. 2015, 37, 1108–1114. [Google Scholar]
  11. Gi, L.N.; Yu, H.Z.; Liu, Y.; Yang, B. Analysis of the results of the water resources survey of Beiyun River from 2010 to 2011. Beijing Water 2016, 3, 9–11. [Google Scholar]
  12. Wang, X.C.; Ji, L.N. Water resources utilization brings opportunities and challenges to the Beiyun River. Beijing Water 2012, 1, 31–32, 38. [Google Scholar]
  13. Tian, Z.J. Analysis of the influence of hydrology and water resources on urbanization development. Jilin Agric. 2019, 5, 50. [Google Scholar]
  14. Gu, X.Y.; Xu, Z.X.; Wang, M.; Yin, X.W.; Liu, L.F.; Zuo, D.P. Evaluation of benthic community structure and water environment quality in the Beiyun River water system. J. Lake Sci. 2017, 29, 1444–1454. [Google Scholar]
  15. Gao, J.; Li, F.; Gao, H.; Zhou, C.B.; Zhang, X.L. The impact of land-use change on water-related ecosystem services: A study of the Guishui River Basin, Beijing, China. J. Clean. Prod. 2017, 163, S148–S155. [Google Scholar] [CrossRef]
  16. Sanchez-Canales, M.; Benito, A.L.; Passuello, A.; Terrado, M.; Ziv, G.; Acuna, V.; Schuhmacher, M.; Elorza, F.J. Sensitivity analysis of ecosystem service valuation in a Mediterranean watershed. Sci. Total Environ. 2012, 440, 140–153. [Google Scholar] [CrossRef]
  17. Goldstein, J.H.; Caldarone, G.; Duarte, T.K.; Ennaanay, D.; Hannahs, N.; Mendoza, G.; Polasky, S.; Wolny, S.; Daily, G.C. Integrating ecosystem-service tradeoffs into land-use decisions. Proc. Natl. Acad. Sci. USA 2012, 109, 7565–7570. [Google Scholar] [CrossRef] [Green Version]
  18. Huang, B.Q.; Huang, J.L.; Li, X.; Tu, Z.S. Spatio-temporal dynamic change analysis of coastal ecosystem service value based on GIS and InVEST model—A case study of longhai city. Ocean Environ. Sci. 2015, 34, 916–924. [Google Scholar]
  19. Marques, M.; Bangash, R.F.; Kumar, V.; Sharp, R.; Schuhmacher, M. The impact of climate change on water provision under a low flow regime: A case study of the ecosystems services in the Francoli river basin. J. Hazard. Mater. 2013, 263, 224–232. [Google Scholar] [CrossRef]
  20. Shoyama, K.; Yamagata, Y. Predicting land-use change for biodiversity conservation and climate-change mitigation and its effect on ecosystem services in a watershed in Japan. Ecosyst. Serv. 2014, 8, 25–34. [Google Scholar] [CrossRef]
  21. Mafios, E.; Burney, J. Ecosystem Services Mapping for Sustainable Agricultural Water Management in California’s Central Valley. Environ. Sci. Technol. 2017, 51, 2593–2601. [Google Scholar]
  22. Logsdon, R.A.; Chaubey, I. A quantitative approach to evaluating ecosystem services. Ecol. Model. 2013, 257, 57–65. [Google Scholar] [CrossRef]
  23. Polasky, S.; Nelson, E.; Pennington, D.; Johnson, K.A. The Impact of Land-Use Change on Ecosystem Services, Biodiversity and Returns to Landowners: A Case Study in the State of Minnesota. Environ. Resour. Econ. 2011, 48, 219–242. [Google Scholar] [CrossRef]
  24. Cui, Q.; Wang, X.; Li, C.H.; Cai, Y.P.; Liu, Q.; Li, R. Ecosystem service value analysis of CO2 management based on land use change of Zoige alpine peat wetland, Tibetan Plateau. Ecol. Eng. 2015, 76, 158–165. [Google Scholar] [CrossRef]
  25. Fang, X.; Tang, G.A.; Li, B.C.; Han, R.M. Spatial and Temporal Variations of Ecosystem Service Values in Relation to Land Use Pattern in the Loess Plateau of China at Town Scale. PLoS ONE 2014, 9, e110745. [Google Scholar] [CrossRef]
  26. Hu, C.X.; Guo, X.D.; Lian, G.; Zhang, Z.M. Impact of land use change on ecosystem service value in rapidly urbanized regions of the Yangtze river delta—A case study of jiaxing city. Resour. Environ. Yangtze Basin 2017, 26, 333–340. [Google Scholar]
  27. Xu, S.N.; Liu, Y.F.; Wang, X.; Zhang, G.X. Scale effect on spatial patterns of ecosystem services and associations among them in semi-arid area: A case study in Ningxia Hui Autonomous Region, China. Sci. Total Environ. 2017, 598, 297–306. [Google Scholar] [CrossRef]
  28. Zhou, W.; Gang, C.C.; Zhou, F.C.; Li, J.L.; Dong, X.G.; Zhao, C.Z. Quantitative assessment of the individual contribution of climate and human factors to desertification in northwest China using net primary productivity as an indicator. Ecol. Indic. 2015, 48, 560–569. [Google Scholar] [CrossRef]
  29. Zou, J.L.; Wang, J.Z.; Wang, P.; Le, W.N. Response of ecosystem service value based on land use changes and analysis of its driving factors in typical hilly region with red Soil. Agric. Sci. Technol. 2011, 11, 150–154. [Google Scholar]
  30. Feng, X.; Fu, B.; Lu, N.; Zeng, Y.; Wu, B. How ecological restoration alters ecosystem services: An analysis of carbon sequestration in China’s Loess Plateau. Sci. Rep. 2013, 3, 2846. [Google Scholar] [CrossRef]
  31. Wang, J.F.; Li, X.H.; Christakos, G.; Liao, Y.L.; Zhang, T.; Gu, X.; Zheng, X.Y. Geographical Detectors-Based Health Risk Assessment and its Application in the Neural Tube Defects Study of the Heshun Region, China. Int. J. Geogr. Inf. Sci. 2010, 24, 107–127. [Google Scholar] [CrossRef]
  32. Jansson, A. Reaching for a sustainable, resilient urban future using the lens of ecosystem services. Ecol. Econ. 2013, 86, 285–291. [Google Scholar] [CrossRef]
  33. Jones, K.B.; Zurlini, G.; Kienast, F.; Petrosillo, I.; Edwards, T.; Wade, T.G.; Li, B.L.; Zaccarelli, N. Informing landscape planning and design for sustaining ecosystem services from existing spatial patterns and knowledge. Landsc. Ecol. 2013, 28, 1175–1192. [Google Scholar] [CrossRef]
  34. Zhang, L.; Hickel, K.; Dawes, W.R.; Chiew, F.H.S.; Western, A.W.; Briggs, P.R. A rational function approach for estimating mean annual evapotranspiration. Water Resour Res. 2004, 40, 14. [Google Scholar] [CrossRef]
  35. Sharp, R.; Tallis, H.T.; Ricketts, T.; Guerry, A.D.; Wood, S.A.; Chapin-Kramer, R.; Nelson, E.; Ennaanay, D.; Wolny, S.; Olwero, N.; et al. In VEST 3.2.0 User’s Guide; The Natural Capital Project, Stanford University, University of Minnesota, The Nature Conservancy, and World Wildlife Fund: Morges, Switzerland, 2015. [Google Scholar]
  36. Wang, H.J.; He, Q.Q.; Liu, X.J.; Zhuang, Y.H.; Hong, S. Global urbanization research from 1991 to 2009: A systematic research review. Landsc. Urban. Plan. 2012, 104, 299–309. [Google Scholar] [CrossRef]
  37. Wang, X.K.; Ouyang, Z.Y.; Ren, Y.F.; Wang, H.F. The Long-term Research Prospect of Urban Ecosystem. Adv. Earth Sci. 2009, 24, 928–935. [Google Scholar]
  38. Zhang, T.S.; Liang, J.S.; Song, J.P. A review of the research on the measurement of urbanization level in China. Urban. Dev. Res. 2002, 2, 36–41. [Google Scholar]
  39. Li, H.L.; Peng, J.; Liu, Y.X.; Hu, Y.N. Urbanization impact on landscape patterns in Beijing City, China: A spatial heterogeneity perspective. Ecol. Indic. 2017, 82, 50–60. [Google Scholar] [CrossRef]
  40. Peng, J.; Xie, P.; Liu, Y.X.; Ma, J. Urban thermal environment dynamics and associated landscape pattern factors: A case study in the Beijing metropolitan region. Remote Sens Environ. 2016, 173, 145–155. [Google Scholar] [CrossRef]
  41. Schwoertzig, E.; Poulin, N.; Hardion, L.; Trémolières, M. Plant ecological traits highlight the effects of landscape on riparian plant communities along an urban–rural gradient. Ecol. Indic. 2016, 61, 568–576. [Google Scholar] [CrossRef]
  42. Shen, Z.Y.; Hou, X.S.; Li, W.; Aini, G.Z.; Chen, L.; Gong, Y.W. Impact of landscape pattern at multiple spatial scales on water quality: A case study in a typical urbanised watershed in China. Ecol. Indic. 2015, 48, 417–427. [Google Scholar] [CrossRef]
  43. Zhang, Y.Q.; Liu, S.L.; Cheng, F.Y.; Shen, Z.Y. WetSpass-Based Study of the Effects of Urbanization on the Water Balance Components at Regional and Quadrat Scales in Beijing, China. Water 2017, 10, 5. [Google Scholar] [CrossRef]
  44. Zhang, M.; Gong, Z.; Zhao, W.; Duo, A. Landscape pattern change and the driving forces in Baiyangdian wetland from 1984 to 2014. Acta Ecol. Sin. 2016, 36, 4780–4791. [Google Scholar]
  45. Sun, G.; McNulty, S.G.; Lu, J.; Amatya, D.M.; Liang, Y.; Kolka, R.K. Regional annual water yield from forest lands and its response to potential deforestation across the southeastern United States. J. Hydrol. 2005, 308, 258–268. [Google Scholar]
  46. Wang, J.F.; Hu, Y. Environmental health risk detection with Geo-Detector. Environ. Model. Softw. 2012, 33, 114–115. [Google Scholar]
  47. Wang, J.; Zhou, W.Q.; Xu, K.P.; Yan, J.L. Effects of urbanization on vegetation coverage and landscape pattern in Beijing-Tianjin-Hebei region. Acta Ecol. Sin. 2017, 37, 7019–7029. [Google Scholar]
  48. Zhang, Y.; Lu, X.; Liu, B.; Wu, D. Impacts of Urbanization and Associated Factors on Ecosystem Services in the Beijing-Tianjin-Hebei Urban Agglomeration, China: Implications for Land Use Policy. Sustainability 2018, 10, 4334. [Google Scholar] [CrossRef]
  49. Alberti, M.; Marzluff, J.M.; Shulenberger, E.; Bradley, G.; Ryan, C.; Zumbrunnen, C. Integrating humans into ecology: Opportunities and challenges for studying urban ecosystems. Bioscience 2003, 53, 1169–1179. [Google Scholar]
  50. Ma, S.J.; Wang, R.S. Socio-economic-natural complex ecosystem. Acta Ecol. Sin. 1984, 1, 1–9. [Google Scholar]
  51. Li, X.Z.; Xiao, D.N. Discussion on lanscape ecology in cities. Urban. Environ. Urban. Ecol. 1995, 2, 26–30. [Google Scholar]
  52. ONeill, R.V.; Hunsaker, C.T.; Timmins, S.P.; Jackson, B.L.; Jones, K.B.; Riitters, K.H.; Wickham, J.D. Scale problems in reporting landscape pattern at the regional scale. Landsc. Ecol. 1996, 11, 169–180. [Google Scholar] [CrossRef]
  53. Wu, J.G. Top ten research topics in landscape ecology. Acta Ecol. Sin. 2004, 9, 2074–2076. [Google Scholar]
  54. Chen, L.D.; Liu, Y.; Lv, Y.H.; Feng, X.M.; Fu, B.J. Landscape pattern analysis in landscape ecology: Current, challenges and future. Acta Ecol. Sin. 2008, 28, 5521–5531. [Google Scholar]
  55. Zhang, C.Q.; Li, W.H.; Zhang, W.; Liu, M.C. Analysis of water production in Xitiaoxi River Basin based on InVEST model. J. Resour. Ecol. 2012, 3, 50–54. [Google Scholar]
  56. Li, S.; Zheng, Y.; Luo, P.; Wang, X.; Li, H.; Lin, P. Desertification in Western Hainan Island, China (1959 to 2003). Land Degrad Dev. 2007, 18, 473–485. [Google Scholar] [CrossRef]
Figure 1. Location map of the Beiyun River Basin in Beijing.
Sustainability 11 04361 g001
Figure 2. Research contents and main analysis steps.
Sustainability 11 04361 g002
Figure 3. The water yield per unit area of the Beiyun River Basin in 2000 and 2010.
Sustainability 11 04361 g003
Figure 4. Spatial distribution of three types of urbanisation level in 2000 and 2010. GDP—gross domestic product.
Sustainability 11 04361 g004aSustainability 11 04361 g004b
Figure 5. The land use of the Beiyun River Basin in 2000 and 2010.
Sustainability 11 04361 g005
Figure 6. Results of the interaction detector. PRD—patch richness density; SHDI—Shannon’s diversity index; PD—patch density; AI—aggregation index; SPLIT—splitting index; CL—proportion of construction land area; AP—annual average precipitation; AT—annual average temperature; GDP—gross domestic product; POP—permanent population per square kilometre.
Sustainability 11 04361 g006
Figure 7. The correlation between water yield and landscape pattern at multiple spatial scales. PRD—patch richness density; SHDI—Shannon’s diversity index; PD—patch density; AI—aggregation index; SPLIT—splitting index; the red colour represents a negative effect; the green colour represents a positive effect; the deeper the colour, the stronger the effect; the symbol “--” means the correlation was not significant; the symbol “*” means the correlation was significant (p < 0.05); the symbol “**” means the correlation was highly significant (p < 0.01).
Sustainability 11 04361 g007
Table 1. The data sources and pre-treatment processes.
Data TypeSource and Preprocessing
Land use/cover type data
Socioeconomic data (population, GDP)
Chinese Academy of Sciences Resource and Environmental
Science Data Center (http://www.resdc.cn)
Soil data (type, composition, etc.)
Terrain data (DEM, 30 m resolution)
Meteorological data (precipitation, temperature, solar radiation, etc.)China Meteorological Science Data Sharing Service Network
(http://cdc.cma.gov.cn)
Watershed and subwatershedSWAT model was used to extract boundaries through the DEM data
Runoff dataBeijing Water Resources Bulletin (2000–2010)
Table 2. Detailed ecological meanings of the selected landscape indexes.
Landscape IndexesFormulasEcological Meanings
Patch Density (PD)PD = N/AThe larger the PD, the higher degree of landscape fragmentation
Splitting Index (SPLIT)SPLIT = A 2 i = 1 m j = 1 n a i j 2 SPLIT reflects the subdivision degree of landscape
Patch Richness Density (PRD)PRD = m/AThe larger the PRD, the more patch types
Shannon’s Diversity Index (SHDI)SHDI = i = 1 m ( p i × ln p i ) SHDI represents the abundance and distribution of various landscape types
Aggregation Index (AI)AI = ( i = 1 m ( g i i m a x g i i ) p i )AI implies the concentration degree of patches
Table 3. Different types of urbanisation levels in 2000 and 2010. GDP—gross domestic product.
Proportion of Construction Land (%)GDP (RMB/km2)Permanent Population (individual/km2)
200029.601040.581520
201040.106498.252304
Table 4. The landscape indexes of the Beiyun River Basin in 2000 and 2010. PD—patch density; SPLIT—splitting index; PRD—patch richness density; SHDI—Shannon’s diversity index; AI—aggregation index.
Landscape IndexPDSPLITPRDSHDIAI
20001.2833.730.011.7394.50
20101.3671.530.011.8193.65
Table 5. The contributions of the 10 influencing factors to water yield. PRD—patch richness density; SHDI—Shannon’s diversity index; PD—patch density; AI—aggregation index; SPLIT—splitting index; POP—permanent population per square kilometre; GDP—gross domestic product; CL—proportion of construction land area; AP—annual average precipitation; AT—annual average temperature.
PRDSHDIPDAISPLIT
20000.52570.64870.36520.45250.4355
20100.36930.33070.29020.34110.2970
POPGDPCLAPAT
20000.14700.22660.70200.60710.3329
20100.14640.41540.44380.70250.2555

