Article

Studies on Crop Yields and Their Extreme Value Analysis over India

1
Atmospheric Science Research Laboratory, Department of Physics, SRM Institute of Science and Technology, Tamilnadu 603203, India
2
Laboratory for Analyzing and Processing Satellite Images, Federal University of Alagoas, Av. Lourival Melo Mota, s/n, Tabuleiro do Martins, Maceió 57072-900, Brazil
3
Centre for Climate Change Research, Indian Institute of Tropical Meteorology, Pune, Maharashtra 411008, India
*
Author to whom correspondence should be addressed.
Sustainability 2019, 11(17), 4657; https://doi.org/10.3390/su11174657
Submission received: 6 June 2019 / Revised: 2 August 2019 / Accepted: 9 August 2019 / Published: 27 August 2019

Abstract

:
Trends of rice, wheat, maize, sorghum (jowar) and pearl millet (bazra) yields of India are studied in relation to water irrigation for the period 1951 to 2012. These crop yields have been subjected to correlation with the Normalized Difference Vegetation Index (NDVI), obtained from NOAA Advanced Very High Resolution Radiometer (AVHRR) (for 1982 to 2000) and Moderate Imaging Spectroradiometer (MODIS) Terra (for 2001 to 2012) to understand the linear association among them. Crop products and food inadequacy in percentage along with the average food production rate, available from FAO have been used in the present study. The present study mainly focuses on the estimation of return values of crop yields for different periods using Gumbell Extreme Value analysis. The present study is very important in the context of increased global food demands by 2050 where in many studies report that food production to be doubled by the year 2050 to meet the demands of increasing population. The main results of the study are: (i) significant positive correlations between NDVI and the crop yields during the study period; (ii) rice, maize and jowar yields did not show the required incremental rate while wheat and bajra yields are able to meet the expectations by the 2050. More efforts require to an increase of additional ~8% in the rice yields as the present growth is only ~12% and ought to be enhanced to ~20%.

1. Introduction

Crop yields are sensitive to climate variations (e.g., [1,2,3]. It is undisputed truth that the climate change shows impact on the crop yields [4]. An increase of 1 to 2 °C temperature during the crop growing period causes crop dehydration and greatly reduces the grain production in regions such as the North China Plain, Indo-Gangetic Plains and the corn belt of the United States [5]. The year-to-year variations in crop yields show changes in crop products and food demands in the context of increased population. It is inferred that the global crop production (maize, rice, wheat, and soybean) must be doubled by 2050 to meet the raising population’s food demand globally [6]. It is reported that the crop yields/production of India are well correlated with the Indian monsoon rainfall [7,8] and are linked to the global teleconnections such as El Niño [9,10]. Adejuwon [11], studied the food crop production in Nigeria in relation to the climate variability and reported that the monthly rainfall changes have an impact on food production. Also, he reported that the changes in the yield can be seen as the rainfall and moisture supply approaches the critical minimum value. The impact of rainfall variations on rice production is studied by Asada and Matsumoto [12], and concluded that the relation of rainfall and rice production differs by region over the Ganges—Brahmaputra Basin. A study on response of evapotranspiraton to the drought over India observed that the rice yields have shown interannual variability associated by rainfall and evapotranspiration changes [10]. The regional results of the study of climate change effects on the crop production in US favors northern areas and can degrade the conditions in southern areas of the US [13].
Global temperature increase was the greatest during the 1990s and is likely to continue in the 21st century [14,15]. It is also reported that the rice-producing countries such as India and China will experience a double CO2 scenario which leads to enhancement of photosynthesis, but at the same time will causes a rise in temperature by more than 2 °C [16]. At this juncture, several researchers have done analysis on the rate of increment on global crop yields to meet the projected population’s food demand. Tilman et al. [17], studied the global food demand of agriculture and inferred that the yields increase in richer nations may be difficult than in the past and the yields increase in poorer nations need significant investments on technologies to new soil types, climates and pests. Ray et al., [6] reported that the global crops such as maize, rice, wheat and soybean have shown an increment of 67%, 42%, 38% and 55% by 2050 which is not sufficient for the projected food demand.
The present work focuses on the relation of crop yields with the water irrigation, food products for the period 1951 to 2012 over India. Using the satellite NDVI, a linear relation between the crop yields and NDVI is established. Extreme value theory has been applied to the crop yields to estimate the crop yields for different return periods. Threshold years have been obtained for different crop yields and are analyzed in the context of increasing food demand over India.

2. Data and Methodology

The study makes use of crop yields and crop irrigation data for the comparative analysis and the same is collected from the Directorate of Economics and Statistics (DES), Department of Agriculture, Cooperation and Farmers welfare, Ministry of Agriculture and Farmers welfare, Govt. of India (eands.dacnet.nic.in). The data has been used in this study for the period 1951 to 2012 for the crop yields namely rice, wheat, maize, jowar and bajra and their percentage area of irrigation for the period 1951 to 2009.
We also have used satellite vegetation index, known as Normalized Difference Vegetation Index (NDVI) to understand the association with crop yields. The monthly NDVI data sets from 1982 to 2000 are collected from www.jisao.washington.edu (developed by the University of Washington, USA) which are basically prepared from NOAA AVHRR data available on gridded format over the globe. The NDVI data has been averaged over Indian region and is used as All India NDVI in the present study. The same data sets were used by the authors to study the vegetal cover over India [18,19]. The NDVI data from 2001 to 2012 has been obtained from the MODIS Terra, supplied by University of Hamburg in Germany in gridded format for Indian region [20]. Hence for a period of 30 years, the data has been used to compare with the crop yields. The MODIS Terra derived NDVI data sets from the MODIS imagery has been used by several people and the present authors also used these data sets to report the relation of vegetation with the summer monsoon rainfall over the regions of Western Ghats, India [21,22].
The data of crop products viz-a-viz rice, wheat and maize products have been obtained from the food balance sheets provided by the Food and Agricultural Organization [23] for India from the period 1961 to 2014. The data is used in this study is in kg capita−1 year−1. Further, the data of average food production over India in US dollars per person for every 3 year period and the data of percentage of food inadequacy for every 3 years is also obtained from the food balance sheets.
The study makes use of statistics such as trend analysis, correlation and canonical correlation analysis to interpret the data sets. Gumbell Extreme Value analysis has been used to estimate the return values for the different return periods [24]. Furthermore, Threshold Years (T-Years) for every amount of crop yield is estimated. The required scale and shape parameters for this analysis are obtained from the Maximum Likelihood Method. The methodology for using MLM and Gumbell Extreme Value Analysis can be found in [25] and [26]
The Gumbel Distribution is written as:
G(x) = exp(−exp(−(x − l)/s))
where “l” and “s” are location and scale parameters and are estimated from maximum likelihood method using the below equations,
s = −s(n−1Σexp(−xi/s)) and
s − n−1Σxi + Σ(xiexp(−xi/s))/Σ(exp(−xi/s)) = 0
where i = 1, n and n is the number of observations. Threshold level of the year (T-Year) which is likely to exceed can be estimated by 1/(1 − G(x)).

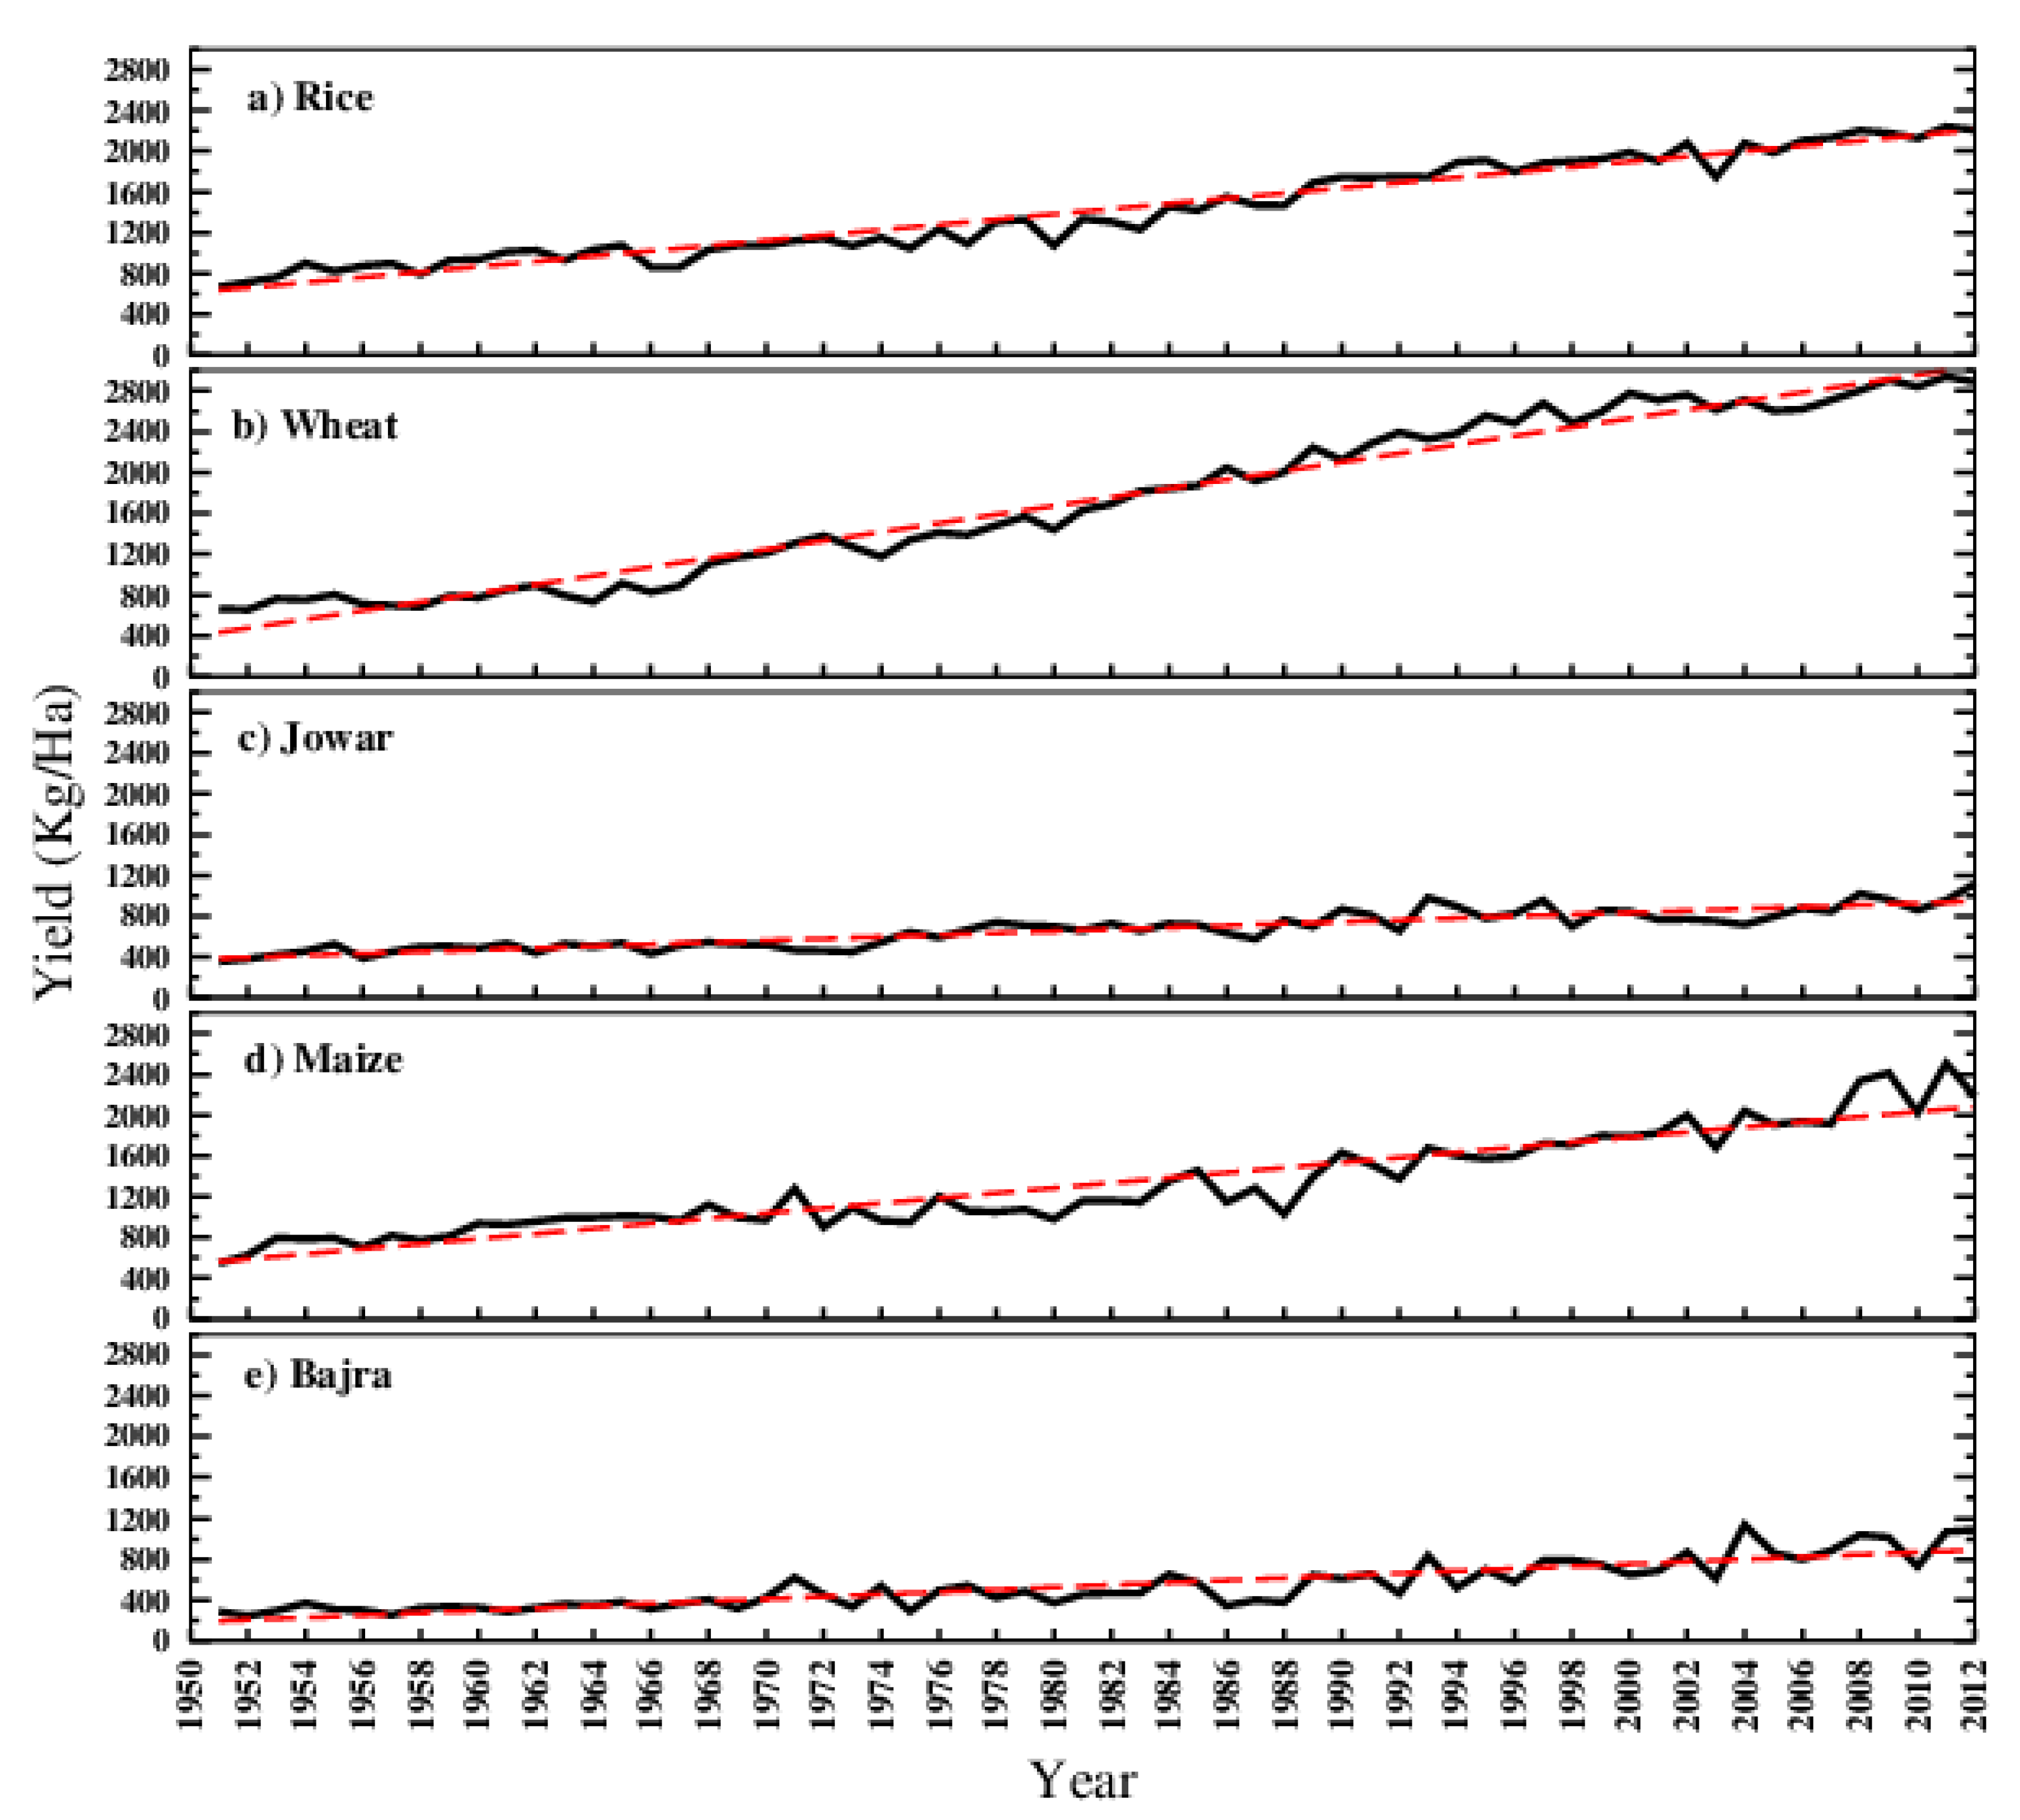
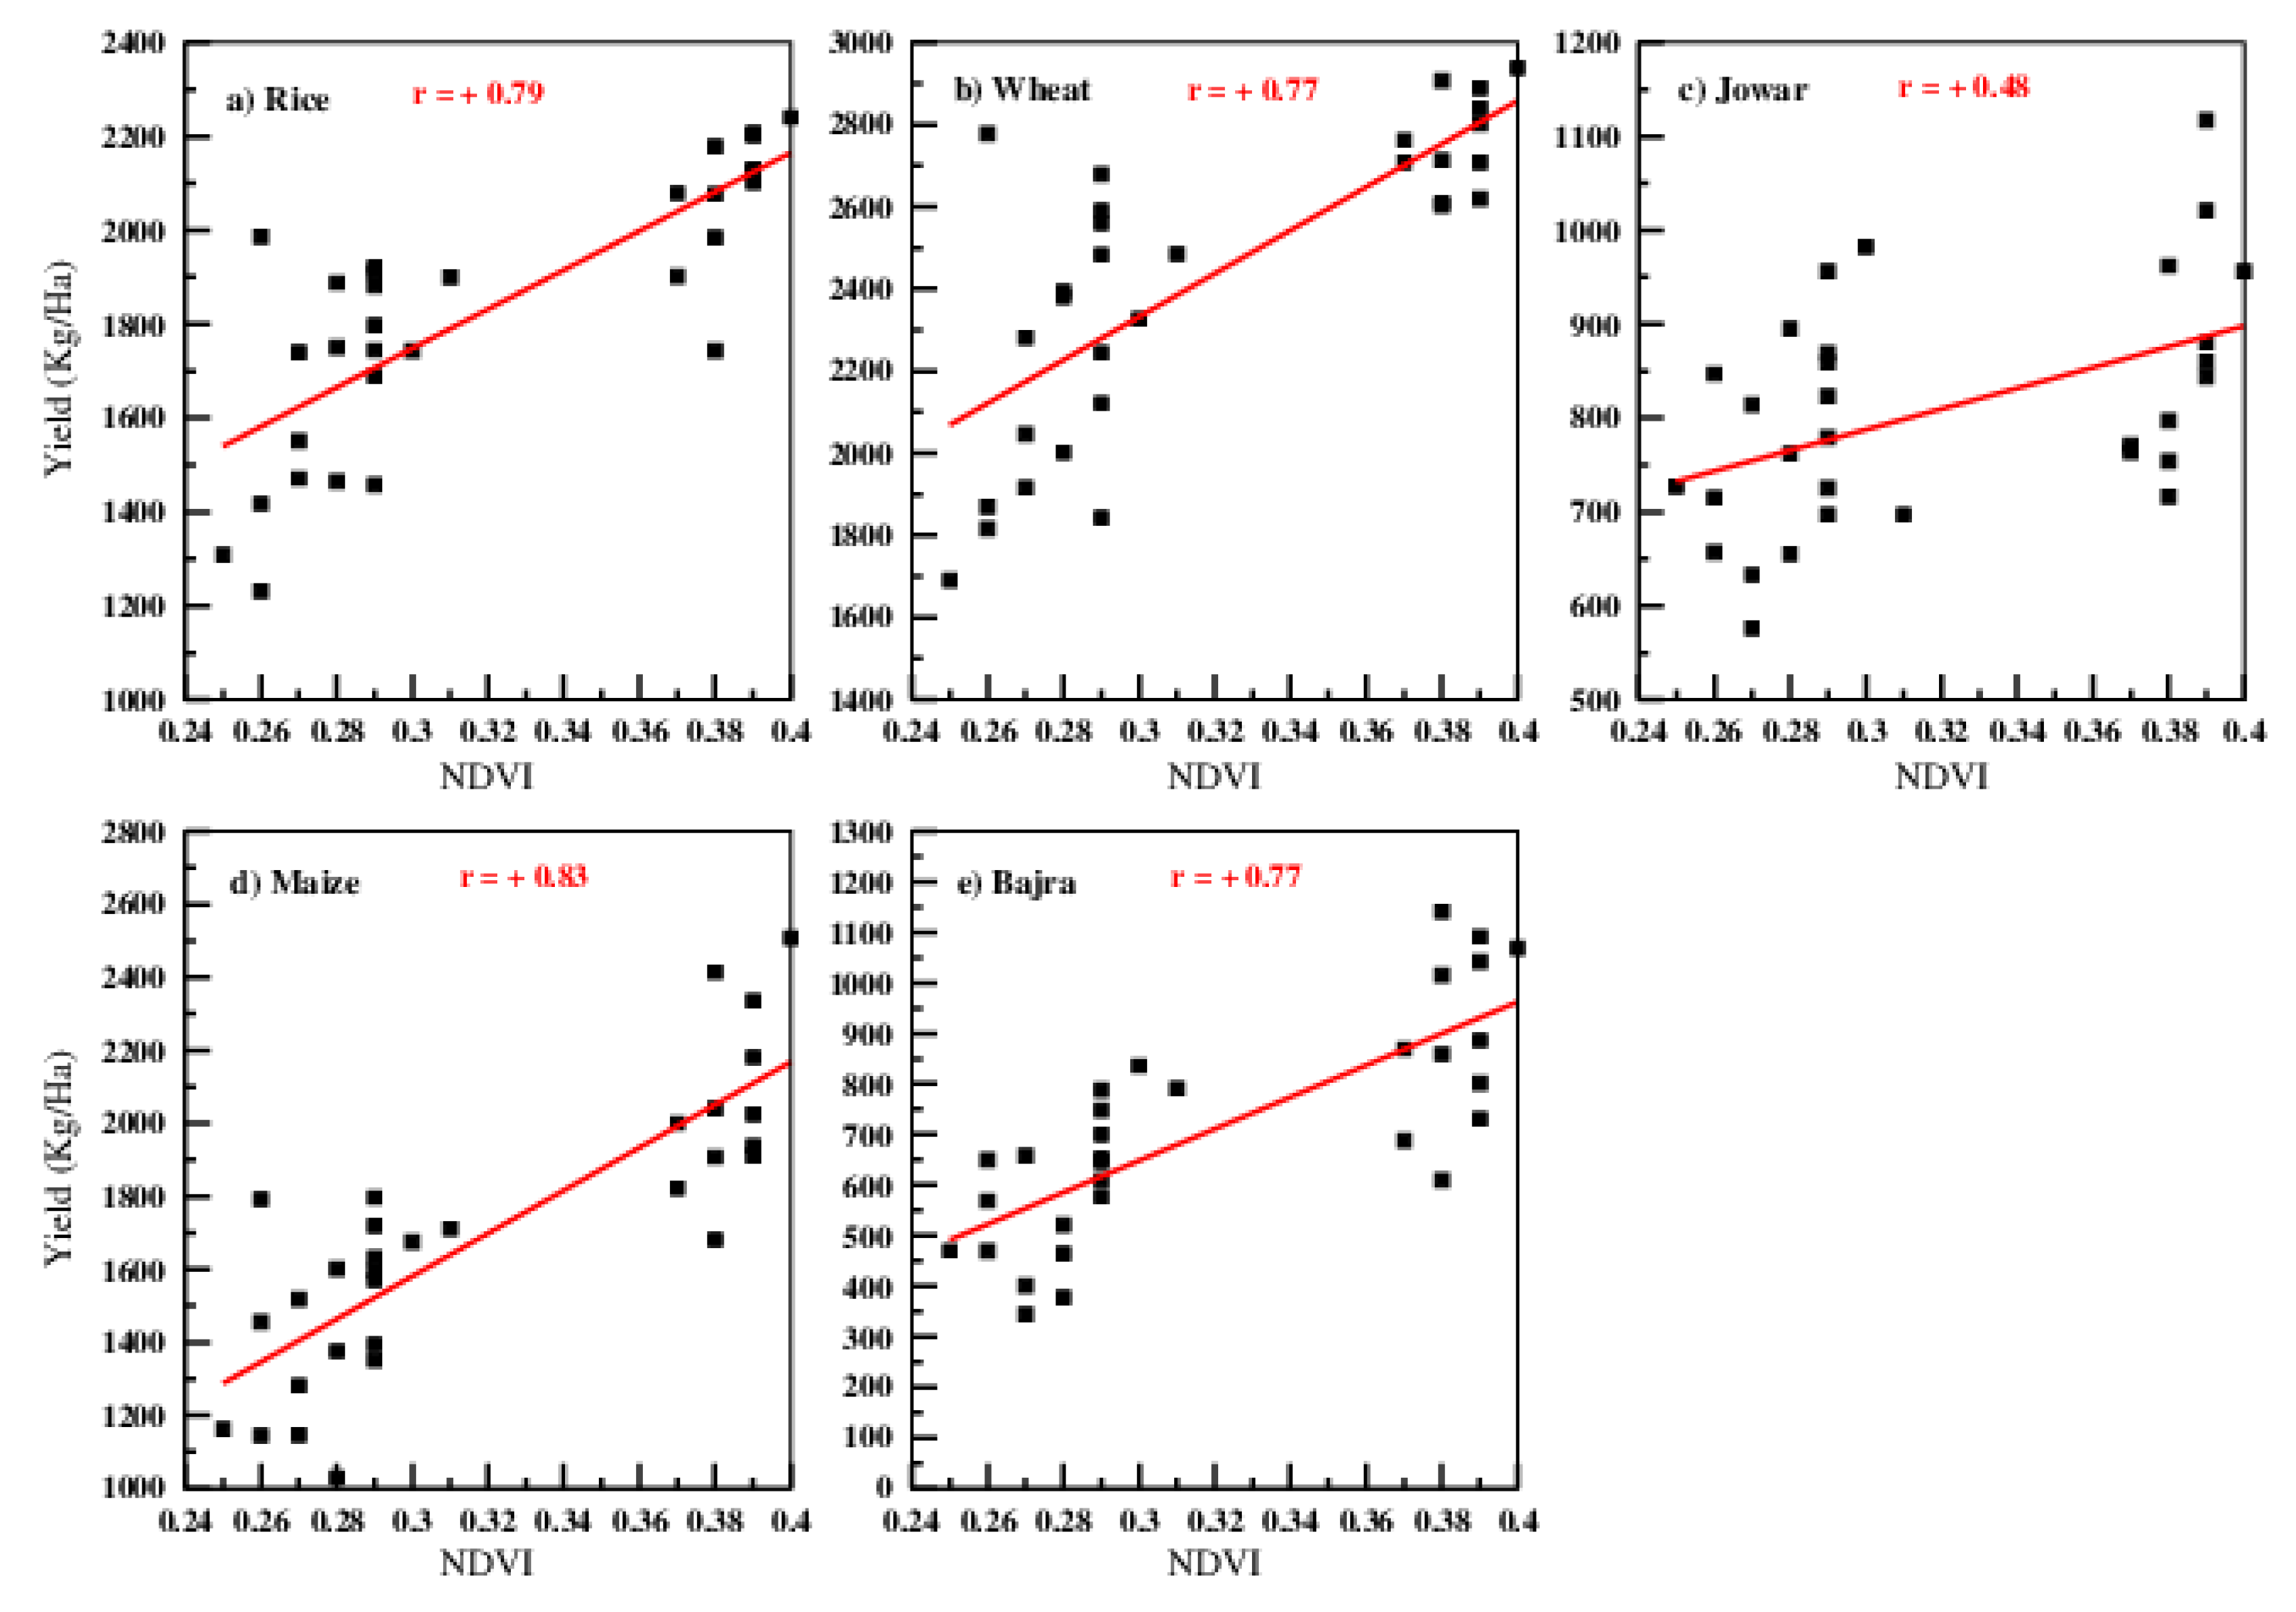
3. Trend Analysis of Major Crop Yields of India

Figure 1a–e show the linear trends of annual crop yields (in kg ha−1) of rice, wheat, jowar, maize and bajra of All India for the period 1951 to 2012. It can be seen that from these figures that all the yields have shown increasing trend with distinguished slopes. The trend of wheat yield is very high compared to other crop yields. The slope of the wheat yield fit is maximum (43.1) compared to other yields. This is followed by rice, maize, bajra and jowar with the slope values of 25.7, 24.5, 11.4 and 9.2, respectively. The break trend analysis of all these crops also displayed a similar increment for the two periods 1901 to 1950 and 1951 to 2012. Among all crops, jowar yield only has not shown any change from the first period (1901 to 1950) to the second period (1951 to 2012). Wheat is the major annual yield of about 1717 kg ha−1 and followed by rice (1420 kg ha−1), maize (1321 kg ha−1), jowar (665 kg ha−1) and bajra (543 kg ha−1).
The corresponding standard deviations of these crops are 384, 289, 383, 124 and 217 which indicate the interannual variability in wheat and maize yields are very high during the study period. The authors also examined the variations of these crop yields with the satellite vegetation index, known as Normalized Difference Vegetation Index (NDVI) for all India scale. It is well documented that NDVI is a best indicator of ground vegetal cover and can be used to study the crop growth, production and yields [21,27,28]. Here, the authors have compared the crop yields data with NDVI for the period 1982 to 2012. The NDVI data for the period 1982 to 2000 has been collected from NOAA AVHRR and for the period 2001 to 2012, it is taken from MODIS TERRA over India. The NDVI monthly data has been averaged for all the grids of Indian land mass and is taken as the representative of All India NDVI. Then the data is clubbed for the period 1982 to 2012 and the correlations were obtained. It is to be noted that corrections such as water vapor and aerosol approximations are different for both the data sets of AVHRR and NDVI. Also, the frequencies used to obtain NDVI are also different. The correlations of NDVI and the crop yields revealed the linear relation with statistically significant value. The correlation values for rice, wheat, jowar, maize and bajra yields with all India NDVI are 0.79, 0.77, 0.48, 0.83, 0.77 with varied significance from 0.05 to 0.01 levels, respectively. Since NDVI is over all status of vegetation including forest cover, the correlation may not completely explain the variations in crop yields but can reflect the overall crop health. The scatter plots of NDVI and the five major crop yields are given as Figure 2a–e.

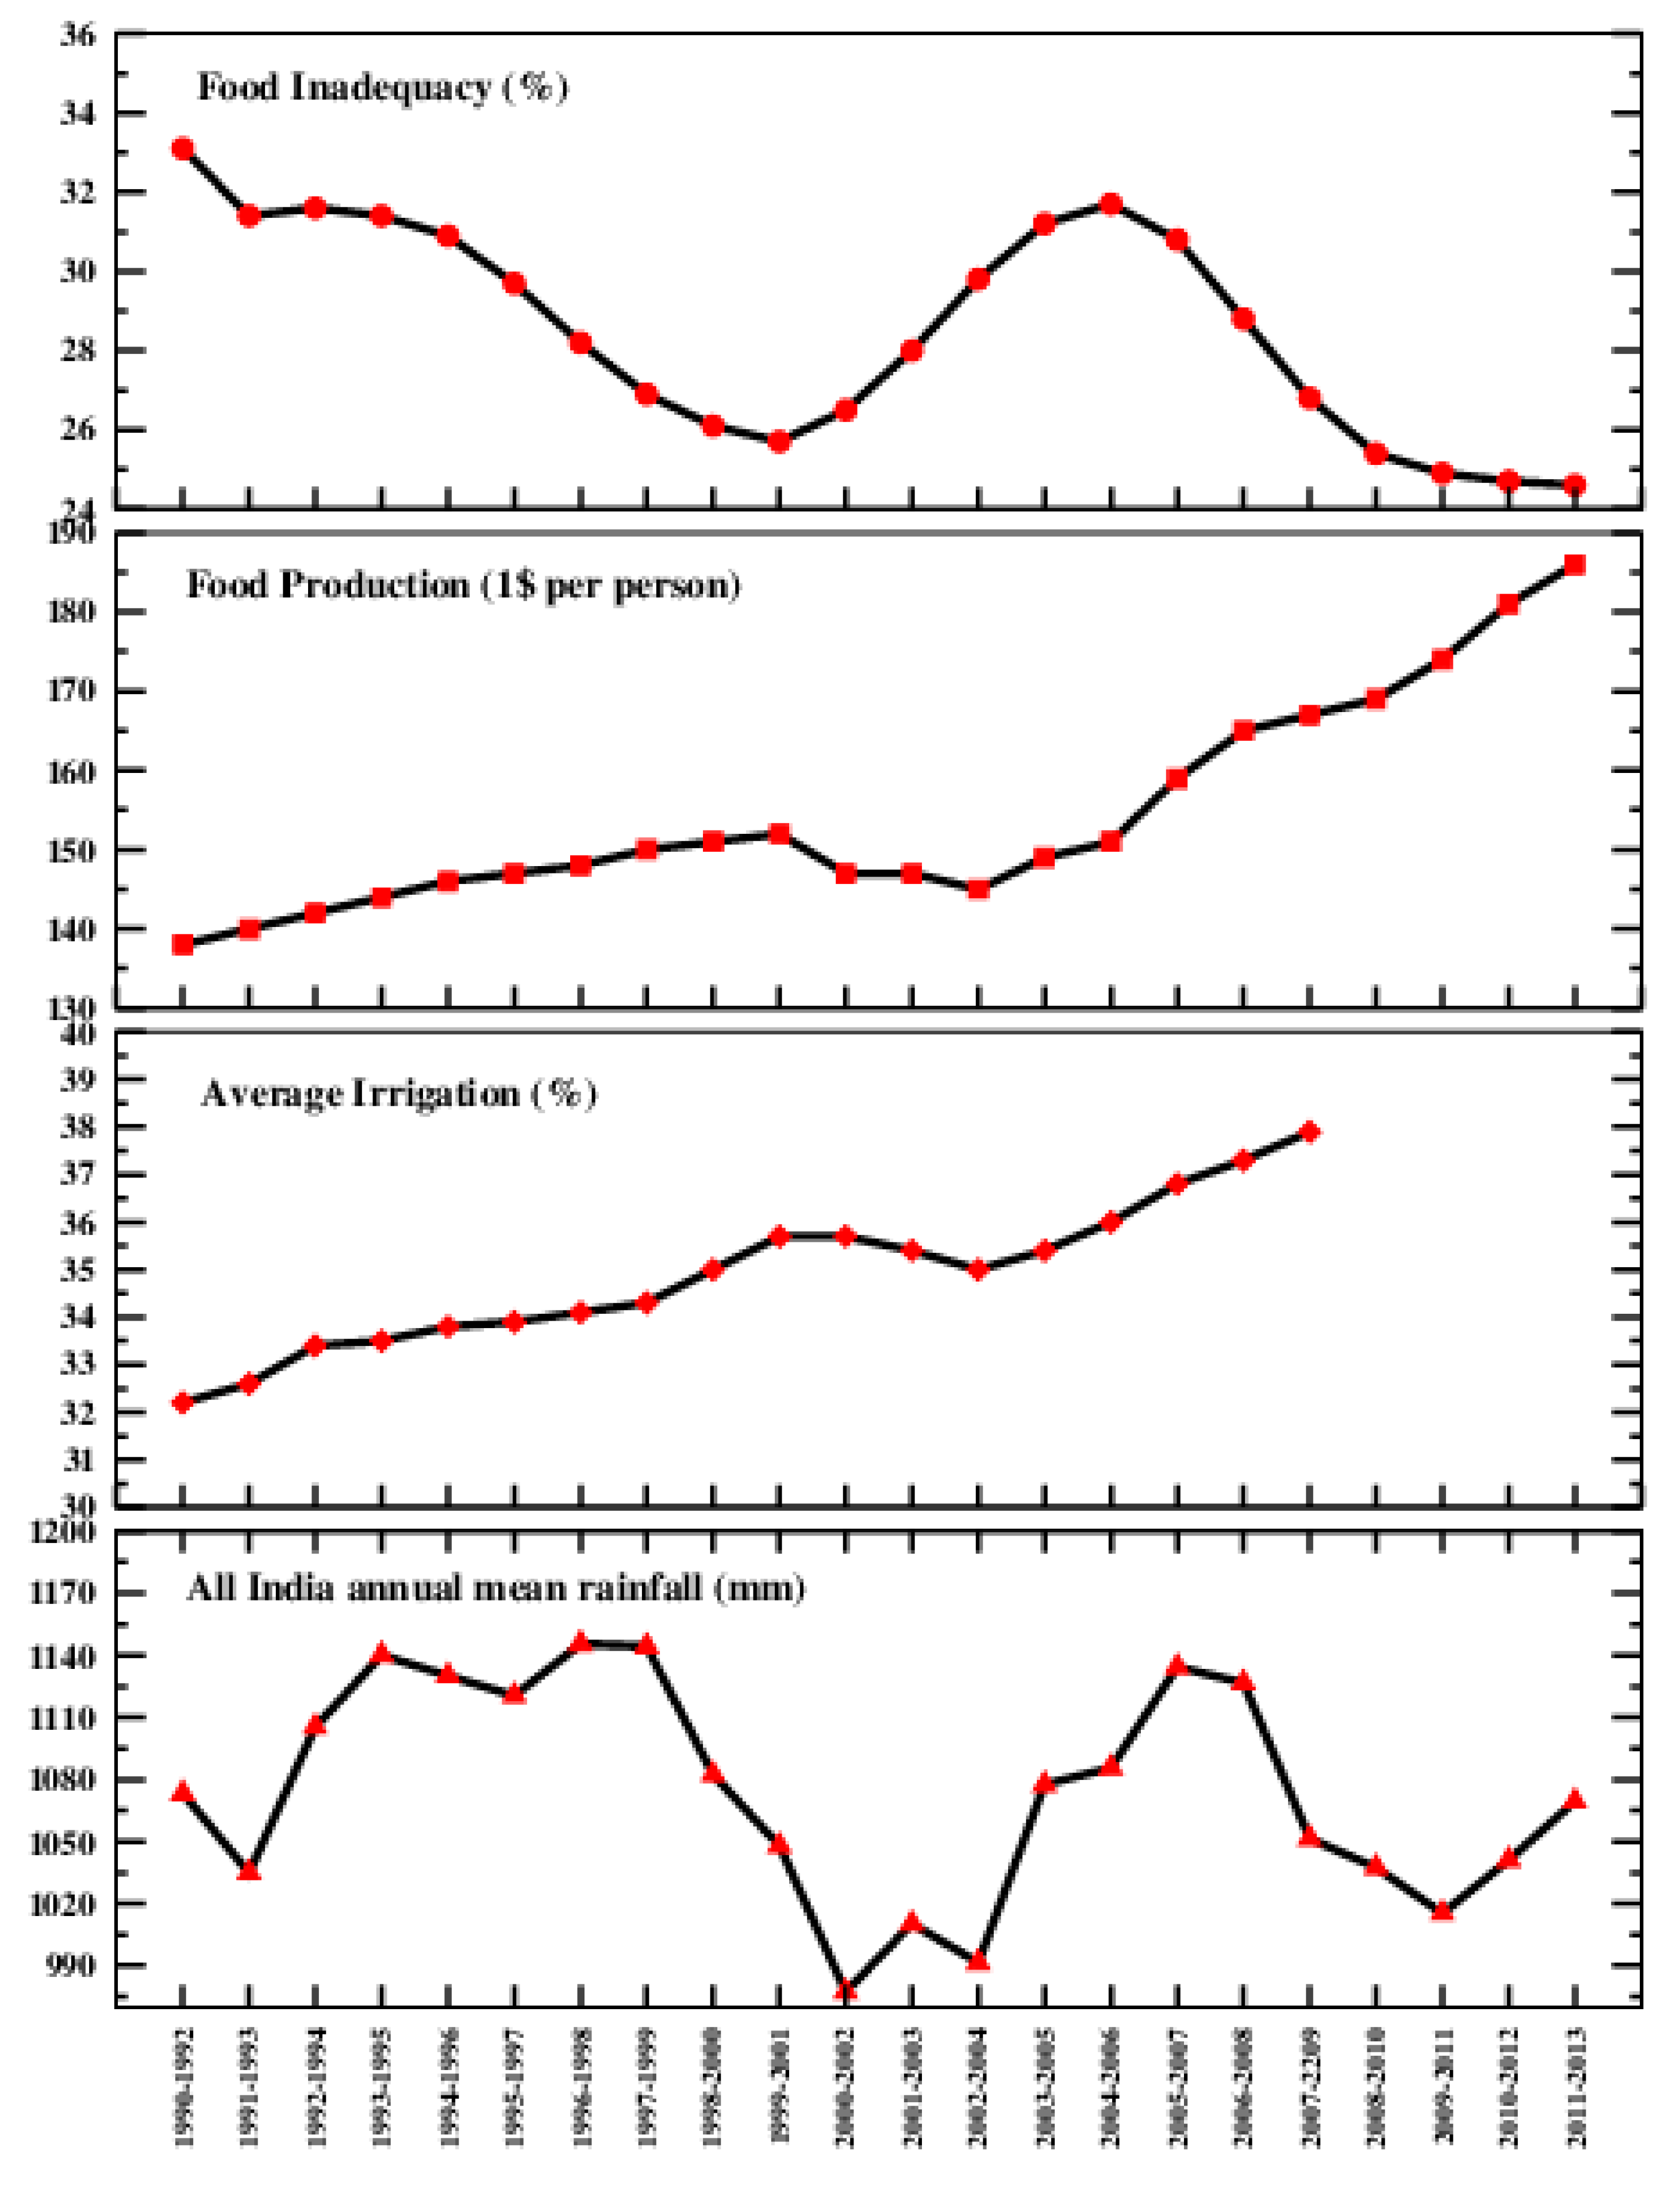
4. Crop Yields and Irrigation over India

Figure 3a–e show the trends of the percentage area covered under irrigation of the five major crops over India for the period 1951 to 2009. These trends in irrigation have been compared with the crop yields. Rice, wheat, bajra, jowar and maize yields of India increased from 1951 to 2009 with slopes of 25.6, 43.41, 23.9, 8.9 and 10.9 kg ha−1 for 0.41%, 1.22%, 0.2%, 0.1% and 0.1% increase in the slope of irrigation of the respective crop yields. The highest slope in irrigation of wheat discloses that is the main non-rain fed crop in India. Though, rice is the main rain fed crop in India, the percentage of increment in the irrigation (0.41%) reveals that necessity of irrigation water for its growth and production. Also, this increment in irrigation also infers the temporal distribution of rainfall over India. It is reported by Lakshmi Kumar et al. [26], that the inter-decadal anomalies of south west monsoon rainfall in West Central and North East regions have shown decreasing tendency during the period 1871 to 2012. It is also reported that there is increment of rainfall in the Peninsular region of India during this period. This evidences that there is a change in temporal distribution of rainfall over India in the aforementioned regions. This may be one of the reasons for the increment of irrigation over India for the rain fed crop rice. The other rain fed crop maize has not shown such increment as rice has shown. The percentage of increment of irrigation may also depend on the area of the production of the crops. Since, rice is the most cultivated crop than maize in India, it needs more water in needy times. It is reported that in India, rice and maize are most rain fed crops occupying 46% and 72% depend on the seasonal rainfall and other three crops, wheat with 14% dependent on rainfall and bajra and jowar are non-rain fed crops. Other interesting feature is that in the case of rain fed crops, one can see more variability in the irrigation values. In particular, the impact of global teleconnections on the Indian crop yields can be observed. It is reported by [29] that there is an impact of El Niño and La Niña on the crop yields of Andhra Pradesh state in India. Since, these global teleconnections can reduce/increase the amount of rainfall over India, this will definitely show an impact on crop yields. Koteswara Rao et al. [18], studied the variability of agro climatic parameters over the monsoon homogeneous regions of India and reported that there is a strong impact of ENSO on Indian crop yields. Madhu et al. [10], also reported that the water stress conditions initially increase the rate of evapotranspiration and further increase the water scarcity which may lead to short /long term droughts. Also, during the El Niño years, the CO2 uptake will be less for the crops to maintain the photosynthetic activity, thus there will be diminution in the crop growth. This reduced crop growths lead to less production, thus reduction in crop yields. The time series of cropped area analysis shows that the El Niño years 1965-66, 1972–73, 1982–83, 2002–03, 2009–10 recorded less cropped area of 35.47, 36.69, 38.26, 41.18, 41.92 which is less than the previous year’s cropped areas (figures not shown). Similar types of features are elevated for rest of the crops also. From this, it can be inferred that during El Niño years, the cropped areas have declined when compared to neutral and La Niña years. These features are well associated with the crop production values during these El Niño years. The corresponding crop production values for the rice yield are 30.59, 39.24, 47.12, 71.82 and 89.09 million hectares which were less than that of previous years. These cropped area and crop production values were not well reflected in irrigation statistics of India for the crop yields. The values of irrigation during these years varied slightly from the previous year’s values. The average cropped area, production and irrigation for rice, wheat, maize, jowar and bajra are 38.84, 55.43,42.96; 20.08, 37.87, 63.76; 5.63, 7.60, 17.75; 14.80, 9.18, 5.25; 10.79, 5.52, 5.15, respectively. The correlation analysis of cropped area, crop production and crop yields with irrigation unravelled the substantial relation of crop yields with irrigation compared to other relations. The correlation of yields and irrigation are 0.98, 0.97, 0.72, 0.83 and 0.72 which are significant at 0.01 level for rice, wheat, maize, jowar and bajra respectively. The correlations for cropped area and crop production with irrigation are very strong for rice (r = 0.91 and 0.98), wheat (r = 0.97 and 0.96), maize (r = 0.77 and 0.72). In the case of jowar and bajra, the correlations have shown negative for cropped area and irrigation. The overall correlation analysis shows that there is strong dependence of crop yields on irrigation but the relation of cropped area, crop production with irrigation is distinctly varied. Authors also examined the combined relation of cropped area and the irrigation on Crop production and crop yields for the same data sets using Canonical Correlation Analysis (CCA). It is known that Canonical Correlation Analysis is a powerful tool than Multiregression and Discriminant Variate Analysis and will infer the impact of one set of variables on another set [30]. This CCA has been used by several researchers for agrometeorological studies [31,32,33]. In our analysis, the data sets have been explained by the two loadings for all the crop yields with two canonical correlations. In all cases, the relation is well explained by the first loading except for the case of bajra. The primary loadings for rice, wheat, jowar, maize and bajra are 81.5%, 81%, 87.3%, 92.7% and 71.2% with the canonical correlations 0.97, 0.96, 0.98, 0.93 and 0.96, respectively. The canonical correlations along with the first and secondary loadings of the variables are given in Table 1.

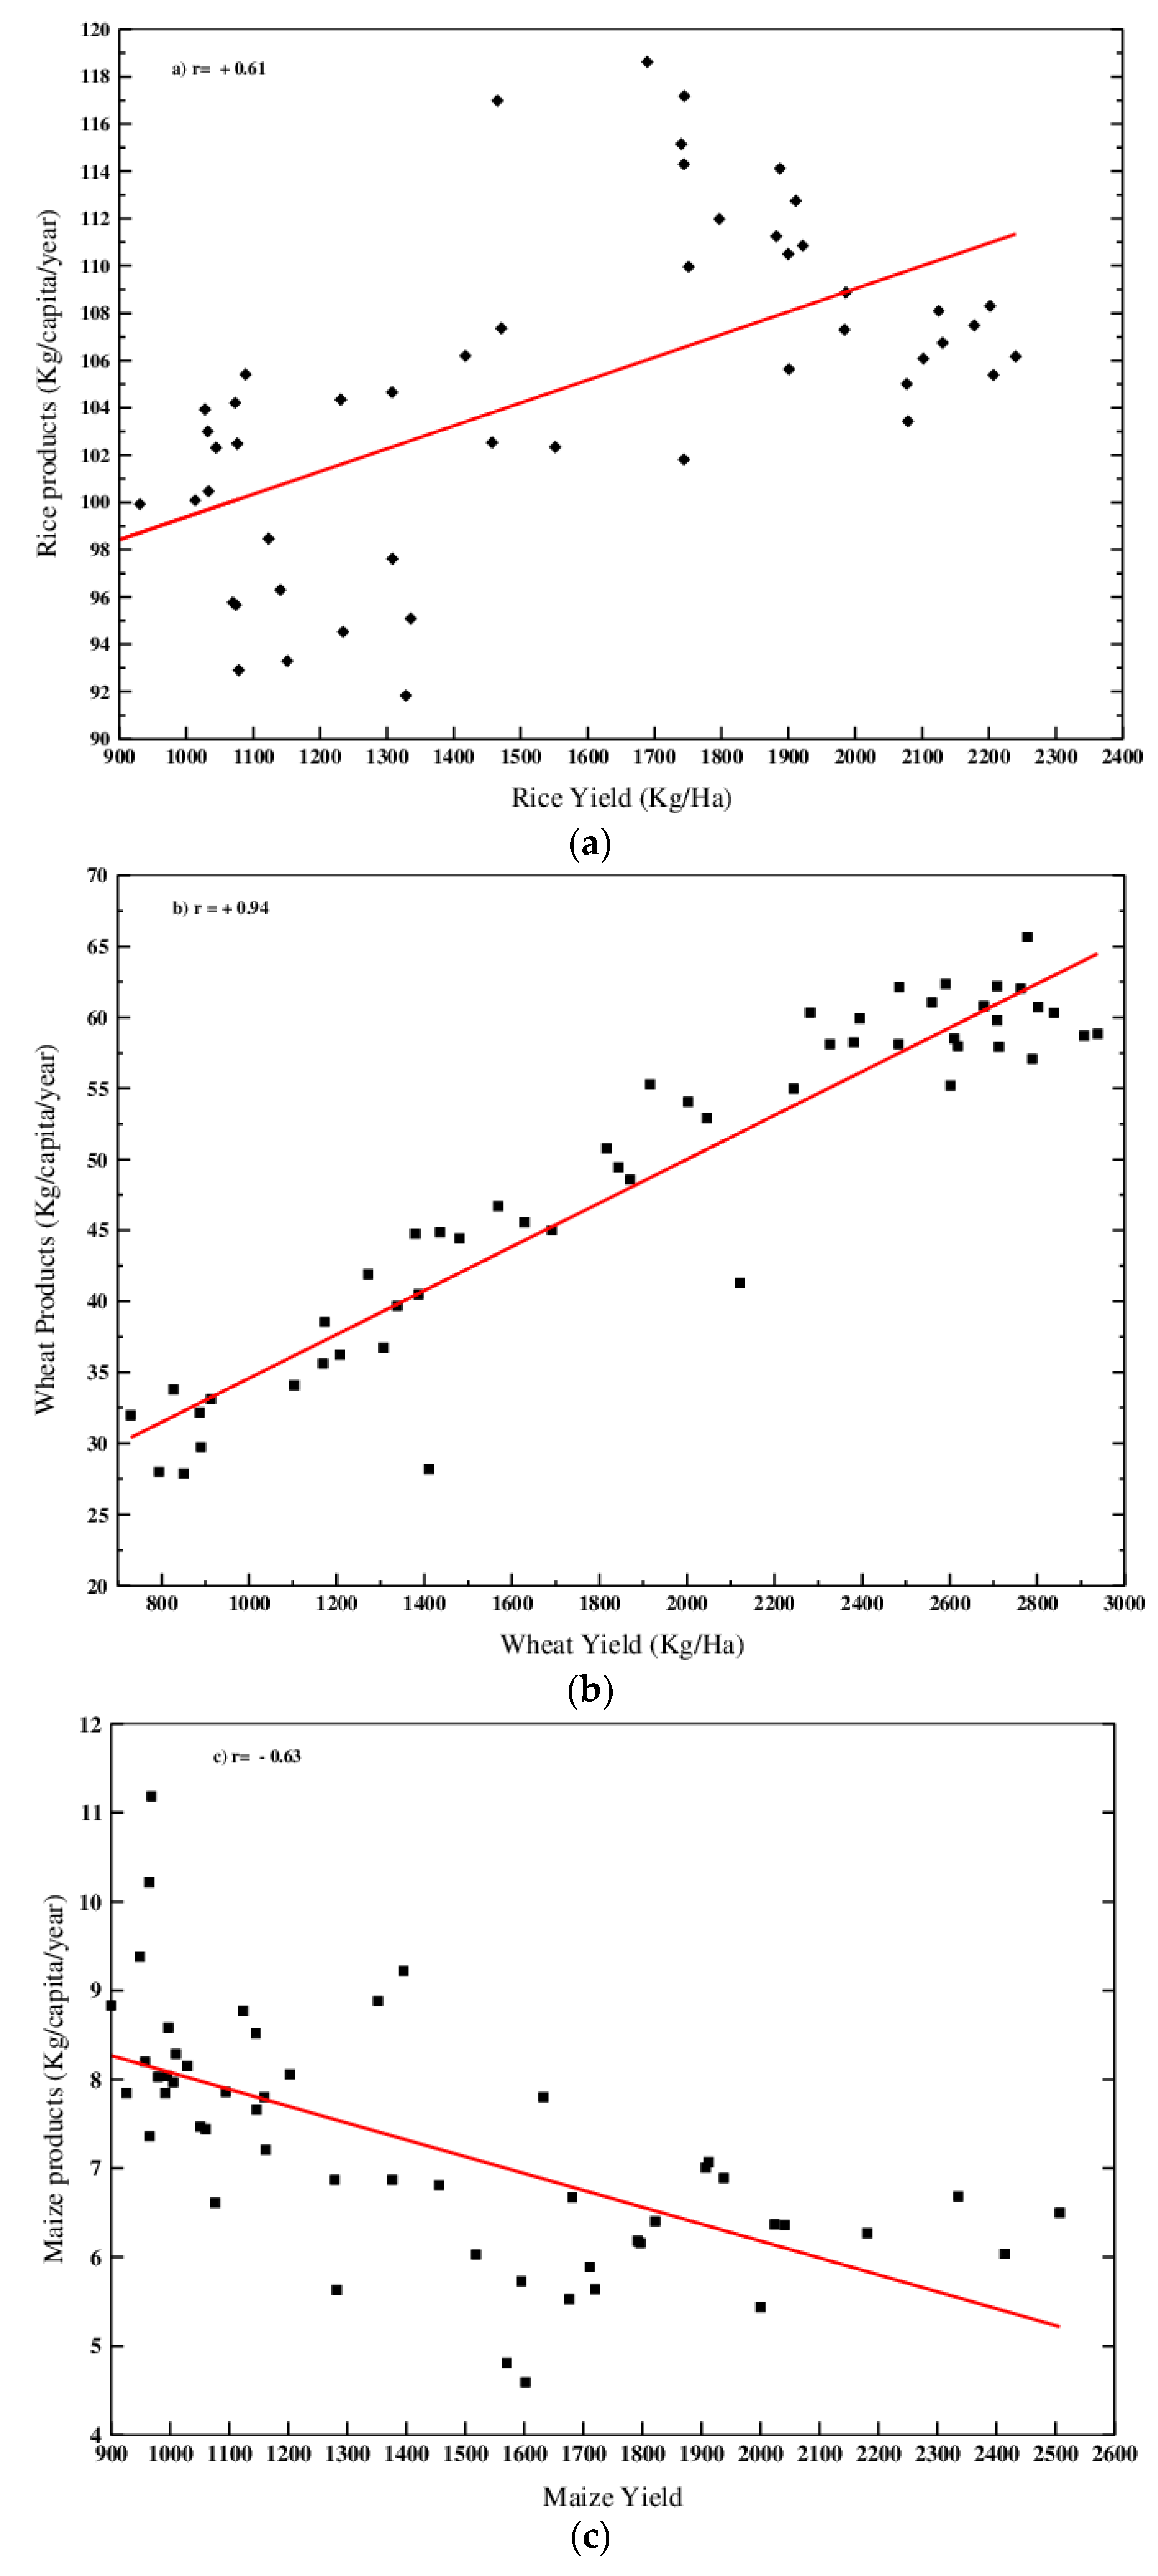
5. Relation between Crop Yields and Crop Products over India

We have compared the crop yields with the crop products data obtained from the FAO Food Balance Sheets for India. The comparison is done for the three crops viz-a-viz rice, wheat and maize. Among the three crop products, rice products are dominated with an average value of 104.5 kg capita−1 year−1 than the wheat product value 49.1 kg capita−1 year−1 and maize product value 7.2 kg capita−1 year−1. But it is interesting to see the trend of these crop products over the study period. Rice products have shown increasing trend till 1990s and then starts decreasing whereas wheat products are continuously increasing right from the year 1961. The average rice products for the period 1961 to 1990 is 101 kg capita−1 year−1 and it is 108.5 kg capita−1 year−1 for the period 1991 to 2013. Though the magnitude of rice products showed high value for the period 1991 to 2013, this value gradually decreased and reached to 104 kg capita−1 year−1 by the year 2013. The wheat products started with a value of 27.9 kg capita−1 year−1 in the year 1961 and it reached 60.6 kg capita−1 year−1 by the year 2013. The maize products have shown decreasing tendency over the period. The value of maize product for the year 1961 is 7.8 kg capita−1 year−1 and slightly came down to 6.3 kg capita−1 year−1 by the year 2013. The average maize products are 8.04 kg capita−1 year−1 for the period 1961 to 1990 and for the period 1991 to 2013, it is 6.14 kg capita−1 year−1. The trends of these products show that the rate of increment is very low for the rice compared to wheat. Also, this infers the consumption of crop products by the people of the country. The comparison of crop yields and crop products shows linear association which is evidenced by the significant correlations except for the case of Maize. Figure 4a–c depict the scatter plots of rice, wheat and maize yields with the respective products. It is already discussed in the earlier section that all the crop yields have shown increasing trends with different magnitudes. The correlations of these yields with their respective products are 0.61, 0.95 and−0.63 which are statistically significant at 0.01 level. It is to be noted that the linear association of yields and products is very strong in the case of wheat than rice and maize. Also, it is to mention that a negative and significant correlation existed between maize yields and products which means the consumption of maize products are decreasing though the yields are increasing. The overall analysis shows that the consumption of wheat products is gradually increasing over India. The authors also compared the data of average food production in $ per person for every three years with the percentage of food inadequacy and rainfall and average percentage irrigation over India. This analysis brought interesting results and shown in Figure 5a–d. The average food production ($ per person) is gradually increased from US $133 during the period 1990–1992 to a value of US $185 during the period 2011 to 2013 for the corresponding percentage food inadequacy of 33% to 25%. So, as the average production is increasing the percentage of food inadequacy over India is decreasing. The percentage of food inadequacy has shown decreasing tendency from 1990 to 2000 and started increasing till 2007, thereafter it is consistently decreasing. The correlation for the average food production to the percentage of food inadequacy is −0.73 which is statistically significant. The variations in the percentage of food inadequacy has been compared with the average annual rainfall and average irrigation for the same period. From Figure 5a–d, it can be inferred that the food inadequacy from 1990 to 2001 is decreased for a rainfall amount of 1102 mm/3 years and 33.9% of irrigation/3 years. The respective values for the period 2000 to 2006 are 1028 mm/3 years and 35.5% of irrigation/3 years which clearly shows that for lesser amount of rainfall, the food inadequacy is increased though the irrigation is increased compared to the previous period. In the rest of the period i.e., from 2005 to 2013, the percentage of food inadequacy is 26.6% for a rainfall amount of 1068 mm/3 years and for the irrigation value of 37.4%/ 3 years (2005 to 2009). This analysis clearly infers, sufficient rainfall amount is required to minimize the inadequacy of food despite the irrigation system.

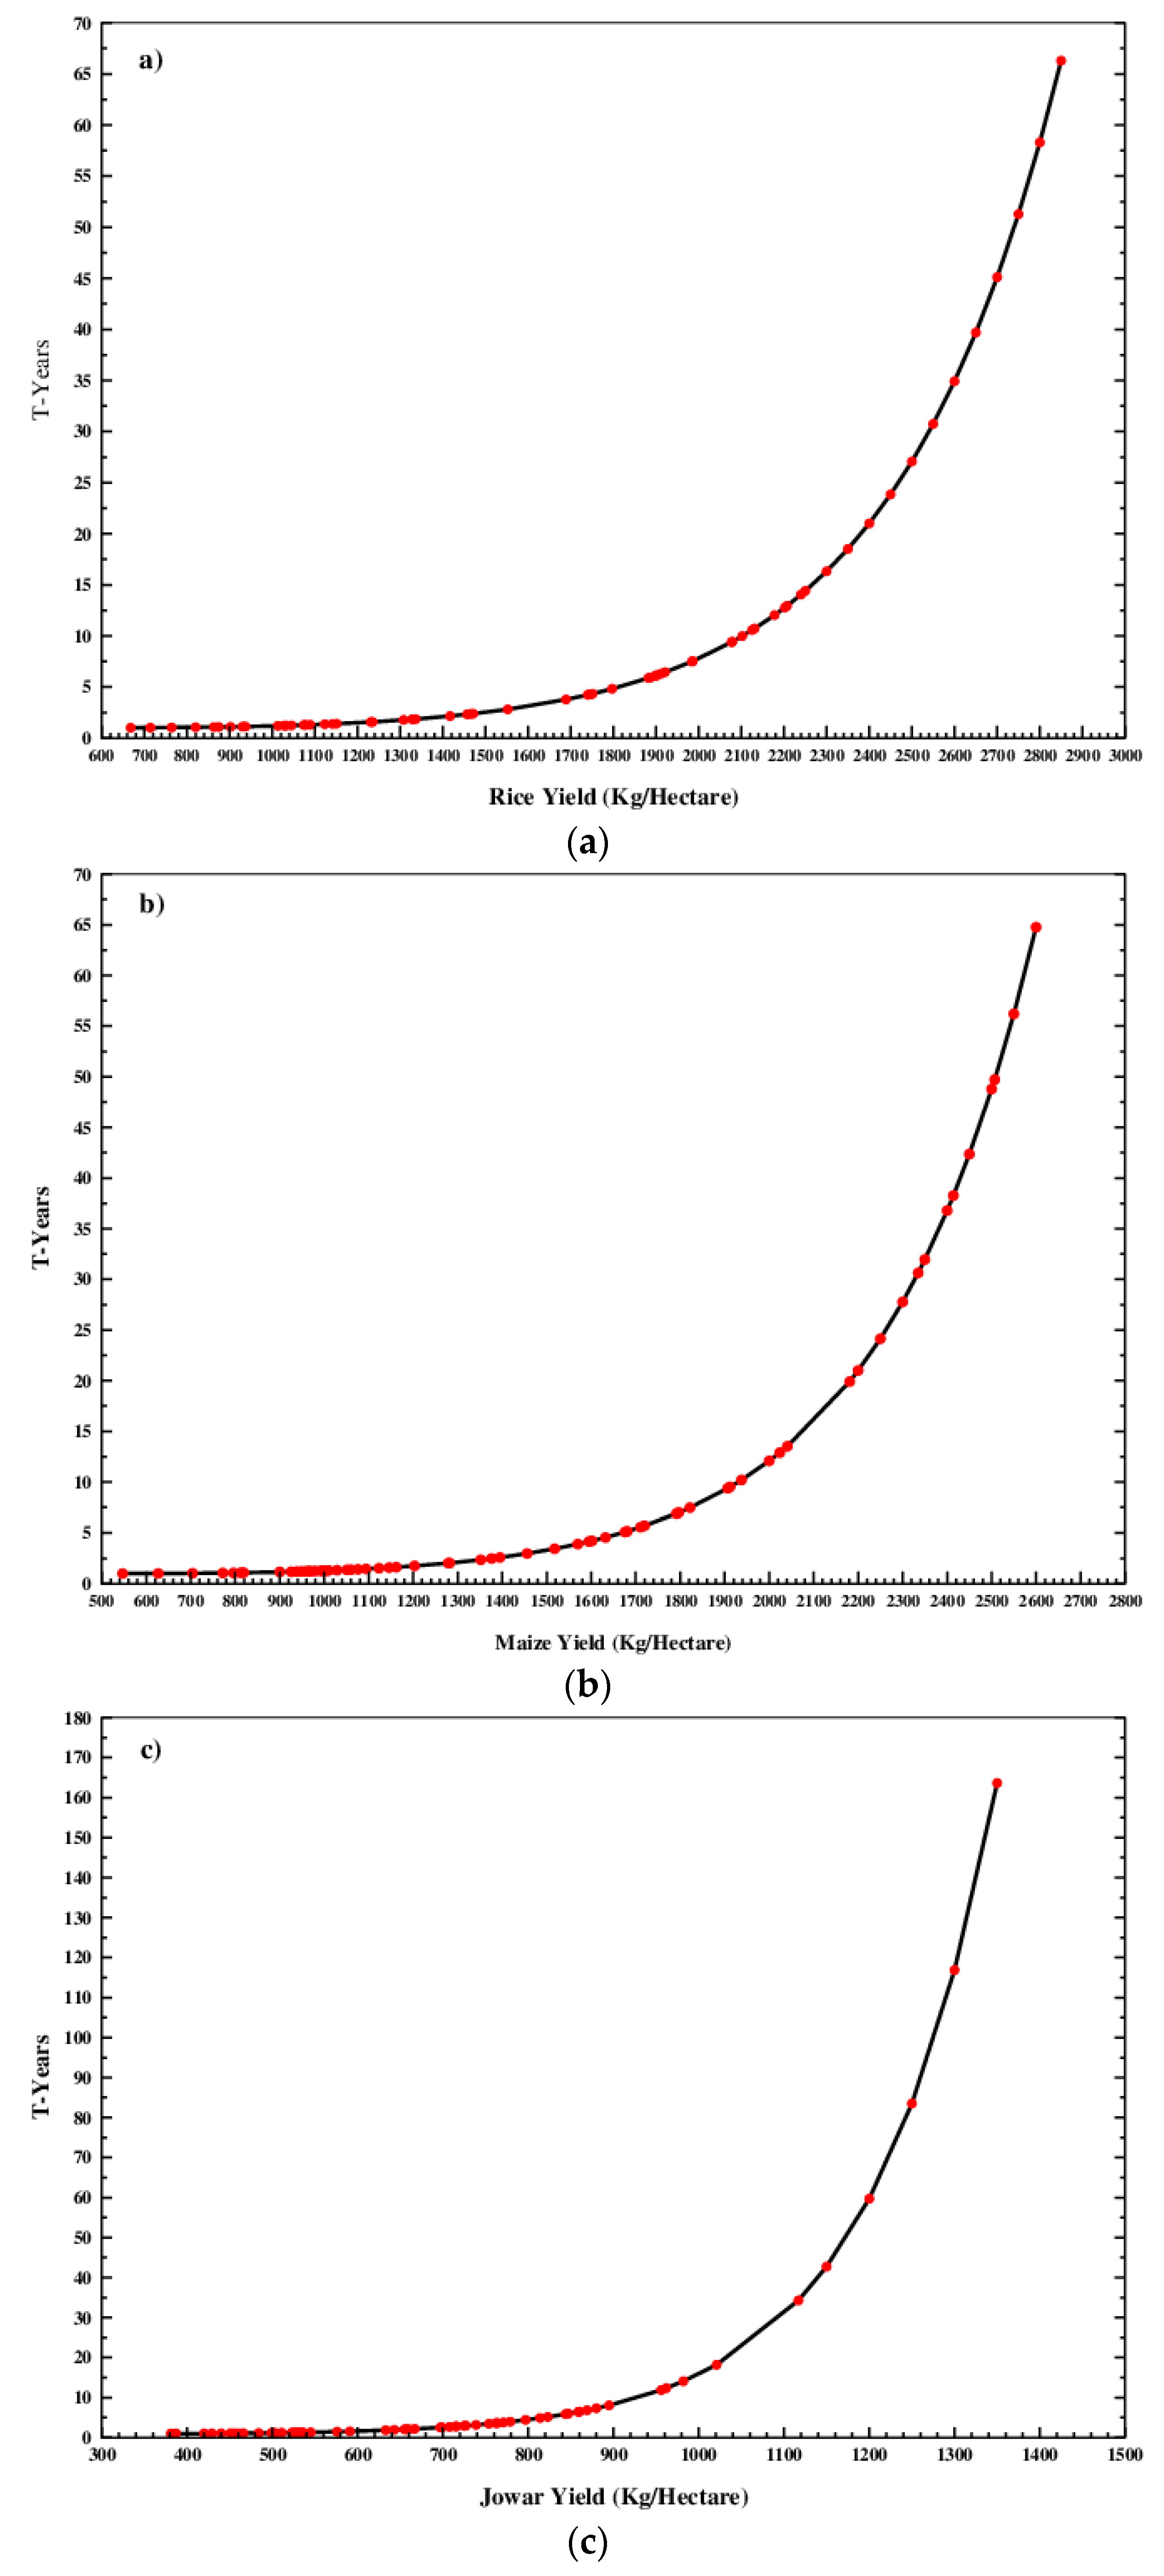
6. Extreme Value Analysis of Major Crop Yields over India

The basis for this analysis is mainly from Ray et al. [2], where they have reported that the present global yield trends are insufficient to double the crop production by 2050 to meet the increasing population food demands. They have reported that the yields of maize, rice, wheat and soybean are presently increasing with a percentage of 1.6%, 1.0%, 0.9% and 1.3% per year which is far less than the required rate of 2.4%. They also found that the crop production would increase by 67%, 42%, 38% and 55%, respectively, again very less than needed. Hence in the present analysis, the authors attempted to see the crop yields of rice, wheat, maize, jowar and bajra by the year 2050 to understand that whether the present yields are increasing at the required rate or not. For this, we have applied Gumbell Extreme Value Analysis to estimate the crop yields till the year 2050. The data of yields has been considered till the year 2012 which is available with us and extended the yields by increasing an amount of 50 kg ha−1 for every crop from the yield value recorded in the year 2012. For every increment of 50 kg ha−1 yields, threshold years have been estimated to understand how many years will the yield take time to reach the required value. For estimating the T-years, we have used Gumbell Extreme Value theory for which the inputs of scale and shape parameters are obtained from the Maximum Likelihood Method (MLM). In the present work, we have taken average yield of every crop for the years 1951 to 2012 and considered the double of that average as the reference value to meet the projected food demand by the year 2050. The average values of crop yields for rice, wheat, maize, jowar and bajra are 1420 kg ha−1, 1717 kg ha−1, 1321 kg ha−1, 666 kg ha−1 and 543 kg ha−1 respectively and the double of these values are set as 2840 kg ha−1, 3434 kg ha−1, 2642 kg ha−1, 1332 kg ha−1 and 1086 kg ha−1 respectively. The scale and shape parameters of the above crop yields obtained from MLM are 1234,386; 1396,660; 1143,350; 596,148 and 451,172 respectively. From our analysis, we found that the crops such as wheat and bajra will have sufficient yields by the year 2050. The wheat yield will become double within 21 years and similarly bajra yield will be doubled within 40 years right from the year 2012. This is a positive signature revealed from the extreme value analysis. Our analysis shows that the remaining crops; rice, maize and jowar are in trouble which cannot reach the double value by the year 2050. Figure 6a–c depict the plots of crop yields and T-years for the crops rice, maize and jowar, respectively. Please note that for every yield value of the data available with us, we have estimated the T-year and after the year 2012, we have extended the yield value as mentioned earlier by 50 kg ha−1. The main assumption here is that we have considered the yields will increase every year though the time series of yields show distinguished variations with increase and decreased values. From Figure 6a–c, we can see that all the yields increased exponentially with the increase in the number of years. The minimum value of crop yield takes about one year to exceed and it has gone to 80 years to exceed the double of the averaged crop yields. A value of 2400 kg ha−1 rice yield will take about 21 years, 2500 kg ha−1 takes about 27 years and it can reach only 2650 kg ha−1 in 39 years which means by the year 2050. This is a deficit of −200 kg ha−1 that has to be attained by the 2050 i.e., about 2840 kg ha−1 (double of average rice yield). It is found from the Figure 6a that an yield of 2840 kg ha−1 will take about 66 years i.e., probably by the year 2080. It is also estimated that the present rate of increment is 12% and the required increment is about 20%. Hence an additional effort is required for 8% more increase than to the present. This percentage increment has been calculated by taking the difference of 2050 value and 2012 value and dividing with the number of years i.e., 38 years. Figure 6b gives the T-years for different maize yields. It is also found that the double value of maize yield can be exceeded/obtained for a period of 75 years which is also not meeting the required criteria. For a value of 2500 kg ha−1 of maize yield, it is estimated that 48 years will be taken and for 2600 kg/ha, 65 years will be taken. Similar case is found with jowar yield also as it takes 163 years to double of its yield. By the year 2050, it can exceed only 1150 kg ha−1 which is very far from the required. The overall analysis shows that the crops such as rice, maize and jowar cannot be doubled by the year 2050 unless some additional efforts such as increasing the cultivated land and by including the new techniques for getting more yields.

7. Conclusions

In this paper we studied the trends of five major crop yields of India; rice, wheat, maize, jowar and bajra for the period 1951 to 2012 and their relation with the percentage area covered with irrigation of these respective crops. The yields were correlated with NDVI to see the linear association between them. The overall correlation analysis shows that there is strong dependence of crop yields on irrigation but the relation of cropped area, crop production with irrigation is distinctly varied. The data from the food balance sheets provided by FAO have been used to study the food products of the major crops and their linearity with the percentage of food inadequacy and average production rate person over India along with the Indian rainfall and irrigation. The work also have been done on the return periods of crop yields from which the likelihood of required yields to meet the increased population food demands were estimated for the year 2050 over India.
The conclusions of our study are the following:
(i)
A strong dependence of crop yields on irrigation but the relation of cropped area, crop production with irrigation is distinctly varied over India.
(ii)
The rice products are dominant compared to other crop products of wheat and maize with an average value of 104.5 kg capita−1 year−1 where the usage of wheat products are gradually increasing by the year 2013.
(iii)
Sufficient amount of rainfall is required to minimize the food inadequacy over India despite of its irrigation system.
(iv)
Rice, maize and jowar crops need to be paid more attention to increase their yields which is not sufficient with their present increasing rates to meet the increasing population food demands by 2050.

Author Contributions

T.V.L.K. conceived the idea, carried out the analysis and wrote the draft paper; H.B. guided the work and helped in writing the script; S.M. contributed in the analysis and writing parts; K.K.R. helped in finalizing the manuscript and helped in analysis.

Funding

Part of this work is sponsored by Department of Science & Technology (DST), Govt. of India under the Fast Track Young Scientist Scheme of SR/FTP/ES-107/2009. The second author also thanks the Coordenação de Aperfeiçoamento de Pessoal de Nível Superior (CAPES) (grant no. 88887.091737/2014-01: Edital Pró-Alertas no 24/2014 under project Análise e Previsão dos Fenômenos Hidrometeorológicos Intensos do Leste do Nordeste Brasileiro).

Conflicts of Interest

The authors of this paper declared that there is no conflict of interest in publishing the results of this work.

References

  1. Barbosa, H.; Lakshmi Kumar, T.V. Strengthening regional capacities for providing remote sensing decision support in drylands in the context of Climate variability and change. In International Perspectives on Global Environmental Change; Young, S., Silvern, S., Eds.; InTech: Rijeka, Croatia, 2012. [Google Scholar]
  2. Ray, K.D.; Gerber, J.S.; MacDonald, G.K.; West, P.C. Climate variation explains a third of global crop yield variability. Nat. Commun. 2015, 6, 5989. [Google Scholar] [CrossRef] [PubMed]
  3. Sonkar, G.; Mall, R.K.; Banerjee, T.; Singh, N.; Lakshmi Kumar, T.V.; Chand, R. Vulnerability of Indian wheat against rising temperature and aerosols. Environ. Pollut. 2019, 254, 112946. [Google Scholar] [CrossRef] [PubMed]
  4. He, W.; Yang, J.Y.; Qian, B.; Drury, C.F.; Hoogenboom, G.; He, P.; Lapen, D.; Zhou, W. Climate change impacts on crop yield, soil water balance and nitrate leaching in the semiarid and humid regions of Canada. PLoS ONE 2018, 13, e0207370. [Google Scholar] [CrossRef] [PubMed]
  5. Brown, L.S. Rescuing a Planet under Stress and a Civilization in Trouble, 1st ed.; Earth Policy Institute, W.W. Norton & Company: New York, NY, USA, 2003. [Google Scholar]
  6. Ray, K.D.; Mueller, D.N.; West, C.P.; Foley, A.J. Yield trends are insufficient to double global crop production by 2050. PLoS ONE 2013, 8, e66428. [Google Scholar] [CrossRef] [PubMed]
  7. Parthasarathy, B.; Munot, A.A.; Kothawale, D.R. Regression model for estimation of Indian food grain production from summer monsoon rainfall. Agric. Meteorol. 1988, 42, 167–182. [Google Scholar] [CrossRef]
  8. Selvaraju, R. Impact of El Nino—Southern Oscillation on Indian foodgrain production. Int. J. Climatol. 2003, 23, 187–206. [Google Scholar] [CrossRef]
  9. Krishna Kumar, K.; Rupa Kumar, K.; Ashrit, R.G.; Deshpande, N.R.; Hansen, J.W. Climate Impacts on Indian agriculture. Int. J. Climatol. 2004, 24, 1375–1393. [Google Scholar] [CrossRef]
  10. Madhu, S.; Lakshmi Kumar, T.V.; Barbosa Humberto Koteswara Rao, K.; Vizaya Bhaskar, V. Trend analysis of evapotranspiration and its response to droughts over India. Theor. Appl. Climatol. 2014, 121, 41–51. [Google Scholar] [CrossRef]
  11. Adejuwon, O.J. Food crop production in Nigeria. I. Present effects of climate variability. Clim. Res. 2005, 30, 53–60. [Google Scholar] [CrossRef]
  12. Asada, H.; Matsumoto, J. Effects of rainfall variation on rice production in the Ganges—Brahmaputa basin. Clim. Res. 2009, 38, 249–260. [Google Scholar] [CrossRef]
  13. Tubiello, F.N.; Rosenzweig, C.; Goldberg, R.A.; Jagtap, S.; Jones, J.W. Effects of climate change on US crop production: Simulation results using two different GCM scenarios. Part I.; Wheat. potato, maize and citrus. Clim. Res. 2002, 20, 259–270. [Google Scholar] [CrossRef]
  14. Intergovernmental Panel on Climate Change (IPCC). Climate Change 2001: The scientific basis. In Contribution of Working Group I to the Third Assessment Report of the IPCC; Houghton, J.T., Ding, Y., Griggs, D.J., Noguer, M., vander Linden, P.J., Dai, X., Maskell, K., Johnson, C.A., Eds.; Cambridge University Press: Cambridge, UK, 2001. [Google Scholar]
  15. Salinger, M.J. Climate variability and change: Past. present and future—An overview. Clim. Chang. 2005, 70, 9–29. [Google Scholar] [CrossRef]
  16. Kropff, M.J.; Matthews, R.B.; Van Laar, H.H.; Ten Berge, H.F.M. Modelling the Impact of Climate Change on Rice Production in Asia; IRRI and CAB International: Wallingford, UK, 1995; pp. 27–50. [Google Scholar]
  17. Tilman, D.; Balzer, C.; Hill, J.; Befort, L.B. Global food demand and the sustainable intensification of agricultute. Proc. Natl. Acad. Sci. USA 2011, 108, 20260–20264. [Google Scholar] [CrossRef] [PubMed]
  18. Koteswara Rao, K.; Lakshmi Kumar, T.V.; Lakshmana Rao, V. Variability of agroclimatic regime of homogeneous monsoon regions of India. Glob. Planet. Chang. 2012, 92, 48–57. [Google Scholar]
  19. Lakshmi Kumar, T.V.; Koteswara Rao, K.; Barbosa, H.; Jothi, E.P. Studies on spatial patterns of NDVI over India and its relationship with rainfall, air temperature, soil moisture adequacy and ENSO. Geofizika 2013, 30, 73–89. [Google Scholar]
  20. Didan, K. MOD13C2 MODIS/Terra Vegetation Indices Monthly L3 Global 0.05 Deg CMG V006. NASA EOSDIS Land Processes Distributed Active Archive Center (LP DAAC), Located at the US. Available online: https://ladsweb.modaps.eosdis.nasa.gov/missions-and-measurements/products/MOD13C2/ (accessed on 26 August 2019).
  21. Lakshmi Kumar, T.V.; Uma, R.; Koteswara Rao, K.; Barbosa, H.; Patnaik, K.V.K.R.K.; Jothi, E.P. Variability in MODIS NDVI and its relationship with southwest monsoon rainfall over Western Ghats, India. J. Environ. Inform. 2016, 27, 52–61. [Google Scholar] [CrossRef]
  22. Lakshmi Kumar, T.V.; Uma, R.; Koteswara Rao, K.; Barbosa, H.; Patnaik, K.V.K.R.K. On the relation of vegetation with the southwest monsoon rainfall over Western Ghats, India. Nat. Hazards 2016, 84, 425–436. [Google Scholar] [CrossRef]
  23. FAO. Food Balance Sheets; Part of FAOSTAT—FAO Database for Food and Agriculture; Food and Agriculture Organization of UN: Rome, Italy, 2003. [Google Scholar]
  24. Gumbel, E.J. Statistics of Extremes; Columbia University Press: New York, NY, USA, 1958. [Google Scholar]
  25. Sarma, A.A.L.N.; Lakshmi Kumar, T.V.; Koteswara Rao, K. Extreme value analysis of south west monsoon rainfall over Andhra Pradesh. Indian J. Radio Space Phys. 2010, 39, 32–38. [Google Scholar]
  26. Lakshmi Kumar, T.V.; Koteswara Rao, K.; Barbosa, H.; Uma, R. Trends and extreme value analysis of rainfall pattern over homogeneous monsoon regions of India. Nat. Hazards 2014, 73, 1003–1017. [Google Scholar] [CrossRef]
  27. Sarma, A.A.L.N.; Lakshmi Kumar, T.V. Studies on crop growing period and NDVI in relation to water balance components. Ind. J. Radio Space Phy. 2006, 35, 424–434. [Google Scholar]
  28. Revadekar, J.V.; Tiwari, Y.K.; Ravi Kumar, K. Impact of climate variability on NDVI over the Indian region during 1981—2010. Int. J. Remote Sens. 2012, 33, 7132–7150. [Google Scholar] [CrossRef]
  29. Sarma, A.A.L.N.; Lakshmi Kumar, T.V.; Koteswara Rao, K. Development of an agroclimatic model for the estimation of rice yield. J. Indian Geophys. Union 2008, 12, 89–96. [Google Scholar]
  30. Glahn, H.R. Canonical correlation and its relationship to discriminant analysis and multiple regressions. J. Atmos. Sci. 1968, 25, 23–31. [Google Scholar] [CrossRef]
  31. Dieleman, J.A.; Mortensen, D.A.; Buhler, D.D.; Cambardella, C.A.; Moorman, T.B. Identifying associations among site properties and weed species abundance: I Multivariate analysis. Weed Sci. 2000, 48, 567–575. [Google Scholar] [CrossRef]
  32. Dodd, M.B.; Lauenroth, W.K.; Burke, I.C.; Chapman, P.L. Associations between vegetation patterns and soil texture in the shortgrass steppe. Plant Ecol. 2002, 158, 127–137. [Google Scholar] [CrossRef]
  33. Martin, F.N.; Bollero, G.; Bullock, D.G. Associations between field characteristics and soyabean plant performance using canonical correlation analysis. Plant Soil 2005, 273, 39–55. [Google Scholar] [CrossRef]
Figure 1. Linear fits for All India: (a) Rice, (b) Wheat, (c) Jowar (d) Maize and (e) Bajra yields for the period 1951 to 2012.
Sustainability 11 04657 g001
Figure 2. Scatter plots of all India major crop yields and NDVI of 1982 to 2000 (from NOAA AVHRR) and 2001 to 2012 (MODIS Terra).
Sustainability 11 04657 g002
Figure 3. Percentage area covered by irrigation for (a) rice (b) wheat, (c) jowar, (d) maize and (e) bajra crops over India during the period 1951 to 2009.
Sustainability 11 04657 g003
Figure 4. Scatter plots of (a) Rice products and rice yield; (b) wheat products and wheat yield; (c) maize products and maize yield of India.
Sustainability 11 04657 g004
Figure 5. 3 Year averaged data of: food inadequacy (%), food production ($1 per person), average irrigation of five major crops and average annual rainfall over India.
Sustainability 11 04657 g005
Figure 6. (a) Threshold years (T-Years) for rice yield with actual and projected yields; (b) Threshold years (T-Years) for maize yield with actual and projected yields; (c) Threshold years (T-Years) for jowar yield with actual and projected yields.
Sustainability 11 04657 g006
Table 1. Canonical correlations between cropped area, percentage area under irrigation with crop production and yields.
Crop YieldCanonical Correlation—1Canonical Correlation—2
Rice0.930.46
Wheat0.970.46
Maize0.930.25
Jowar0.980.38
Bajra0.960.61

