Abstract
Developing effective ways to manage perishable foods is crucial for food retailers to survive in the highly competitive retail food industry. Due to the nature of perishability, it is necessary to find an effective selling strategy to reduce waste from unsold perishables. Prior studies have proposed using dynamic pricing to develop an optimal pricing structure that compensates the consumer for the loss of freshness as the expiration date approaches. However, these studies have not considered consumer demand that more consumers are likely to purchase units of perishable products with relatively more or fewer days before expiration. In addition, prior studies have not compared dynamic pricing to a “no discount” policy whereby a retailer only displays those perishables that have the fewest remaining days to expiration, keeping units with a longer time before expiration in a warehouse. The results of this study show the potential impacts of different pricing by considering these issues. This study provides new insights for retailers to manage perishable foods with small and large packages that improve the sustainability of food retailing.
1. Introduction
Perishable foods can be characterized as products that are highly sensitive to storage conditions, that deteriorate in value over time, and have a consumable period of thirty days or less [1,2]. Consumers wish to purchase perishable foods that have a comparatively longer time until expiration due to the nature of perishability [3]. The longer time period gives consumers a greater option with respect to the timing of their consumption and lowers the likelihood that the product will spoil before it is used. Consumers’ willingness to pay for perishables decreases as they approach their “Sell By” date [2]. By purchasing perishables that have more days remaining, consumers can expect to consume fresher food and keep that food for longer periods in their refrigerator, which helps consumers to plan their consumption. It is logical that consumers would prefer to purchase perishables with a longer time to the expiration or “Sell By” date if no price reduction is offered for products with fewer days left [4,5]. A perishable food item that has fewer days left may not be purchased if the price of the identical product with more days remaining is the same.
Therefore, food retailers should systematically reduce the price of a perishable item as it approaches its expiration date to compensate consumers for the loss of freshness [4]. Matching prices to the reduced value (freshness) of perishable foods as time elapses can strengthen trust between retailer and consumers and can improve consumer satisfaction, resulting in a higher revisit intention [2,4,6], which is essential for sustainable food retailing. Perishables are normally discarded if they cannot be sold in retail food stores or consumed in consumers’ households before expiration. Consequently, approximately 1.3 billion tons of foods, accounting for one-third of food production, are wasted [7]. The majority of food waste originates from households; for example, 53% of the overall food wastes in EU are generated from households [8].
To address the challenges in managing perishable products, prior studies have investigated dynamic pricing and inventory strategies. They have developed dynamic pricing models for general perishable products to maximize profitability given the myopic consumer demand [9,10,11,12]. Studies have also considered strategic consumer demand to develop an optimal dynamic pricing for perishable products [13,14,15,16,17]. The models developed in these studies are focused on general perishable products, and earlier studies have also focused on developing pricing and inventory models for perishable foods [18,19,20,21,22,23,24,25,26]. These studies used stochastic consumer demands such as myopic, strategic, and price-dependent demand assumptions, which have not considered the realistic situation when consumers actually purchase perishable foods. The value (freshness) of a specific perishable food on a display shelf differs based on the number of days left before the expiration date. To overcome these issues, prior studies developed consumer need-driven demand scenarios and showed the benefits of dynamic pricing strategies for perishables using a deterministic simulation model [5,27]. However, these studies have not compared the impact of dynamic pricing for perishables based on the package size, which may alter consumers’ requirements regarding the days left until expiration. Therefore, it is uncertain whether there is a difference in the performance of such strategies depending on package size. Furthermore, earlier studies have not considered comparing the performance of dynamic pricing to a “no discount” policy by only displaying perishables with fewest remaining days to expiration, keeping identical products with a longer time before expiration in a warehouse.
Considering these issues, the present study investigates the potential impacts of such pricing strategies on retailer performance in terms of sales volume, wastage, and inventory aging using simulation tests. The study found some evidence that dynamic pricing can be effective in improving sales volume, reducing wastage, and preventing inventory aging, compared to a “no discount” policy based on package size. On the other hand, the study findings indicate that depending on package size, the impact of dynamic pricing on retailer performance varies. The study results are expected to provide a useful understanding to the literature and practitioners of the benefits of dynamic pricing for perishables depending on the package size. It is stated that perishable foods such as dairy (e.g., cheese, milk, and yogurt), meat (e.g., beef, chicken, and pork), and vegetable products (e.g., bean sprouts, celery, and hot peppers) are strongly associated with the risk of being discarded for being unsold, and therefore require effective pricing strategies [4]. It is also noted that 31% of foods at the retail and consumer level was wasted in the United States; 10% at the retail level and 21% at consumer level [28]. Therefore, it is essential to find an effective way to manage perishables at the retail and consumer level. Retailers should provide effective pricing strategies that enable consumers to plan their consumption better to reduce such wastage for a sustainable environment. In fact, perishable foods form a large portion of overall sales in food retail stores that are competing by selling basically the same products [4]. Since the perishable food category is important for the success of food retail stores, food retailers need to find more effective ways to attract consumers and reduce unnecessary loss due to expiration to survive in the highly competitive perishable food industry. Although numerous prior studies have developed the optimal dynamic pricing for perishable foods, they have not considered how such strategies might be affected by different package sizes, which is a challenge in practice for food retailers. This study hopes to provide new insights. As for a sustainable food retail industry, since this goal can be achieved by improving efficiency in the selling process, the results of this study are expected to be an important basis for future studies and to provide valuable guidance to help food retailers to attain this objective. This study is not aimed at developing the optimal pricing structure for perishable foods but showing the general impacts of different pricing approaches on retailer performance. Therefore, inspired by prior studies [5,27], this study has provided a narrative description of the logic and assumptions of the simulation, rather than developing the optimal pricing structure based on a mathematical model.
In this study, the “Introduction” section presents the background and states the research question and research gap, the “Literature review” section provides reviews on relevant prior studies, the “Assumptions for Simulation Tests” section presents the details of the simulation model used in this study, the “Results” section presents the results of the simulation tests, and the “Discussion” section examines the results of the simulation including comparisons with findings from prior studies, and the “Conclusions” section draws the conclusions of this study including academic/practical implications, limitations, and future research.
2. Literature Review
Literature on perishable products has generally focused on developing the optimal dynamic pricing that compensates consumers for the loss of value as product expiration dates approach. Prior studies have explored dynamic pricing models for general perishable products that experience value loss as time passes. Kincaid and Darling [9], one of the earliest studies for pricing perishable products, developed a model to maximize retailers’ profits for perishable products. Lazear [10] developed a pricing model for perishable products in a situation of no inventory replenishment and a pre-determined shelf life. Subrahmanyan and Shoemaker [11] developed a model to optimize initial inventories, re-orders and optimal pricing for perishable products. Panda et al. [12] developed a temporary price discount model where consumer demand is dependent on stock level and selling price. These studies considered myopic consumer demand by assuming consumers purchase a product immediately if the price offered is considered to be below their valuations. Myopic consumers do not postpone a purchase by considering the possibility of future price discounts. There are also studies that investigated dynamic pricing for general perishable products under the assumption that consumers are strategic in their purchase decisions. For example, Stokey [13], Aviv and Pazgal [14], Elmaghraby et al. [15], Levin et al. [16], Dasu and Tong [17] incorporated strategic consumer demand, i.e., that consumers consider future price reduction possibilities and therefore future purchase possibilities in their valuations. The Poisson process, which has been used by prior studies for the average number of consumers demanding a product [13,14], can be employed in this study. However, these prior studies developed the optimal dynamic pricing applicable for general perishable products, such as seasonal fashion goods and airline tickets; hence, more studies specifically focusing on perishable foods are needed.
Studies conducted by Li et al. [18] and by Lin et al. [19] included a dynamic pricing model applicable to perishable foods that was enabled by a traceability system that more explicitly estimates the remaining number of days until expiration. These studies assumed that consumer demand is dependent on price. These prior studies developed the optimal dynamic pricing based on the assumption that more accurate shelf life information is accessible (instead of depending on current pre-defined shelf life information). Therefore, these pricing models are applicable with an advanced tracking system for more accurate shelf life information, making it useful with the development of tracking technology, such as Radio Frequency Identification and Time Temperature Integrator.
Recent studies have focused on finding the optimal supply chain design for perishable foods that optimizes inventory levels and pricing. For example, Yang et al. [20], Xiao and Yang [21] developed models for the joint decisions of pricing, shelf space allocation, and replenishment strategies for perishables to maximize retailers’ profitability. Yang et al. [22] developed a supply chain model that considers pricing and temperature controls for perishable foods. Through a price optimization model and a laboratory experiment, Wang et al. [23] investigated the impact of dynamic pricing (multiperiod pricing), freshness, and inventory shortage risk for perishable foods on consumers’ willingness to pay and their purchasing behavior. Their study revealed that pricing strategies lead consumers to strategically behave in purchasing perishables affected by willingness to pay. Chua et al. [24] developed optimal discount and replenishment strategies for a retailer selling a perishable product with uncertain demand. They investigated the optimal timing and discount rate and replenishment policy for aged perishable products. Tekin and Erol [25] developed a new dynamic pricing for perishable foods with a short selling period. They analyzed interactions among price, profitability, and cost in detail using a deterministic simulation model. They found that inventory aging can be reduced by applying various dynamic pricing methods for perishable foods. Buisman et al. [26] studied discounting and replenishment strategies for food retailers to reduce wastage at retail stores, focusing on meat products. They found that discounting perishables by applying dynamically adjustable shelf life information can be more effective than that with predefined fixed shelf life in terms of profitability and wastage. It can be seen that their pricing model is also applicable with the development of tracking technology that shows more accurate shelf life information.
Literature investigating dynamic pricing for perishables can be categorized according to demand assumptions, such as myopic, strategic, and price-dependent demand. For example, Lazear [10], Subrahmanyan and Shoemaker [11] and Panda et al. [12] considered myopic consumer demand; Stokey [13], Aviv and Pazgal [14], Elmaghraby et al. [15], Levin et al. [16], Dasu and Tong [17] and Wang et al. [23] considered strategic consumer demand; and Li et al. [18], Lin et al. [19] and Buisman et al. [26] considered price-dependent consumer demand. However, as mentioned in Chung and Li [5], these demand assumptions have not considered the realistic situation when consumers actually purchase perishable foods. The value (freshness) of a specific perishable product on display can be different depending on how many days are remaining before the expiration date. If the retailer dynamically manages the price of the product, consumers can choose to make a tradeoff between price and freshness, depending on their consumption plans.
To more realistically show the impacts of dynamic pricing for perishable foods, previous studies developed consumer need-driven demand scenarios and investigated the potential impacts of dynamic pricing strategies on retailer performance under those scenarios [5,27]. Chung and Li [5] compared the performance of single-period, two-period and multi-period pricing strategies for perishable foods in terms of sales, profits and disposal (waste) rates. Chung et al. [27] investigated the impact of discount timing on retailer performance in terms of sales, disposal of unsold, expired goods, and inventory aging. The consumer need-driven demand used in these prior studies is considered a suitable scenario for evaluating the effectiveness of dynamic pricing for perishable foods by taking into account realistic situations in which consumers purchase perishables. Inspired by their research, this paper also evaluated the effectiveness of dynamic pricing for perishables in consideration of the consumer need-driven demand scenario. The need-driven demand assumed that each consumer has his/her own requirements regarding the number of days remaining until expiration, and that these requirements follow a normal distribution, which may not consider the impact of such strategies for perishables in large versus small quantities. If the package contains a large quantity, consumers may need more time to plan their consumption; therefore, they are more likely to purchase a product with more days before expiration. If the package contains a small quantity, consumers may expect to consume it immediately and are therefore more likely to accept a product with fewer remaining days to expiration. In addition, these prior studies only compared different pricing strategies. They did not consider the situation where a retailer only displays the perishable foods with the fewest remaining days to expiration, keeping the foods with more remaining days in a warehouse, as we can observe in a real-world situation.
Using simulation tests, this study investigates the impacts of dynamic pricing for perishable foods compared to a “no discount” policy, and considers consumer demand with respect to the likelihood of purchasing a product with relatively more or fewer remaining days to expiration, which may provide a new insight for retailers to manage perishable food sales using small and large packages.
3. Assumptions for Simulation Tests
The best comparison for different pricing and display shelf management strategies for perishables can be made by testing in a real-world system with the assistance of food retailers, which, however, may generate varied results depending on season, region, the type of retail store and product, etc. The present study explores general impacts of different pricing and display shelf management strategies on retailer performance in terms of sales, wastage, and inventory aging of perishables that can provide in-depth understanding the of effect of such strategies. The present study does not focus on a specific situation (specific product type, type of retail store, region, etc.). The simulation test enables examining new strategies, operations, and procedures without expensive experiments of a real-world system [29]. Therefore, the present study selects simulation tests to compare the performance, from food retailers’ perspective, of two different display shelf and price management strategies for perishable foods. Two recent studies evaluating the impacts of dynamic pricing for perishables on retailer performance employed the C programming language in a modelling simulation [5,27]. Inspired by these prior studies, this study also employed the C programming language to conduct simulation tests that executed and generated results based on the narrative assumptions outlined in this section. Microsoft Visual Studio was employed to develop a simulation for this study. One of the advantages of the simulation tests employing the C language in this study is that they can imitate a typical business process in a food retail store based on various assumptions, generating results in a simplified (and easily understandable) format.
Inventory and replenishment strategy in the simulation follows a typical business process in food retail stores that, for a specific product type, a retailer sets the target stock amount and generally restocks the following day up to the target amount. Consumer behavior in the simulation follows the consumer need-driven demand assumption that has been used in earlier studies [5,27], with the modification of consumer need distribution to compare the benefits of dynamic pricing depending on package size. Moreover, two different display shelf and price management strategies are simulated, which allow for an analysis of the impacts of dynamic pricing compared to a “no discount” policy.
The efficiency of such strategies may differ with the length of product shelf life. Therefore, this study considers two different possibilities: four and eight days of shelf life, representing two different perishable food items—one with a very short shelf life and another with a relatively longer shelf life, respectively. A total of 30 days was selected as the sales period in the simulation. The core assumptions of the simulation are as follows.
3.1. Inventory
Let s be the target stock amount, and a specific perishable food is restocked to s every morning. This study considers three different target stock amounts, s ∈ {20,40,60}, which allows for a comparison of the performance where the demand is accurately forecasted, under-forecasted, and over-forecasted.
3.2. Display Shelf and Price Management
This study considers two different scenarios for display shelf and price management.
Display strategy 1: For a specific perishable food, the retailer does not discount the price and only displays units with the fewest remaining days, keeping the products with more days in the warehouse. If the products on display are sold out, the identical products in the warehouse with the fewest remaining days are immediately transferred to the display shelf. Let P0 be the initial price. The price is always P0.
Display strategy 2: For a specific perishable food, the retailer displays all of the available units of the product on the display shelf and discounts the price as each day passes. Let l be the length of shelf life. For Day T (T = 1, 2, …, l), the price on Day T, P(t), can be described as: P(t) = P(T-1). The price of a specific perishable food is managed as shown in Table 1.

Table 1.
Pricing in the simulation for display strategy 2.
Please see Appendix A for a full narrative description of the assumptions.
3.3. Consumer Behavior
Consumer purchasing behavior in this study follows the need-driven demand scenario used in prior studies [5,27] as follows.
(1) Consumer i has own consumption need for purchasing a specific perishable food, therefore, has own required number of remaining days, d, to purchase the product, d ∈ {1, 2, …, l}. The average number of consumers demanding a specific perishable food follows a Poisson process, which has been used by earlier studies [5,14,30], with on average, λ per day. The present study sets λ = 40.
(2) If all of the displayed products have fewer than d remaining days or there is no product available on the display, i does not make a purchase and leaves.
(3) If there are displayed products with equal to or greater than i’s required remaining days d, then i buys the product with the cheapest price and the longest remaining days from among the displayed products having equal to or greater than the required remaining days [5].
(4) Figure 1a,b presents a simulated distribution of consumers’ required remaining days of shelf life for purchase. Consumer need distribution 1 and 1* represent the case that more consumers are likely to require a product with a relatively longer remaining days, as for a large package product. Consumer need distribution 2 and 2* represent the case that more consumers are likely to accept a product with relatively short remaining days, as for a small package product.
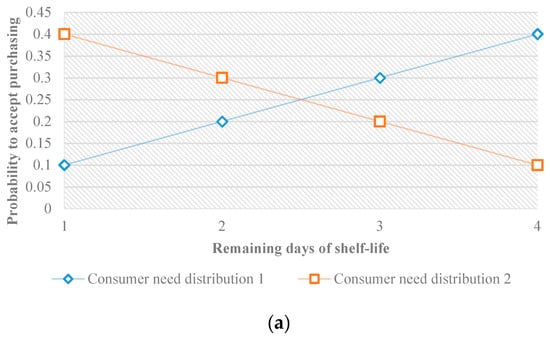
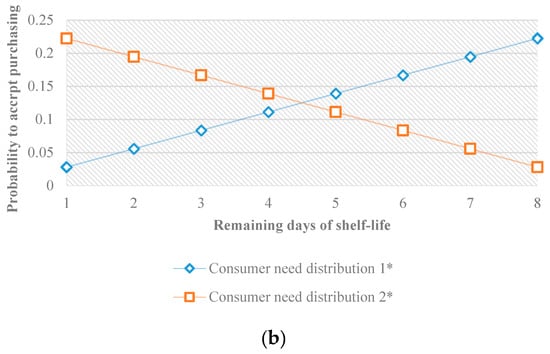
Figure 1.
(a) Consumer need distributions in the simulation, the full length of shelf life is 4 days; (b) Consumer need distributions in the simulation, the full length of shelf life is 8 days.
Please see Appendix A for a full narrative description of the assumptions.
4. Results
The simulation tests enable us to compare the performance of different display shelf management strategies quantitatively, using the input values explained in Section 3. For a specific perishable food with four days of shelf life, the results of the simulation tests are spanned by s ∈ {20, 40, 60}, d ∈ {consumer need distribution 1 and consumer need distribution 2}, and display shelf management strategy ∈ {display strategy 1, display strategy 2}. This study refers to simulation results spanned by, consumer need distribution 1 and display strategy 1 as Case 1-1 (s = 20), consumer need distribution 1 and display strategy 2 as Case 1-2 (s = 20), consumer need distribution 2 and display strategy 1 as Case 1-1* (s = 20), consumer need distribution 2 and display strategy 2 as Case 1-2* (s = 20), consumer need distribution 1 and display strategy 1 as Case 2-1 (s = 40), and so on, and consumer need distribution 2 and display strategy 2 as Case 3-2* (s = 60). The same method is used to refer to perishable food items with eight days of shelf life.
4.1. Effects on Sales and the Number of Discarded Products
The results of the simulations, summarized in terms of sales and the number of discarded products due to expiration, are presented in Table 2.
Table 2.
Summarized results of the simulation tests.
Table 2 shows that, when s = 20, where demand significantly exceeds the target stock amount, regardless of the distribution of consumers’ needs and the shelf life, different pricing and display shelf strategies have no effect on retailer performance. For Cases 1-1, 1-2, 1-1*, and 1-2*, the number of products sold (NS), the number of discarded products due to expiration (ND), and the number of consumers who could not purchase the product (NL) are the same for different shelf lives, display strategies, and simulated consumer needs. It is logical that no products are discarded due to expiration and that many consumers could not purchase because the target stock amount is significantly lower than the number of consumers demanding the product, meaning that consumers frequently face product sellouts.
For l = 4 days, display strategy 2 can somewhat enhance NS compared to display strategy 1, but it also results in a slight increase in ND when the target stock amount equals the average demand and more consumers are likely to purchase units with relatively more days of remaining shelf life (see Cases 2-1 and 2-2 for l = 4). On the other hand, when the target stock amount significantly exceeds the average demand, and more consumers are likely to purchase units with relatively more days of remaining shelf life, display strategy 2 can significantly improve NS and reduce ND compared to display strategy 1 (see Cases 3-1 and 3-2 for l = 4).
For l = 8 days, display strategy 2 can very slightly enhance NS and increase ND over display strategy 1 when the target stock amount equals the average demand, and more consumers are likely to purchase units with relatively more days of remaining shelf life (see Cases 2-1 and 2-2 for l = 8). However, these differences are minor. On the other hand, display strategy 2 can significantly improve NS and increase ND compared to display strategy 1 when the target stock amount exceeds the average demand, and more consumers are likely to purchase units of the product with relatively more days to expiration (see Cases 3-1 and 3-2 for l = 8).
For both l = 4 and l = 8 days, when the target stock amount equals the average demand and more consumers accept purchasing units of the product with relatively fewer remaining days to expiration, the effects of the different display shelf strategies on NS and ND are almost the same (see Cases 2-1* and 2-2*). When the target stock amount significantly exceeds the average demand and more consumers accept purchasing units of the product with relatively fewer remaining days, display strategy 2 somewhat improves NS versus display strategy 1 for l = 4 and very slightly improves NS for l = 8 days. However, display strategy 2 can increase ND over display strategy 1, and this negative impact is more significant for l = 4 (see Cases 3-1* and 3-2*).
4.2. Effects on the Aging of Inventory
Table 3 and Table 4 show how different display shelf management strategies influence inventory aging.
Table 3.
The effects of display shelf management on inventory aging, l = 4 days.
Table 4.
The effects of display shelf management on inventory aging, l = 8 days.
As Table 3 and Table 4 show, when s = 20, indicating that the target stock amount is significantly lower than the average demand, regardless of consumers’ need distribution and the length of shelf life, every unit is sold when the highest number of days of shelf life remains (see Cases 1-1, 1-2, 1-1* and 1-2* for both l = 4 and 8 days).
When s = 40 or s = 60, so that the target stock amount is equal to (s = 40) or significantly exceeds (s = 60) average demand, display strategy 2 can generally assist the retailer to prevent inventory aging, helping the retailer to provide fresher (more days remaining until the expiration date) perishable food to consumers, regardless of consumers’ need distribution and product shelf life, when compared with display strategy 1. For example, when s = 60, with simulated consumer needs 2 and l = 4 days, products are sold with up to 1 day of shelf life remaining under display strategy 2 (see Case 3-2* in Table 3) and products are sold with up to 2 days of shelf life remaining with display strategy 1 (see Case 3-1* in Table 3). However, for Case 3-2* in Table 3, only three units and 12 units are sold with one and two remaining days, respectively, and 47 and 1125 units are sold with three and four days remaining. In contrast, for Case 3-1* in Table 3, 6639 and 482 products are sold with two, three and four days remaining, respectively. Therefore, with display strategy 2, although units are sold up to the last day remaining, the number sold is very small, and many more units are sold with the full number of remaining days compared to the results for display strategy 1.
4.3. Effects on the Revenue
It is clear that revenue is very sensitive to the discount rate. Display strategy 1 does not discount the price as each remaining day passes; therefore, the revenue is not affected by the discount rate. However, the revenue when display strategy 2 is employed is significantly affected by the amount of the discount as each day passes. It is difficult to consider all possible cases of discount rate; therefore, inspired by Chung and Li [4,5], a simplified linear fixed discount approach is used to compare the performance of display strategies 1 and 2 in terms of revenue. Based on these prior studies, linear fixed discount approaches that increase the discount rate by 10 and 5% points as each day passes were employed to evaluate the revenue as cases. If this study sets the P0 (initial price) as 10, then the prices in Table 5 can be applied for display strategy 2; for display strategy 1, the price is always 10 regardless of the days remaining.
Table 5.
Pricing examples for display strategy 2 to evaluate the revenue.
By using information in Table 3 and Table 4, the following revenues can be calculated; note that cases 1-1, 1-2, 1-1* and 1-2* were not calculated as the sales volumes are the same and all the products were sold with the full shelf life remaining.
As shown in Table 6, display strategy 2 can improve revenue in some cases. The cases in which display strategy 2 performs better than display strategy 1 in terms of revenue are bolded.
Table 6.
Comparison of revenue.
5. Discussion
The main objective of this study is to compare the performance of a dynamic pricing strategy with a “no discount” policy with respect to sales, waste, and inventory aging, incorporating a consumer need-driven scenario. Prior studies that incorporated a consumer need-driven scenario did not investigate situations where more consumers were likely to purchase a product with relatively fewer (longer) remaining days. By considering such a scenario, the present study provides a new insight into pricing and display shelf management for perishables using large (i.e., more consumers are likely to accept a product with relatively more remaining days) versus small packages (i.e., more consumers are likely to accept a product with relatively fewer remaining days). The results of the simulation tests can be interpreted as follows.
Popular perishable food products are sold with the full shelf life remaining, and these products generate no waste regardless of the chosen pricing and display shelf management strategy, the length of shelf life for a product, and consumers’ required remaining days of shelf life. In other words, when average demand is typically greater than the target stock amount, regardless of products’ package size and the length of products’ shelf life, different pricing and display shelf strategies generate similar performance in terms of sales volume and wastage due to unsold products. However, in this case, sales volume is significantly lower in comparison to the situations where the target stock amount equals or exceeds the average demand. This result supports the study results by Chung and Li [5] and Chung et al. [27].
When retailers can accurately measure average demand, regardless of the length of products’ shelf life, displaying all the available units of a product and discounting the price of each unit as the number of days to expiration approaches could help retailers to minimally improve sales volume, but simultaneously minimally increase wastage due to unsold, for a product that has large packaging. These impacts are more significant for a product that has a relatively shorter shelf life. However, for a product with a small package size, different pricing and display shelf strategies generate a similar performance in terms of sales volume and wastage arising from unsold products. In addition, by displaying all the available units of a product and discounting the price as each remaining day passes, retailers can expect to reduce inventory aging regardless of product package size.
For the less-popular perishable food products—that is, the target stock amount exceeding the average demand—displaying all the available units and discounting the price of the units as each day passes could help retailers to reduce inventory aging regardless of product package size. In other words, consumers can purchase fresher perishable foods, which potentially helps in reducing food waste generated from households. This positive effect is more significant than for perishable food products for which the retailer can accurately measure average demand. Note that the majority of food waste comes from households [8]. Moreover, for perishable food products that have a large package, retailers can expect a significant improvement in sales by implementing dynamic pricing. This positive effect can be more significant for products with a relatively shorter shelf life; in this case, retailers can expect a significant reduction in waste. For a product with a small package size, retailers can expect slight improvement in sales volume, but increase in wastage due to unsold products.
Numerous earlier studies have focused on showing the benefits of implementing dynamic pricing for perishables [9,10,11,12,13,14,15,16,17,18,19,20,21,22]. Past studies using a deterministic simulation showed that inventory aging of perishable foods can be reduced by applying various dynamic pricing strategies [25]. Past studies using consumer need-driven demand scenarios showed that more dynamic pricing and earlier discount can enhance the sales volume, reduce wastage, and inventory aging when consumers’ requirement regarding remaining days left follow normal distribution and retailers can accurate measure average demand or the target stock amount exceeds average demand [5,27]. The present study also shows the benefits of dynamic pricing for perishables; on the other hand, it shows that dynamic pricing for perishables may not always perform better than a “no discount” policy based on package size, which has not been found in these earlier studies.
6. Conclusions
This study shows that food retailers and consumers should work together to reduce unnecessary perishable food waste, which reduces costs to both retailers and consumers, and supports a sustainable environment. Food retailers should develop effective pricing strategies that minimize inventory aging and consumers should plan their consumption before purchasing perishables. For such pricing strategies to be effective, food retailers need to educate consumers to consume more rationally and inform them of the benefits of such strategies in reducing waste and providing consumers with fresher foods. Dynamic pricing can help consumers to plan their consumption, which could reduce waste generated from households, and improve consumer satisfaction, which in turn contributes to improving sustainable food retailing by generating better sustainable relationships between retailers and consumers. In addition, every ton of food waste produces 4.5 tons of CO2 [31]; therefore, retailers’ efforts to reduce food waste helps the environment sustainability and can contribute to a positive corporate image. As mentioned earlier, this study was not focused on a specific food retail store and specific food types but rather on the general impacts of different pricing approaches on retailer performance from a broad perspective. Therefore, the results of this study are expected to be able to be applied in the case of any type of retail store that deals with various perishable foods (e.g., dairy, meat and vegetable products).
This study provides the following valuable academic and practical implications. For academic implications, this research contributes to our understanding of consumer demand and consumption plans with regard to perishables, which has been understudied in the literature. Prior studies have not considered the impact of providing trade-offs between price and the remaining days left on expiration and retailer performance based on the package size. Based on the assumption that consumers’ purchasing behavior can differ depending on package size due to difference in consumption plans, the present study demonstrates the effectiveness of pricing models from retailers’ perspective, which have rarely been studied. This study makes contributions to marketing and retailing literature by offering new insights into the demand feature that can be applied in the study of pricing for perishable foods. Additionally, this research can be used as the basis for follow-up studies considering display shelf and price management for perishable foods with different package sizes.
For practical implications, the results of this study provide a useful understanding of the benefits of dynamic pricing for perishables, and can be used as a guide for retailers seeking an effective pricing strategy for perishables depending on package size and the length of shelf life, matching their individual circumstances. This study found that dynamic pricing may or may not perform better than a “no discount” policy; therefore, food retailers can apply it according to the situation by referring to the result of this study. The results of this study provide evidence about the value of dynamic pricing for perishable food retailers; therefore, they can be helpful in resolving retailers’ concerns about whether different strategies can be used for different package sizes for perishable foods, which can assist them in reducing inventory aging and food waste due to unsold items and consequently, improve sales volume.
This study has limitations. This study showed that more dynamic pricing can increase the revenue in some cases, on the other hand, it does not consider the issue of profitability. The profitability can vary depending on the changes in operational costs and discount rates. Employing dynamic pricing can increase operational costs, and this study does not develop an optimal discount rate for dynamic pricing which affects profitability of retailers. Furthermore, the need-driven demand scenarios assume that all consumers are rational and plan their consumptions in advance. Some consumers may not be rational and may purchase units of products randomly. Moreover, the price elasticity of demand has not been considered. With consumer need-driven demand in this study, consumers make economic trade-offs between price and remaining shelf life based on their consumption needs, as long as the price for a product with fewer remaining days is cheaper than the original price of the product with full shelf life. In real-world situations, consumers may not make trade-offs between the price and freshness of perishable foods if the price reduction is not big enough to offset the decrease in freshness. In addition, the assumptions of the simulation were described narratively. A narrative description has the benefit of being able to be understood by readers who are not experts in mathematical modelling. Therefore, it can be more useful for practitioners. On the other hand, one of the weaknesses of a narrative description is that it may be difficult to follow and reproduce compared to mathematical modelling.
Future studies should consider these limitations to more accurately determine the effectiveness of such pricing strategies. Studies conducting in-depth interviews with large food retail stores and consumers to imitate simulation settings that are more realistic are essential to show the more realistic benefits of implementing dynamic pricing. There might be a potential increase in operating costs due to hiring additional staffs and labels for price changes more frequently. Moreover, to build more realistic consumer demand assumptions, interviews with consumers can help in observing how they actually behave at the stage of purchasing perishable foods. Future studies considering changes in operation costs, frequency, and the rate of discount to assess profitability and develop a consumer demand model considering the need-driven demand scenarios and price-dependent demand can provide a better understanding of the benefits of such strategies.
Funding
This research received no external funding.
Conflicts of Interest
The author declares no conflict of interest.
Appendix A. Full Narrative Description of Simulation Assumptions
1. Display Shelf and Price Management
Display strategy 1: For a specific perishable food, the retailer does not discount the price at all and only displays the units with the fewest remaining days left until the expiration date, keeping the products with more days remaining in the warehouse in the simulation. If the products on display are sold out, identical products in the warehouse with the fewest remaining days of shelf life are immediately transferred to the display shelf in the simulation. For example, if the full length of shelf life of a specific perishable food is four days and the retailer’s target stock amount is 40, 40 units are displayed on the first day of business in the simulation. If 30 units are sold on Day 1, then on Day 2, 10 units that did not sell on Day 1 will have three remaining days, and 30 units with four remaining days are restocked from the food supplier. Therefore, on Day 2, in the simulation, the retailer displays the 10 units that have three remaining days and keeps 30 units with four remaining days in the warehouse; when all 10 units with three remaining days are sold, 30 units with four remaining days are immediately transferred from the warehouse to the display shelf for selling, and so on. Let P0 be the initial price. As the retailer does not discount the price in display strategy 1, the price of the product is P0 regardless of the remaining days left to the expiration date.
Display strategy 2: For a specific perishable food, the retailer displays all of the available units of the product on the display shelf, and therefore does not keep units of the product in the warehouse. The retailer discounts the price of a given unit as each day passes. Let l be the length of shelf life. For Day T (T = 1, 2, …, l), the price on Day T, P(t), can be described as: P(t) = P(T-1). This strategy that discounts the price of the item as each remaining day passes enables consumers to make economic trade-offs in the simulation in terms of the price of the item versus the number of remaining days to expiration, based on their consumption needs. For example, if the full shelf life of a specific perishable food is 4 days and the retailer’s target stock amount is 40, then 40 units are displayed on the first day of business in the simulation. If 30 units are sold on Day 1, then on Day 2, the 10 units that were not sold on Day 1 will have three remaining days, and the 30 units with four remaining days are restocked from the food supplier. Therefore, on Day 2, in the simulation, 10 units of the products with three remaining days and 30 units of identical products with four remaining days are displayed simultaneously on the display shelf. However, the prices for products with three remaining days and four remaining days are P1 and P0, respectively, which allows consumers to make economic trade-offs between price and freshness based on their own requirements with respect to the remaining days.
2. Consumer Behavior
Consumer purchasing behavior in this study was simulated using the need-driven demand scenario used in prior studies [5,27]. Inspired by the need-driven demand scenario, consumers’ purchasing behavior in the simulation is defined as follows. Each consumer has his or her own consumption need for purchasing a specific perishable food and, therefore, has his or her own required number of remaining days (at least d remaining days of shelf life) until expiration to purchase the product, d ∈ {1, 2, …, l}. The average number of consumers demanding a specific perishable food follows a Poisson process, which has been widely used by earlier studies on pricing to determine consumers’ arrival rates (e.g., Aviv and Pazgal [14]; Bitran and Mondschein [30]; Chung and Li [5]), with on average, λ per day. The present study sets λ = 40. This enables us to test the efficiency of different display shelf and pricing strategies for situations where the average demand surpasses, is lower than, and equals the target stock amount, as this study considers three possibilities for different values of s (s ∈ {20, 40, 60}).
In the simulation, if all of the displayed products have fewer than d remaining days or there is no product available on the display shelf due to a sellout, a consumer does not make a purchase and leaves. For display strategy 1, where the retailer does not discount the price and only displays the units with the shortest remaining shelf life, if the displayed products have at least d remaining days, a consumer purchases the product.
For display strategy 2, where, for a specific perishable food, the retailer displays all of the available units but discounts them as each remaining day passes, if there are units with at least d remaining days, a consumer purchases the product with the lowest price among the displayed products that have longer than d remaining days in the simulation. For example, assume that the full shelf life of a specific perishable food is 8 days and a consumer requires at least five remaining days. In the simulation, if the specific products displayed have eight, five, and four remaining days, the consumer purchases the product with five remaining days based on the following logic. Among the specific products displayed, those with eight and five remaining days to expiration fulfill the consumer’s required remaining days, and the price of product with five remaining days is lower than that with eight days remaining, as shown in Table 1. In other words, following the consumer need-driven demand, if there are displayed products with equal to or greater than a consumer’s required remaining days, then the consumer buys the product with (1) the cheapest price and (2) the longest remaining days from among the displayed products having equal to or greater than the required remaining days, as used in the study of Chung and Li [5].
In previous studies, consumers’ required remaining days of shelf life for purchase follows a normal distribution [5,27]. However, this study uses a simulated distribution of consumer needs as shown in Figure 1, by considering the following scenarios. In the case of a large package size of the product, more consumers are likely to need a product with a relatively longer remaining shelf life, as they may wish to consume over several days instead of consuming the entire package immediately (i.e., consumer need distributions 1 and 1*). However, in the case of a small package size of a perishable food product, more consumers are likely to accept a product with relatively short remaining shelf life, as they are more likely to consume the product immediately (i.e., consumer need distributions 2 and 2*). In Figure 1, the x-axis represents the remaining days of shelf life and the y-axis represents the probability that consumers will accept purchasing a product with a certain number of days remaining in the simulation. For instance, consumer need distribution 1 refers to a situation in which more consumers are likely to accept a product with relatively more remaining days. Therefore, when a product’s full shelf life is 4 days and consumers follow consumer need distribution 1, the probability that consumers will accept purchasing a product with 1 day remaining is 0.1, 2 days remaining is 0.2, 3 days remaining is 0.3 and 4 days remaining is 0.4 in the simulation. It should be noted that the probability of accepting to purchase a product with a certain number of days remaining can vary depending on the product type and consumers’ individual preferences. As it is difficult to consider all possible cases, this study used a simplified linear approach that increases (consumer need distribution 1) or decreases (consumer need distribution 2) the probability by 10% (l = 4 days) or 2.7778% points (l = 8 days) as the number of days remaining increases by one day.
References
- Van Donselaar, K.; van Woensel, T.; Broekmeulen, R.; Fransoo, J. Inventory control of perishables in supermarkets. Int. J. Prod. Econ. 2006, 104, 462–472. [Google Scholar] [CrossRef]
- Tsiros, M.; Heilman, C.M. The effect of expiration dates and perceived risk on purchasing behaviour in grocery store perishable categories. J. Mark. 2005, 69, 114–129. [Google Scholar] [CrossRef]
- Broekmeulen, R.A.C.M.; van Donselaar, K.H. Quantifying the potential to improve on food waste, freshness and sales for perishables in supermarkets. Int. J. Prod. Econ. 2009, 209, 265–273. [Google Scholar] [CrossRef]
- Chung, J.; Li, D. The prospective impact of a multi-period pricing strategy on consumer perceptions for perishable foods. Br. Food J. 2013, 115, 377–393. [Google Scholar] [CrossRef]
- Chung, J.; Li, D. A simulation of the impacts of dynamic price management for perishable foods on retailer performance in the presence of need-driven purchasing consumers. J. Oper. Res. Soc. 2014, 65, 1177–1188. [Google Scholar] [CrossRef]
- Jones, M.A.; Reynolds, K.R. The role of retailer interest on shopping behavior. J. Retail. 2006, 82, 115–126. [Google Scholar] [CrossRef]
- Food and Agriculture Organisation of the United Nations (FAO). Key Facts on Food Loss and Waste You Should Know! Available online: http://www.fao.org/save-food/resources/keyfindings/en/ (accessed on 19 June 2019).
- Stenmarck, A.; Jensen, C.; Quested, T.E.; Moates, G. Estimates of European Food Waste Levels. Available online: https://www.eu-fusions.org/phocadownload/ Publications/Estimates%20of%20European%20food%20waste%20levels.pdf (accessed on 19 June 2019).
- Kincaid, W.M.; Darling, D.A. An inventory pricing problem. J. Math. Anal. Appl. 1963, 7, 183–208. [Google Scholar] [CrossRef]
- Lazear, E.P. Retail pricing and clearance sales. Am. Econ. Rev. 1986, 76, 14–32. [Google Scholar]
- Subrahmanyan, S.; Shoemaker, R. Developing optimal pricing and inventory policies for retailers who face uncertainty demand. J. Retail. 1996, 72, 7–30. [Google Scholar] [CrossRef]
- Panda, S.; Saha, S.; Basu, M. An EOQ model for perishable products with discounted selling price and stock dependent demand. Cent. Eur. J. Oper. Res. 2009, 17, 31–53. [Google Scholar] [CrossRef]
- Stokey, N.L. Intertemporal price discrimination. Q. J. Econ. 1979, 93, 355–371. [Google Scholar] [CrossRef]
- Aviv, Y.; Pazgal, A. Optimal pricing of seasonal products in the presence of forward-looking consumers. Manuf. Serv. Oper. 2008, 10, 203–229. [Google Scholar] [CrossRef]
- Elmaghraby, W.; Gulcu, A.; Keskinocak, P. Designing optimal preannounced markdowns in the presence of rational customers with multiunit demands. Manuf. Serv. Oper. 2008, 10, 126–148. [Google Scholar] [CrossRef]
- Levin, Y.; McGill, J.; Nediak, M. Dynamic pricing in the presence of strategic consumers and oligopolistic competition. Manag. Sci. 2009, 55, 32–46. [Google Scholar] [CrossRef]
- Dasu, S.; Tong, C. Dynamic pricing when consumers are strategic: Analysis of posted and contingent pricing schemes. Eur. J. Oper. Res. 2010, 204, 662–671. [Google Scholar] [CrossRef]
- Li, D.; Tang, O.; O’Brien, C.; Wang, X. Improve food retail supply chain operations with dynamic pricing and product tracing. Int. J. Serv. Oper. Inform. 2006, 1, 347–362. [Google Scholar] [CrossRef]
- Lin, C.C. The role of customer perceived value in generating customer satisfaction: An e-business perspective. J. Res. Mark. Entrepr. 2003, 5, 25–39. [Google Scholar]
- Yang, S.; Xiao, Y.; Kuo, Y. The supply chain design for perishable foods with stochastic demand. Sustainability 2017, 9, 1195. [Google Scholar] [CrossRef]
- Xiao, Y.; Yang, S. The retail chain decision for perishable food: The case of pricing strategy and shelf space allocation. Sustainability 2017, 9, 12. [Google Scholar] [CrossRef]
- Yang, S.; Xiao, Y.; Zheng, Y.; Liu, Y. The green supply chain design and marketing strategy for perishable food based on temperature control. Sustainability 2017, 9, 1511. [Google Scholar] [CrossRef]
- Wang, X.; Fan, Z.P.; Wang, Y.; Li, M. A laboratory exploration for multi-period perishable food pricing. Br. Food. J. 2015, 117, 2214–2233. [Google Scholar] [CrossRef]
- Chua, G.; Mokhlesi, R.; Sainathan, A. Optimal discounting and replenishment policies for perishable products. Int. J. Prod. Econ. 2017, 186, 8–20. [Google Scholar] [CrossRef]
- Tekin, P.; Erol, R. A new dynamic pricing model for the effective sustainability of perishable product life cycle. Sustainability 2017, 9, 1330. [Google Scholar] [CrossRef]
- Buisman, M.E.; Haijema, R.; Bloemhof-Ruwaard, J.M. Discounting and dynamic shelf life to reduce fresh food waste at retailers. Int. J. Prod. Econ. 2019, 209, 274–284. [Google Scholar] [CrossRef]
- Chung, J.; Choi, D.; Park, I. The impacts of scheduling price discounts for perishable foods on retailer performance. J. Channel. Retail. 2014, 18, 107–125. [Google Scholar]
- Buzby, J.C.; Wells, H.F.; Hyman, J. The Estimated Amount, Value, and Calories of Postharvest Food Losses at the Retail and Consumer Levels in the United States. Available online: https://www.google.com/url?sa=t&rct=j&q=&esrc=s&source=web&cd=4&cad=rja&uact=8&ved=2ahUKEwj_67ynlPLjAhVxKqYKHfpBAf8QFjADegQIBBAC&url=https%3A%2F%2Fwww.ers.usda.gov%2Fwebdocs%2Fpublications%2F43833%2F43679_eib121_summary.pdf%3Fv%3D0&usg=AOvVaw0QOy2oHlF0rWwK4AAEJST1 (accessed on 8 August 2019).
- Banks, J. (Ed.) Principles of simulation. In Handbook of Simulation: Principles, Methodology, Advances, Applications, and Practice; John Wiley & Sons, Inc.: Hoboken, NJ, USA, 1998; Volume 1, pp. 3–30. [Google Scholar]
- Bitran, G.R.; Mondschein, S.V. Periodic pricing of seasonal products in retailing. Manag. Sci. 1997, 43, 64–79. [Google Scholar] [CrossRef]
- Wrap. The Food We Waste. Available online: http://wrap.s3.amazonaws.com/the-food-we-waste-executive-summary.pdf (accessed on 19 June 2019).


© 2019 by the author. Licensee MDPI, Basel, Switzerland. This article is an open access article distributed under the terms and conditions of the Creative Commons Attribution (CC BY) license (http://creativecommons.org/licenses/by/4.0/).