1. Introduction
In the 2018 World Happiness Index, Korea ranked 57 out of 156 countries [
1]. Diverse factors affect the happiness level (HL) of citizens; however, the quality of their living environment is considered a major issue affecting their HL [
2,
3,
4]. Many countries, including the United States, Australia, and European nations, consider the green environment in relation to the HL of their citizens by carrying out qualitative examinations of selected cities or urban areas. An awareness of the importance of green environments in housing areas has become more critical as a result of expanding urbanization: currently, 50 percent of the world’s population live in urban areas [
5,
6].
This research is interested in the HL of citizens in relation to their living environment, specifically in terms of a green environment. In Korea, apartment complexes have developed rapidly since 1962 as a result of dramatic population growth in cities. However, the focus of their development has been on their social capital, including their branding value, aesthetic aspects, and economic development value, and the importance of the natural environment within housing areas has been ignored [
7,
8,
9]. In addition, the garden designs and types of plants within apartment complexes have been the main focus in green environments in Korea [
10].
Many studies in Korea have dealt with green space arrangements, planting structures, and green ratios in apartment complexes, emphasizing the importance of garden concepts and a beautiful environment. However, consideration of how this green environment affects residents in their housing area is lacking. As citizens’ lifestyles become more heavily urbanized, many studies in Europe, Australia, and the United States have started exploring green spaces in relation to residents’ life satisfaction, mental health, and physical health [
11,
12,
13,
14]. These studies have emphasized that green environments provide amenity value to residents and consequently influence their life satisfaction. Well-being is a concept considered in many studies exploring the green environment [
11,
15,
16]. The green environment can provide amenity value to people in various ways. Scenic amenity tends to positively influence residents’ mental health, whereas greater accessibility to green environments tends to positively influence residents’ physical health by reducing risks associated with obesity and a sedentary lifestyle [
5,
11,
17].
The aim of this research was to explore the importance of a green environment in housing areas, and its effect on residents’ HL in terms of life satisfaction. This research examines residents’ cognitive state regarding green environments and considers how these environments influence their HL in terms of their overall life satisfaction correlating with community life. A survey of residents in two districts was distributed to enable comparison of their green environments. This research concentrates on the effect of a green environment on residents’ HL, regardless of the residents’ other background data. Given that the residents surveyed were from the same housing complex, their sociodemographic and socioeconomic status was expected to be within a similar range, because Korean housing complexes are seen as clusters of populations based on a certain similar economic level [
9].
3. Methodology
Apartment complexes in Korea retained 44 percent of green areas until the 1980s. After this period, the ratio decreased until the mid-1990s, when only 25 percent of green areas remained [
10]. Since then, the importance of a green environment has been recognized, and many apartment complexes have tried to increase the ratio of green environments within the housing area. However, there remains a lack of efficient and structural green environments in housing areas for residents in Korea. This research examined the current status of residents’ experiences of the green environment in their housing areas through comparison of two selected districts—one in inner Seoul and the other outside Seoul. By comparing residents’ HL based on their satisfaction with the green environment in their housing area, the importance of the green environment and its critical effectiveness on residents’ HL was explored.
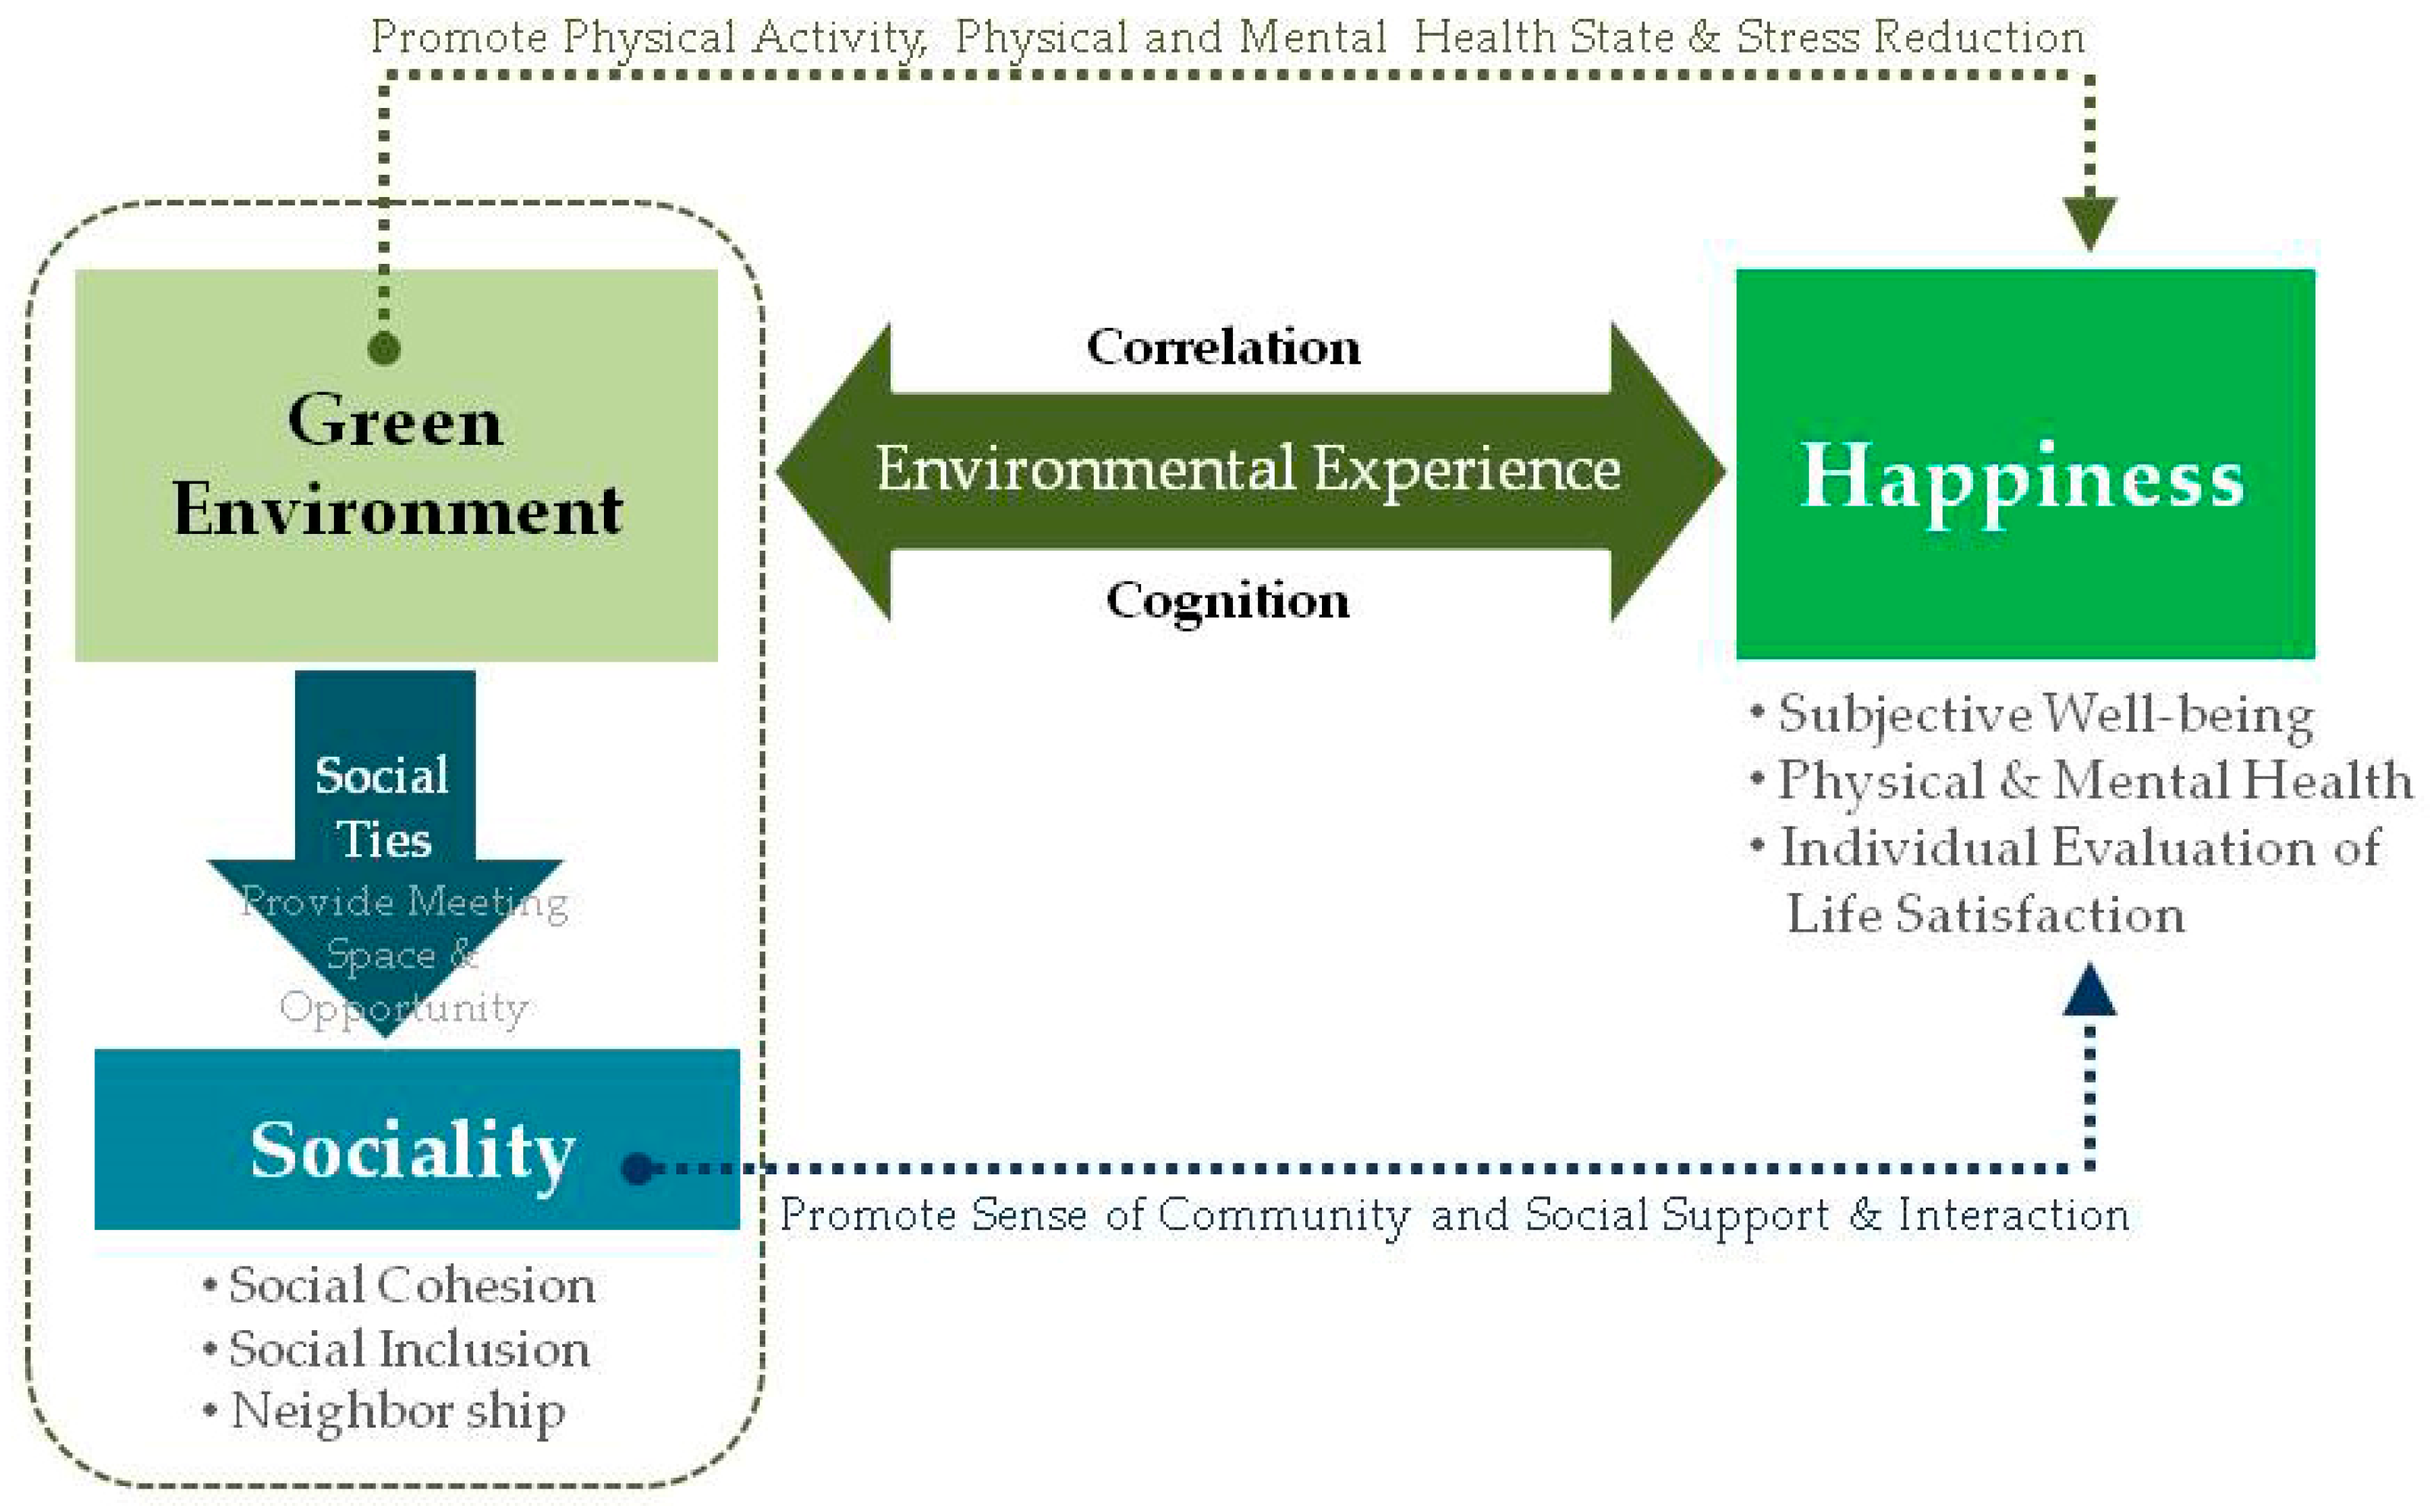
To evaluate the dimensional happiness of residents in correlation with sociality focusing on the green environment within housing areas, a happiness analysis framework was created for this research, as shown in
Figure 1.
This happiness analysis framework principally denotes the relationship between the variables, green environment, sociality, and happiness. The green environment is associated with the sociality of residents through providing a physical meeting space and meeting opportunity among neighbors. The green environment is critically related to the happiness of residents in terms of promoting residents’ physical activity, health state, and reduction of stress. It can also be directly related to happiness and sociality through promoting a sense of community, social support, and interaction to residents. The influential results from the relationship between individual variables as a whole consequently are correlated, affecting the overall happiness of residents from the subjective dimensional perspective, with a focus on how the residents feel and experience their environment.
The provision of a higher green ratio is critical; however, the efficiency and effectiveness of residents’ practical experience and usage of the green spaces may be more important. Through a review of advanced research on green spaces, the categories of green environments were organized as shown in
Table 1. This categorization of green environments was critical in terms of the definition of green environment when communicating with survey respondents. The categorized green spaces differ in their scale and function; thus, it was important to clearly define each type of green space to explore the cognitive state of residents in relation to these green environments to measure their HL associated with sociality. This classification table for green environments was shown to all survey respondents prior to initiating the survey. Since cognition of the term “green environment” can differ according to the individual, conveying this classification of green environments was critical. The structure of the survey used to examine residents’ HL in this research was based on the happiness analysis framework, shown in
Figure 1.
3.1. The Two Selected Districts
To enable a clear comparison of green area ratios, two districts were purposely selected. The city of Seoul has the lowest green ratio and highest population density in Korea. Ilsan is a new city, developed in 1992 to strategically provide high green and open ratios for housing areas [
38]. Moreover, Ilsan has been consistently working on a green city project since 2003 to continuously increase its green ratio. Geographical information, including the total area, population, population density, and green park ratio of each district, was gathered from the districts’ council websites, and information on the demographic and socioeconomic status of each district was gathered from the Korean Statistical Information Service (KSIA) website, as shown in
Table 3.
The population density per square kilometer is almost three times higher in Gangseo-gu, Seoul, than in Ilsandong-gu, Gyeonggi-do. The green park ratio is almost one percent higher in Ilsandong-gu, Gyeonggi-do, than in Gangseo-gu, Seoul. The average monthly household incomes in the two districts are in a similar range, from KRW 2,500,000 to KRW 4,000,000. The employment rate is higher in Gangseo-gu, Seoul. However, the tertiary education and marriage status of the two districts are similar. The percentages of living in apartment and owning apartment are higher in Ilsandong-gu, Gyeonggi-do, by 6 and 9% respectively. The demographical statuses of the two districts are similar in their statistical information.
3.2. Survey Questionnaire Framework
The survey questionnaire structure was based on the happiness analysis framework, shown in
Figure 1. The questionnaire comprised four principal divisions:
General information about the survey respondent.
Cognition of green environments in current housing area.
Happiness evaluation from subjective dimensional perspective, in terms of well-being, life satisfaction and health state.
Sociality satisfaction based on green environments.
The survey questionnaire consisted of 30 questions based on the above four division bands. A 5-point Likert scale was used for this survey. The questionnaire focused on the residents’ experience of the green environment and cognition of the green environment, as shown in
Table 4. Consequently, the survey investigated how the green environment influenced the respondents’ HL when living in their current housing area. The survey also explored the co-relation between the green environment and social life and well-being.
3.3. Data Collection Method
The selection of the right target population for the survey questionnaire was critical in this research to be able to present a clear comparison of data between the two selected districts, Ilsandong-gu and Gangseo-gu. Prior to proceeding with the actual survey, a pilot study was conducted to verify the characteristics of the target population. The online survey was distributed to the target populations in specific housing complexes via their online community social network service. Housing complexes in Korea are cohesions of populations with similar education, socioeconomic and career selection characteristics [
9]. Before the online survey, we explained community representatives in the two complexes about the purpose of our survey in order for them to encourage their residents to participate in the survey. An open period of the online survey was permitted for 5 days and 100 invitations were sent out to residents in each complex through the representatives. The response rate was 56%. Of the 112 responses, any uncompleted ones were excluded, leaving a total of 90 (45 from each district) collected for analysis.
In addition to the quantitative data of the survey, follow-up interviews with residents from two districts were conducted as a complementary method. Ten residents participated in the interviews (five from each district) and the duration of each interview was between 20 and 25 min. The interviews proceeded based on the three divisions of experiential contexts shown in
Table 4: cognition, happiness, and sociality in relation to green environments. The qualitative data collected from the interviews were added to the statistical analysis results as needed.
4. Result
4.1. General Information
A total of 90 respondents completed the questionnaires and two questionnaires were excluded from the data analysis because of insufficient feedback. Of the respondents, 68.2 percent were female, who responded that they spent over eight hours each day in their housing area. In contrast, 31.8 percent were male, who generally spent less than five hours a day in their housing area. Moreover, 31.8 percent of the respondents were from the thirties age bracket, followed by the forties bracket with 29.5 percent. In terms of family structure, 48.8 percent of respondents had children aged under 12 years, and 41.9 percent of respondents did not have any children among their family members. Half of the respondents spent more than eight hours a day in their housing area. These data are shown in
Table 5.
4.2. Residents’ Cognition of Green Environments
Prior to initiating the survey, this research explored residents’ current cognitive status in relation to the green environment in their housing area and its effectiveness in generally influencing their life, as shown in
Table 6. Frequency analysis was applied without separation of the districts because it was intended to explore the general cognition of humans based on the green environment regardless of their current living environment. When we compared the differences between the two sites regarding residents’ cognition of green environments, the result showed no significant difference. Thus, the population of the two groups was intentionally grouped into one for this analysis. The aim of this analysis was to explore the cognitive thinking of the residents about the green environment, focusing on individuality rather than regionality. Cognitive status in relation to the green environment is critical, because individual cognition can vary. Among the respondents, 59.1 percent preferred to experience the green environment through a physical experience, while 34.1 percent preferred experiencing the green environment as a scenic amenity, 90.6 percent stated that green environments were important in influencing physical health, and 90.9 percent answered that green environments played an important role in their life. The results denote that regardless of their current residency, the residents were subconsciously aware of the importance of the green environment in their lives.
One of the key findings from the interview was that interviewees from both districts recognized the importance of the green environment for humans’ well-being, particularly in relation to their health. Even though the residents from Gangseo-gu District expressed a negative comment about the insufficient green environment in their district, they still recognized the significance of the green environment for a healthier life, as shown in the following comments:
Interviewee 1 (aged 35, female from Ilsandong-gu): The green environments are very significant sources of well-being for my family, especially as we have two of our family members are young kids. We utilize a lot of green spaces, such as a park, walking track, and grassland for family outdoor activities. I believe that these positively affect our family’s mental and physical health.
Interviewee 4 (aged 61, female from Ilsandong-gu): I spend most of my day in the housing area. I appreciate the mountain views from my housing unit. I never get bored of looking at the green views; rather, this provides my mind with comfort.
Interviewee 6 (aged 36, female from Gangseo-gu): I think green environments, like a green park or mountain views in housing areas within an accessible distance, are very important. This definitely provides us with comfort and refreshment from our stressful daily life. There are insufficient green spaces in my housing area so I drive to green spaces on the weekend with my family.
Interviewee 9 (aged 69, male from Gangseo-gu): I think most people prefer and wish to live near a lot of green spaces because we know that green provides your life with many benefits. But many people, including myself, are not able to fulfill everything in their residence. I have closed up my business so I am planning to move within one year to a new housing complex with sufficient greenery.
4.3. Happiness Level in Four Categories
The survey target population was divided into two groups according to their residence area to compare the residence cognition and experience of the green environment. To measure the HL of residents from the two different districts, happiness was categorized into the three variables subjective well-being, health state, and life satisfaction based on the happiness analysis framework shown in
Figure 1. Independent samples
t-tests were used for this analysis to explore the statistically significant difference between the two independent districts. Significant values resulted in all the criteria of subjective well-being based on the green environment as shown in
Table 7, except the criterion related to experiencing changes of the season through a green environment. The residents of Ilsandong-gu can access the green environment more easily than the residents of Gangseo-gu. In addition, the residents of Ilsandong-gu tend to experience more well-being through the green environment than those in Gangseo-gu.
The results of the analysis of happiness through residents’ health status were found to be partially significant, as shown in
Table 8. The frequency of physical exercise and physical activity based on the green environment was higher in Ilsandon-gu than in Gangseo-gu. In addition, the residents in Ilsandong-gu more frequently experienced the green environment to release their stress than the residents in Gangseo-gu.
The analysis of happiness through the life satisfaction criteria as presented in
Table 9 demonstrated significant results for all criteria. The results show that Ilsandong-gu residents were more satisfied with the diversity, accessibility, and quantity of their surrounding green environment than Gangseo-gu residents were with theirs. Consequently, the responses of the residents in Ilsandong-gu indicate that they were more satisfied with their living environment than the residents from Gangseo-gu.
The significant qualitative data from the interviews based on the happiness experiential context division in relation to green environments are demonstrated in the comments below. The residents from Ilsandong-gu are aware that the green environment surrounding them is sufficient and they provided positive feedback about it. All the residents from Gangseo-gu expressed their dissatisfaction with the given condition of their green environment.
Interviewee 3 (aged 37, female from Ilsandong-gu): I moved into this area a year ago and I am very satisfied with the surrounding environment. Actually, I think I am happier in this area than in my previous city. Because I spend a lot of time outdoors with my kid, and my kid just loves hanging out at the park and grassland playing. I feel the air is much fresher than other areas because there are sufficient trees and green plantings.
Interviewee 5 (aged 43, male from Ilsandong-gu): I experience a green environment mostly through the scenic view when I drive back to my housing area from work. One day I was very stressed from work and was driving back to my house; I was so fascinated by the plentiful greenery that I saw from the road with the low skyline.
Interviewee 8 (aged 67, female from Gangseo-gu): I am not really satisfied with the quality and condition of green environments in my housing area. There are no proper spaces where I can do my regular exercises so I go to the indoor fitness center every day. I wish there was some redevelopment of green spaces in my housing area because it would be hard for me to move out of this district since I have spent over 20 years here.
Interviewee 10 (aged 36, female from Gangseo-gu): I don’t get much chance to experience green spaces in my housing area since I work the whole day, but I am definitely aware that there are not many proper green spaces around. So I play tennis at the riverside park near my workplace. I often drive to a national park or suburban area on the weekend with my boyfriend to release my stress.
Lastly, life satisfaction associated with sociality was measured using the three variables social cohesion, social inclusion, and neighborship satisfaction based on the green environment. The aim of this exploration was to evaluate the residents’ social and community life and the critical impact of the green environment on these variables. Significant results were found in all categories of social cohesion, as shown in
Table 10. The residents in Ilsandong-gu showed a higher level of satisfaction in their community life than the residents in Gangseo-gu. The Ilsandong-gu residents were provided with more opportunities involving social events and programs based on the green environment.
Social inclusion in the two districts was compared, and the results are presented in
Table 11. The Ilsandong-gu residents had a higher sense of belonging in their housing area than the Gangseo-gu residents did. In addition, the residents in Ilsandong-gu expressed greater satisfaction about their involvement in the community within their housing area.
Finally, satisfaction with neighborship based on the green environment was analyzed. The results in all criteria were significant as presented in
Table 12. The residents in Ilsandong-gu experienced more frequent communication and interaction with neighbors than Gangseo-gu residents did. The green environment enabled more opportunities to meet neighbors on a casual basis through experiencing the green environment.
The significant qualitative data from interviews based on the sociality experiential context division in relation to green environments are shown in the following comments:
Interviewee 2 (aged 45, male from Ilsandong-gu): I often have a chance to casually say hello to my neighbors while I am out in the community park with my son for outdoor playtime. I think this is a good opportunity to communicate with neighbors to catch up and share community information.
Interviewee 3 (aged 37, female from Ilsandong-gu): I spend almost every afternoon at the park near my housing complex so my kid can play. All the mothers sit at the picnic table or on the bench at teatime. This is a great time for me to share a lot of information about bring up kids and district information. This also gives me a sense of belonging to my housing area.
Interviewee 6 (aged 36, female from Gangseo-gu): I never really get a chance to meet my neighbors and communicate with them. I only say hello to the neighbors when I see them in the elevators.
Interviewee 7 (aged 61, female from Gangseo-gu): I am not satisfied with community life in my housing area. There are hardly any events or services that I can participate in within a walkable distance. I always have to drive to a certain place to join a social community.
The results indicated significant differences between the two groups in most categories. The group from Ilsandong-gu generally reported a higher ratio of experiencing a green environment, and accordingly perceived greater comfort and satisfaction with the cognitive value in their housing area. The interviews provided complementary data supporting the result of statistically significant differences between the two districts. The residents in Ilsandong-gu responded with a higher degree of satisfaction toward their current housing life and believed that their life satisfaction is due to the higher ratio of green environment surrounding their housing area. In contrast, the residents in Gangseo-gu were satisfied with their housing area because of the convenience in terms of transportation and accessibility to diverse commercial facilities. However, the comfort, refreshment, and well-being experienced through their housing environment were not adequate. In addition, the residents of Gangseo-gu expressed their dissatisfaction with the accessibility to a green environment for outdoor activities and exercises.
Overall, the residents living in the district with a higher ratio of the green environment experienced more happiness through higher accessibility to and experience of the green environment. Further, their higher cognition of the green environment allowed residents to feel comfort and well-being through their living environment. These results were evidenced by the above t-test results and descriptive data obtained from interviews with the residents, which indicated significant differences.
4.4. Correlation between Happiness Level and Green Environments
The correlation between the variables of happiness and green environments was investigated through a correlation analysis without separation of the districts. The populations of the two groups were intentionally grouped into one for this analysis. The aim of this analysis was to examine the relationship between just the variables of happiness and green environment as demonstrated in the happiness analysis framework shown in
Figure 1.
As shown in the results in
Table 13, the Pearson coefficients demonstrated a strong correlation between the frequency of the resident feeling happiness, subjective well-being, life satisfaction, and green accessibility and quantity. In other words, higher accessibility and ratio of green environment within the housing area significantly affected the level of happiness of residents. Diversity of green environment was also shown to be a significant variable affecting the happiness of residents. Health state and green environment accessibility and quantity correlations also demonstrated a significant Pearson coefficient result. In terms of the relationship between social cohesion and green environment, the accessibility and quantity of green environment criteria showed a strong correlation. However, diversity of green environment did not affect the health state and social cohesion of residents.
Overall, this analysis proves that there is a very strong correlation between happiness and the green environment. In other words, people can experience happiness and satisfaction with life through the rich experience of green environments, and further improve their quality of life through an enhanced health state and social activities.
5. Discussion and Conclusions
Many researchers have indicated the importance of green spaces as resources for increasing residents’ health [
12,
24]. Green environments possess diverse values, such as amenity, well-being, recreational value, and a positive influence on sociality. Living in neighborhoods with higher levels of aesthetics and more water and green space has been associated with higher levels of happiness [
33]. However, there remains a lack of empirical research exploring green environments and their critical effect on residents’ HL in their housing area [
4]. Happiness is an important value associated with health, well-being, and life satisfaction [
33]. Urbanization negatively affects residents’ well-being and mental health [
39]. Therefore, the exploration of green environments in relation to residents’ HL is becoming increasingly critical in light of the current ongoing urbanization. The green environment can provide amenity values to people in various ways. Scenic amenity has a positive influence on residents’ mental health [
11]; further, higher accessibility to green environments reduces the risk of obesity and a sedentary lifestyle [
5]. This research empirically explored the current status of residents’ experience of the green environment in their housing areas through a comparison of two selected districts.
First, the arrangement of green environments in housing areas was considered. The green environment includes a broad spectrum of spaces, such as parks, green spaces, gardens, promenades, and nature. Researchers have defined the green environment as providing amenity value and having positive effects on residents’ well-being and health [
2,
11]. In this research, the categories of green environments were drawn from the literature review and arranged according to their functions and sizes. Through this organization, all survey respondents perceived an identical spectrum of the green environment.
Second, the current cognitive status of residents in the two districts regarding the green environment in their housing areas was explored. Through the green environment questionnaires, this research examined how residents perceived the green environment in their housing areas and the importance they placed on the green environment in their lives. The results indicated that more than 90 percent of residents perceived the green environment as critical for their life, influencing both their mental and physical health directly and thus their happiness. The majority of residents preferred to experience green environments physically, rather than having a scenic experience. Residents who lived in high and those in low ratios of green housing areas equally perceived the green environment as a critical factor in their life influencing their happiness. Therefore, the green environment cannot be a separable factor from the term “happiness.”
Third, this study compared the HL of residents in two different districts based on their current green environment condition. These two districts were purposely selected—one from inner Seoul and the other from outside of Seoul—to enable a clear comparison of the green area ratios. The results of the survey indicated differences in the life satisfaction, HL, and life quality of the residents in the two housing areas. The residents with a high ratio of and high accessibility to the green environment perceived their lives as happier and more positive. They perceived well-being in their lives through physical and social activities, based on greater opportunity to access the green environment.
Finally, this study explored the correlation between happiness and the green environment. The variables belonging to the happiness category, which included subjective well-being and life satisfaction, versus the variables based on the green environment, which included green environment accessibility, quantity, and diversity, were analyzed to investigate their correlation. A stronger correlation coefficient resulted in the district with a higher ratio of and higher accessibility to a green environment.
The importance of the green environment has already been theoretically addressed in many previous studies. Through social knowledge and potential consciousness, residents recognized the importance of the green environment within their living environment. This study sampled a specific target population and clearly demonstrated the difference in the results on the HL of the two districts based on the green environment. However, the evidence is limited because of the sample size. Given the many variables in our study, 45 responses from each complex seem insufficient. In contrast to our expectations, a smaller number of residents participated in the online survey. Thus, follow-up interviews with the residents from the two districts were conducted as a complementary method.
In conclusion, this study indicates the importance of the green environment for human life and their sustainable living. The importance of green environments in relation to the HL of humans has been measured through a subjective dimensional perspective for this study. This study focused on how residents feel, experience, and evaluated their lives based on the surrounding green environment. The clear comparative results were drawn from the statistical analysis of the two districts. Significant results were found in the subjective well-being, health state, and life satisfaction categories, which thus demonstrated a higher level of happiness among the residents from the higher ratio of green environment. The variables of sociality, including social cohesion, social inclusion, and neighborship, were taken into account in relation to HL based on the green environment. The results have shown that the residents’ social life satisfaction was significantly related to the provision of green environments in the housing area. The qualitative data collected from the interviews provided a crucial message about the importance of the green environment. Humans perceive the green environment optimistically as a great influential source for their quality of life. If the expected green environment is not provided within their housing area, the residents endeavor to visit other districts to fulfill their need for green environment experiences.
Further, this study supports the multidimensional value of green environments and demonstrates the positive effects on human life in terms of life satisfaction, subjective well-being, and social life through the happiness analysis framework.
The term “happiness” used in cross-disciplinary research refers to well-being, life satisfaction, and quality of life [
16]. Happiness is associated with diverse factors such as residents’ individual level of sociodemographic condition, socioeconomic status, and community-level condition [
4]. However, environmental surroundings, especially green environments, should be considered a significant factor when developing a housing area. The green environment is a critical sustainable value in the living environment, conducive to subjective well-being, life satisfaction, and quality of life for all residents, as shown in the results of this study. The residents living in the area with a higher green ratio had more opportunities to experience the green environment physically to release their stress and fatigue [
12,
13,
24,
28]. The green environment is a critical factor in housing areas that closely influences residents’ physical and mental health, thereby further determining their overall quality of life. Therefore, providing structural and strategic planning of the green environment is critical to satisfying residents and enhancing their quality of life and thus their sustainable happiness.


