Article

Innovation, Network Capabilities, and Sustainable Development of Regional Economies in China

1
Key Research Institute of Yellow River Civilization and Sustainable Development, Henan University, Kaifeng 475001, China
2
Collaborative Innovation Center on Yellow River Civilization Co-founded by Henan Province and the Ministry of Education, Henan University, Kaifeng 475001, China
3
College of Environment and Planning, Henan University, Kaifeng 475004, China
4
Department of Geography, University of Utah, Salt Lake City, UT 84112-9155, USA
*
Author to whom correspondence should be addressed.
Sustainability 2019, 11(17), 4770; https://doi.org/10.3390/su11174770
Submission received: 20 July 2019 / Revised: 19 August 2019 / Accepted: 28 August 2019 / Published: 1 September 2019

Abstract

:
This paper studies the relationships between network capabilities and innovation development in the context of two types of innovation networks: scientific knowledge networks (SKN) and technological knowledge networks (TKN). Focusing on two types of network capabilities, namely acquisition capability and control capability, the paper uses spatial regime models to compare the impacts of multiple factors on different spatial regimes. The main conclusions are the following. First, as regards SKN, the political-administrative hierarchy has shaped the spatial evolution of acquisition capacity, forming a pattern consisting of three dominant cities (Beijing, Shanghai, Nanjing), three subsidiary cities (Guangzhou, Hangzhou, Wuhan), and multiple lesser centers (Tianjin, Chengdu, Xi’an). Moreover, high control capability cities are mainly clustered in the coastal areas, specifically, one monocentric city (Beijing) and two polycentric metropolises (Shanghai, Wuhan). Second, for TKN, cities with high acquisition and control also are mainly found in coastal areas, with Shanghai and Beijing dominating network capabilities. The model’s analysis confirms the positive effect of network capabilities on innovation development, especially in scientific knowledge networks, and the driver for regional innovation development appears to have shifted from global pipeline (globalization) to local buzz (localized talents). This paper concludes with suggestions regarding network capabilities’ potential to reduce regional inequality and achieve sustainable development of regional economies.

1. Introduction

In its framework for global sustainability “Transforming our world: The 2030 agenda for sustainable development”, the United Nations proposed 17 sustainable development goals with 169 associated targets. Among them, innovation development, relying on knowledge, technology, information and other factors, may turn into a crucial driver of sustainable development of regional economies [1]. After 40 years of reform and opening up, China’s rapid economic development has been due in large part to several comparative advantages which are currently diminishing. Moreover, because of a “two-way squeeze” between the re-industrialization of developed countries and the industrialization of developing countries, an economic growth mode that relies on traditional production factors and investment is difficult to sustain. Therefore, regional innovation is not only a hot topic of concern for governments and in academic circles, but also a major challenge for China, which needs to adapt to the new configuration of international competition by enhancing its innovation capabilities.
With the deepening of the globalization process, economic activities undertaken by multinational corporations began to integrate talents, information, technology, and other production factors on a global scale [2]. Innovation achievements spread around the world, influencing global production networks and other world economic patterns [3,4]. With respect to global cooperation, a network society characterized by “spaces of flows” has emerged [5]. Moreover, network related theories, such as the global production network and the world city network, attempt to explain the new regional development patterns.
Characterized by knowledge spillover, a regional innovation network is formed by long-term formal or informal cooperation and interaction between innovative subjects such as enterprises, universities and research institutes, local governments, and intermediary service agencies [6,7]. The “spillover” of new knowledge and innovations from such networks is a vital force in regional development [8–10]. Regional innovation networks provide access to diverse forms of knowledge, technology, and information; and network capabilities are about using these assets effectively [11,12]. In other words, network capabilities comprise the ability to acquire external resources and manage multiple relationships competently [13]. Also, network capabilities may reduce regional inequality and play a significant role in creating competitive advantage. They have become a core means to promote economic development, especially for less developed areas [14,15]. However, current research on innovation networks focuses on the evolution of network structure [16,17,18], while the relationships between network capabilities and regional innovation development are yet to be thoroughly examined.
This paper seeks to address that gap by focusing on the relationships between network capabilities and regional innovation development. It attempts to answer the following questions. First, what are the characteristics of the spatial evolution of innovation network capabilities in urban China? Second, how do innovation network capabilities affect regional innovation development? Finally, in addition to network capabilities, what other factors affect regional innovation development?

2. Literature Review

2.1. Regional Innovation Networks and Innovation Development

By the end of the 1980s, theorists of regional innovation systems had taken interest in regional economic development. From this perspective, the regional innovation system is considered as an open, dynamic, self-organizing system; the theory emphasizes the innovation environment, such as the relationships between institutions, law, organization, and culture, and it highlights knowledge spillovers, mutual learning mechanisms, and cooperation [17,18,19]. Instead of focusing solely on enterprises as innovation subjects, studies began to include enterprises, universities, and governments, while innovation models began shifting from linear structure to chain or network [20]. Recently, based on regional innovation system theory, the concept of survival-of-the-fittest has been integrated into the analytical framework of innovation ecosystem theory, in order to explain the evolution process of regional innovation [21].
As an important part of the regional innovation system, regional innovation networks focus on the role of knowledge spillover and learning during innovation progress [22,23]. Knowledge networks frequently emerge from industry-university-research cooperation, information and technology flows between “parent” and affiliate firms, and cooperation within industrial technology alliances [12,13,14]. However, knowledge networks are invisible in the process of cooperation. Therefore, explicit results, such as co-authored papers and patents [16,17], are often used to quantify scientific or technological knowledge networks, and then to study regional innovation networks [8,9,10].
The research on innovation networks is summarized in terms of three main concentrations. First, analysis of network structure finds that the greater the city’s knowledge acquisition capability, the higher the possibility that knowledge is transformed into innovative output [8]. Furthermore, increase of knowledge control capability means that the degree of openness of the city is increasing [9]. The greater the density of the network, the closer the relationship between the nodes, which is conducive to the dissemination of tacit knowledge and the enhancement of regional innovation [10]. Next, openness of the regional innovation networks increases with expanding network size and improves the accessibility of external knowledge, which tends to overcome path dependence [8].
Second, the explanation of innovation network structure evolution is another major topic. Because of the geographic distance decay feature of knowledge spillover, geographic distance is the most common factor to explain the evolution of regional innovation networks. However, the development of information and communication technology has expanded the spatial scope of knowledge spillovers, and some scholars have even proclaimed the “death of distance” [24]. Nevertheless, existing research has confirmed that geographical distance still has influence on knowledge spillovers, especially as regards tacit knowledge. In addition, in the wake of the institutional and cultural turns of economic geography [25,26,27], more and more scholars explain the evolution of network structure in terms of organizational, social, and institutional proximities [28,29].
Third, there are two opposing views concerning the relationship between regional innovation networks and regional inequality. One argues knowledge as public goods and the spillover of scientific and technological (S&T) knowledge will spread evenly worldwide [30,31]. The other argues that regional inequality is gradually intensifying because of the concentration of innovation resources in a few countries and regions [32]. Even if a network was designed to narrow regional inequality, the results may be unexpected.

2.2. Research on the Network Capabilities

Network capabilities, also known as terms of relational capability [33], and alliance capabilities [34] are hot topics in enterprise innovation management research. Questionnaires and interviews are often used to study enterprise network capabilities, especially for entrepreneurial firms, university spin-offs, small firms, and business groups [12,14,15,35,36]. Most of the research defines network capabilities as a firm’s ability to build, handle, develop, exploit, and utilize inter-organizational relationships [15,37]. With respect to an individual firm, scholars have defined network capabilities as embedded within the entrepreneur who represents the focal point of the business [14], Social qualifications [38], personal characteristics considered as human capital [39], or relational skills [40] can be treated as part of the network capabilities.
As regards the classification of network capabilities, two approaches are commonly used. One is to divide network capabilities into four dimensions: coordination, partner knowledge, relational skills, and internal communication [12,37]. The other considers network capability as consisting of three components: outside-in, inside-out, and spanning capabilities, in which regard the first refers to skills related to markets, the second focuses on the firm’s internal resources, and the third indicates the ability to integrate internal and external resources [41].
In the case of factors affecting network capabilities, research shows that past network experience, information sharing, and participation in coordinated consumer events can increase network capability. However, a desire for control over decision-making, as well as lack of knowledge-sharing or joint problem-solving, may diminish network capability [14]. In addition, the ability to interact with new partners [42] and use new network ties also affect network capabilities. Moreover, government policies can build a bridge for business communication and may facilitate the growth of network capabilities [14].
Although some studies have found that network capabilities do not have any significant impact on the performance of enterprises [12], many studies have confirmed the positive role of network capabilities. For example, research on a buyer–supplier network in the Netherlands showed that inter-firm network capabilities significantly and substantially affect supplier performance as well as buyer performance [43]. Research on university spin-offs’ performance in Germany also highlight that network capabilities facilitate knowledge creation, and have a positive influence on university spin-offs’ performance (sales growth, sales per employee, profit attainment) [14].

2.3. Factors Affecting Regional Innovation

(1) Innovation resources. Regional innovation resources are commonly characterized by R&D personnel and funds, and a large number of studies have confirmed the positive relationships between aggregation of talented employees and regional development [44]. R&D expenditures of firms are significantly related to their level of innovation [45] and the government’s investment in science and technology finance has leverage on firms’ R&D investment. However, excessive agglomeration of innovation resources may result in redundancy, diseconomies, and diminishing returns [46].
(2) Innovation subjects. The triple helix model has explored how the firm–university–government combination has contributed to innovation development [47]. However, the heterogeneity of enterprises, in terms of size, ownership, and culture, affects regional innovation vitality [48]. The role of universities in innovation can be attributed to two aspects. First, they are an important knowledge pool for enterprise innovation and are involved in the innovation system through R&D cooperation, consultation, and property rights transfer with enterprises [49]. In addition, universities provide talent support for enterprises’ innovation. In order to facilitate the recruitment of talented personnel, the proximity of universities has become a crucial consideration in the location of high-tech enterprises [50].
(3) Innovation climate. Innovation climate includes three aspects: institution, marketization, and globalization. First, institutions provide the tools for management of innovation output. Institutions may be informal or formal. The former include cultural traditions, beliefs, customs [2]; the latter relies on the government’s laws, regulations, and policies. Policies related to personnel, taxation, and intellectual property protection, are common options [51] that may strengthen the interaction among innovation subjects, revitalize innovation resources, form the entrepreneurial environment, and promote innovation output [52]. Second, successful marketization leads to professional and diversified businesses, as well as legal and financial guarantees for regional innovation, which accelerate the dissemination and transformation of knowledge, optimize the allocation of innovative resources, and improve the efficiency of resource utilization. The competitive market environment stimulates the initiative of enterprises to innovate actively and undertake innovation risks. With respect to the literature on globalization [53,54], there is an ongoing debate concerning the role of foreign direct investment (FDI) in promoting the level of technological innovation in regions. One view is that foreign enterprises improve the level of innovation of local enterprises through, learning, competition, and demonstration effects. The other view is that the super-national treatment of foreign enterprises, in terms of personnel, taxation, and finance, have a crushing effect on local enterprises in China [55]. Research on China shows that technical, structural, spatial, and institutional mismatches restrict knowledge spillover between foreign and local companies [56,57,58].

2.4. Research Gaps

Having reviewed the literature, we found that the following problems are worthy of further investigation:
First, most of the literature on regional innovation is based on economic-geographical research conducted in the West. However, China’s innovation development has many characteristics that are different from those of the Western countries; for example, the “nanny-type” of government intervention, as well as the interaction among state-owned, private, and foreign enterprises. Therefore, the research on regional innovation in China may not only enrich existing innovation theory, but also provide insights for other developing countries.
Second, starting from “Outline of the Tenth Five-Year Plan for National Economic and Social Development of China,” regional innovation networks have become a major strategy to narrow regional inequality and build a cooperative, win-win regional development model. However, research on network capabilities has focused on entrepreneurial firms, university spin-offs, small firms, group affiliates in Sweden [13], Ireland [14], and Belgium [15], while research on China’s innovation network focuses on the evolution of network structure and its causes [9,17]. The role of network capabilities in economic development in China remains unclear. Hence, it is necessary to incorporate network capabilities into the analytical framework of regional innovation development in China.
Third, cities have become the core spatial foundation of global competitiveness as has been explained by global cities theory [59]. Most of innovation resources and subjects are clustered in cities and the innovation climate is also better in cities than that in the countryside in China. Yet, the mechanism of innovation development in Chinese cities is still unclear. Therefore, we integrate attribute and relational data in this study of the relationships between network capabilities and innovation development at urban level.

3. Research Setting

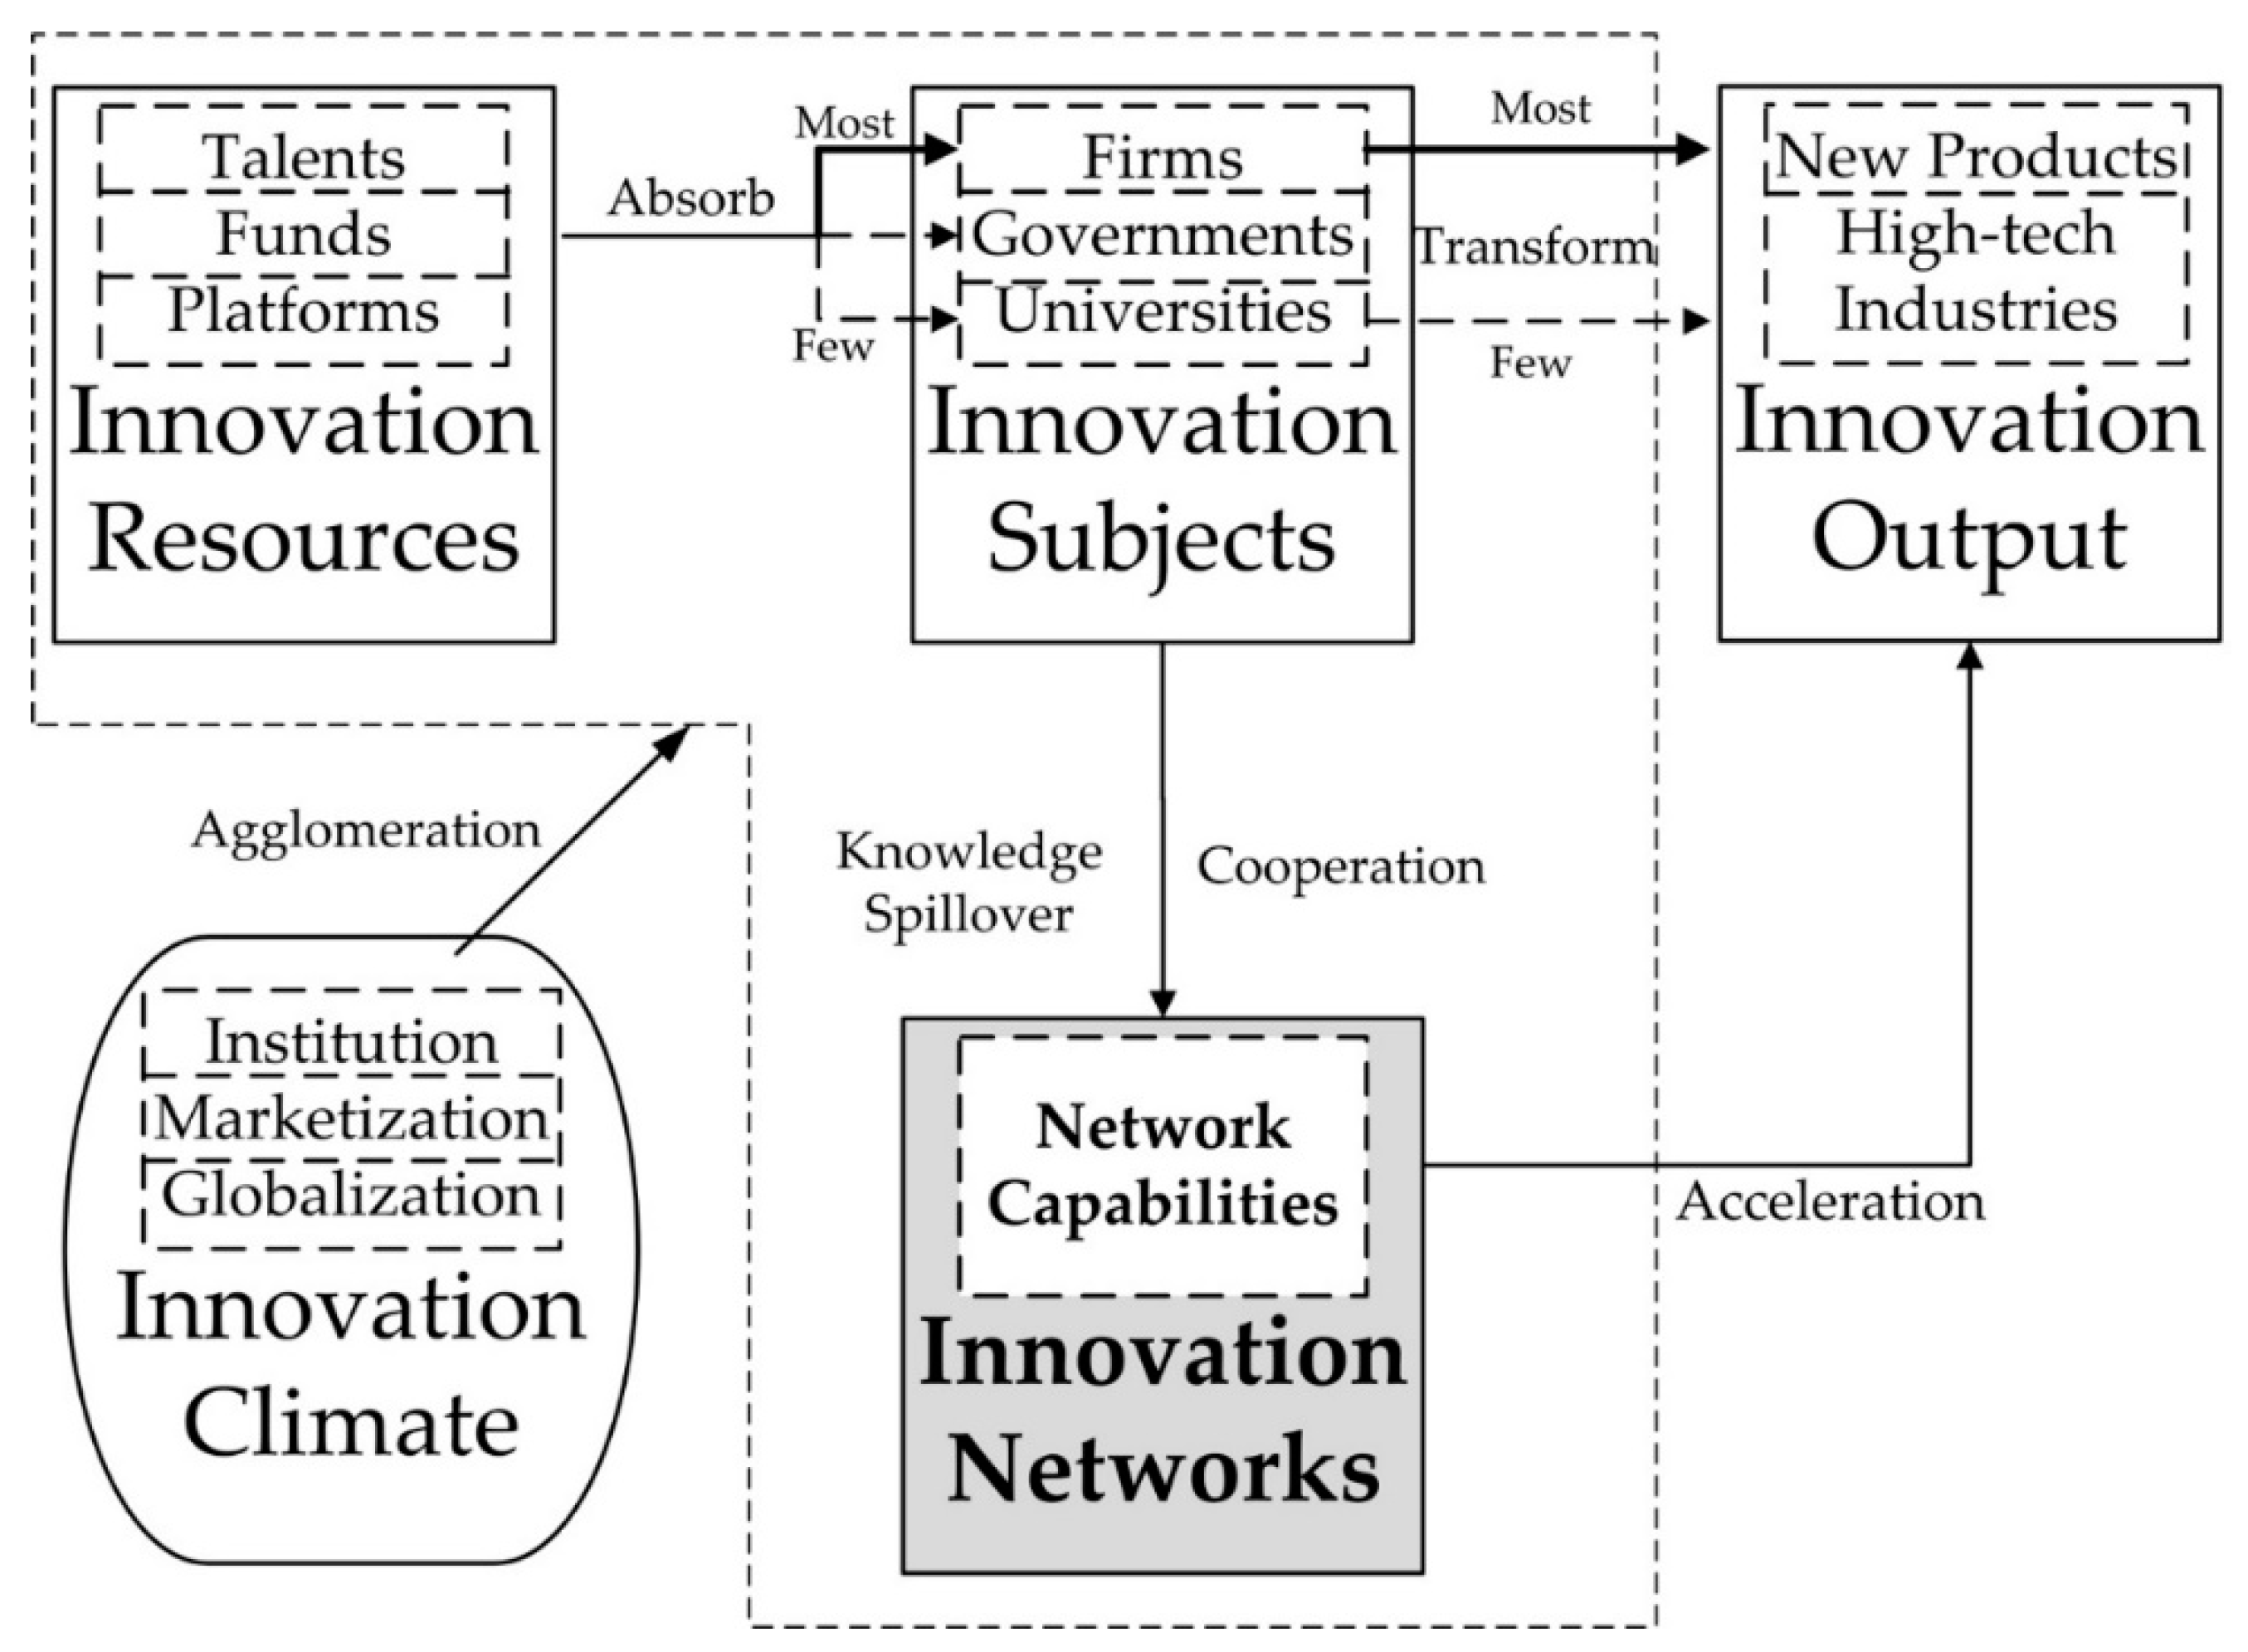
3.1. Regional Innovation Analysis Framework for the Analysis of Innovation Networks

The spatial agglomeration of regional innovation resources is a prerequisite for regional innovation and development. The local and global innovation context may provide support for regional innovation. As innovation resources agglomerate, cooperation among innovation subjects forms regional innovation networks. Among the effects attributed to regional innovation networks are agglomeration economies, avoidance of path dependence and locking, and multiplier effects. Also, they have been seen as a potential way of narrowing regional inequality, especially for poor regions. With these considerations in mind, we have created an analytic framework to assess the potential contribution of innovation networks to economic development (Figure 1).

3.2. Data

3.2.1. Regional Innovation Network Construction

Author or applicant spatial information extracted from papers and patents are commonly used data to study innovation networks at various scales (cities, regions, nations, university-firm-government networks) [60,61,62]. Thus, taking biotechnology as an example, this paper builds a scientific knowledge network (SKN) and a technological knowledge network (TKN) as innovation networks, and studies the relationships between network capabilities and regional innovation development. The data of SKN comes from the co-authored papers derived from the database of the web of knowledge (Exact search string is “CU = China AND (TS = ((Cell OR Enzyme OR Applied) SAME Bio*) OR TS = Bionic)”) and the Chinese science and technology journal database (Selected categories: Cell engineering, bionic, applied bioengineering, and enzyme engineering) [63]. To get TKN data, we selected the co-applied patents from the web of China intellectual property right net. Based on the international patent classification, the Organization for Economic Cooperation and Development (OECD) considers the biotechnology industry as consisting of 30 subcategories (A01H1/00, A01H4/00, A61K38/00, A61K39/00, A61K48/00, C02F3/34, C07G(11/00, 13/00, 15/00), C07K(4/00, 14/00, 16/00, 17/00, 19/00), C12M, C12N, C12P, C12Q, C12S, G01N27/327 and G01N33/(53*, 54*, 55*, 57*, 68, 74, 76, 78, 88, 92)) [64]. We filtered the TKN database based on this classification. If the authors or applicants’ affiliations are in different cities, which would show knowledge spillover between these cities, we use such data to delineate scientific or technological knowledge networks. Considering that cooperation was rarely seen in papers and patents before 2000, the study period chosen is from the year 2000 to 2012. Only cities on the mainland of China are covered.
This paper takes the biotechnology industry as the object for the following reasons. First, the biotechnology output value is significantly correlated with GDP at a 99% confidence level, and the Pearson correlation coefficient was 0.6 and 0.85 at the city and province level, respectively in 2012. The results illustrate that the biotechnology innovation can be used to represent regional innovation. Second, more and more new technologies need to be completed in a shorter period given the intense competition, which makes knowledge spillover more likely to occur during the research and development process, and the network structure of biotechnology industry is generally more comprehensive than other industries [65]. Third, in both the five-year plan and the high-tech industry development plan at the national level, the biotechnology industry is regarded as an important sector for regional industrial transformation and the cultivation of new growth points. Also, the biotechnology industry may become a starting point for China to enhance its position in global industrial competition. Thus, it is reasonable to take the biotechnology industry as the research object.

3.2.2. Network Capabilities Data

According to the regional innovation network theory, there are two types of the network capacity: the capacity to acquire external resources (acquisition capability) and the capacity to control network resources (control capability) [66,67]. The acquisition capability refers to knowledge cooperation, and control capability refers to the power to control knowledge spillover among the nodes. A city with high acquisition capability means that it has close ties with other cities, which may lead to spillover of specialized knowledge. Acquisition capability is represented by degree centrality. Degrees indicate the connection of a node to other nodes in the network. Degree centrality is the most important indicator of a node’s accessibility in a network. The larger the value, the greater the opportunities for obtaining external knowledge [68] (Equations (1) and (2)).
D i   =   j n x ij       i     j
D i   = D i n     1
Xij represents the cooperation frequency of the nodes i and j, n is the number of nodes in the network, Di denotes the absolute degree centrality of the node i, and Di′ is the relative centrality of the node i. Di′ is used in this paper, because it can be compared at different networks.
The cities with high control capability usually communicate with many different cities in the network, which is beneficial for obtaining diverse knowledge. Betweenness centrality is used to represent control capability. If a node is on the shortest path between a pair of other points, the node has a high betweenness centrality. The value of a node is 0 when the node cannot control any actor and it is at the edge of the network; if a node is fully controlling the other nodes, and is also at the core of the network with absolute control over network resources, the betweenness centrality of the node is 1 [68] (Equations (3) and (4)).
C i   =   j n k n S jik S jk       i     j     k
C i   =   2 C i ( n     1 ) ( n     2 )
Sjk is the number of shortest paths between nodes j and k, where the shortest path passes through node i as Sjik. Ci indicates the absolute betweenness centrality of node i, and Ci′ expresses relative betweenness centrality of node i. Ci′ is used in this paper for comparison. In addition, a path in a graph is a finite or infinite sequence of lines which joins a sequence of nodes.
There are four sets of data: acquisition capability of SKN, control capability of SKN, acquisition capability of TKN, control capability of TKN. Same as an undirected network in this paper, Figure 2 provides a good example of a knowledge network. A, B, C, and D represent four cities, and the numbers next to the line indicate the amount of knowledge spillover between two cities. The greater the number, the more cooperation frequency. Taking A and B for example, the absolute degree centrality of A and B are 3 and 4, the relative degree centrality are 1 and 1.33, which means the acquisition capability of B is higher than A. Similarly, the absolute betweenness centrality of A and B are 2 and 0, the relative betweenness centrality are 0.67 and 0, which makes the control capability of A higher than B. Acquisition and control capabilities data are calculated by using the Ucinet software package.

3.3. Methodology

3.3.1. Spatial Regime Model

The spatial regime model adds a spatial weight matrix into the linear regression and integrates different regimes into the one model, which enables to compare the effects of same independent variables on different regimes and helps explain spatial heterogeneity. The model is often used to analyze the geographical dimension of land expansion, homicides, and economic inequality [69,70,71]. According to the level of economic development and geographical location, China can be divided into three regions: eastern, central, and western. There are substantial disparities among them; for instance, in 2017 the proportion of patent applications in the three regions was 72.35%, 18.74%, and 8.91% respectively. A similar pattern characterized the clustering of R&D personnel (70.81%, 20.50%, and 8.69%). Thus, the significance of variables varies by region and changes over time. After dividing the country into three regions as weight variables, the paper uses spatial regime models to analyze the impact of acquisition and control capabilities as well as other factors of regional innovation development (Equation (5)).
[ Y east Y central Y west ]   =   [ X east 0 0 0 X central 0 0 0 X west ]   [ φ east φ central φ west ]   +   [ ε east ε central ε west ]
In Equation (5), Yeast, Ycentral, and Ywest are Neast*1, Ncentral*1, and Nwest*1 column vectors with observations for the innovation output of each regime. Xeast, Xcentral, and Xwest are the Neast*K, Ncentral*K, and Nwest*K matrices of observations of other explanatory variables for the three regimes. φeast, φcentral, and φwest are the unknown parameters to be estimated. εeast, εcentral, and εwest are the Neast*1, Ncentral*1, and Nwest*1 vectors of error terms. Neast, Ncentral, and Nwest represent the number of cities participating in the three regions, and K refers to the number of variables [72,73,74,75].

3.3.2. Variables

The details of the variables employed in this study are shown in Table 1. The numbers of patents and papers are the commonly used indicators to quantify regional innovation [76]. However, these variables represent kinds of knowledge output and cannot represent the contributions of innovation to economic development. New indicators, such as the output value of new products or high-tech industries, are more convincing [77]; hence, the paper takes the output value of the biotechnology industry to indicate innovation output.
To account for comparability and continuity of data at the national level, this paper introduces a binary variable (0–1) to express institutional climate, which is determined by whether a city is a national advanced science and technology center or not (yes-1, no-0). The designation, “national advanced city for science and technology progress” is the authoritative evaluation of cities’ progress in science and technology according to the Ministry of Science and Technology of China, and it is used to represent the level of urban innovation. Data on institutional climate are obtained from government official websites, and other indicators are derived from the database of all state-owned and above-scale non-state-owned industrial enterprises (The main business income of enterprises is more than 5 million yuan per year, and the standard is changed to more than 20 million yuan since 2011), namely the Chinese industrial enterprises database. This database includes the annual output value, number of employees, fixed assets investment, capital investment, industry code, and address of each firm.

4. Spatial Evolution of Network Capabilities

Knowledge spillover is widespread in scientific research, while it has just begun in technological research. The total number of papers and patents was 92,254 and 77,023 from 2000 to 2012, respectively. Furthermore, the size (the number of cities in the networks) increased rapidly from 60 to 224 in SKN, while it only rose from 15 to 88 in TKN. In addition, cooperation frequency has dramatically increased from 250 to 5885 in SKN, which is 3.25 times and 14.82 times of TKN respectively (Table 2). Published papers have become the core indicators for the evaluation of professional titles in universities in recent years, and cooperation has become a priority in order to increase the volume of publications so as to meet assessment requirements. Whereas ideas in the scientific research process can be coded and easily disseminated, face-to-face communication is needed in technological research [17], which means scientific knowledge spillover is more convenient than that of technological knowledge.

4.1. Spatial Evolution of Network Capabilities in SKN

The Gini coefficient of degree centrality increased from 0.49 in 2000 to 0.64 in 2012, which indicates gradually increasing inequality of acquisition capability among cities. With respect to control capacity, it shows that the regional inequality is gradually increasing. The Gini coefficient of control capability slightly increased from 0.79 in 2000 to 0.89 in 2012. The high value implies that the core cities characterized by the largest flows dominate the network (Figure 3).
For the spatial distribution of acquisition capability, Beijing ranked first both at the start and the end of the period, with the value rising from 38.46 in 2000 to 50 in 2012. Following Beijing, the degree centralities of Shanghai and Nanjing rose from 19.23 and 17.31 in 2000, respectively, to 44.09 and 40 in 2012. Wuhan, Guangzhou, and Hangzhou followed in the fourth to sixth positions in 2012, and their knowledge acquisition capabilities increased rapidly. Obviously, acquisition capability of each city is significantly related to its administrative level (In China, the administrative level of cities can be divided into four categories from high to low: municipalities, provincial capitals, sub-provincial cities, prefecture-level cities), which is manifested in the spatial characteristics of three subjects (Beijing, Shanghai, Nanjing), three branches (Guangzhou, Hangzhou, Wuhan) and multiple centers (Tianjin, Chengdu, Xi’an, etc.) in SKN (Figure 4).
As to the spatial pattern of control capability, Beijing also ranked first, but with a substantial downtrend (42.62→16.46), Shanghai ranked second in 2012 (12.60), moving up from sixth place in 2000 (10.23), while Wuhan slipped to third place in 2012 (9.47) from second place in 2000 (20.54). In brief, most of the cities with high control capability are found in the coastal areas with the spatial distribution of one nuclear (Beijing) and multi-poles (Shanghai, Nanjing) in the eastern region (Figure 5).

4.2. Spatial Evolution of Network Capabilities in TKN

The Gini coefficient of acquisition capability increased from 0.3 in 2000 to 0.49 in 2012, indicating that the inequality in technical knowledge acquisition is smaller than that in scientific knowledge acquisition. However, similar to SKN, the Gini coefficient of control capability rose from 0.78 in 2000 to 0.85 in 2012, which shows that inequality of control capability is increasing (Figure 6). In addition, although the control capability of most cities does not exceed 10, in all cases it exceeds 0, which indicates that no city has absolute dominance with respect to knowledge spillovers in the network.
With regard to the spatial evolution of acquisition capability, Beijing ranked first, although its degree centrality dropped from 40 in 2000 to 38.96 in 2012. Shanghai took second place, and its acquisition capability rose from 10 in 2000 to 25.97 in 2012. However, it is worth noting that the acquisition capability of Nanjing dramatically decreased from 40 in 2000 to 7.79 in 2012, while Suzhou’s capability rose sharply from 0 to 11.69. In addition, among all 77 cities in 2012, only four had a degree centrality greater than 10. In general, the cities with high knowledge acquisition capacity are distributed in the eastern coastal region and form a spatial pattern of one dominant center (Beijing) and one secondary (Shanghai) in TKN (Figure 7).
With respect to the spatial evolution of control capability, in 2000 Nanjing ranked first (46.67), followed by Beijing (40), and Chengdu (15.56). However, the control capability of other cities was 0, which means that few cities had any control over the spillover of technical knowledge in the network. By 2012, Beijing and Shanghai dominated the spillover of technical knowledge in the network. Although inequality in control capabilities among cities is still substantial, more and more cities participate in the network and provide possibilities for technical cooperation. In sum, high-control cities in TKN still are found mainly in coastal areas, and Shanghai and Beijing are dominant (Figure 8).

5. Network Capacities and Their Effects on Regional Innovation Development

There were no biotechnology enterprises in the database before 2002 and the number of cities in TKN was only 19, which did not meet the sample-size requirement of the regression model. Therefore, the regression model calculated the 2002 and 2012 data for SKN and just 2012 data for TKN. The variance inflation factor (VIF) values of the independent variables were less than 7.5, which means there is no multicollinearity among variables. Also, the R2 values of the model regression were between 0.79 and 0.95 and satisfy regression requirements (Table 3, Table 4 and Table 5). Furthermore, we find the following effects from the model:
First, the performance of network capabilities depends on the availability of innovation resources and climate. The effects of both network capabilities on output are more significant in the eastern region rather than in the central and western regions. Highly skilled, innovative personnel and investors are attracted to the eastern region because of the availability of such amenities as education, medical care, and transportation [58]. Both the state and local governments have implemented innovative reforms to improve the regional innovation ecosystem. When the internal resources of a city cannot satisfy local demand, the city can obtain external resources through participation in regional innovation networks, which provide new impetus for local innovation.
Second, scientific knowledge has begun to play the leading role in regional innovation. Although both acquisition and control capabilities have significant effects on output in the eastern region, the estimated coefficient was significantly positive in 2002 but negative in 2012. According to the analysis above, cities with higher network capacity are concentrated in in the eastern region. We added a dummy variable to further analyze the eastern region. If the network capabilities of a city are greater than the average value in the network, the value is 1, and the value is 0 if the network capabilities are below average. The regression for the eastern region shows that the acquisition and control capabilities were positive in SKN but not in TKN.
In sum, China’s innovation and development was in its initial stage in the early 21st century. Network capabilities accelerated transformation of scientific and technological achievements based on the accumulation of talents and funds for years, that explain network capabilities and innovation output were positively correlated in 2002. By 2012, enterprises and universities had devoted much effort to knowledge cooperation at a time when information and communication technology was developing rapidly, which accelerated the speed and scope of scientific knowledge spillovers. In this way, scientific knowledge rose to the forefront of regional development in cities with rich innovation resources.
Localized resources have replaced globalization as the core driver of regional development. The role of human capital SKN has grown considerably in all three of China’s macro-regions. The leverage of government investment and policies is more significant in the western region where there is a low level of marketization. In developed eastern region, marketization is replacing globalization and policies and becoming a core innovation climate factor affecting regional innovation and development. In sum, the driver for regional innovation development is changing from the globalization factor to localized talents.

6. Conclusions and Implications

Taking the Chinese biotechnology industry from 2000 to 2012 as the research target, this paper identifies scientific knowledge networks (SKN) and technological knowledge networks (TKN). Two network capabilities are stressed: acquisition and control capabilities. The research outcomes suggest the following conclusions.
First, although the number of papers and patents increased significantly, the size of TKN is far smaller than that of SKN. According to the value of the Gini coefficient, although both the acquisition and control capabilities are significantly expanding, the inequality of control capability is higher than the acquisition capability in SKN. With respect to TKN, the inequality of technological control capability is highly similar to SKN, while the acquisition capability is lower than SKN. Moreover, the greater inequality of control capability indicates there are a few cities controlling the knowledge spillover in networks and there is a core-peripheral pattern.
Second, with regard to the spatial distribution of acquisition capabilities in SKN, the leading cities are in the eastern region (Beijing, Shanghai, Nanjing), and there are three secondary centers (Guangzhou, Hangzhou, Wuhan), and multiple lesser centers (Tianjin, Chengdu, Xi’an). As to control capabilities, most of the cities with high control capabilities are located in the eastern region, such as Beijing, Shanghai, and Nanjing, which is consistent with the spatial pattern of the two types of network capabilities in TKN.
Third, the positive role of network capabilities on regional development has been confirmed, especially in the developed eastern region. The capability to control or acquire scientific knowledge spillover plays a positive role in regional innovation output. In the developed eastern region, localization factors, such as the cluster of talented personnel and dynamic market, are more and more important than foreign capital and state-owned capital, and have become dominant in regional innovation development.
In short, this paper integrates the knowledge network into the analytical framework for regional development, and the results confirm the positive role of network capabilities and regional innovation development. The knowledge networks have become a potential way to solve diseconomies of agglomeration, which is overlooked by traditional regional development theory. In addition, this paper links relational data with attribute data, a procedure which may be productive in future studies in innovation geography.
As the above results confirm, the inequality of network capacities, as affected by the uneven distribution of highly-skilled labor, funds, amenities, is continuing; and this phenomenon may become more prominent in the future. As a result, inequality in regional innovation development will also increase. According to the theory of evolutionary economics, innovation resources, such as skills, technology, and funds will continue to concentrate in a few core areas [22,25,26]. Because of the lack of innovation resources, the peripheral areas may be locked in the low-end path, and the economic inequality between core-peripheral areas will continue to grow. In order to break from this pattern, participating in innovation networks and improving network capabilities are seen as means of narrowing regional innovation inequality. They could strengthen their network capabilities with core cities to “borrow resource” and share the scientific and technological information among the networks [78]. The research results support the following suggestions.
Increasing the pool of scientific and technological knowledge is the key to promote regional innovation, and a way for relatively underdeveloped regions to catch up to well-developed ones. In this regard, the following actions may be useful. In the first place, because of the top-priority role of highly-skilled personnel, underdeveloped regions should vigorously develop education, including professional and technical schools, and specialized research institutions. It is also necessary to recruit high-level innovative personnel from other areas.
Second, the peripheral areas should be proactive to attract the transfer of the production or research and development sectors of the high-tech industry from core areas by co-construction of the innovative parks; more preferential policies should be carried out to draw branch offices of high-level innovative companies in peripheral areas; the peripheral areas may encourage major universities and research institutions to establish R&D institutions. During this process, multidimensional proximities, such as organizational, geographical, social, and institutional proximity can be one useful way to obtain these goals [28,29].
Last but not the least, state-owned capital and innovation policies have leverage on the development of the peripheral areas. Hence, the central government should increase support for science and technology finance in underdeveloped areas, especially to help attract leading innovators, which could positively influence local enterprises.
Moreover, underdeveloped regions need to break through barriers to technology spillover by nurturing a sound innovation environment, setting up platforms for cooperation and research exchange, and encouraging knowledge-intensive service industries. Furthermore, consistent with the findings of Wei [56,57], network linkages with foreign ventures are only marginally helpful, and the role of foreign ventures is decreasing. Therefore, the situation calls for a new approach, one that would enhance local network capabilities by stressing private investment and an unrestricted labor market for talented innovators.
The findings of this paper suggest the need for future research. First, the research period was from 2000 to 2012, the latest years for which data was available on the Chinese industrial enterprises database. If the data were updated, it would more accurately reflect current interactions between network capabilities and innovation output. Second, there remains a need to compare the innovation networks of different industries between China and other countries in order to provide better guidance for regional industrial development.

Author Contributions

Framework, writing and editing—D.L. and Y.D.W.; methodology and data—D.L. and C.M.; model and review—Y.D.W., Y.W., and W.X.

Funding

This study was funded by the National Natural Science Foundation of China (No. 41701136, No. 41671133, No. 41471103, No. 41501138), the 60th batch of China Postdoctoral Science Foundation (2016M602233), and the US National Science Foundation (1759746).

Acknowledgments

The authors would also like to thank Zhiqiang Hu and Honglian Xu for their research assistance.

Conflicts of Interest

The authors declare no conflict of interest.

References

  1. Jensen, M.B.; Johnson, B.; Lorenz, E.; Lundvall, B.Å.; Lundvall, B.A. Forms of knowledge and modes of innovation. In The Learning Economy and the Economics of Hope; Lundvall, B.Å., Ed.; Anthem Press: London, UK, 2016; pp. 155–182. [Google Scholar]
  2. OECD. OECD Science, Technology and Innovation Outlook 2018: Adapting to Technological and Societal Disruption; OECD Publishing: Paris, France, 2018. [Google Scholar]
  3. Coe, N.M.; Dicken, P.; Hess, M. Global production networks: Realizing the potential. J. Econ. Geogr. 2008, 8, 271–295. [Google Scholar] [CrossRef]
  4. Hotz-Hart, B. Innovation networks, regions and globalization. In The Oxford Handbook of Economic Geography; Clark, G.L., Gertler, M.S., Eds.; Oxford University Press: Oxford, UK, 2000; pp. 432–450. [Google Scholar]
  5. Castells, M.; Cardoso, G. The Network Society: From Knowledge to Policy; Johns Hopkins Center for Transatlantic Relations: Washington, DC, USA, 2005. [Google Scholar]
  6. Kotabe, M.; Jiang, C.X.; Murray, J.Y. Examining the complementary effect of political networking capability with absorptive capacity on the innovative performance of emerging-market firms. J. Manag. 2017, 43, 1131–1156. [Google Scholar] [CrossRef]
  7. Simmie, J.; Sennett, J.; Wood, P.; Hart, D. Innovation in Europe: A tale of networks, knowledge and trade in five cities. Reg. Stud. 2002, 36, 47–64. [Google Scholar] [CrossRef]
  8. Stuck, J.; Broekel, T.; Revilla, D.J. Network structures in regional innovation systems. Eur. Plan. Stud. 2016, 24, 423–442. [Google Scholar] [CrossRef]
  9. Chen, Z.; Guan, J. The core-peripheral structure of international knowledge flows: Evidence from patent citation data. R D Manag. 2016, 46, 62–79. [Google Scholar] [CrossRef]
  10. Boschma, R.; Balland, P.A.; Kogler, D. The geography of inter-firm knowledge spillovers in biotech. The Economics of Knowledge. Innov. Syst. Technol. Policy 2016, 6, 147–169. [Google Scholar]
  11. Vesalainen, J.; Hakala, H. Strategic capability architecture: The role of network capability. Ind. Mark. Manag. 2014, 43, 938–950. [Google Scholar] [CrossRef]
  12. Parida, V.; Örtqvist, D. Interactive effects of network capability, ICT capability, and financial slack on technology-based small firm innovation performance. J. Small Bus. Manag. 2015, 53, 278–298. [Google Scholar] [CrossRef]
  13. Parida, V.; Patel, P.C.; Wincent, J.; Kohtamäki, M. Network partner diversity, network capability, and sales growth in small firms. J. Bus. Res. 2016, 69, 2113–2117. [Google Scholar] [CrossRef]
  14. McGrath, H.; O’Toole, T. Enablers and inhibitors of the development of network capability in entrepreneurial firms: A study of the Irish micro-brewing network. Ind. Mark. Manag. 2013, 42, 1141–1153. [Google Scholar] [CrossRef]
  15. McGrath, H.; O’Toole, T. A cross-cultural comparison of the network capability development of entrepreneurial firms. Ind. Mark. Manag. 2014, 43, 897–910. [Google Scholar] [CrossRef]
  16. Yoon, J.; Park, H.W. The unbalanced dynamics in Sino-South Korea scientific and technological collaboration: A triple helix perspective with insights from paper and patent network analysis. Asian J. Technol. Innov. 2017, 25, 184–198. [Google Scholar] [CrossRef]
  17. Li, D.; Wei, Y.D.; Wang, T. Spatial and temporal evolution of urban innovation network in China. Habitat Int. 2015, 49, 484–496. [Google Scholar] [CrossRef]
  18. Broekel, T.; Boschma, R.A. Knowledge networks in the Dutch aviation industry: The proximity paradox. J. Econ. Geogr. 2011, 12, 409–433. [Google Scholar] [CrossRef]
  19. Asheim, B.T.; Grillitsch, M.; Trippl, M. Regional innovation systems: Past–present–future. In Handbook on the Geographies of Innovation; Shearmur, R., Carrincazeaux, C., Doloreux, D., Eds.; Edward Elgar Publishing: Northampton, MA, USA, 2016; pp. 45–62. [Google Scholar]
  20. Maninggar, N.; Hudalah, D.; Sutriadi, R.; Firman, T. Low-tech industry, regional innovation system and inter-actor collaboration in Indonesia: The case of the Pekalongan batik industry. Asia Pac. Viewp. 2018, 59, 249–264. [Google Scholar] [CrossRef]
  21. de Vasconcelos, L.A.; Facin, A.L.F.; Salerno, M.S.; Ikenami, R.K. Unpacking the innovation ecosystem construct: Evolution, gaps and trends. Technol. Forecast. Soc. Chang. 2018, 136, 30–48. [Google Scholar]
  22. Boschma, R. Towards an evolutionary perspective on regional resilience. Reg. Stud. 2015, 49, 733–751. [Google Scholar] [CrossRef]
  23. Crespo, J.; Boschma, R.; Balland, P.A. Resilience, networks and competitiveness: A conceptual framework. In Handbook of Regions and Competitiveness; Huggins, R., Thompson, P., Eds.; Edward Elgar Publishing: Northampton, MA, USA, 2017; pp. 271–286. [Google Scholar]
  24. Cairncross, F. The death of distance: A survey of telecommunications. Economist 1995, 336, 5–28. [Google Scholar]
  25. Martin, R.; Sunley, P. Towards a developmental turn in evolutionary economic geography? Reg. Stud. 2015, 49, 712–732. [Google Scholar] [CrossRef]
  26. Pike, A.; MacKinnon, D.; Cumbers, A.; Dawley, S.; McMaster, R. Doing evolution in economic geography. Econ. Geogr. 2016, 92, 123–144. [Google Scholar] [CrossRef]
  27. Scott, A.J. A perspective of economic geography. In Economy; Martin, R., Ed.; Routledge: London, UK, 2017; pp. 3–23. [Google Scholar]
  28. Angelini, P.P. The role of proximity in inter-organizational network evolution: An application of actor-oriented modeling for longitudinal network analysis. In Relational Methodologies and Epistemology in Economics and Management Sciences; Biggiero, L., Angelini, P.P., Basevi, M., Carbonara, N., Mastrogiorgio, A., Pessa, E., Sevi, E., Valente, M., Eds.; IGI Global: Hershey, PA, USA, 2016; pp. 232–256. [Google Scholar]
  29. Balland, P.A.; Boschma, R.; Frenken, K. Proximity and innovation: From statics to dynamics. Reg. Stud. 2015, 49, 907–920. [Google Scholar] [CrossRef]
  30. Friedman, T.L. The World Is Flat: The Globalized World in the Twenty-First Century; Penguin: London, UK, 2006. [Google Scholar]
  31. Archibugi, D.; Filippetti, A. Knowledge as global public good. In Handbook of Global Science, Technology and Innovation; Archibugi, D., Filippetti, A., Eds.; John Wiley & Sons, Ltd.: New Jersey, NJ, USA, 2015; pp. 479–504. [Google Scholar]
  32. Lee, N.; Rodríguez-Pose, A. Innovation and spatial inequality in Europe and USA. J. Econ. Geogr. 2013, 13, 1–22. [Google Scholar] [CrossRef]
  33. Lorenzoni, G.; Lipparini, A. The leveraging of interfirm relationships as a distinctive organizational capability: A longitudinal study. Strat. Manag. J. 1999, 20, 317–338. [Google Scholar] [CrossRef]
  34. Kale, P.; Dyer, J.H.; Singh, H. Alliance capability, stock market response, and long-term alliance success: The role of the alliance function. Strat. Manag. J. 2002, 23, 747–767. [Google Scholar] [CrossRef]
  35. Zacca, R.; Dayan, M.; Ahrens, T. Impact of network capability on small business performance. Manag. Dec. 2015, 53, 2–23. [Google Scholar] [CrossRef]
  36. Mahmood, I.P.; Zhu, H.; Zajac, E.J. Where can capabilities come from? Network ties and capability acquisition in business groups. Strat. Manag. J. 2011, 32, 820–848. [Google Scholar] [CrossRef]
  37. Walter, A.; Auer, M.; Ritter, T. The impact of network capabilities and entrepreneurial orientation on university spin-off performance. J. Bus. Ventur. 2006, 21, 541–567. [Google Scholar] [CrossRef]
  38. Ritter, T.; Gemünden, H.G. Network competence: Its impact on innovation success and its antecedents. J. Bus. Res. 2003, 56, 745–755. [Google Scholar] [CrossRef]
  39. Tyler, B.B. The complementarity of cooperative and technological competencies: A resource-based perspective. J. Eng. Technol. Manag. 2001, 18, 1–27. [Google Scholar] [CrossRef]
  40. Blomqvist, K.; Levy, J. Collaboration capability—A focal concept in knowledge creation and collaborative innovation in networks. Intern. J. Manag. Concepts Phil. 2006, 2, 31–48. [Google Scholar] [CrossRef]
  41. Human, G.; Naudé, P. Exploring the relationship between network competence, network capability and firm performance: A resource-based perspective in an emerging economy. J. S. Afr. Inst. Manag. Sci. 2009, 18, 2–14. [Google Scholar]
  42. Parida, V. Achieving Competitiveness through Externally Oriented Capabilities: An Empirical Study of Technology-based Small Firms; Luleå University of Technology: Luleå, Swedish, 2010. [Google Scholar]
  43. Ziggers, G.W.; Henseler, J. Inter-firm network capability: How it affects buyer-supplier performance. Br. Food J. 2009, 111, 794–810. [Google Scholar] [CrossRef]
  44. Teixeira, A.A.; Queirós, A.S. Economic growth, human capital and structural change: A dynamic panel data analysis. Res. Policy 2016, 45, 1636–1648. [Google Scholar] [CrossRef]
  45. Keklik, M. Schumpeter, Innovation and Growth: Long-Cycle Dynamics in the Post-WWII American Manufacturing Industries; Routledge: London, UK, 2018. [Google Scholar]
  46. Haans, R.F.; Pieters, C.; He, Z.L. Thinking about U: Theorizing and testing U-and inverted U-shaped relationships in strategy research. Strat. Manag. J. 2016, 37, 1177–1195. [Google Scholar] [CrossRef]
  47. Etzkowitz, H.; Zhou, C. The Triple Helix: University–Industry–Government Innovation and Entrepreneurship; Routledge: London, UK, 2017. [Google Scholar]
  48. Crescenzi, R.; Gagliardi, L.; Iammarino, S. Foreign multinationals and domestic innovation: Intra-industry effects and firm heterogeneity. Res. Policy 2015, 44, 596–609. [Google Scholar] [CrossRef] [Green Version]
  49. Rantala, T.; Ukko, J. Performance measurement in university–industry innovation networks: Implementation practices and challenges of industrial organizations. J. Edu. Work 2018, 31, 247–261. [Google Scholar] [CrossRef]
  50. Wonglimpiyarat, J. The innovation incubator, university business incubator and technology transfer strategy: The case of Thailand. Technol. Soc. 2016, 46, 18–27. [Google Scholar] [CrossRef] [Green Version]
  51. Cozzens, S.E. Innovation and inequality. In The Co-evolution of Innovation Policy: Innovation Policy Dynamics, Systems, and Governance; Kuhlmann, S., Shapira, P., Smits, R., Eds.; Edward Elgar: Cheltenham, UK, 2008; pp. 363–385. [Google Scholar]
  52. Wallace, D. Environmental Policy and Industrial Innovation: Strategies in Europe, the USA and Japan; Routledge: London, UK, 2017. [Google Scholar]
  53. Bathelt, H.; Malmberg, A.; Maskell, P. Clusters and knowledge: Local buzz, global pipelines and the process of knowledge creation. Prog. Hum. Geogr. 2004, 28, 31–56. [Google Scholar] [CrossRef]
  54. Un, C.A.; Rodríguez, A. Local and global knowledge complementarity: R&D collaborations and innovation of foreign and domestic firms. J. Intern. Manag. 2018, 24, 137–152. [Google Scholar]
  55. Hu, G. China’s cost of investment and construction of investment Environment. In The Cost of Development in China; Hu, G., Ed.; Springer: Singapore, 2017; pp. 365–377. [Google Scholar]
  56. Wei, Y.D.; Liao, H.F. The embeddedness of transnational corporations in Chinese cities: Strategic coupling in global production networks? Habitat Int. 2013, 40, 82–90. [Google Scholar] [CrossRef]
  57. Wei, Y.D. Network linkages and local embeddedness of foreign ventures in China: The case of Suzhou municipality. Reg. Stud. 2015, 49, 287–299. [Google Scholar] [CrossRef]
  58. Wei, Y.D.; Zhou, Y.; Sun, Y.; Lin, C.G. Production and R&D networks of foreign ventures in China: Implications for technological dynamism and regional development. Appl. Geogr. 2012, 32, 106–118. [Google Scholar]
  59. Taylor, P.J.; Derudder, B. World City Network: A Global Urban Analysis; Routledge: London, UK, 2015. [Google Scholar]
  60. McAdam, M.; McAdam, R.; Dunn, A.; McCall, C. Regional horizontal networks within the SME agri-food sector: An innovation and social network perspective. Reg. Stud. 2016, 50, 1316–1329. [Google Scholar] [CrossRef]
  61. Jiang, S.; Shi, A.; Peng, Z.; Li, X. Major factors affecting cross-city R&D collaborations in China: Evidence from cross-sectional co-patent data between 224 cities. Scientometrics 2017, 111, 1251–1266. [Google Scholar]
  62. Wong, P.K.; Singh, A. Do co-publications with industry lead to higher levels of university technology commercialization activity? Scientometrics 2013, 97, 245–265. [Google Scholar] [CrossRef]
  63. Hennemann, S.; Wang, T.; Liefner, I. Measuring regional science networks in China: A comparison of international and domestic bibliographic data sources. Scientometrics 2011, 88, 535–554. [Google Scholar] [CrossRef]
  64. Van Beuzekom, B.; Arundel, A. OECD Biotechnolgy Statistics-2006; OECD Publishing: Paris, France, 2006. [Google Scholar]
  65. Hoekman, J.; Frenken, K.; Van Oort, F. The geography of collaborative knowledge production in Europe. Ann. Reg. Sci. 2009, 43, 721–738. [Google Scholar] [CrossRef]
  66. Denicolai, S.; Ramirez, M.; Tidd, J. Overcoming the false dichotomy between internal R&D and external knowledge acquisition: Absorptive capacity dynamics over time. Technol. Forecast. Soc. Chang. 2016, 104, 57–65. [Google Scholar]
  67. Lichtenthaler, U. Determinants of absorptive capacity: The value of technology and market orientation for external knowledge acquisition. J. Bus. Ind. Mark. 2016, 31, 600–610. [Google Scholar] [CrossRef]
  68. Opsahl, T.; Agneessens, F.; Skvoretz, J. Node centrality in weighted networks: Generalizing degree and shortest paths. Soc. Netw. 2010, 32, 245–251. [Google Scholar] [CrossRef]
  69. Li, H.; Wei, Y.D.; Liao, H.F.; Huang, Z. Administrative hierarchy and urban land expansion in transitional China. Appl. Geogr. 2015, 56, 177–186. [Google Scholar] [CrossRef]
  70. Wei, Y.D. Spatiality of regional inequality. Appl. Geogr. 2015, 61, 1–10. [Google Scholar] [CrossRef]
  71. Huang, H.; Wei, Y.D. Spatial inequality of foreign direct investment in China: Institutional change, agglomeration economies, and market access. Appl. Geogr. 2016, 69, 99–111. [Google Scholar] [CrossRef]
  72. Anselin, L. The future of spatial analysis in the social sciences. Geogr. Inf. Sci. 1999, 5, 67–76. [Google Scholar] [CrossRef]
  73. Ertur, C.; Gallo, J.L.; Baumont, C. The European regional convergence process, 1980–1995: Do spatial regimes and spatial dependence matter? Int. Reg. Sci. Rev. 2006, 29, 3–34. [Google Scholar] [CrossRef]
  74. Cravo, T.A.; Resende, G.M. Economic growth in Brazil: A spatial filtering approach. Ann. Reg. Sci. 2013, 50, 555–575. [Google Scholar] [CrossRef]
  75. Flores, M.; Rodriguez, O.E. Spillover effects of homicides across Mexican municipalities: A spatial regime model approach. Rev. Reg. Stud. 2014, 44, 241–262. [Google Scholar]
  76. Dang, J.; Motohashi, K. Patent statistics: A good indicator for innovation in China? Patent subsidy program impacts on patent quality. China Econ. Rev. 2015, 35, 137–155. [Google Scholar] [CrossRef]
  77. Janger, J.; Schubert, T.; Andries, P.; Rammer, C.; Hoskens, M. The EU 2020 innovation indicator: A step forward in measuring innovation outputs and outcomes? Res. Policy 2017, 46, 30–42. [Google Scholar] [CrossRef] [Green Version]
  78. Burger, M.J.; Meijers, E.J.; Hoogerbrugge, M.M.; Tresserra, J.M. Borrowed size, agglomeration shadows and cultural amenities in North-West Europe. Eur. Plan. Stud. 2015, 23, 1090–1109. [Google Scholar] [CrossRef]
Figure 1. The analytic framework.
Sustainability 11 04770 g001
Figure 2. The explanation of network capabilities.
Sustainability 11 04770 g002
Figure 3. The Gini coefficient of network capabilities in SKN.
Sustainability 11 04770 g003
Figure 4. Spatial evolution of acquisition capability in SKN. The picture in the upper left corner is the innovation network (the same below).
Sustainability 11 04770 g004
Figure 5. Spatial evolution of control capability in SKN.
Sustainability 11 04770 g005
Figure 6. The Gini coefficient of network capabilities in TKN.
Sustainability 11 04770 g006
Figure 7. Spatial evolution of acquisition capability in TKN.
Sustainability 11 04770 g007
Figure 8. Spatial evolution of control capability in TKN.
Sustainability 11 04770 g008
Table 1. Definitions of the variables.
VariablesIndicatorsDescription
Dependent VariableInnovation OutputOutput Value of Biotechnology Industry (Yuan)
Independent VariablesNetwork CapabilitiesAcquisition CapabilityRelative Degree Centrality
Control CapabilityRelative Betweenness Centrality
Innovation ResourcesTalentsNumber of Employees (person)
Innovation SubjectsFirmsTotal of Collective, Personal, Corporate Capital (Yuan)
Control VariablesInnovation ClimateGlobalizationTotal of Hong Kong, Macao and Taiwan, Foreign Capital (Yuan)
MarketizationState-owned Capital (Yuan)
InstitutionNational Advanced Science and Technology Center: Yes-1, No-0
Table 2. Basic information on scientific knowledge networks (SKN) and technological knowledge networks (TKN) from 2000 to 2012.
YearRaw DataCooperation FrequencySize
SKNTKNSKNTKNSKNTKN
200014181997250776015
200117161184353637122
200222121380511849226
20032833192169112810330
200437362099101416113537
200548282730153414615441
200660163109202715817243
200775043682268617718747
200894755302317725220657
200911,4666249384231020582
201011,11815,983338767020286
201113,63517,052477657822395
201216,29714,335588539722488
Total92,25477,02330,1333201 1-
1 Size is the number of cities in the network, cooperation frequency is the sum of pairwise cooperation frequencies between city nodes.
Table 3. Spatial regime model results for acquisition capability in SKN.
VariablesIndicators20022012
EastCentralWestEastCentralWest
Independent VariablesNetwork capabilityAcquisition Capability470,200 *
[0.02]
374,300
[0.23]
703,300 *
[0.02]
−885,700
[0.20]
−534,000
[0.49]
−662,400
[0.62]
Innovation ResourcesTalents123.90 ***
[0.00]
236.20 ***
[0.00]
52.47
[0.41]
924.30 ***
[0.00]
637.50 ***
[0.00]
657.10 *
[0.04]
Innovation SubjectsFirms1.27 ***
[0.00]
−0.42
[0.59]
−3.15
[0.21]
1.11
[0.12]
1.31
[0.22]
0.31
[0.85]
Control VariablesInnovation ClimateGlobalization1.21 ***
[0.00]
−1.66
[0.65]
36.01 *
[0.04]
0.60
[0.31]
2.73
[0.47]
5.22
[0.40]
Marketization−0.63 ***
[0.00]
0.14
[0.93]
3.97 *
[0.02]
−5.83 **
[0.01]
−6.26
[0.20]
0.98
[0.77]
Institution397,700 #
[0.07]
−340,300
[0.39]
1,975,000 *
[0.02]
399,500
[0.73]
−354,300
[0.77]
574,500
[0.77]
Intercept−544,900 ** [0.01]468,800 [0.55]
Adjusted R20.950.85
Observations75196 2
2 significant code: 0 “***”, 0.001 “**”, 0.01 “*”, 0.05 “#”, values in [] are the t values, the same below.
Table 4. Spatial regime model results for control capability in SKN.
VariablesIndicators20022012
EastCentralWestEastCentralWest
Independent VariablesNetwork CapabilityControl Capability434,700 **
[0.00]
162,500
[0.46]
618,400
[0.56]
−2,591,000 *
[0.04]
−436,100
[0.79]
−3,652,000
[0.46]
Innovation ResourcesTalents113.50 ***
[0.00]
240.40 ***
[0.00]
94.15
[0.33]
888.50 ***
[0.00]
642.60 ***
[0.00]
755.50 *
[0.02]
Innovation SubjectsFirms1.39 ***
[0.00]
−0.47
[0.49]
−2.86
[0.50]
1.47 *
[0.05]
1.27
[0.23]
−0.01
[0.99]
Control VariablesInnovation ClimateGlobalization1.19 ***
[0.00]
−1.74
[0.59]
30.52
[0.15]
0.84
[0.16]
2.53
[0.51]
8.78
[0.31]
Marketization−0.67 ***
[0.00]
0.16
[0.92]
4.06 *
[0.02]
−5.41 **
[0.01]
−6.30
[0.20]
2.85
[0.54]
Institution45300 *
[0.02]
−290,900
[0.45]
2,034,000 *
[0.03]
88,470
[0.93]
−384,600
[0.72]
64,700
[0.97]
Intercept−110,800 [0.38]−131,200 [0.83]
Adjusted R20.950.85
Observations75196
Table 5. Spatial regime model results for TKN in 2012.
VariablesIndicatorsEastCentralWestEastCentralWest
Independent VariablesNetwork CapabilitiesAcquisition Capability−5,513,000 *
[0.03]
−4,751,000
[0.18]
−6,555,000
[0.25]
Control Capability −2,593,000
[0.13]
−1,048,000
[0.81]
−791,600
[0.93]
Innovation ResourcesTalents1025 ***
[0.00]
660.10
[0.11]
452.60
[0.60]
1080 ***
[0.00]
682.70
[0.13]
379.90
[0.66]
Innovation SubjectsFirms0.67
[0.62]
1.20
[0.73]
0.67
[0.85]
0.26
[0.84]
0.70
[0.88]
0.98
[0.83]
Control VariablesInnovation ClimateGlobalization1.50
[1.65]
8.41
[0.27]
13.60
[0.29]
0.96
[0.36]
6.02
[0.48]
9.29
[0.66]
Marketization−5.61 #
[0.07]
−14.36
[0.24]
15.79
[0.50]
−5.82 #
[0.07]
−12.62
[0.31]
8.41
[0.81]
Institution−2,121,000
[0.43]
868,500
[0.84]
34,410
[1.00]
−2,807,000
[0.25]
−263,500
[0.95]
−1,590,000
[0.72]
Intercept5,822,000 # [0.08]899,200 [0.65]
Adjusted R20.800.79
Observations75 3
3 The model only calculates the data in 2012, because the number of cities in 2002 are too small to meet the regression sample-size requirement.

