The Zero-Energy Idea in Districts: Application of a Methodological Approach to a Case Study of Epinlieu (Mons)
Abstract
:1. Introduction
1.1. Objectives of the Research
- To expand the zero-energy concept from buildings and investigate its applicability to larger territorial scales;
- To simulate the analysis and modeling of Net-Zero Energy District(s) (NZED) models, testing various indicators and interconnections between them;
- To introduce and apply a methodological approach in a real case study and consider the perspectives for its future transition within the zero-energy objectives.
1.2. Structure of the Paper
2. Energy and Urban Structure: A State-of-the-Art Analysis
2.1. Literature Review and Previous Works
3. Methodological Approach
3.1. The “Zero-Energy” Concept
3.2. The Role of the District
3.3. Description of the Methodology and Steps
3.3.1. Development of a Theoretical Model
- A.
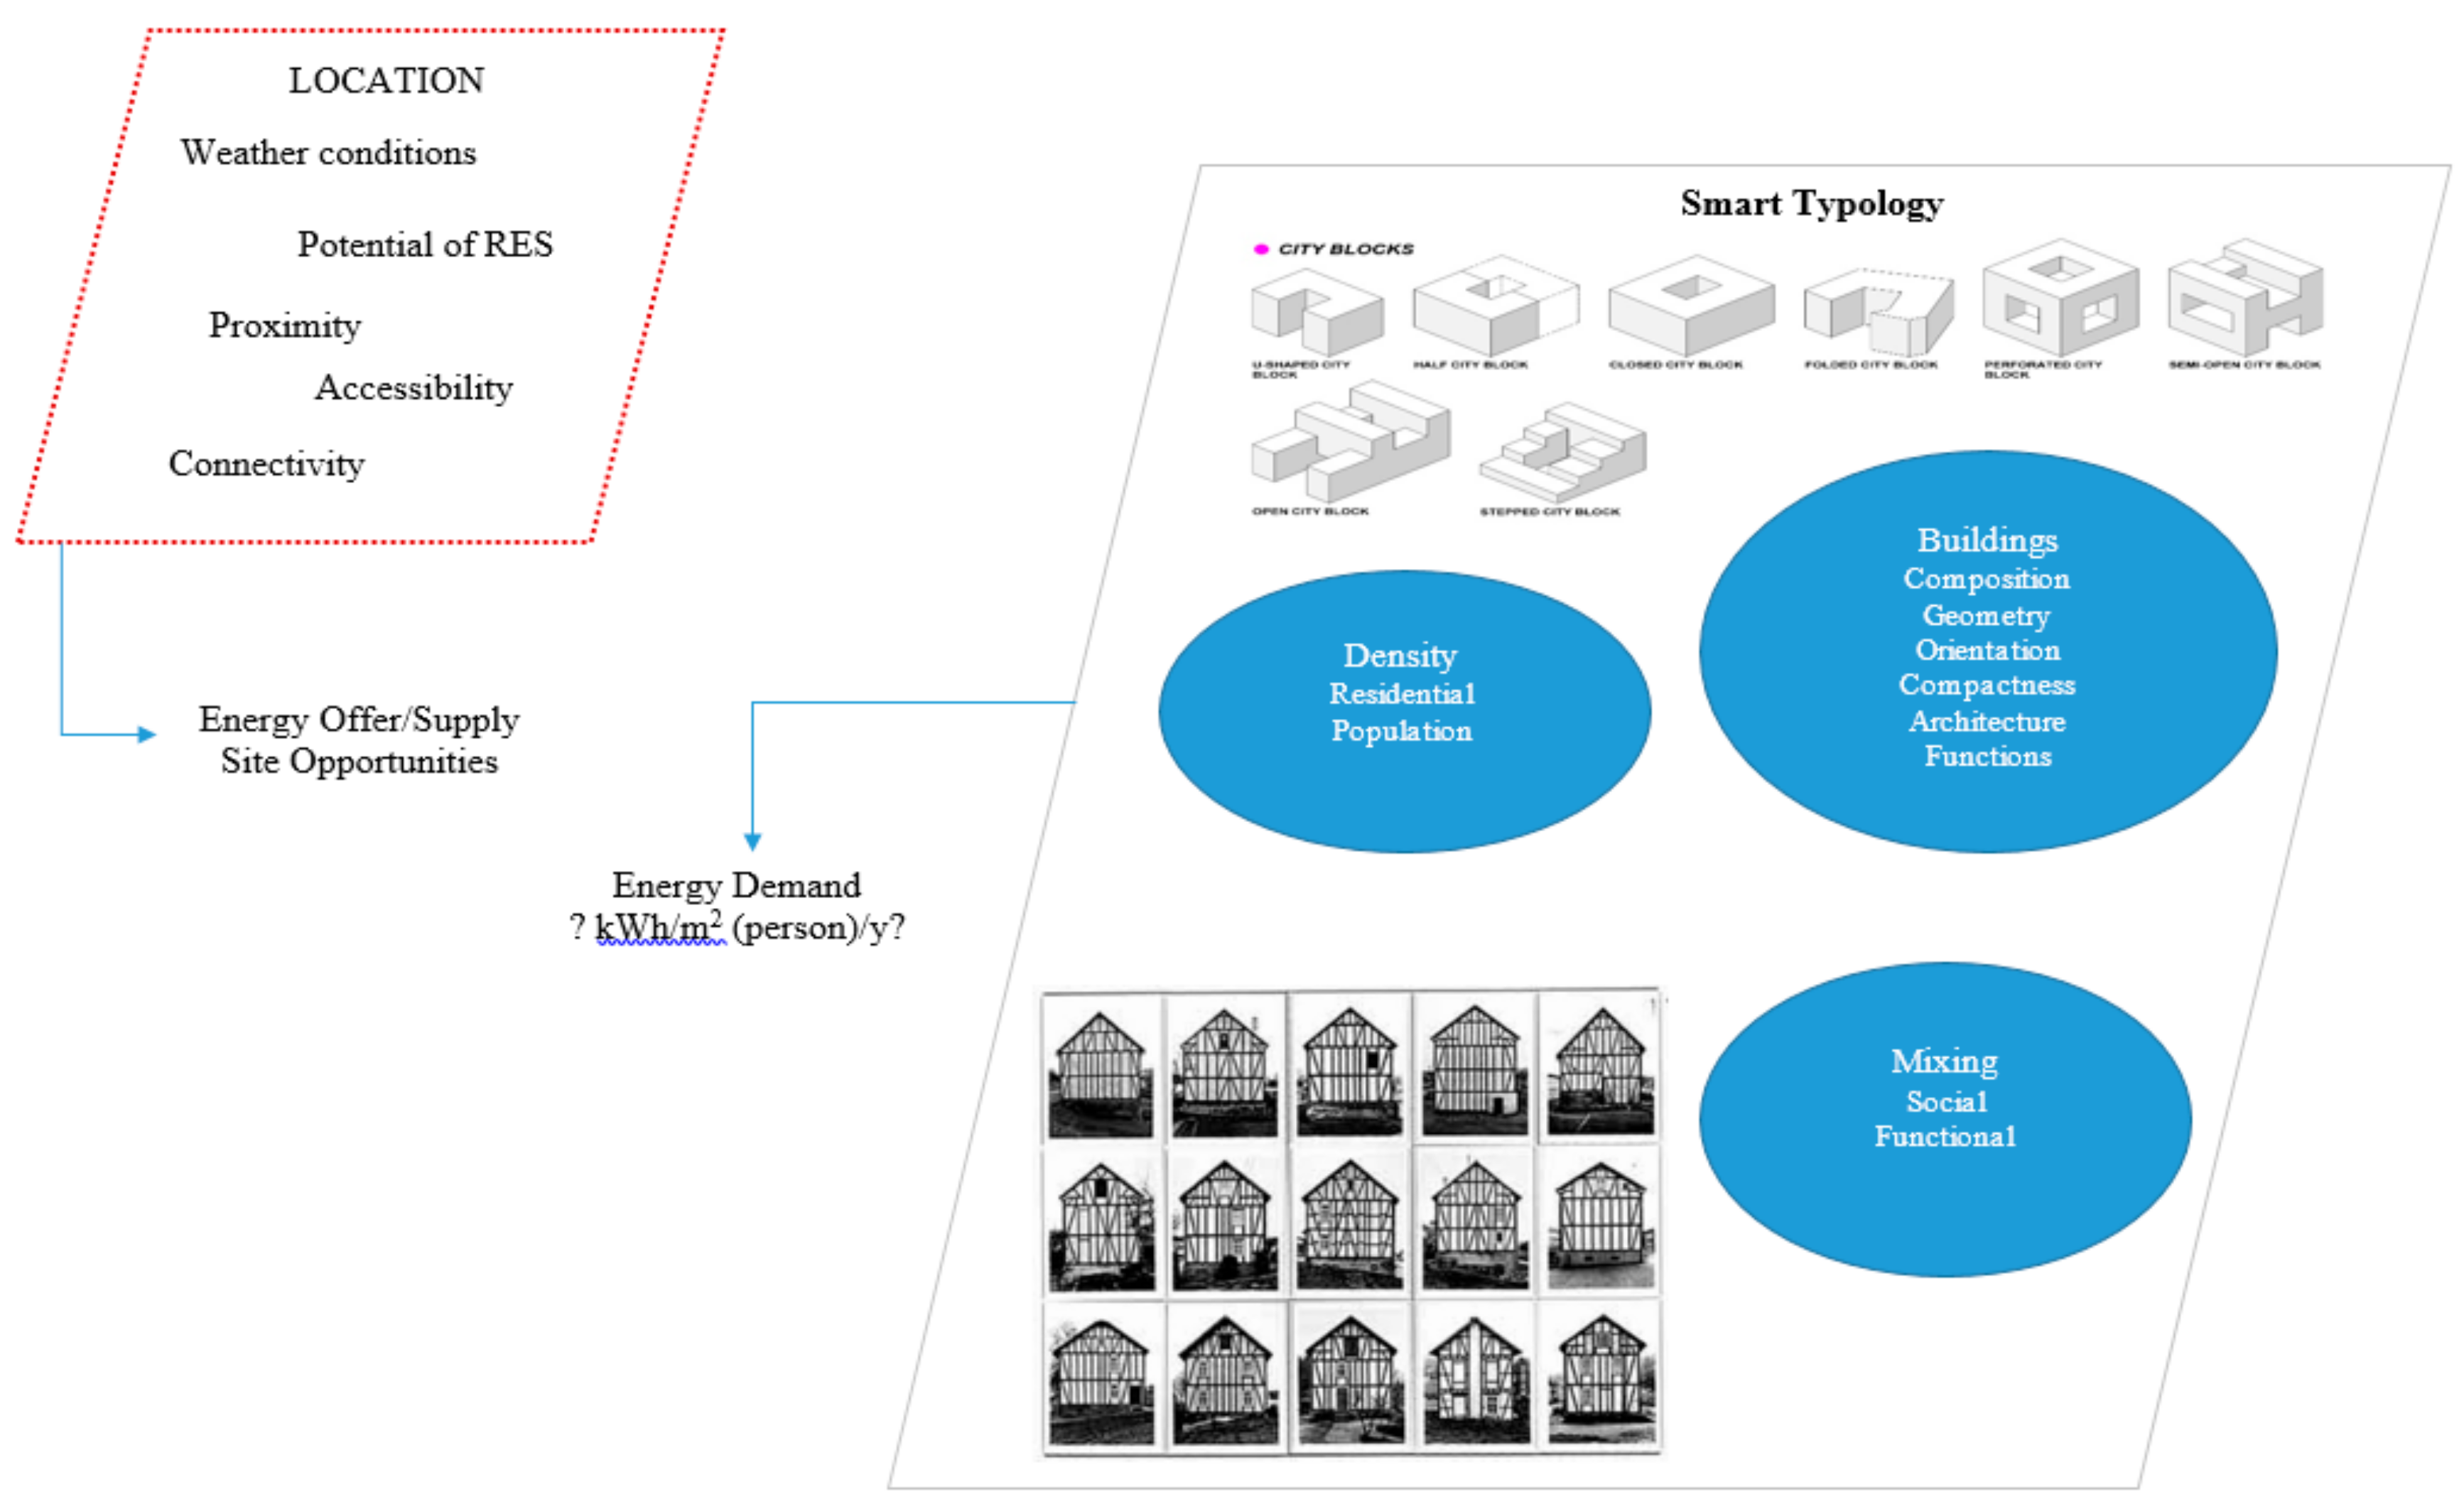
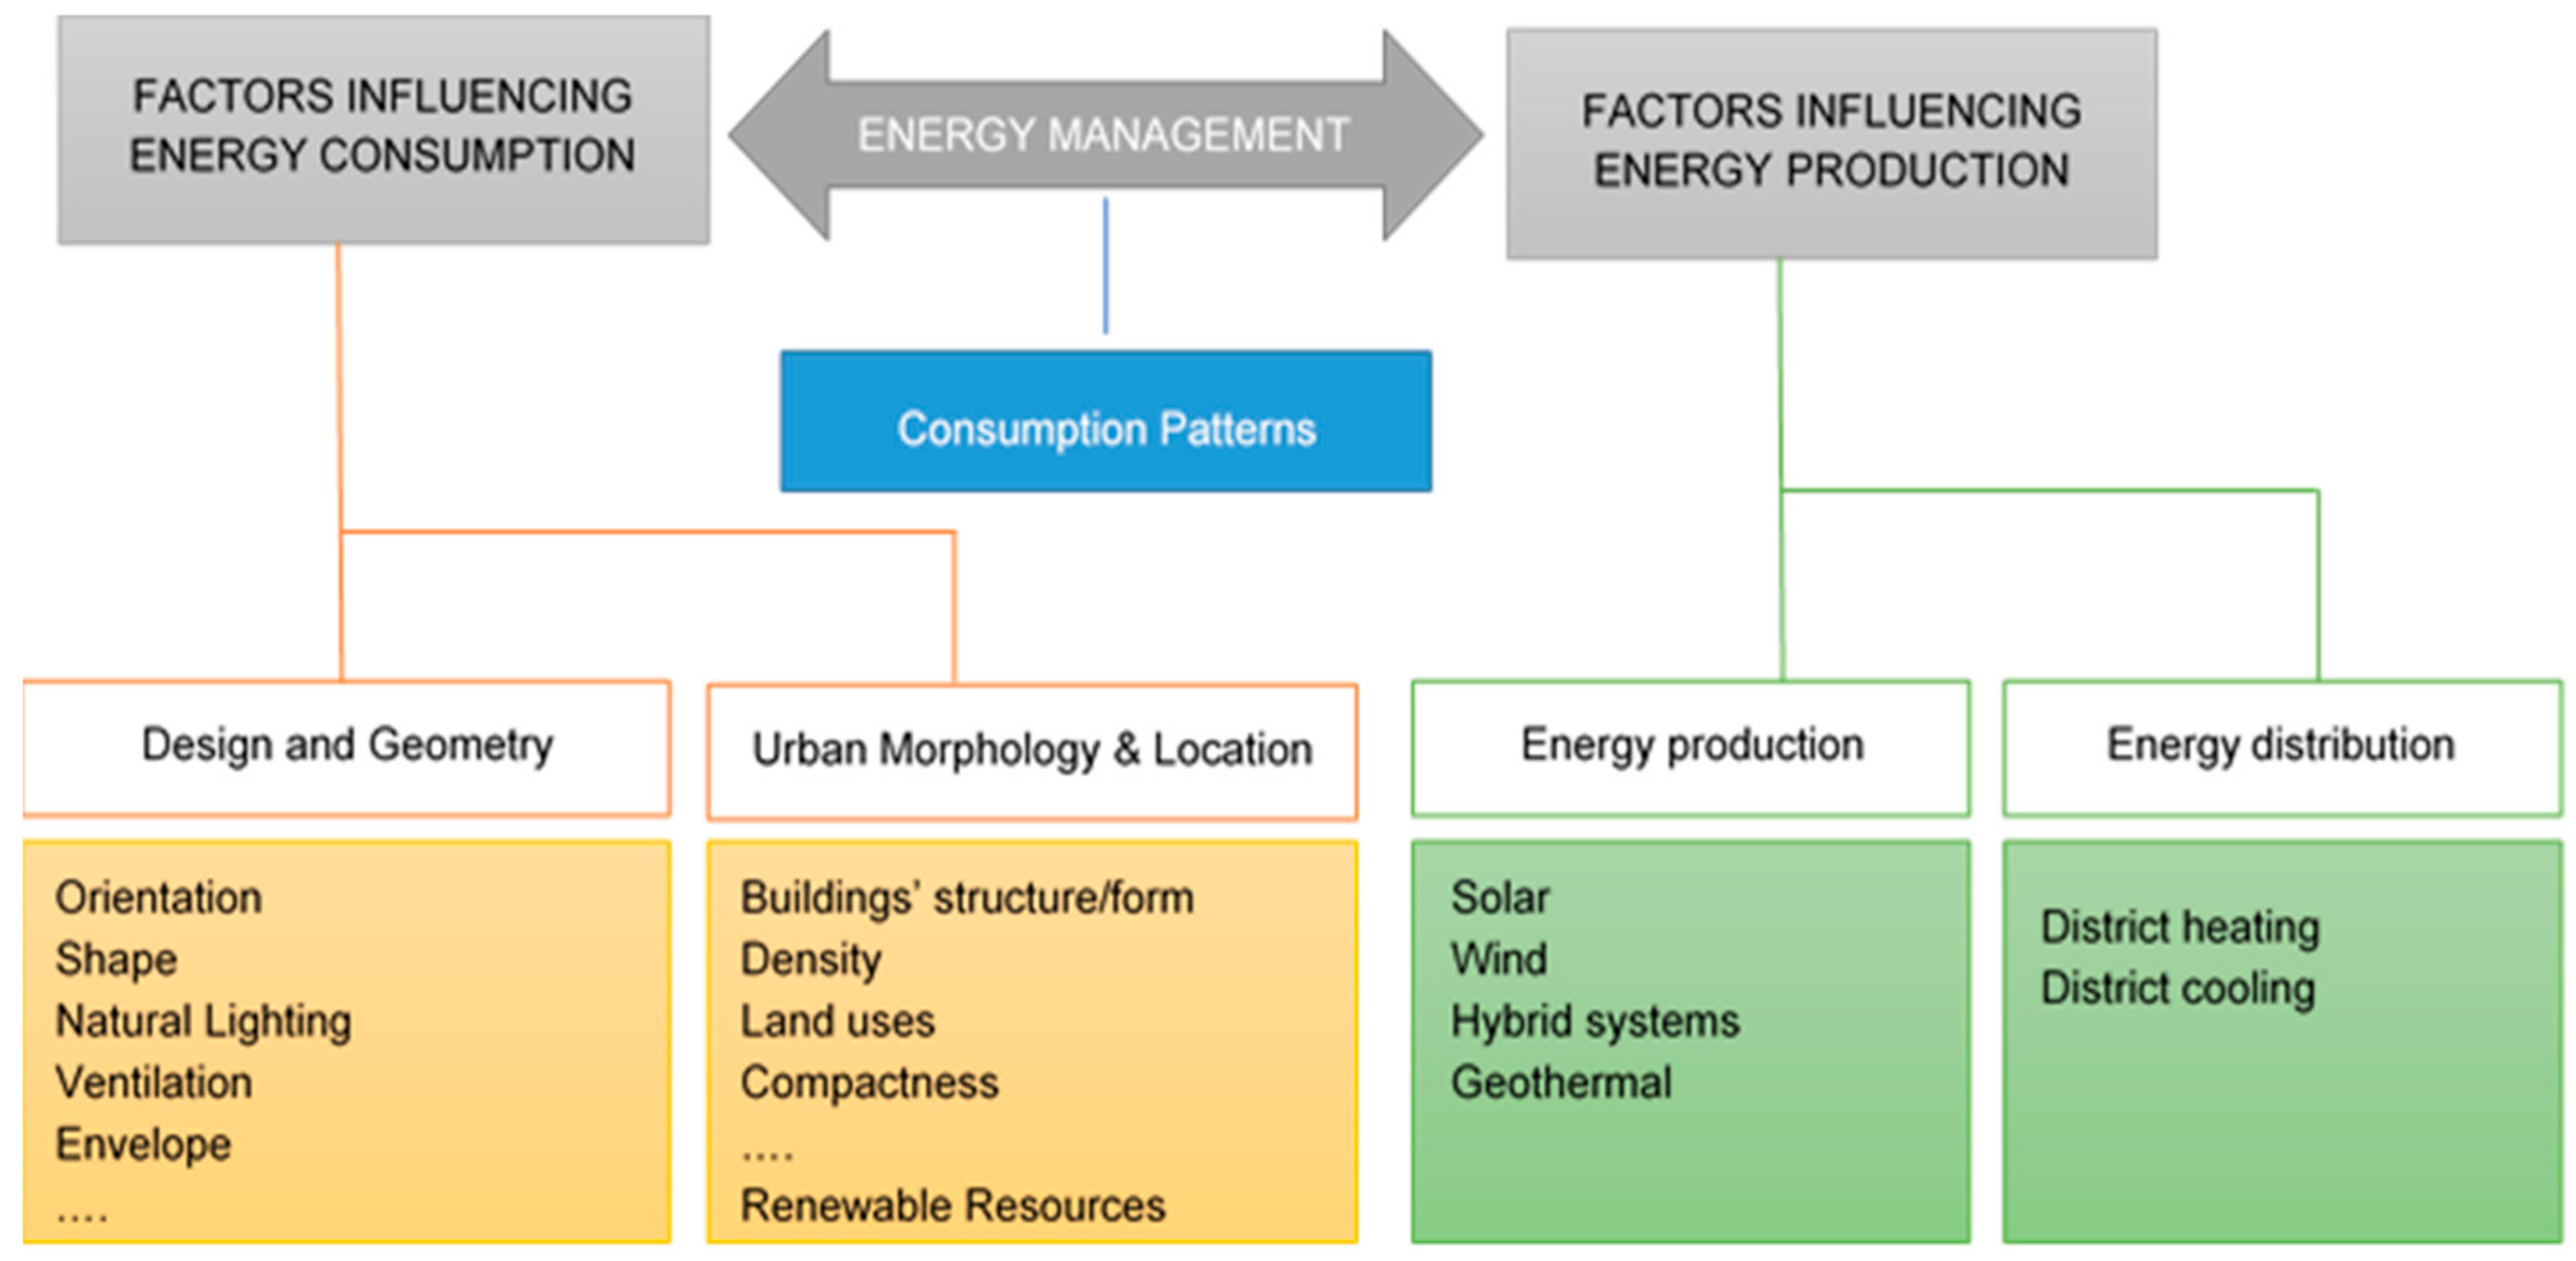
- Theoretical approach. This was a diagnostic phase of the current situation in the studied district (description of the parameters of the built and the urban environment, estimation and prognosis for the energy requirements of the users; etc.). For the U-ZED approach, the “problem” has been the outline of the “optimal typo-morphological definition of the district with zero-energy attributes”;
- B.
- Experimental approach. This was a validation of the criteria on-site and experimentation of the approach in real case studies. Assessing the current situation of the district was the initial phase of the experimentation approach of the case study application. Thus, we analyzed the potentialities with regard to energy, enhancement of mild mobility, etc., and the connection of the existing urban tissue of the city in accordance with the objectives of city planning as a whole.
- 1
- The realization of a “state of place”/description of the actual situation in terms of energy requirements in districts (kWh) by its buildings and users. The first step is the determination of the energy requirements “on-site”. To this end, diverse methods are developed with the intention of obtaining an approximation that is more realistic: for instance, real data use considering the real quantities of energy consumption or approximation methods;
- 2
- The policy targets and measurements for urbanization strategies for zero-energy concepts in districts. The second step of the U-ZED approach is the development of scenarios to estimate the future energy requirements of the studied districts and assess the future needs of users related to the existing sources and supplies (Figure 9).
3.4. Key Performance Indicators
3.4.1. Key Performance Indicators in the U-ZED Approach
3.5. Methods and Tools
3.5.1. Quantum Geographic Information System (QGIS) Tool
3.5.2. Hybrid Optimization Model for Electric Renewables (HOMER)
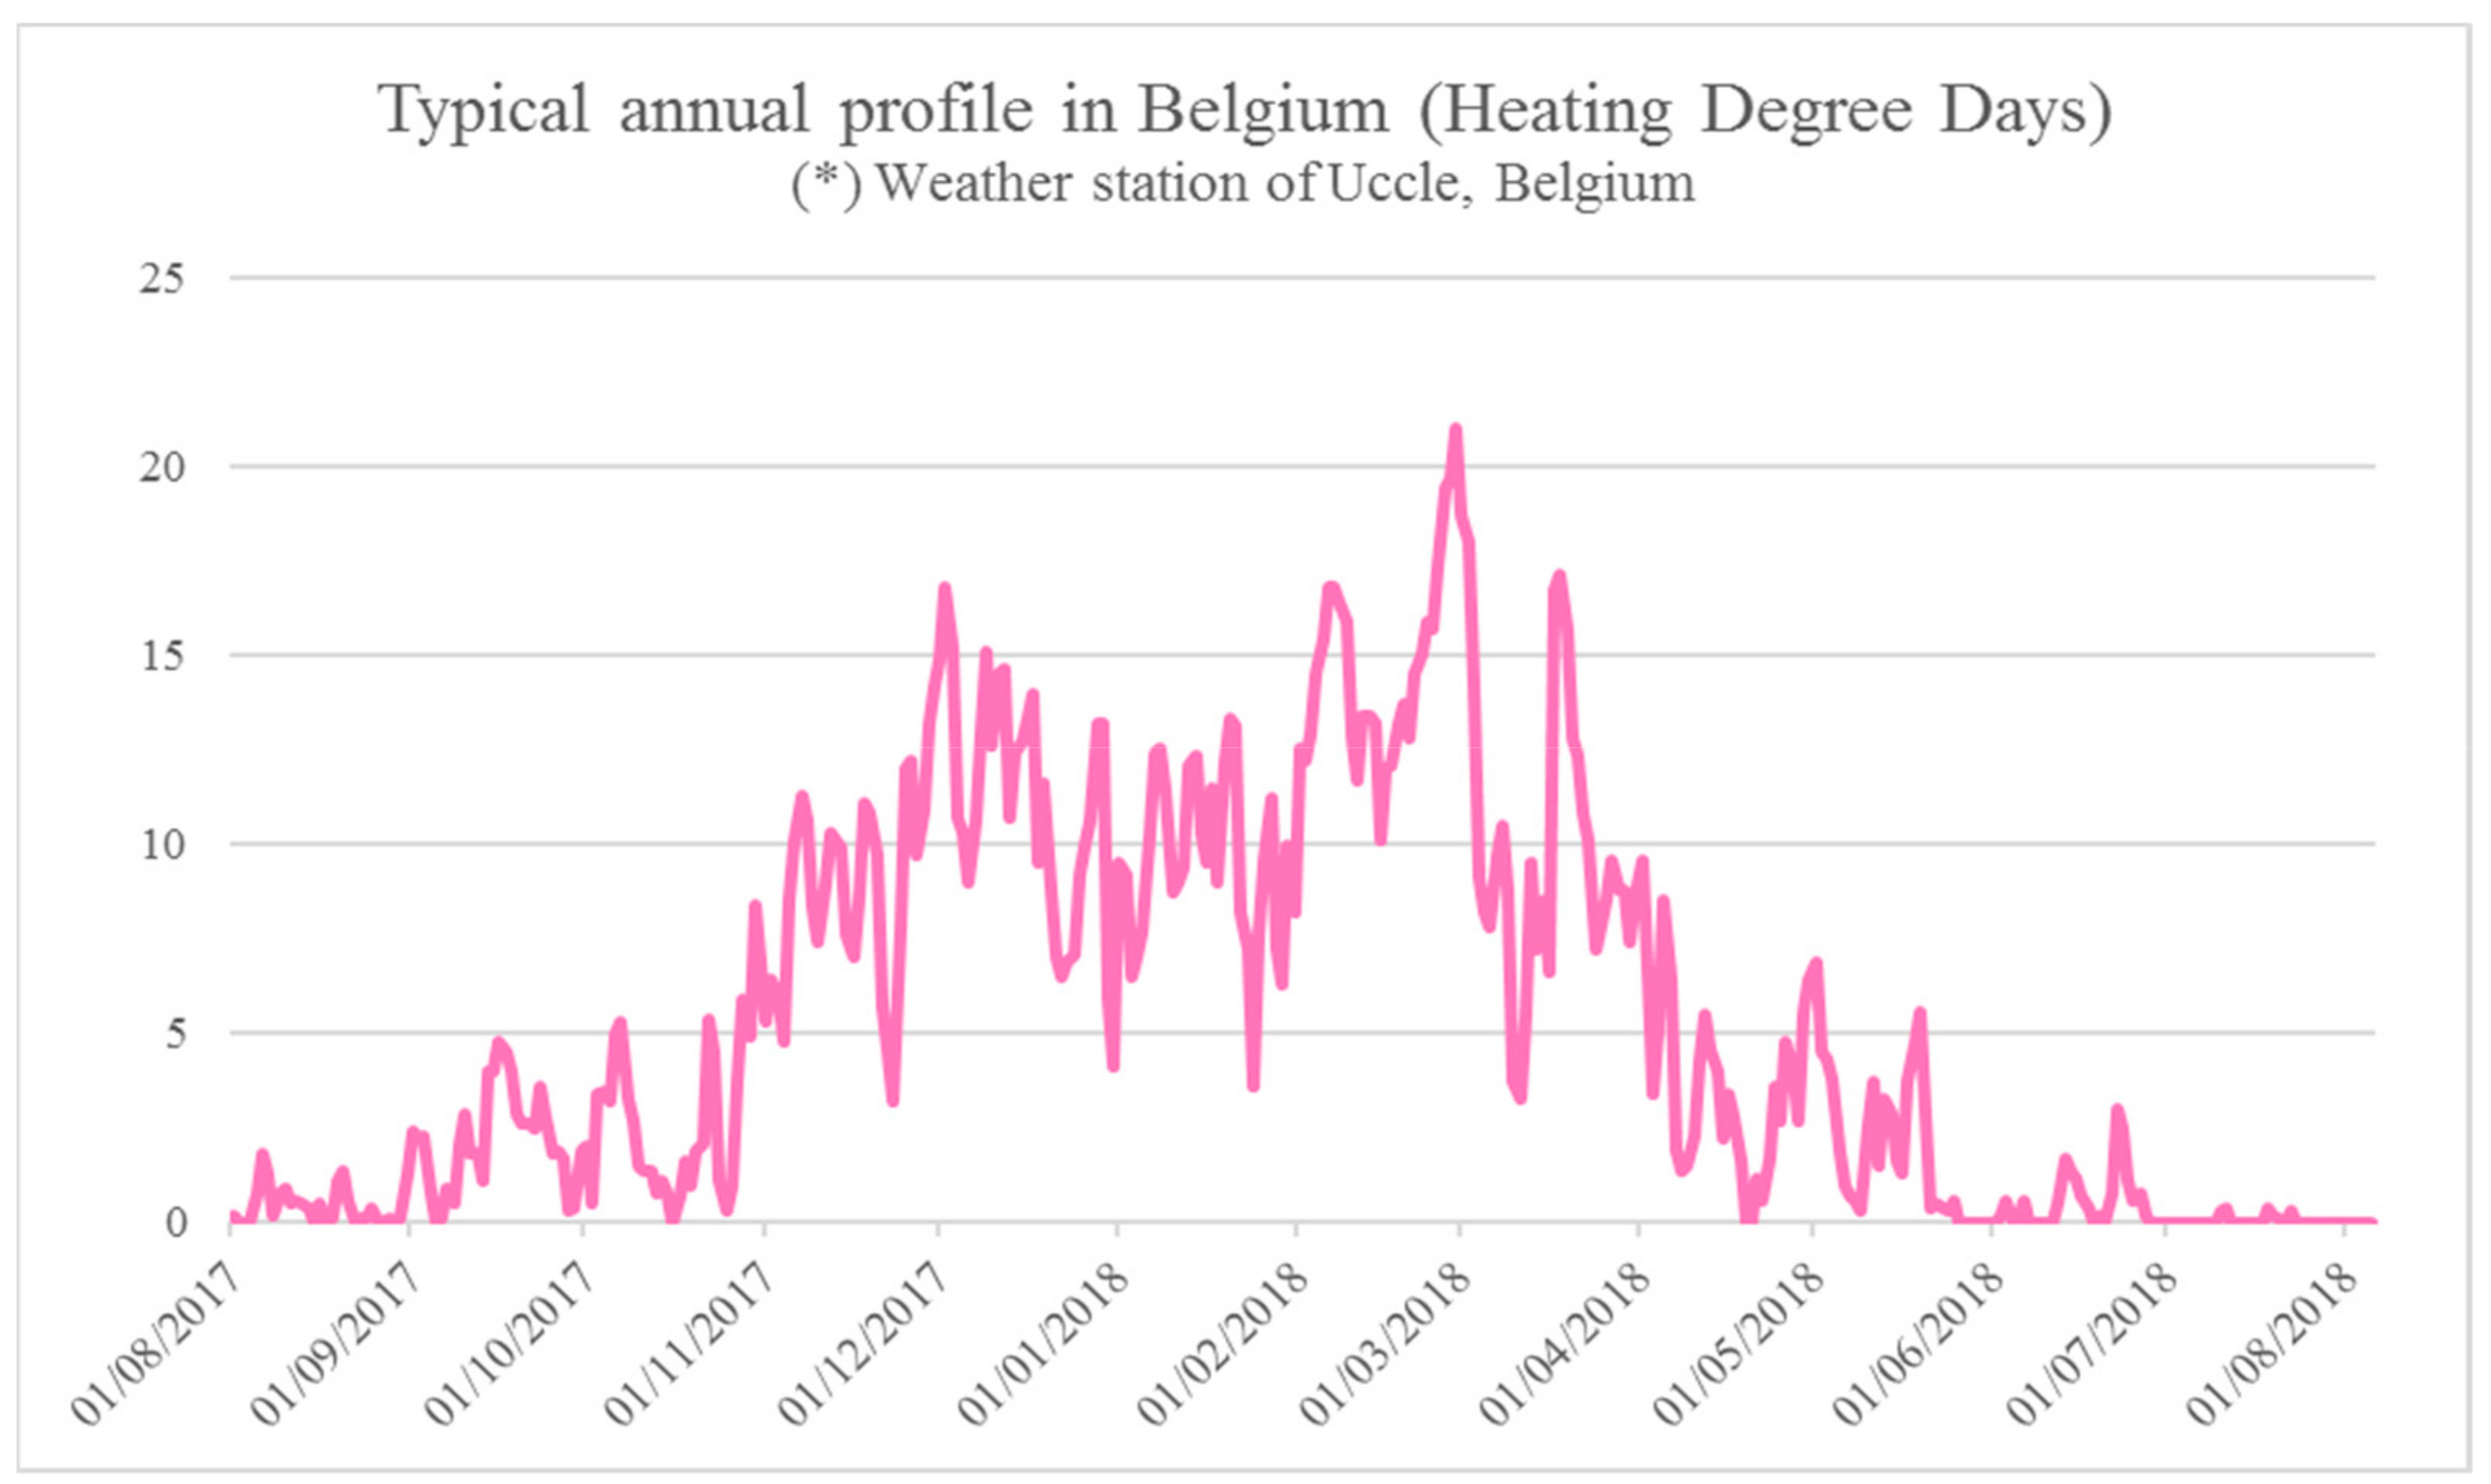
3.5.3. The Method of Degree Days
- Mean daily degree hours, including the integration or summation of hourly records;
- Mean daily temperature from daily maxima and minima;
- Meteorological office equations;
- Hitchin’s formula.
4. Case Study Analysis
4.1. The Case Study of Epinlieu in Mons: Diagnosis
4.2. Analysis of the Urban and Built Environment of the District in its Current Situation
4.3. Transition toward the Zero-Energy Objectives: The Case Study of Epinlieu (A Focus on Energy Autonomy)
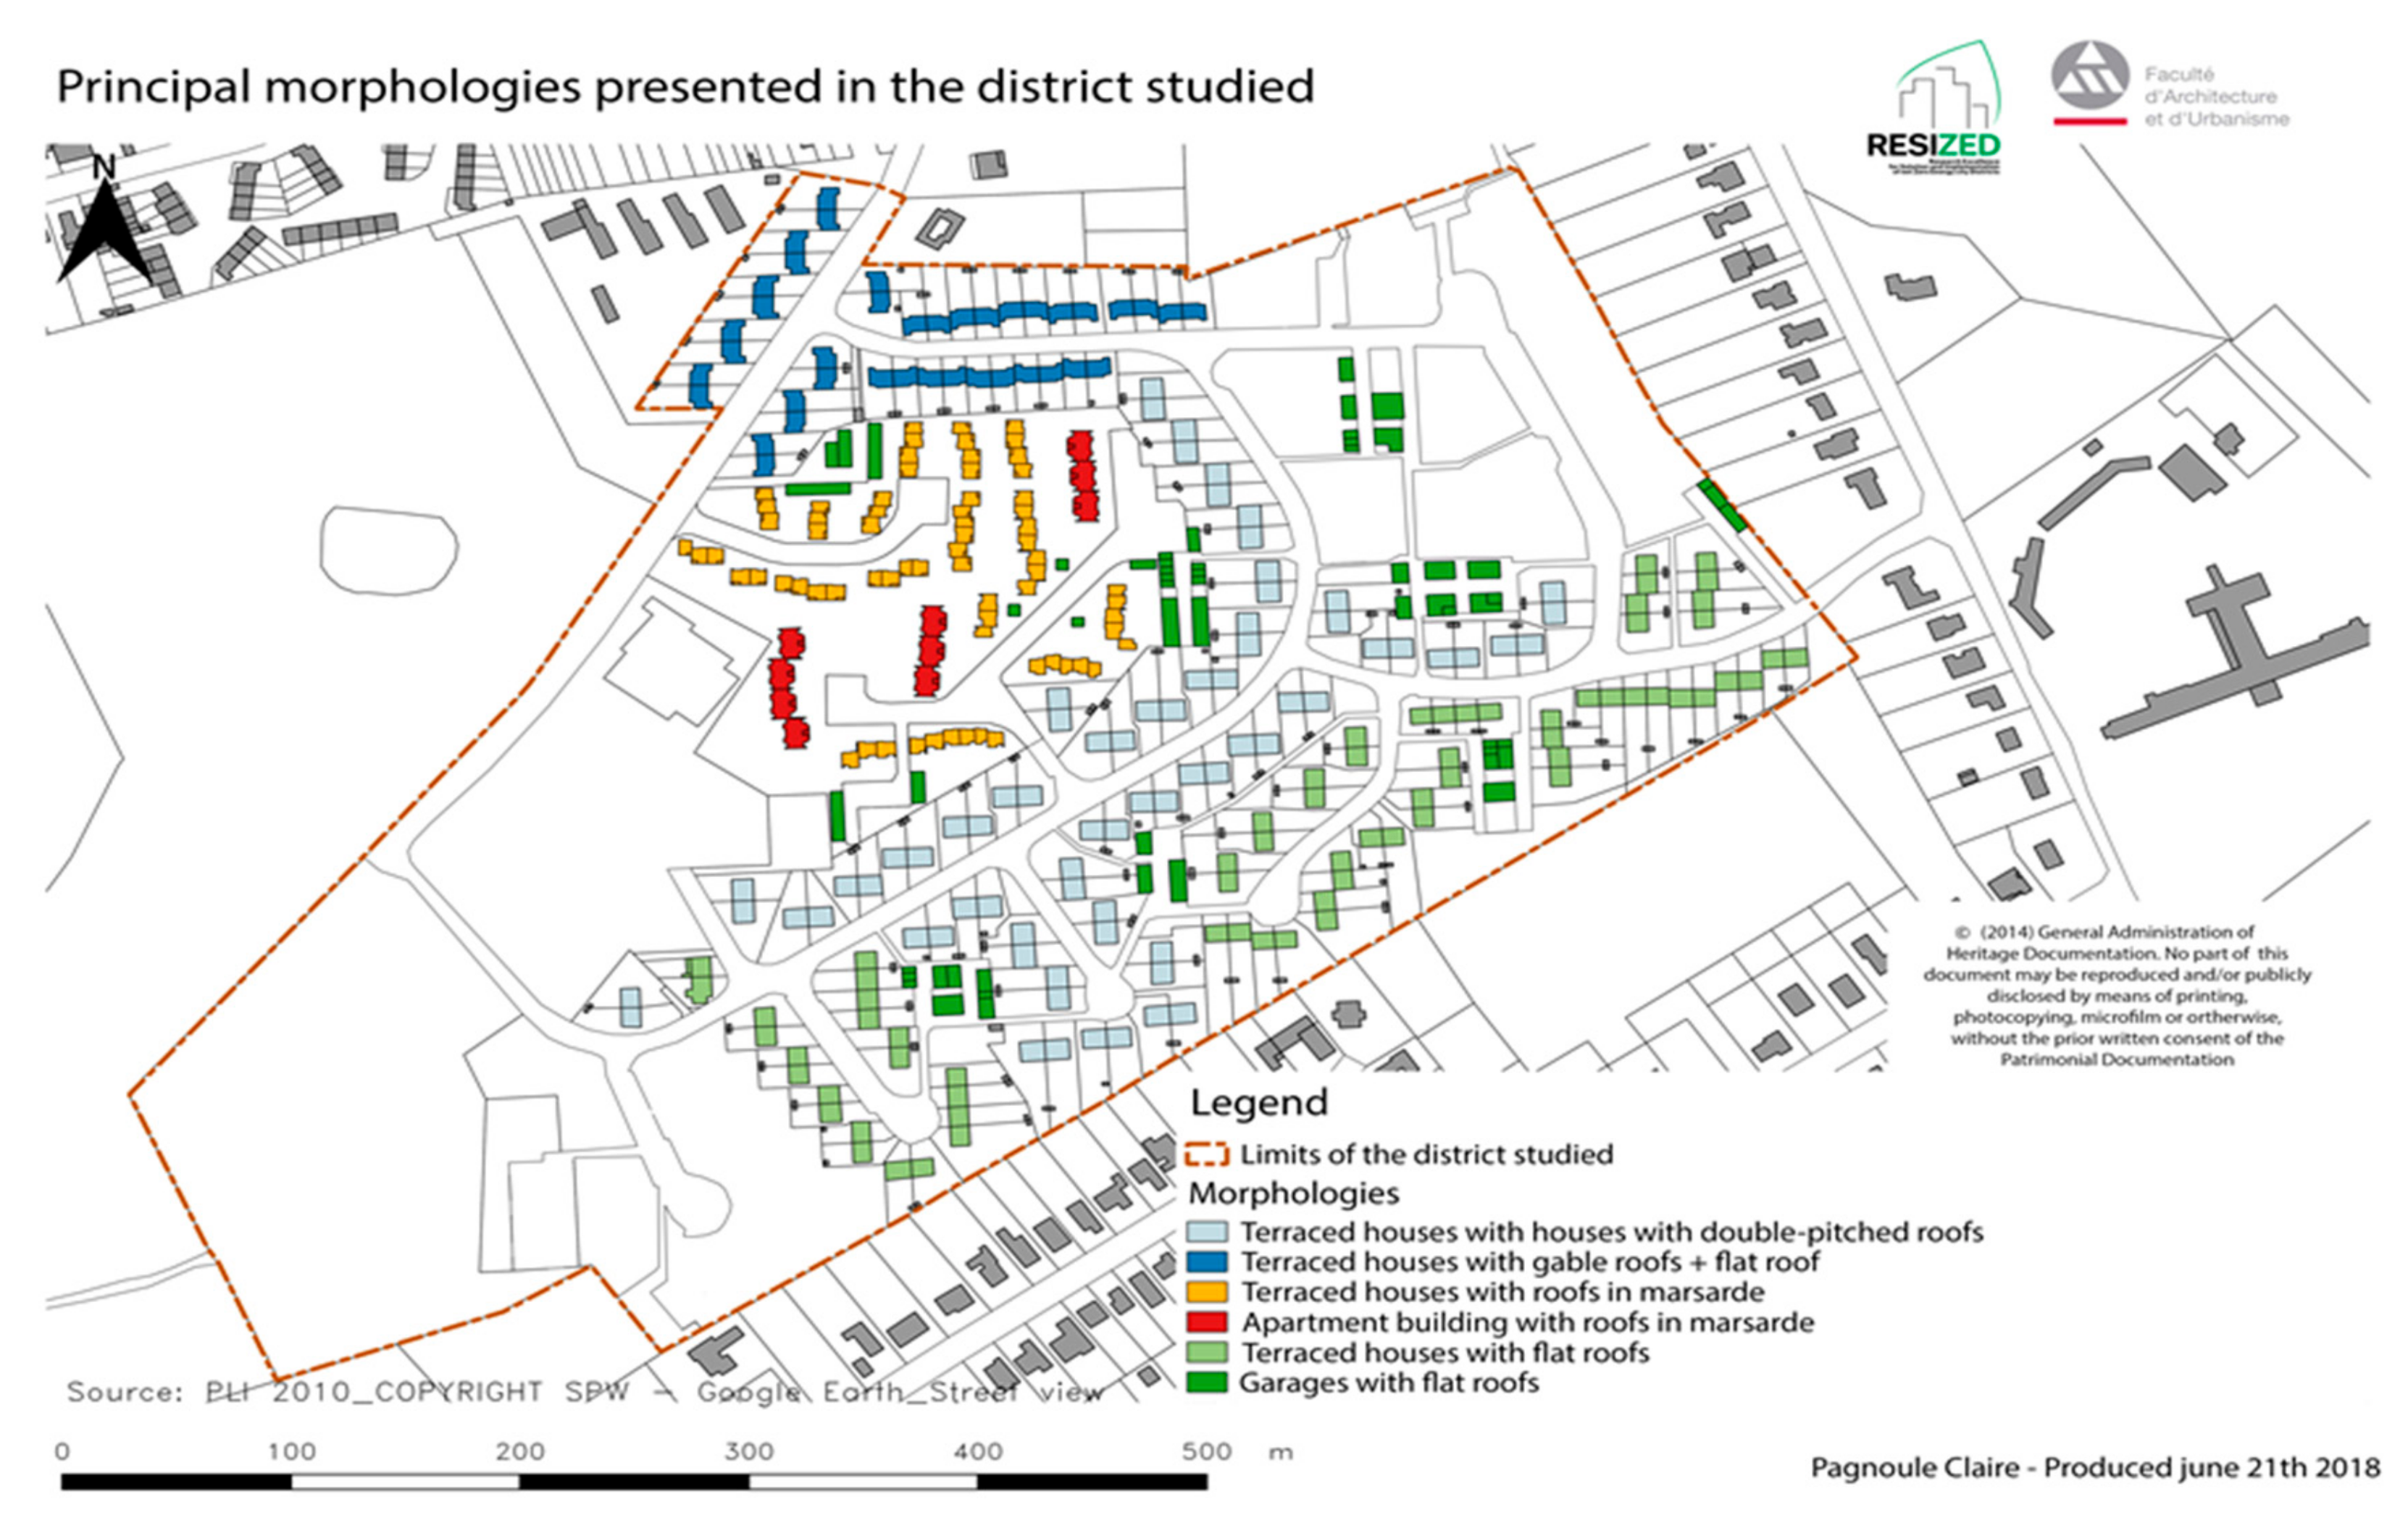
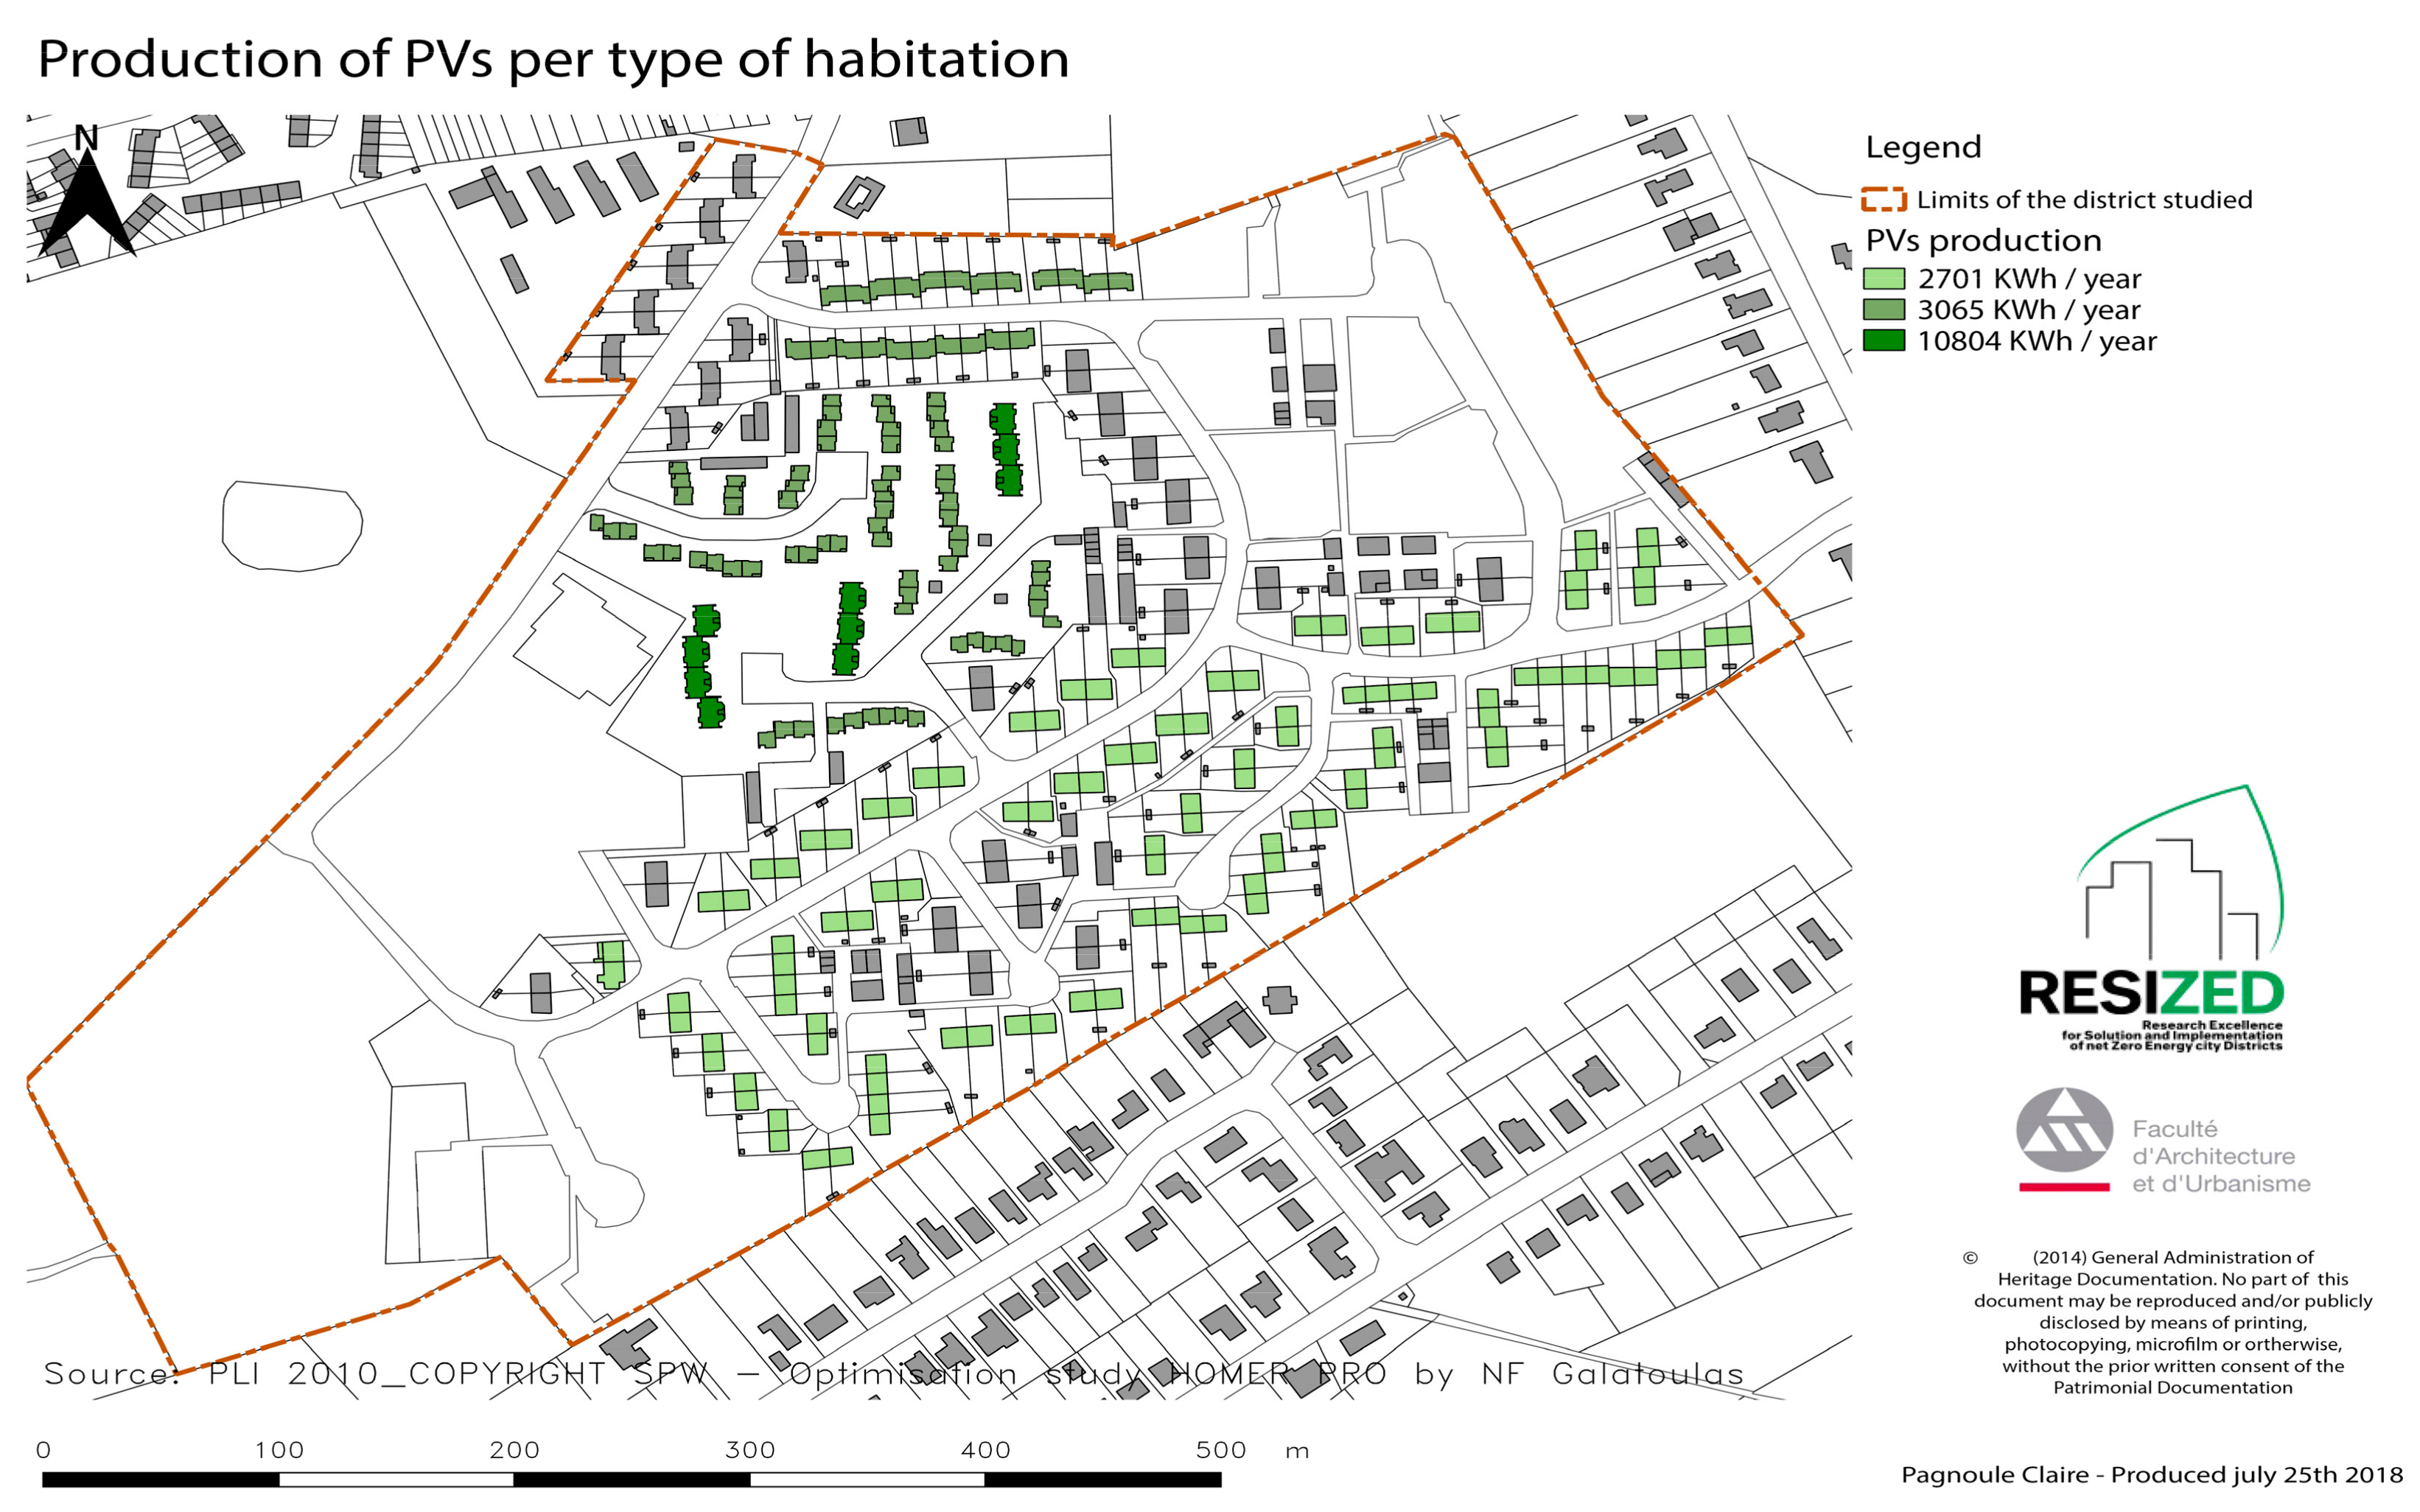
- Type 1. Terraced houses with gabled roofs (74 dwellings);
- Type 2. Terraced houses with flat roofs (70 dwellings);
- Type 3. Terraced houses with gabled roofs and parking (40 dwellings);
- Type 4. Terraced houses with mansard roofs (70 dwellings);
- Type 5. Apartments (10 blocks).
4.4. Transition to the Zero-Energy Objectives
5. Conclusions
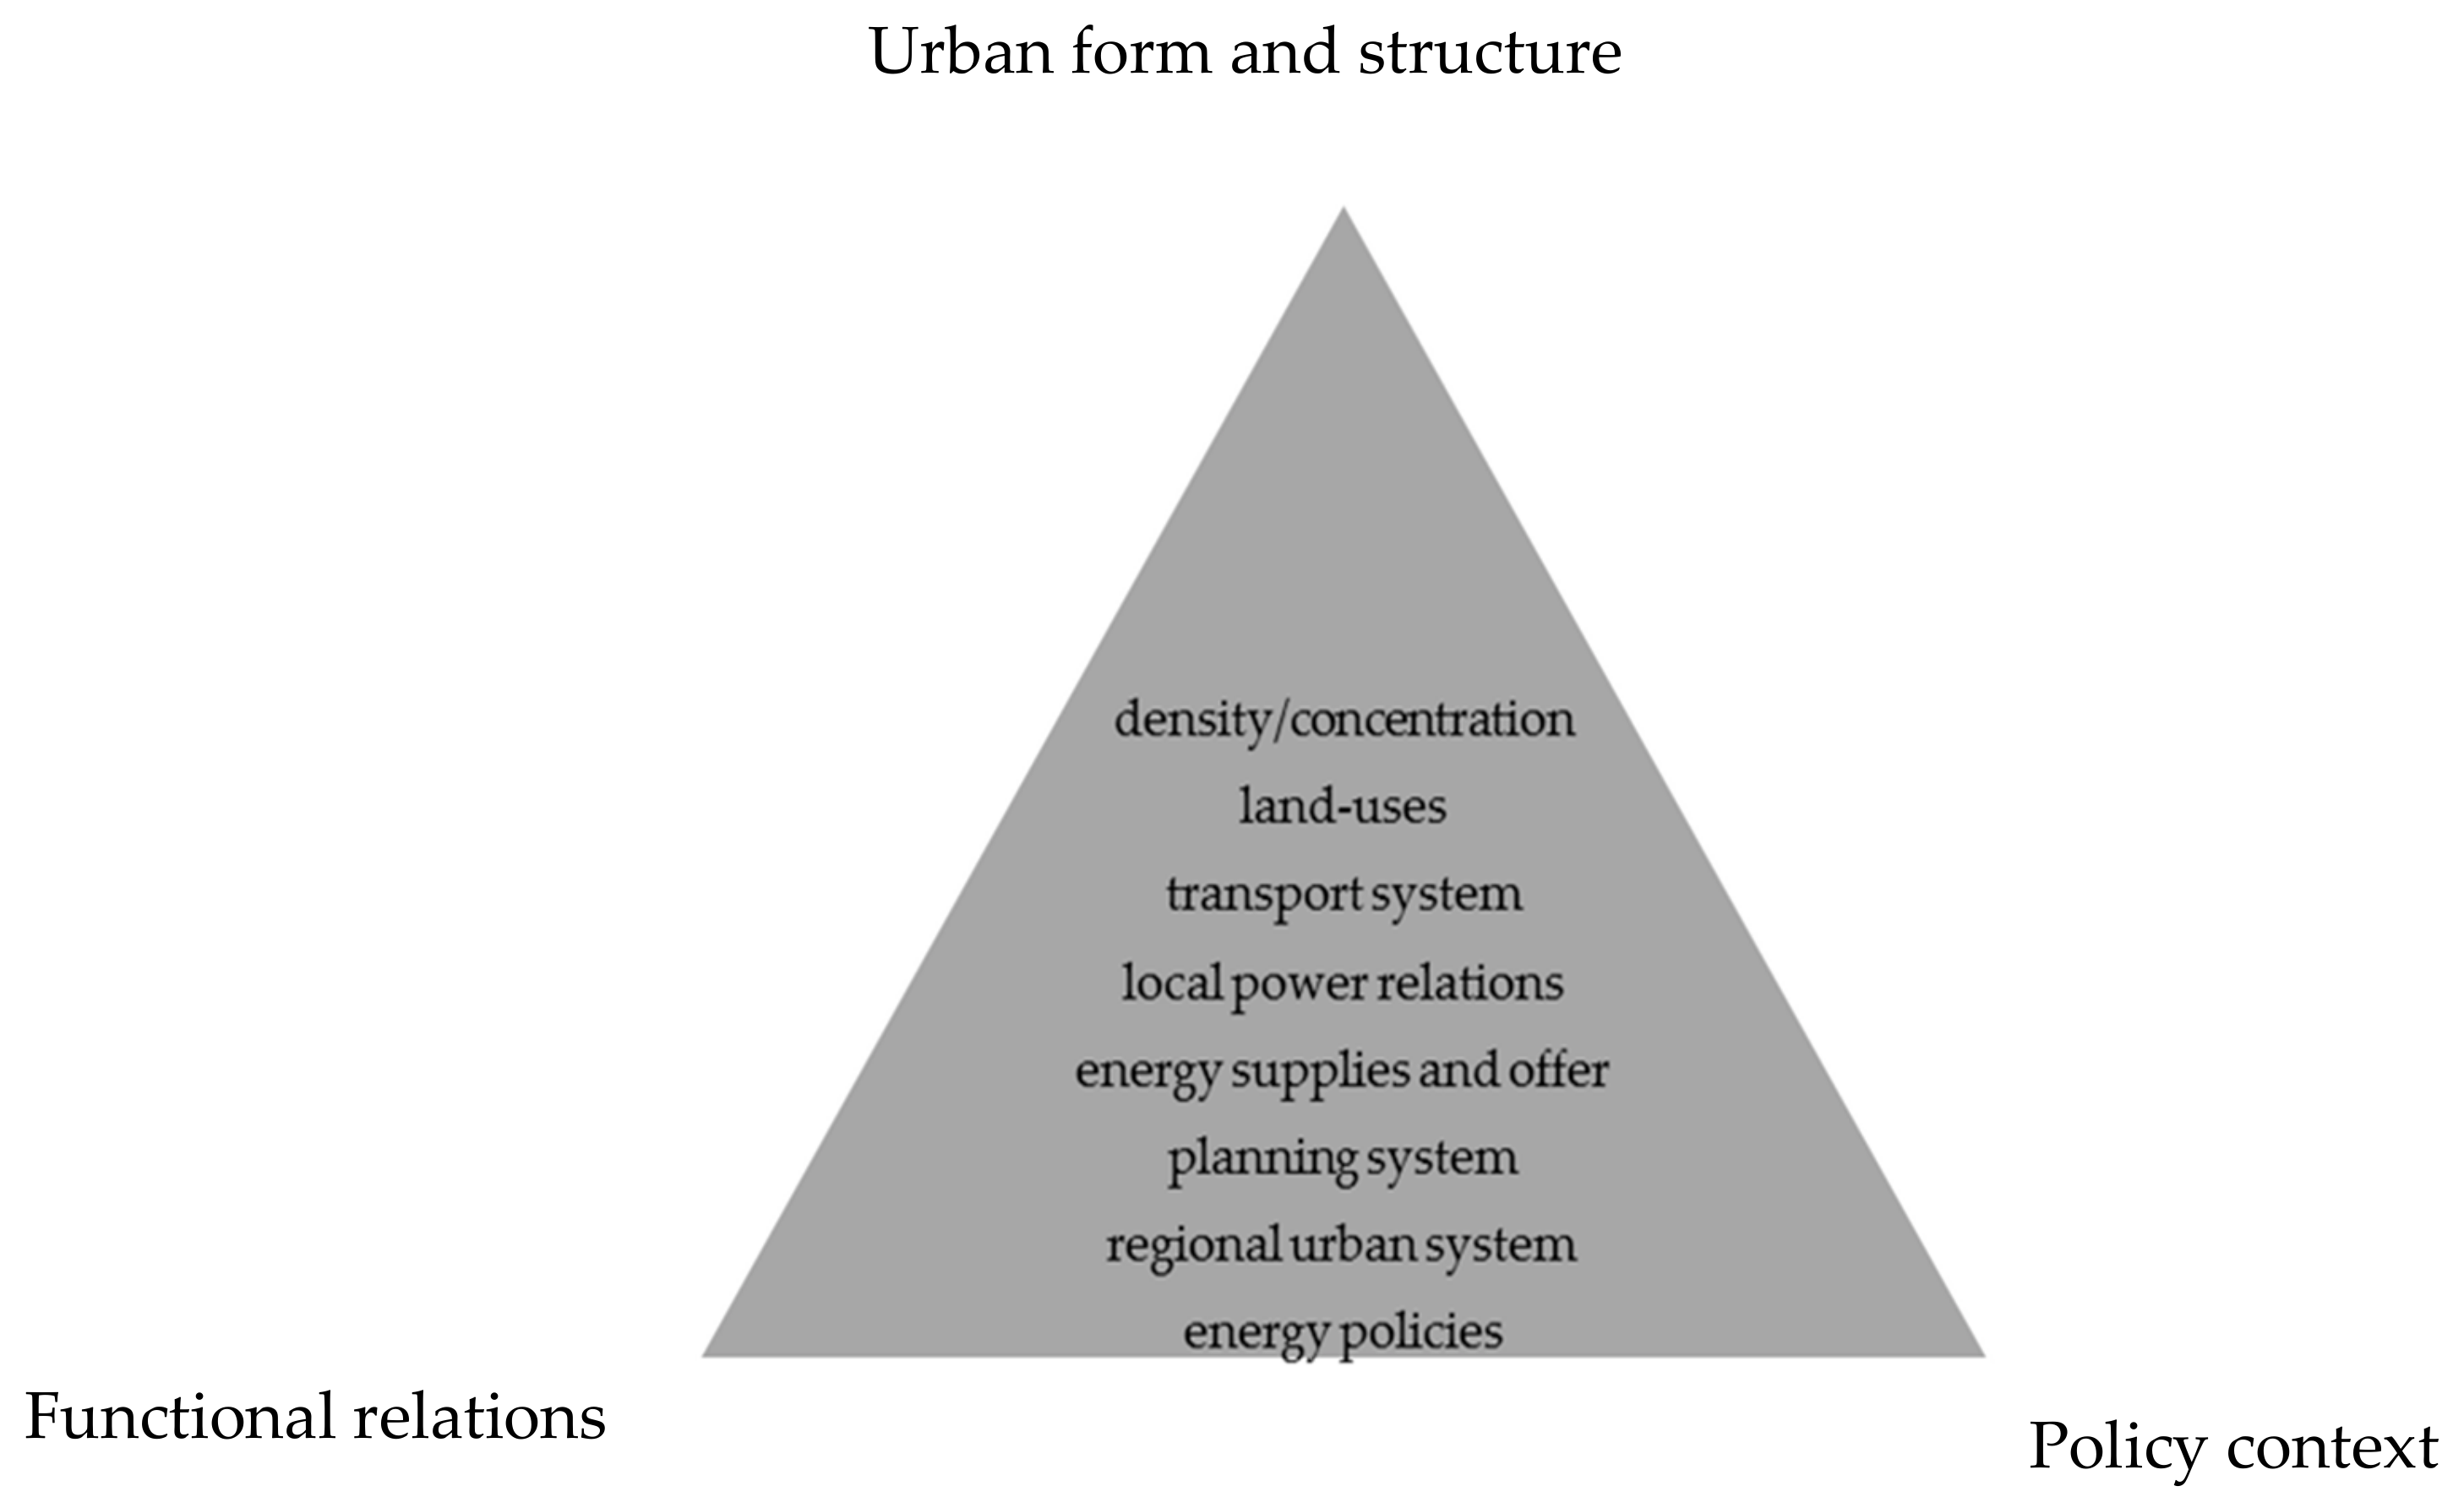
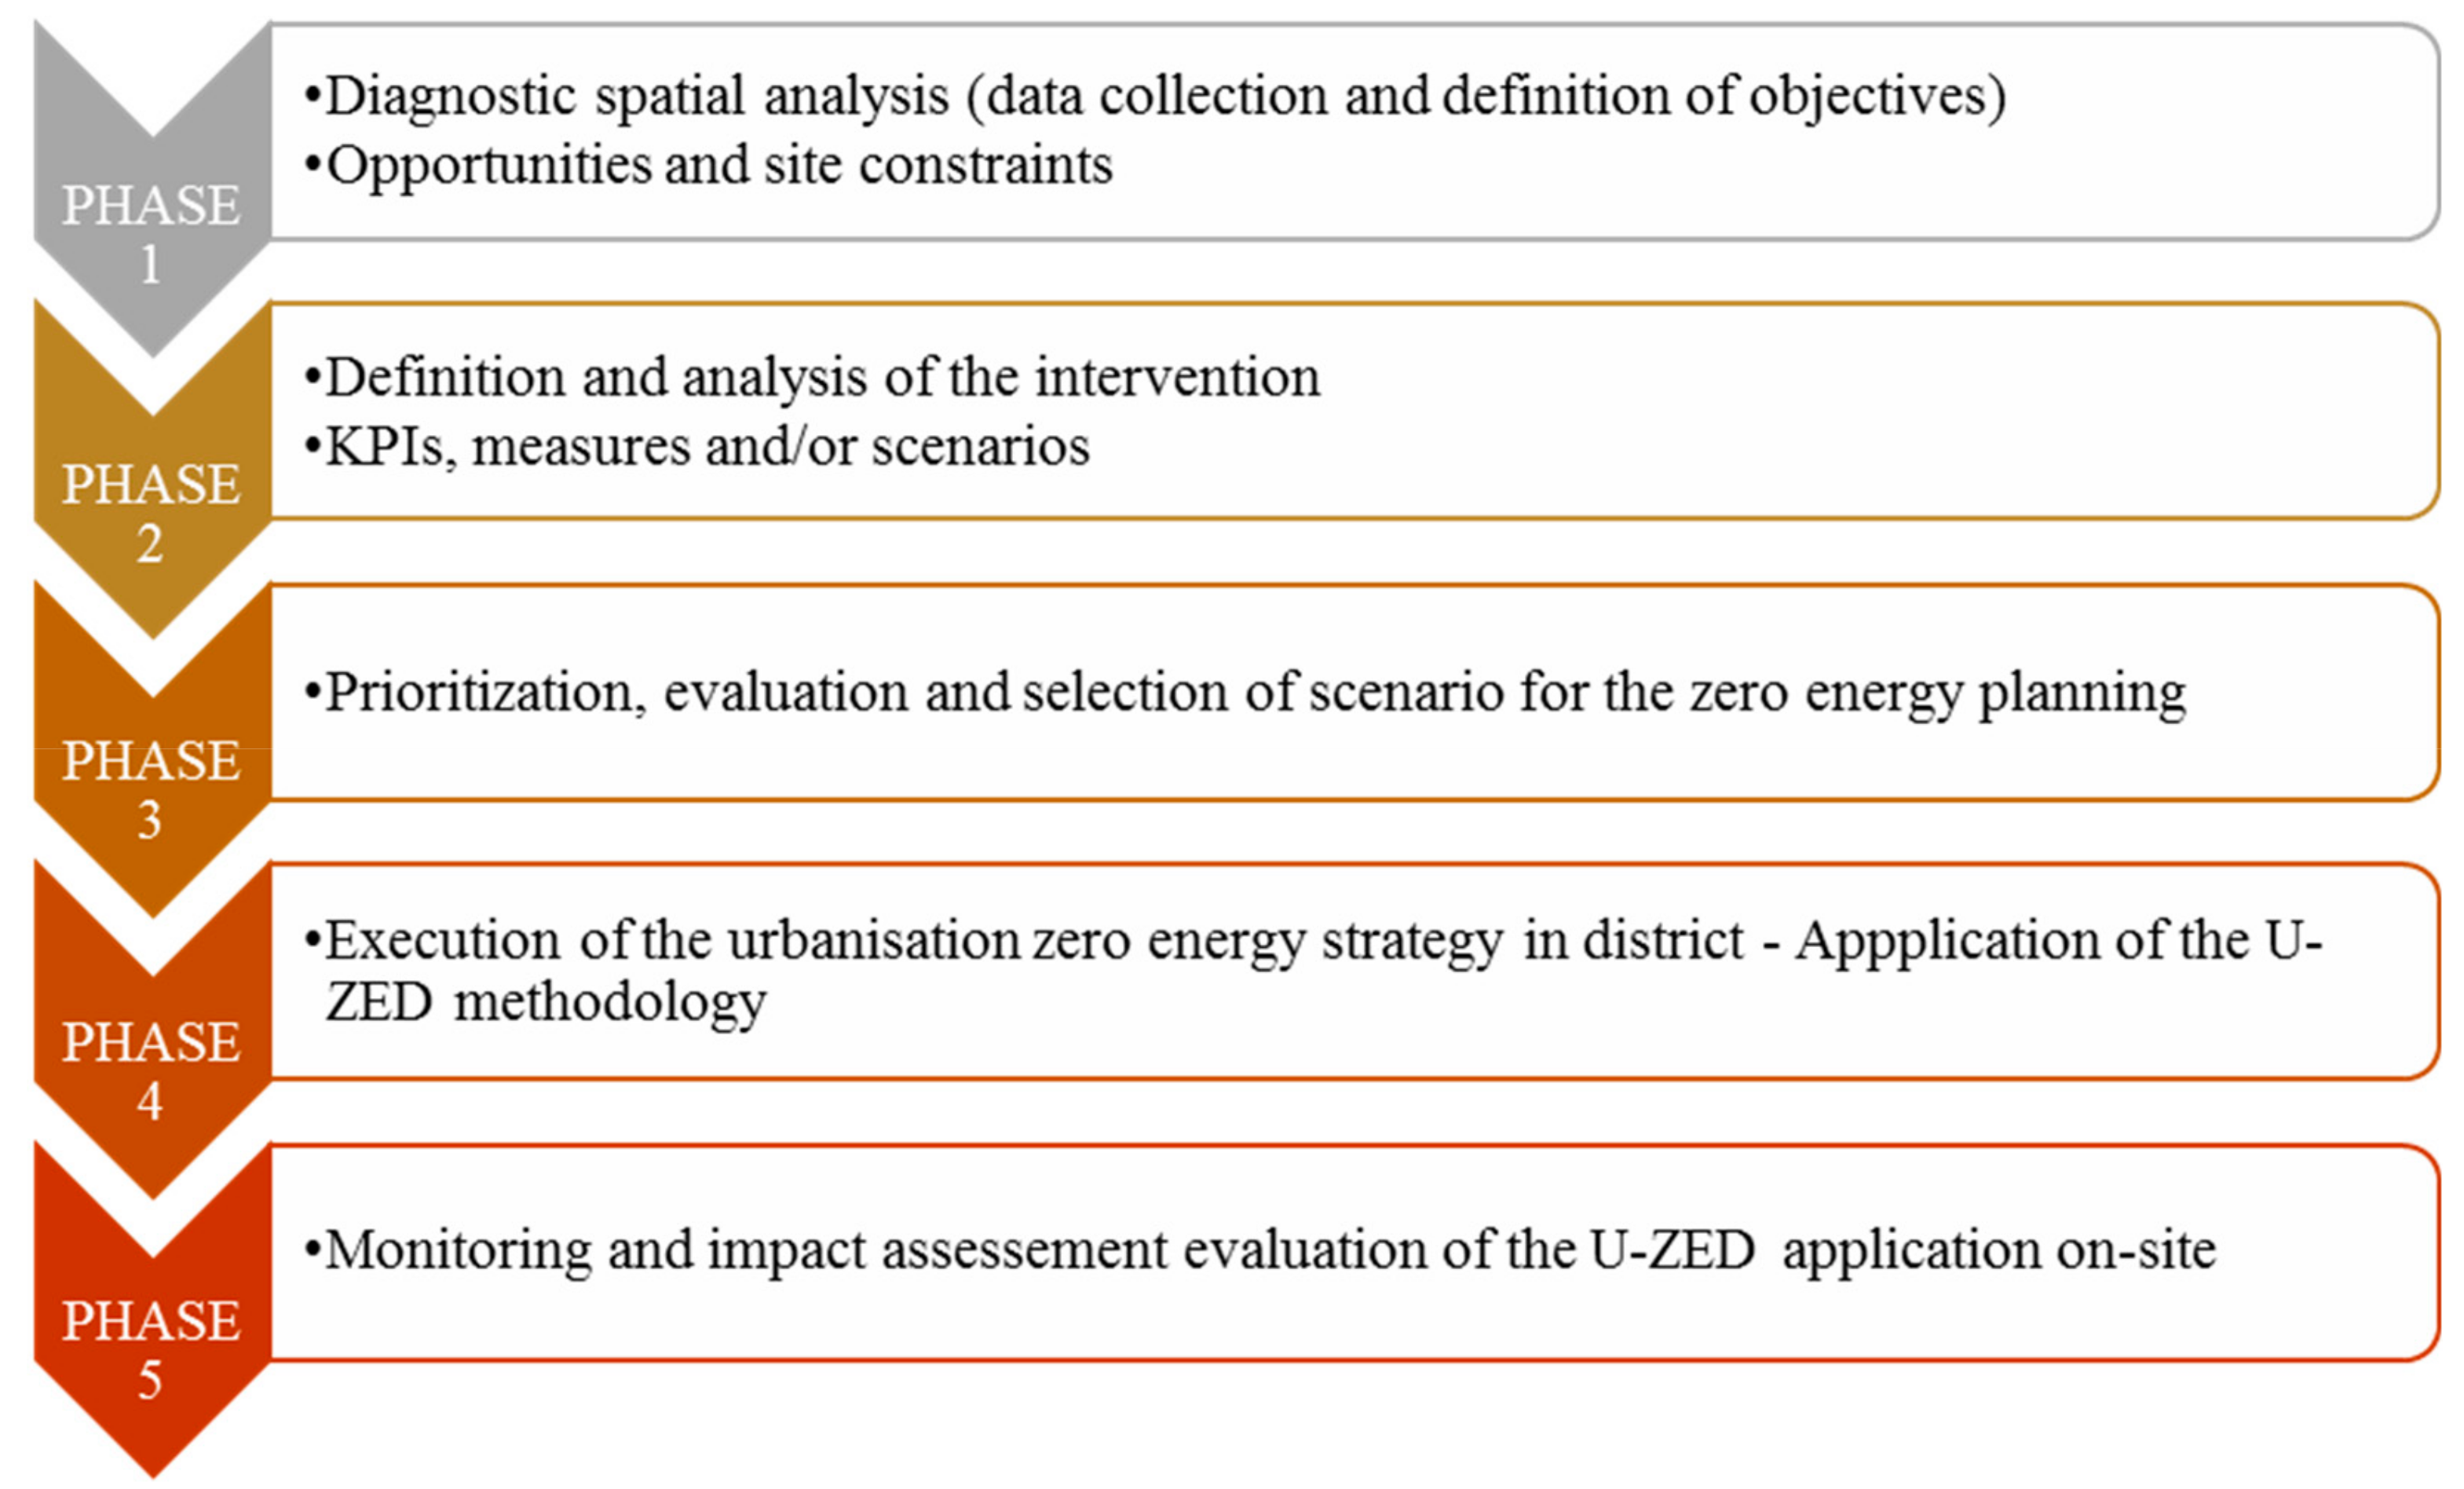
- Phase 1. Diagnosis and assessment of the current (actual) situation: We defined the geographical location of the district (perimeter of the district/research limits, location with regard to its surroundings in the city of Mons and in other districts, etc.). At this phase, we defined the spatial organization of the existing district and studied the site opportunities with respect to the potential energy inventory, the weather conditions, the natural resources for its “transition” to the zero-energy objectives, etc.;
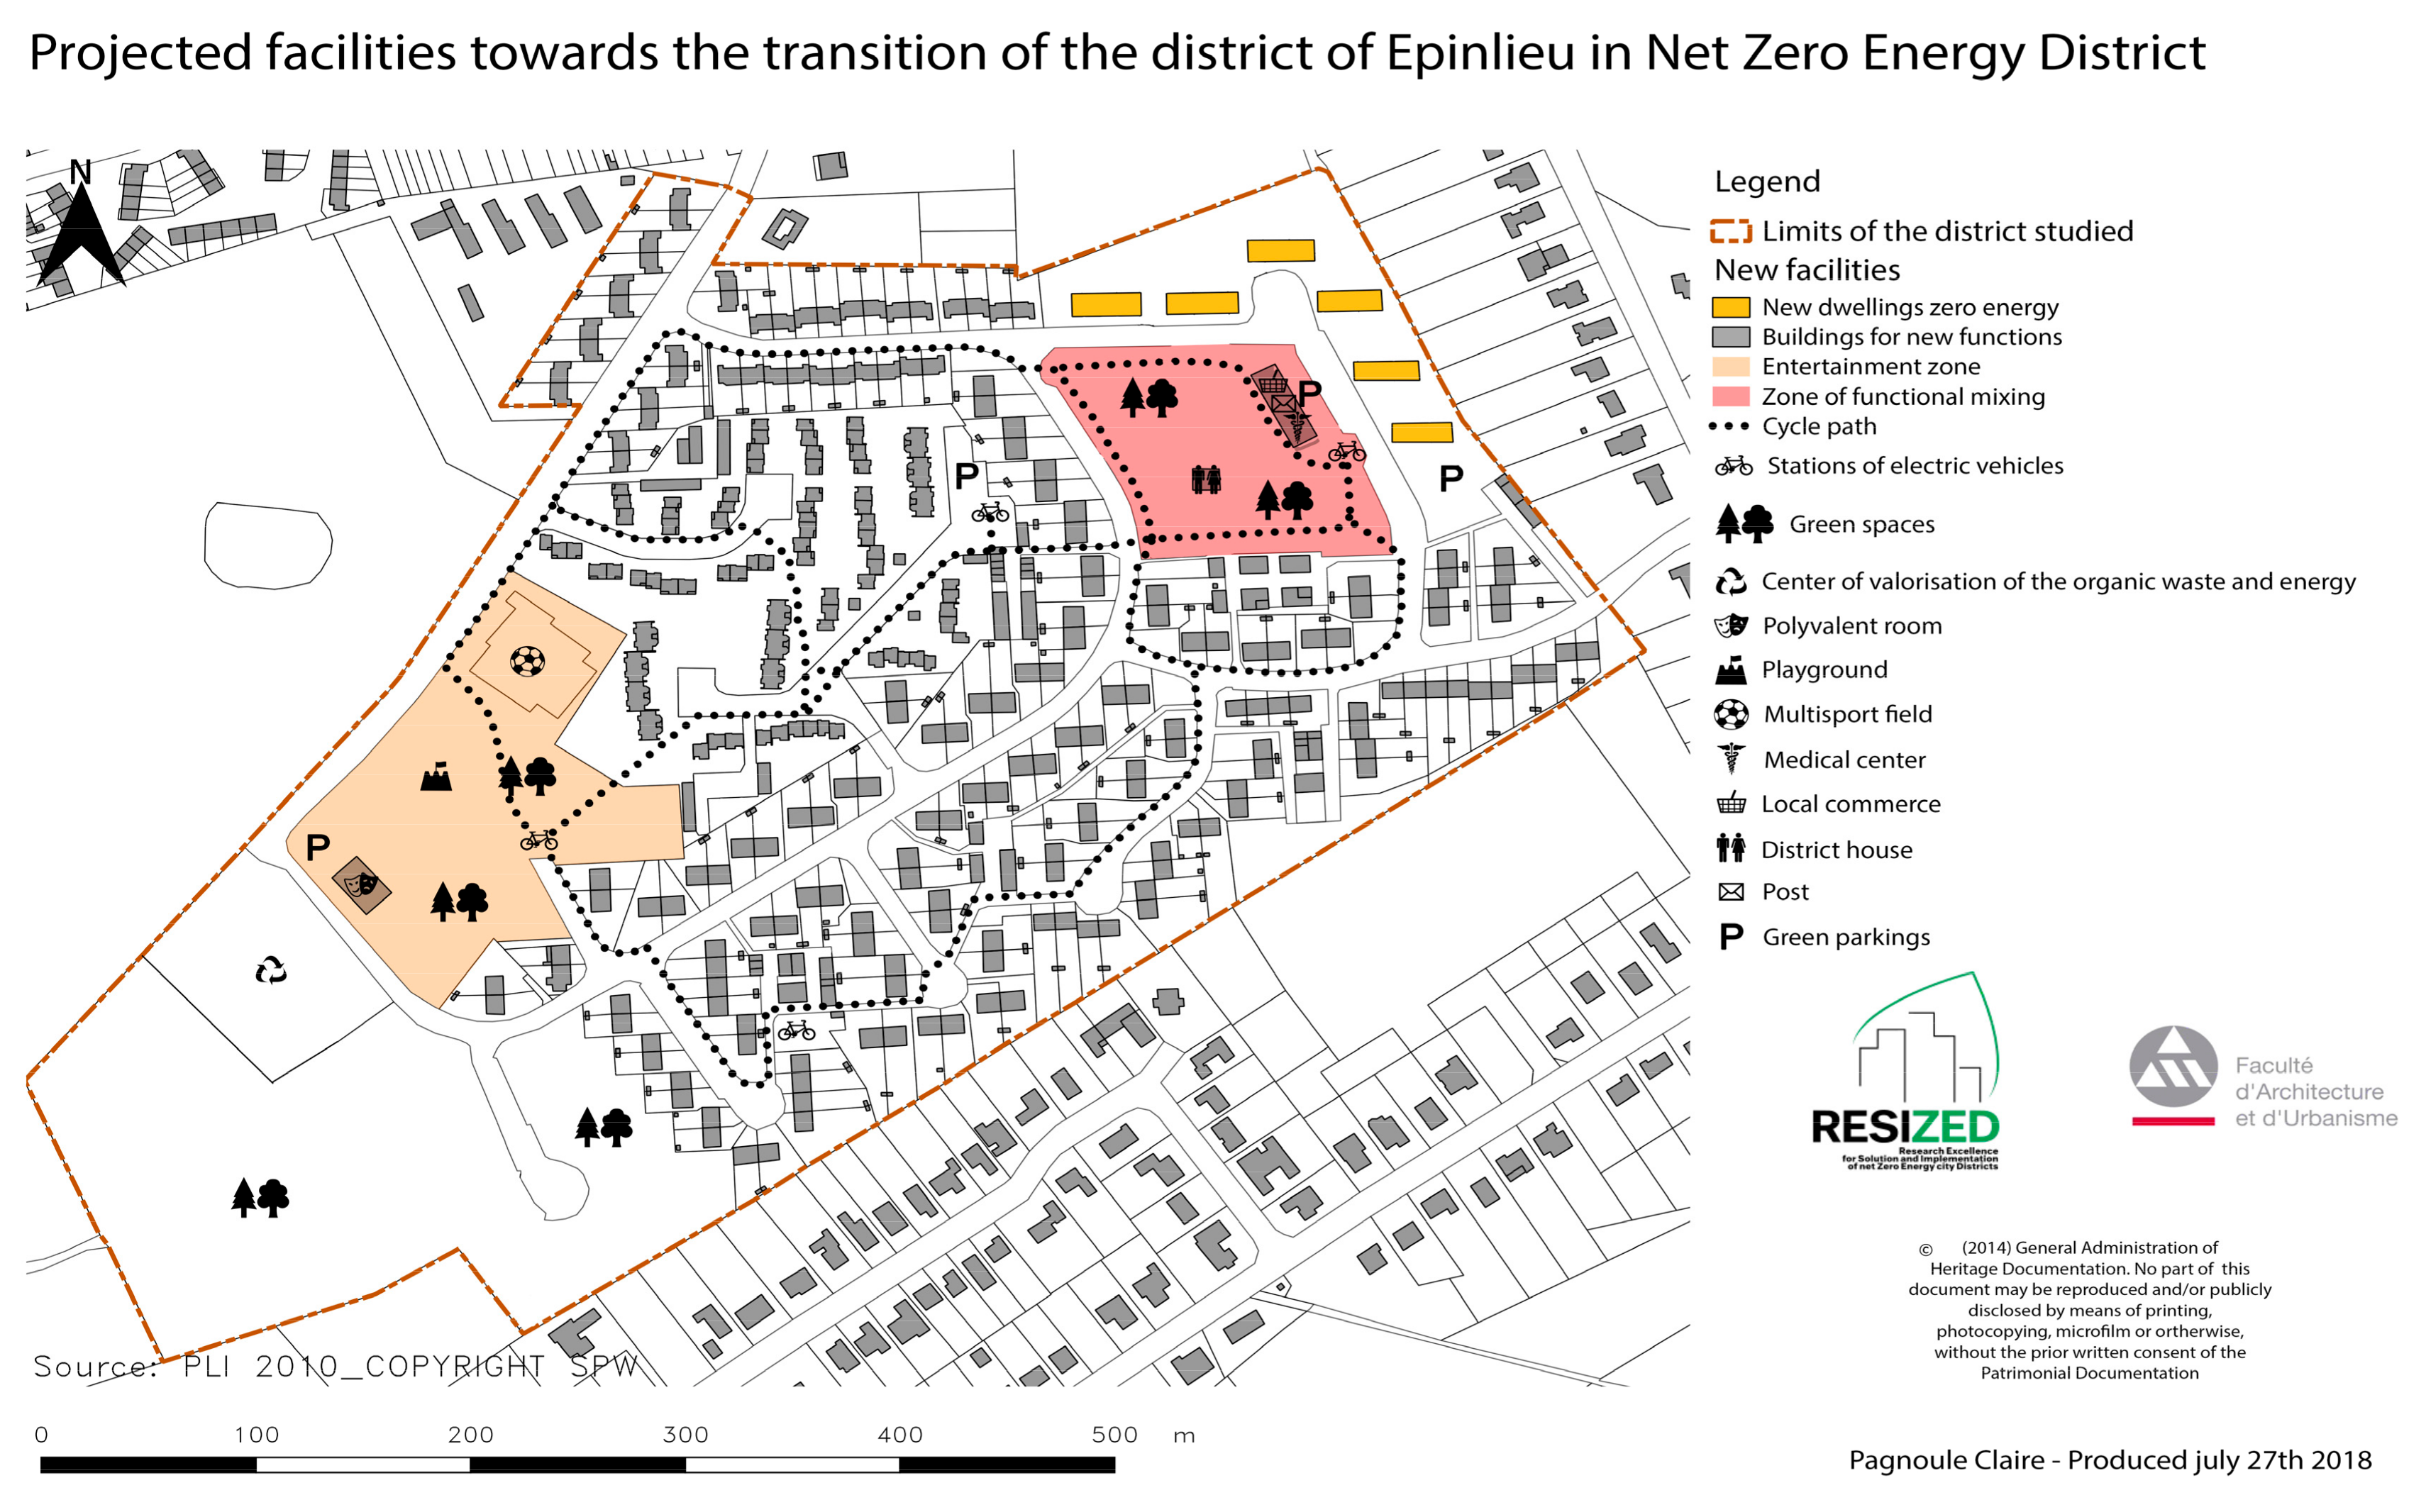
- Phase 2. The problem of “geographical location”: Is Epinlieu “smartly” located or not? The district is situated 2.5 km from the center of Mons with a good proximity to services in its surroundings, and it is well connected by sustainable means of transport. The study of the district’s transition recommends improvements in bus frequency as well as the introduction of bicycles as a soft mobility measure by constructing cycle paths, which would also support electric bicycles and the installation of stations serving the district. The district was developed for military service requirements with limited functional mixing (residential), but its strategic location is a key factor for the enhancement of its future attractiveness;
- Phase 3. This was the analysis of the three pillars of action via the U-ZED approach: the core of the U-ZED analysis with the study of the actual situation with respect to the current energy demand (users’ requirements), taking into account the site opportunities and the possibilities for energy storage. In the case of Epinlieu, the analysis revealed a lack of valid data, e.g., for the approximations of the energy produced on-site. To solve this, we developed methodological assumptions and scenarios with the use of existing tools to identify the energy demand (method of degree days; etc.). With regard to the district’s offerings and opportunities for energy inventory, we were limited only in solar energy: this is the main reason why we propose (at the phase of the district’s transition) technologies and systems around the exploitation of solar energy, e.g., photovoltaic panels.
- Building typology. This was a typo-morphological analysis of the existing building stock in the district of Epinlieu. As presented previously, five typologies are “met” in the district, with an interesting diversity in architectural and construction design and physical composition. The analysis also included the criterion of roof orientation to define the possibilities of the angles maximizing solar gain for the possibility of installing PVs. The criterion of compactness was not studied in an in-depth analysis, but only with respect to the diverse typologies in the district;
- Functions. The criterion of functional mixing was part of the analysis of the current situation in the district of Epinlieu. The analysis revealed the problems of a residential district without diversity in complementary activities for its users, e.g., in commerce, offices, or other services or infrastructure;
- Density. The criterion of density was not studied in the current analysis.
Author Contributions
Funding
Conflicts of Interest
Nomenclature
| EU | European Union |
| MS | Member state |
| GHGs (emissions) | Greenhouse gases (emissions) |
| NZED | Net-zero-energy district |
| U-ZED | Urban zero-energy district |
| KPIs | Key performance indicators |
| GDP | Gross domestic product |
| CERTU | Centre d’Etudes sur les Réseaux, les Transports, l’Urbanisme, et les Constructions Publiques |
| ZEB | Zero-energy building |
| NZEB | Net-zero-energy building |
| EPBD | European Performance of Buildings Directive |
| GIS | Geographical information system |
| HOMER | Hybrid optimization model for electric renewables |
| NPC | Net present cost |
| CoE | Cost of energy |
Appendix A. Analysis of Heating Energy Requirements in the District of Epinlieu
Appendix A.1. Typo-Morphology 1: Terraced Houses with Gabled Roofs (74 Units)
| Month | Degree Days | Area of Losses(m²) | U (W/m²K) | UAmin (W/K) | Energy Demand for One Building (D1min) (KWh) | Energy Demand for All Buildings (Dtmin) (KWh) | UAmax (W/K) | Energy Demand for One Building (D1max) (KWh) | Energy Demand for All Buildings (Dtmax) (KWh) |
|---|---|---|---|---|---|---|---|---|---|
| January | 436 | 262.6 | 0.44 | 92.36 | 966.36 | 71510.49 | 138.53 | 1449.54 | 107265.73 |
| February | 544 | 1205.73 | 89224.09 | 1808.60 | 133836.14 | ||||
| March | 457 | 1012.90 | 74954.80 | 1519.35 | 112432.20 | ||||
| April | 228 | 505.34 | 37395.39 | 758.01 | 56093.09 | ||||
| May | 149 | 330.25 | 24438.22 | 495.37 | 36657.33 | ||||
| June | 96 | 212.78 | 15745.43 | 319.16 | 23618.14 | ||||
| July | 78 | 172.88 | 12793.16 | 259.32 | 19189.74 | ||||
| August | 85 | 188.40 | 13941.26 | 282.59 | 20911.90 | ||||
| September | 185 | 410.04 | 30342.75 | 615.06 | 45514.13 | ||||
| October | 214 | 474.31 | 35099.18 | 711.47 | 52648.78 | ||||
| November | 397 | 879.92 | 65113.91 | 1319.88 | 97670.86 | ||||
| December | 474 | 1050.58 | 77743.05 | 1575.87 | 116614.58 | ||||
| Total | 7409.48 | 548301.74 | 11114.22 | 822452.61 |
| Explanations |  |
| UAmin = 0.8 * U * S | |
| UAmax = 1.2 * U *S | |
| D1min = (UAmin * Degree Days * 24)/1000 | |
| D1tmin = Number of units * D1min | |
| D1max = (UAmax * Degree Days * 24)/1000 | |
| D1tmax = Number of units * D1max |

Appendix A.2. Typo-Morphology 2: Terraced Houses with Flat Roofs (70 Units)
| Month | Degree Days | Area of Losses (m²) | U (W/m²K) | UAmin (W/K) | Energy Demand for One Building (D1min) (KWh) | Energy Demand for All Buildings (Dtmin) (KWh) | UAmax (W/K) | Energy Demand for One Building (D1max) (KWh) | Energy Demand for All Buildings (Dtmax) (KWh) |
|---|---|---|---|---|---|---|---|---|---|
| January | 436 | 233.38 | 0.41 | 76.55 | 801.00 | 56070.35 | 114.82 | 1201.51 | 84105.52 |
| February | 544 | 999.42 | 69959.33 | 1499.13 | 104939.00 | ||||
| March | 457 | 839.59 | 58770.98 | 1259.38 | 88156.48 | ||||
| April | 228 | 418.87 | 29321.19 | 628.31 | 43981.79 | ||||
| May | 149 | 273.74 | 19161.66 | 410.61 | 28742.48 | ||||
| June | 96 | 176.37 | 12345.76 | 264.55 | 18518.65 | ||||
| July | 78 | 143.30 | 10030.93 | 214.95 | 15046.40 | ||||
| August | 85 | 156.16 | 10931.15 | 234.24 | 16396.72 | ||||
| September | 185 | 339.88 | 23791.32 | 509.81 | 35686.98 | ||||
| October | 214 | 393.15 | 27520.77 | 589.73 | 41281.15 | ||||
| November | 397 | 729.36 | 51054.88 | 1094.03 | 76582.32 | ||||
| December | 474 | 870.82 | 60957.21 | 1306.23 | 91435.82 | ||||
| Total | 6141.65 | 429915.53 | 9212.48 | 644873.30 |
| Explanations |  |
| UAmin = 0,8 * U * S | |
| UAmax = 1,2 * U * S | |
| D1min = (UAmin X Degree Days * 24)/1000 | |
| D1tmin = Number of units * D1min | |
| D1max = (UAmax *Degree Days * 24)/1000 | |
| D1tmax = Number of units * D1max |

Appendix A.3. Typo-Morphology 3: Terraced Houses with Gabled Roofs and Parking (40 Units)
| Month | Degree Days | Area of Losses (m²) | U (W/m²K) | UAmin (W/K) | Energy Demand for One Building (D1min) (KWh) | Energy Demand for All Buildings (Dtmin) (KWh) | UAmax (W/K) | Energy Demand for One Building (D1max) (KWh) | Energy Demand for One Building (Dtmax) (KWh) |
|---|---|---|---|---|---|---|---|---|---|
| January | 436 | 266.2 | 0.77 | 163,98 | 1715.88 | 68635.13 | 245.97 | 2573.82 | 102952.70 |
| February | 544 | 2140.91 | 85636.50 | 3211.37 | 128454.75 | ||||
| March | 457 | 1798.52 | 71940.95 | 2697.79 | 107911.43 | ||||
| April | 228 | 897.29 | 35891.77 | 1345.94 | 53837.65 | ||||
| May | 149 | 586.39 | 23455.58 | 879.58 | 35183.38 | ||||
| June | 96 | 377.81 | 15112.32 | 566.71 | 22668.48 | ||||
| July | 78 | 306.97 | 12278.76 | 460.45 | 18418.14 | ||||
| August | 85 | 334.52 | 13380.70 | 501.78 | 20071.05 | ||||
| September | 185 | 728.07 | 29122.71 | 1092.10 | 43684.06 | ||||
| October | 214 | 842.20 | 33687.89 | 1263.30 | 50531.83 | ||||
| November | 397 | 1562.39 | 62495.75 | 2343.59 | 93743.63 | ||||
| December | 474 | 1865.43 | 74617.10 | 2798.14 | 111925.64 | ||||
| Total | 13156.38 | 526255.17 | 19734.57 | 789382.75 |
| Explanations |  |
| UAmin = 0,8 * U * S | |
| UAmax = 1,2 * U * S | |
| D1min = (UAmin X Degree Days * 24)/1000 | |
| D1tmin = Number of units * D1min | |
| D1max = (UAmax * Degree Days * 24)/1000 | |
| D1tmax = Number of units * D1max |

Appendix A.4. Typo-Morphology 4: Terraced Houses with Mansard Roofs (70 Units)
| Month | Degree Days | Area of Losses (m²) | U (W/m²K) | UAmin (W/K) | Energy Demand for One Building (D1min) (KWh) | Energy Demand for All Buildings (Dtmin) (KWh) | UAmax (W/K) | Energy Demand for 1 Building (D1max) (KWh) | Energy Demand for All Buildings (Dtmax) (KWh) |
|---|---|---|---|---|---|---|---|---|---|
| January | 436 | 213.56 | 1.33 | 227.23 | 2377.71 | 166439.85 | 340.84 | 3566.57 | 249659.77 |
| February | 544 | 2966.69 | 207668.07 | 4450.03 | 311502.10 | ||||
| March | 457 | 2492.23 | 174456.45 | 3738.35 | 261684.67 | ||||
| April | 228 | 1243.39 | 87037.35 | 1865.09 | 130556.03 | ||||
| May | 149 | 812.57 | 56879.67 | 1218.85 | 85319.51 | ||||
| June | 96 | 523.53 | 36647.31 | 785.30 | 54970.96 | ||||
| July | 78 | 425.37 | 29775.94 | 638.06 | 44,663.90 | ||||
| August | 85 | 463.54 | 32448.14 | 695.32 | 48672.20 | ||||
| September | 185 | 1008.89 | 70622.41 | 1513.34 | 105933.62 | ||||
| October | 214 | 1167.04 | 81692.95 | 1750.56 | 122539.43 | ||||
| November | 397 | 2165.03 | 151551.88 | 3247.54 | 227327.82 | ||||
| December | 474 | 2584.94 | 180946.07 | 3877.42 | 271419.11 | ||||
| Total | 18230.94 | 1276166.08 | 27346.42 | 1914249.13 |
| Explanations |  |
| UAmin = 0,8 * U * S | |
| UAmax = 1,2 * U * S | |
| D1min = (UAmin * Degree Days * 24)/1000 | |
| D1tmin = Number of units X D1min | |
| D1max = (UAmax * Degree Days * 24)/1000 | |
| D1tmax = Number of units * D1max |

Appendix A.5. Typo-Morphology 5: Apartments (10 Units)
| Month | Degree Days | Area of Losses (m2) | U (W/m2K) | UAmin (W/K) | Energy Demand for One Building (D1min) (KWh) | Energy Demand for One Building (Dtmin) (KWh) | UAmax (W/K) | Energy Demand for One Building (D1max) (KWh) | Energy Demand for One Building (Dtmax) (KWh) |
|---|---|---|---|---|---|---|---|---|---|
| January | 436 | 742.28 | 1.70 | 1009.5 | 10563.42 | 105634.16 | 1514.25 | 15845.12 | 158451.25 |
| February | 544 | 13180.04 | 131800.42 | 19770.06 | 197700.64 | ||||
| March | 457 | 11072.20 | 110722.05 | 16608.31 | 166083.07 | ||||
| April | 228 | 5523.99 | 55239.88 | 8285.98 | 82859.83 | ||||
| May | 149 | 3609.97 | 36099.75 | 5414.96 | 54149.62 | ||||
| June | 96 | 2325.89 | 23258.90 | 3488.83 | 34888.35 | ||||
| July | 78 | 1889.79 | 18897.85 | 2834.68 | 28346.78 | ||||
| August | 85 | 2059.38 | 20593.82 | 3089.07 | 30890.72 | ||||
| September | 185 | 4482.18 | 44821.84 | 6723.28 | 67232.75 | ||||
| October | 214 | 5184.80 | 51847.96 | 7777.19 | 77771.94 | ||||
| November | 397 | 9618.52 | 96185.24 | 14427.79 | 144277.85 | ||||
| December | 474 | 11484.08 | 114840.81 | 17226.12 | 172261.22 | ||||
| Total | 80994.27 | 809942.68 | 121491.40 | 1214914.02 |
| Explanations |  |
| UAmin = 0,8 * U* S | |
| UAmax = 1,2 * U* S | |
| D1min = (UAmin * Degree Days * 24)/1000 | |
| D1tmin = Number of units * D1min | |
| D1max = (UAmax * Degree Days * 24)/1000 | |
| D1tmax = Number of units * D1max |

References
- Girarbet, H. Creating Regenerative Cities, 1st ed.; Routledge: Abingdon, UK, 2015. [Google Scholar]
- Große, J.; Fertner, C.; Groth, N. Urban Structure, Energy and Planning: Findings from Three Cities in Sweden, Finland and Estonia. Urban Plan. 2016, 1, 24–40. [Google Scholar] [CrossRef] [Green Version]
- Owens, S. Energy, Planning and Urban Form; Pion Ltd: London, UK, 1986. [Google Scholar]
- Salat, S. Energy loads, CO2 emissions and building stocks: Morphologies, typologies, energy systems and behaviour. Build. Res. Inf. 2009, 37, 598–609. [Google Scholar]
- Ewing, F.; Rong, R. The Impact of Urban Form on U.S. Residential Energy Use. Hous. Policy Debate 2008, 19, 1–30. [Google Scholar]
- Urquizo, J.; Calderon, C.; James, P. Energy Research & Social Science Metrics of urban morphology and their impact on energy consumption: A case study in the United Kingdom. Chem. Phys. Lett. 2017, 32, 193–206. [Google Scholar]
- Baker, N.; Steemers, K. Energy and Environment in Architecture: A Technical Design Guide; Taylor & Francis: Abingdon, UK, 2000. [Google Scholar]
- Miller, N. Urban Form and Building Energy: Quantifying Relationships Using a Multi-Scale Approach; University of British Columbia: Vancouver, BC, Canada, 2013. [Google Scholar]
- Mitchell, G. Urban Development, Form and Energy Use in Buildings: A Review for the Solutions Project; EPSRC: Swindon, UK, 2005. [Google Scholar]
- Steemers, K. Energy and the city: Density, buildings and transport. Energy Build. 2003, 35, 3–14. [Google Scholar] [CrossRef]
- Sartori, I.; Napolitano, A.; Voss, K. Net zero energy buildings: A consistent definition framework. Energy Build. 2012, 48, 220–232. [Google Scholar] [CrossRef] [Green Version]
- D’Agostino, D. Assessment of the progress towards the establishment of definitions of nearly zero energy buildings (nZEBs) in European member States. J. Build. Eng. 2015, 1, 20–32. [Google Scholar] [CrossRef]
- Sartori, I.; Napolitano, A.; Marszal, A.J.; Pless, S.; Torcellini, P. Criteria for Definition of Net Zero Energy Buildings. Renew. Energy 2012, 48, 1–22. [Google Scholar]
- Torcellini, P.; Pless, S.; Deru, M.; Crawley, D. Zero Energy Buildings: A Critical Look at the Definition. In ACEEE Summer Study Pacific Grove; National Renewable Energy Lab. (NREL): Golden, CO, USA, 2006; p. 15. [Google Scholar]
- Carlisle, N.; Geet, O.; Pless, S. Definition of a ‘Zero Net Energy’ Community; National Renewable Energy Lab.(NREL): Golden, CO, USA, 2009. [Google Scholar]
- Reiter, A.; De Herde, S.; Marique, A. Projet SOLEN: SOlutions for Low Energy Neighborhoods. Un Cadre Pour la Définition du ‘Quartier Zéro Énergie’ (QZE). 2014. Available online: http://solen-energie.be (accessed on 10 January 2015).
- European Union. Concentrated Action: Energy Performance of Buildings (EPBD); European Union: Brussels, Belgium, 2010; Available online: http://www.epbd-ca.eu/ (accessed on 5 January 2015).
- Amaral, A.; Rodrigues, A.; Gaspar, E.; Gomes, A. Review on performance aspects of nearly zero energy districts. Sustain. Cities Soc. 2018, 13, 406–420. [Google Scholar]
- Ratti, C.; Baker, N.; Steemers, K. Energy consumption and urban texture. Energy Build. 2005, 37, 762–776. [Google Scholar]
- Sanaieian, H.; Tenpierik, M.; van den Linden, K.; Mehdizadeh, S.; Mofidi, S. Review of the impact of urban block form on thermal performance, solar access and ventilation. Renew. Sustain. Energy Rev. 2014, 38, 551–560. [Google Scholar] [CrossRef]
- Jenks, M.; Dempsey, N. Defining the neighbourhood: Challenges for empirical research. Town Plan. Rev. 2007, 78, 153–177. [Google Scholar] [CrossRef]
- Barton, H.; Grant, M.; Guise, R. Shaping Neighbourhoods: A Guide for Health, Sustainability and Vitality; Spon Press: London, UK, 2003. [Google Scholar]
- Pless, S.; Polly, B.; Zaleski, S. Communities of the Future: Accelerating Zero Energy District Master Planning; National Renewable Energy Lab. (NREL): Golden, CO, USA, 2018. [Google Scholar]
- Broaddus, A. Tale of Two Ecosuburbs in Freiburg, Germany: Encouraging Transit and Bicycle Use by Restricting Parking Provision. J. Transp. Res. Board 2010, 2187, 114–122. [Google Scholar] [CrossRef]
- Teller, J.; Marique, A.F.; Loiseau, V.; Godard, F.; Delbar, C. Référentiel Quartiers Durables; Université de Liège: Liège, Belgium, 2014. [Google Scholar]
- Becchio, P.; Corgnai, C.; Delmastro, S.; Fabi, C.; Lombardi, V. The role of nearly-zero energy buildings in the transition towards Post-Carbon Cities. Sustain. Cities Soc. 2016, 27, 324–337. [Google Scholar] [CrossRef]
- Kilkis, S. A Rational Exergy Management Model to Curb CO2 Emissions in the Exergy-Aware Built Environments of the Future; KTH Royal Institute of Technology School of Architecture and the Built Environment: Stockholm, Sweden, 2011. [Google Scholar]
- Haapio, A. Towards sustainable urban communities. Environ. Impact Assess. Rev. 2012, 32, 165–169. [Google Scholar] [CrossRef]
- Sun, Y.; Huang, P.; Huang, G. A multi-criteria system design optimization for net zero energy buildings under uncertainties. Energy Build. 2015, 97, 196–204. [Google Scholar]
- Ameen, R.; Mourshed, M.; Li, H. A critical review of environmental assessment tools for sustainable urban design. Environ. Impact Assess. Rev. 2015, 55, 110–125. [Google Scholar]
- Koutra, S.; Becue, V.; Ioakimidis, C.S. A Simplified Methodological Approach towards the Net Zero Energy District; Springer: Berlin, Germany, 2017; Volume 738. [Google Scholar]
- Bosch, A.; Jongeneel, P.; Rovers, S.; Neumann, V.; Airaksinen, H.; Huovila, M. CITYkeys Indicators for Smart City Projects and Smart Cities; European Commission, 2017; Available online: http://nws.eurocities.eu/MediaShell/media/CITYkeysD14Indicatorsforsmartcityprojectsandsmartcities.pdf (accessed on 10 February 2015).
- Salat, S.; Labbé, F.; Nowacki, C.; Walker, C. Cities and Forms: On Sustainable Urbanism; CSTB Urban Morphology Laboratory: Paris, France, 2011. [Google Scholar]
- Koutra, S.; Becue, V.; Griffon, J.-B.; Ioakeimidis, C.S. Towards a net-zero energy district transformation in a mono-criterion scenario analysis the case of Bo01, Malmö district. In Proceedings of the 6th International Conference on Smart Cities and Green ICT Systems (SMARTGREENS 2017), Porto, Portugal, 22–24 April 2017. [Google Scholar]
- Marique, A.F. Les Quartiers Durables: Processus de Production et Reproductibilité; University of Liege: Liège, Belgium, 2009. [Google Scholar]
- Schulz, C. Urban Design for Sustainability: Learning from Helsinki. 2006. [Google Scholar]
- Pic-Au-Vent: Un Nouveau Quartier de 36 Maisons Passives à Tournai. 2010. Available online: https://energie.wallonie.be/servlet/Repository/cale3_8oct2010_4_temoignage-picauvent.pdf?ID=15901 (accessed on 10 February 2015).
- Reiter, T.; Marique, S.; de Herde, A.F.; de Meester, A. SOLEN (SOlutions for Low Energy Neighbourhoods): L’objectif Zéro Énergie: Un État de L’art; 2014. Available online: http://solen-energie.be (accessed on 15 February 2015).
- Ruelle, A.F.; Marique, C. La Durabilité à L’échelle du Quartier; Lepur: Centre de Recherche sur la Ville, le Territoire et le Milieu rural; LEMA: Namur, Belgium, 2014. [Google Scholar]
- ATESTOC: Stockage D’énergie Thermique en Aquifère Pour la Réalisation D’éco-Quartier; 2011. Available online: https://anr.fr/Projet-ANR-08-STKE-0002 (accessed on 15 February 2015).
- Rinne, H. Eco-Viikki (Helsinki-FI). In Guidebook of Sustainable Neighbourhoods in Europe; Energy Cities: Brussels, Belgium; ADEME: Montpellier, France, 2008; pp. 27–28. [Google Scholar]
- Chuvieco, E. Integration of Linear Programming and GIS for Land-Use Modelling. Geogr. Inf. Syst. 1993, 7, 71–83. [Google Scholar] [CrossRef]
- Yeh, A. Urban planning and GIS. 1990. Available online: https://www.geos.ed.ac.uk/~gisteac/gis_book_abridged/files/ch62.pdf (accessed on 15 February 2015).
- Bahramara, S.; Moghaddam, M.; Haghifam, M. Optimal planning of hybrid renewable energy systems using HOMER: A review. Renew. Sustain. Energy Rev. 2016, 62, 609–620. [Google Scholar] [CrossRef]
- Karayiannis, T. Degree-days: Comparison of calculation methods. Build. Serv. Eng. 1998, 19, 7–13. [Google Scholar]
- Eurostat. Electricity Prices for Household Consumers - bi-annual Data, 2018. Available online: https://appsso.eurostat.ec.europa.eu/nui/show.do?dataset=nrg_pc_204&lang=en (accessed on 15 February 2015).
- Jones, C.; Gilbert, P. Determining the consequential life cycle greenhouse gas emissions of increased rooftop photovoltaic deployment. J. Clean. Prod. 2018, 184, 211–219. [Google Scholar] [CrossRef]
- Huld, T.; Muller, R.; Gambardella, A. A new solar radiation database for estimating PV performance in Europe and Africa. Sol. Energy 2012, 1803–1815. [Google Scholar]







| Topic/Field | Objectives | Methods/Tools | Scale | Reference |
|---|---|---|---|---|
| NZED/ NZEB | Definition proposal for NZED | Hierarchical and qualitative approach | District | [15] |
| Assessment of extending NZEB concept to district scale | Dynamic simulations | District | [25] | |
| Assessment of alternative scenarios for NZED construction | Multicriteria decision analysis | District | [26] | |
| Optimization of energy systems design toward NZED | Genetic algorithm | District | [27] | |
| Sustainability assessment tools | Analysis of existing sustainability assessment tools | Comparative analysis and data | District | [28] |
| Analysis of existing sustainability assessment tools | Comparative analysis and data | Urban | [29] | |
| Analysis of existing sustainability assessment tools | Top-down and bottom-up models | District | [30] | |
| U-ZED | Development of a holistic theoretical methodological approach at the conception phase with a zero-energy context | Parametrical concept of the NZED with the use of a Geographical Information System (GIS) tool | District | [31] |
| Mitchell [9] | Salat et al. [33] | Ratti et al. [19] |
|---|---|---|
| Urban geometry | Urban structure | Urban geometry |
| Building morphology | Building performance | Building design [7] |
| Thermal performance of materials | Equipment and system efficiency | System efficiency |
| Efficiency of internal systems | User/occupant behavior | Occupant behavior |
| Occupant activities and behavior | Type of energy use | |
| Internal and external temperatures |
| KPIs | Criterion(a) | Description | U-ZED Approach | References |
|---|---|---|---|---|
| Site opportunities | Location Site topography | Geographical site with a potential for energy resource proximity and city center accessibility | Climate conditions Distance from city center: 3–5 km Distance between the “stops”: 200–500 m | [34] |
| Mobility | Available public transport | 1500 m from IC/IR or less than 1000 m from a local railway station | [25] | |
| Parking | 0.2–0.5 places per dwelling, 500 places of parking in proximity to stations of means of transport | [25] | ||
| Resources | Natural resources | Production on-site | Local production by local resources at least 20% | [25] |
| Site attributes | Surface | Number of ha | - | [35] |
| Population | Number of residents | ≤5000 inhabitants | [25] | |
| Dwellings | Number of dwellings | 500–2000 | [25] | |
| Typology/morphology | Compactness | A dwelling is considered to be semidetached if at least 80% of the area of two of its walls is in contact with a heated area | 50% terraced, 30% terraced | [25] |
| Density | Dwellings/ha | ≥30 dwellings dwel/ha (poles) ≥40 dwel/ha (suburban) | [36] | |
| Orientation (angle) | Southeast and southwest orientation | 50% of the windows to the south, 20% of the windows to the east and west, 10% of the windows to north, forming “L” | [37] | |
| Functional and social mixing | Mixed-use land uses | 15 different services/infrastructure in a perimeter of 1000 m 300 m in proximity to a commercial center 300 m in proximity to a primary school 500 m in proximity to an activity center | [38] | |
| Social mixing | Number of social dwellings/surface (ha) | 15% in social dwellings, 10% of district’s dwellings accessible to “middle” revenues | [38] | |
| Mixing in Dwellings | Variety of dwellings/land uses in NZEDs | 10% studios and/or dwellings of “one room”, 10% of dwellings “two rooms”, 10% of “three rooms” or more, 10% of public dwellings (Ground floor +1) to (Ground floor +5) (max) | [25] | |
| Amenities | Connections to city center | Distances of the NZED from city center | Average distance between 2 and 3 km from the city center for the urban areas and 3 and 8 km from the city center for the suburban areas | [25] |
| Green spaces | Expressed in m2 spaces/number of inhabitants in NZEDs | 30% to 50% of the site surface and 30% to 40% in suburban areas | [25] | |
| Collective spaces | Number of collective (public) spaces in NZEDs | 700 m around the site’s limits | [25] | |
| Infrastructure/services for disable persons | Number of services provided for disabled persons | 10% of dwellings accessible to disabled persons | [39] | |
| Energy | Conception of districts with low energy consumption | - | Average consumption: ≤60 kWh/m2/y (heating) Electricity: ≤20 kWh/m2/y | [40] |
| Energy production by renewable energy resources | Maximization of the use of natural resources | Combination of the use of natural resources and the installation of various systems | [40] | |
| Water | Recuperation of storm water | Valorization of storm water | 100 lt/day/pers | [40,41] |
| Waste | Waste reuse | Valorization of waste | 60 m from residential dwellings, 100 kg/person/year | [25,41] |
| Systems | “Smart” installation of systems for the reduction of energy consumption | Energy water waste | Heating: solar panels/captures Wind turbines Thermal solar panels Electricity: photovoltaic panels Cogeneration | [40] |
| Month | Type 1 | Type 2 | Type 3 | Type 4 | Type 5 |
|---|---|---|---|---|---|
| January | 8388.11 | 70,087.93 | 85,793.92 | 208,049.81 | 132,042.70 |
| February | 111,530.12 | 87,449.17 | 107,045.62 | 259,585.08 | 164,750.53 |
| March | 93,693.50 | 73,463.73 | 89,926.19 | 218,070.56 | 138,402.56 |
| April | 46,744.24 | 36,651.49 | 44,864.71 | 108,796.69 | 69,049.85 |
| May | 30,547.77 | 23,952.07 | 29,319.48 | 71,099.59 | 45,124.69 |
| June | 19,681.79 | 15,432.21 | 18,890.40 | 45,809.13 | 29,073.62 |
| July | 15,991.45 | 12,538.67 | 15,348.45 | 37,219.92 | 23,622.32 |
| August | 17,426.58 | 13,663.93 | 16,725.88 | 40,560.17 | 25,742.27 |
| Sep | 37,928.44 | 29,739.15 | 36,403.38 | 88,278.02 | 56,027.29 |
| Oct | 43,873.98 | 34,400.96 | 42,109.86 | 102,116.19 | 64,809.95 |
| Nov | 81,392.38 | 63,818.60 | 78,119.69 | 189,439.85 | 120,231.55 |
| Dec | 97,178.82 | 76,196.52 | 93,271.37 | 226,182.59 | 143,551.01 |
| Total | 685,377.17 | 537,394.42 | 657,818.96 | 1,595,207.61 | 1,012,428.35 |
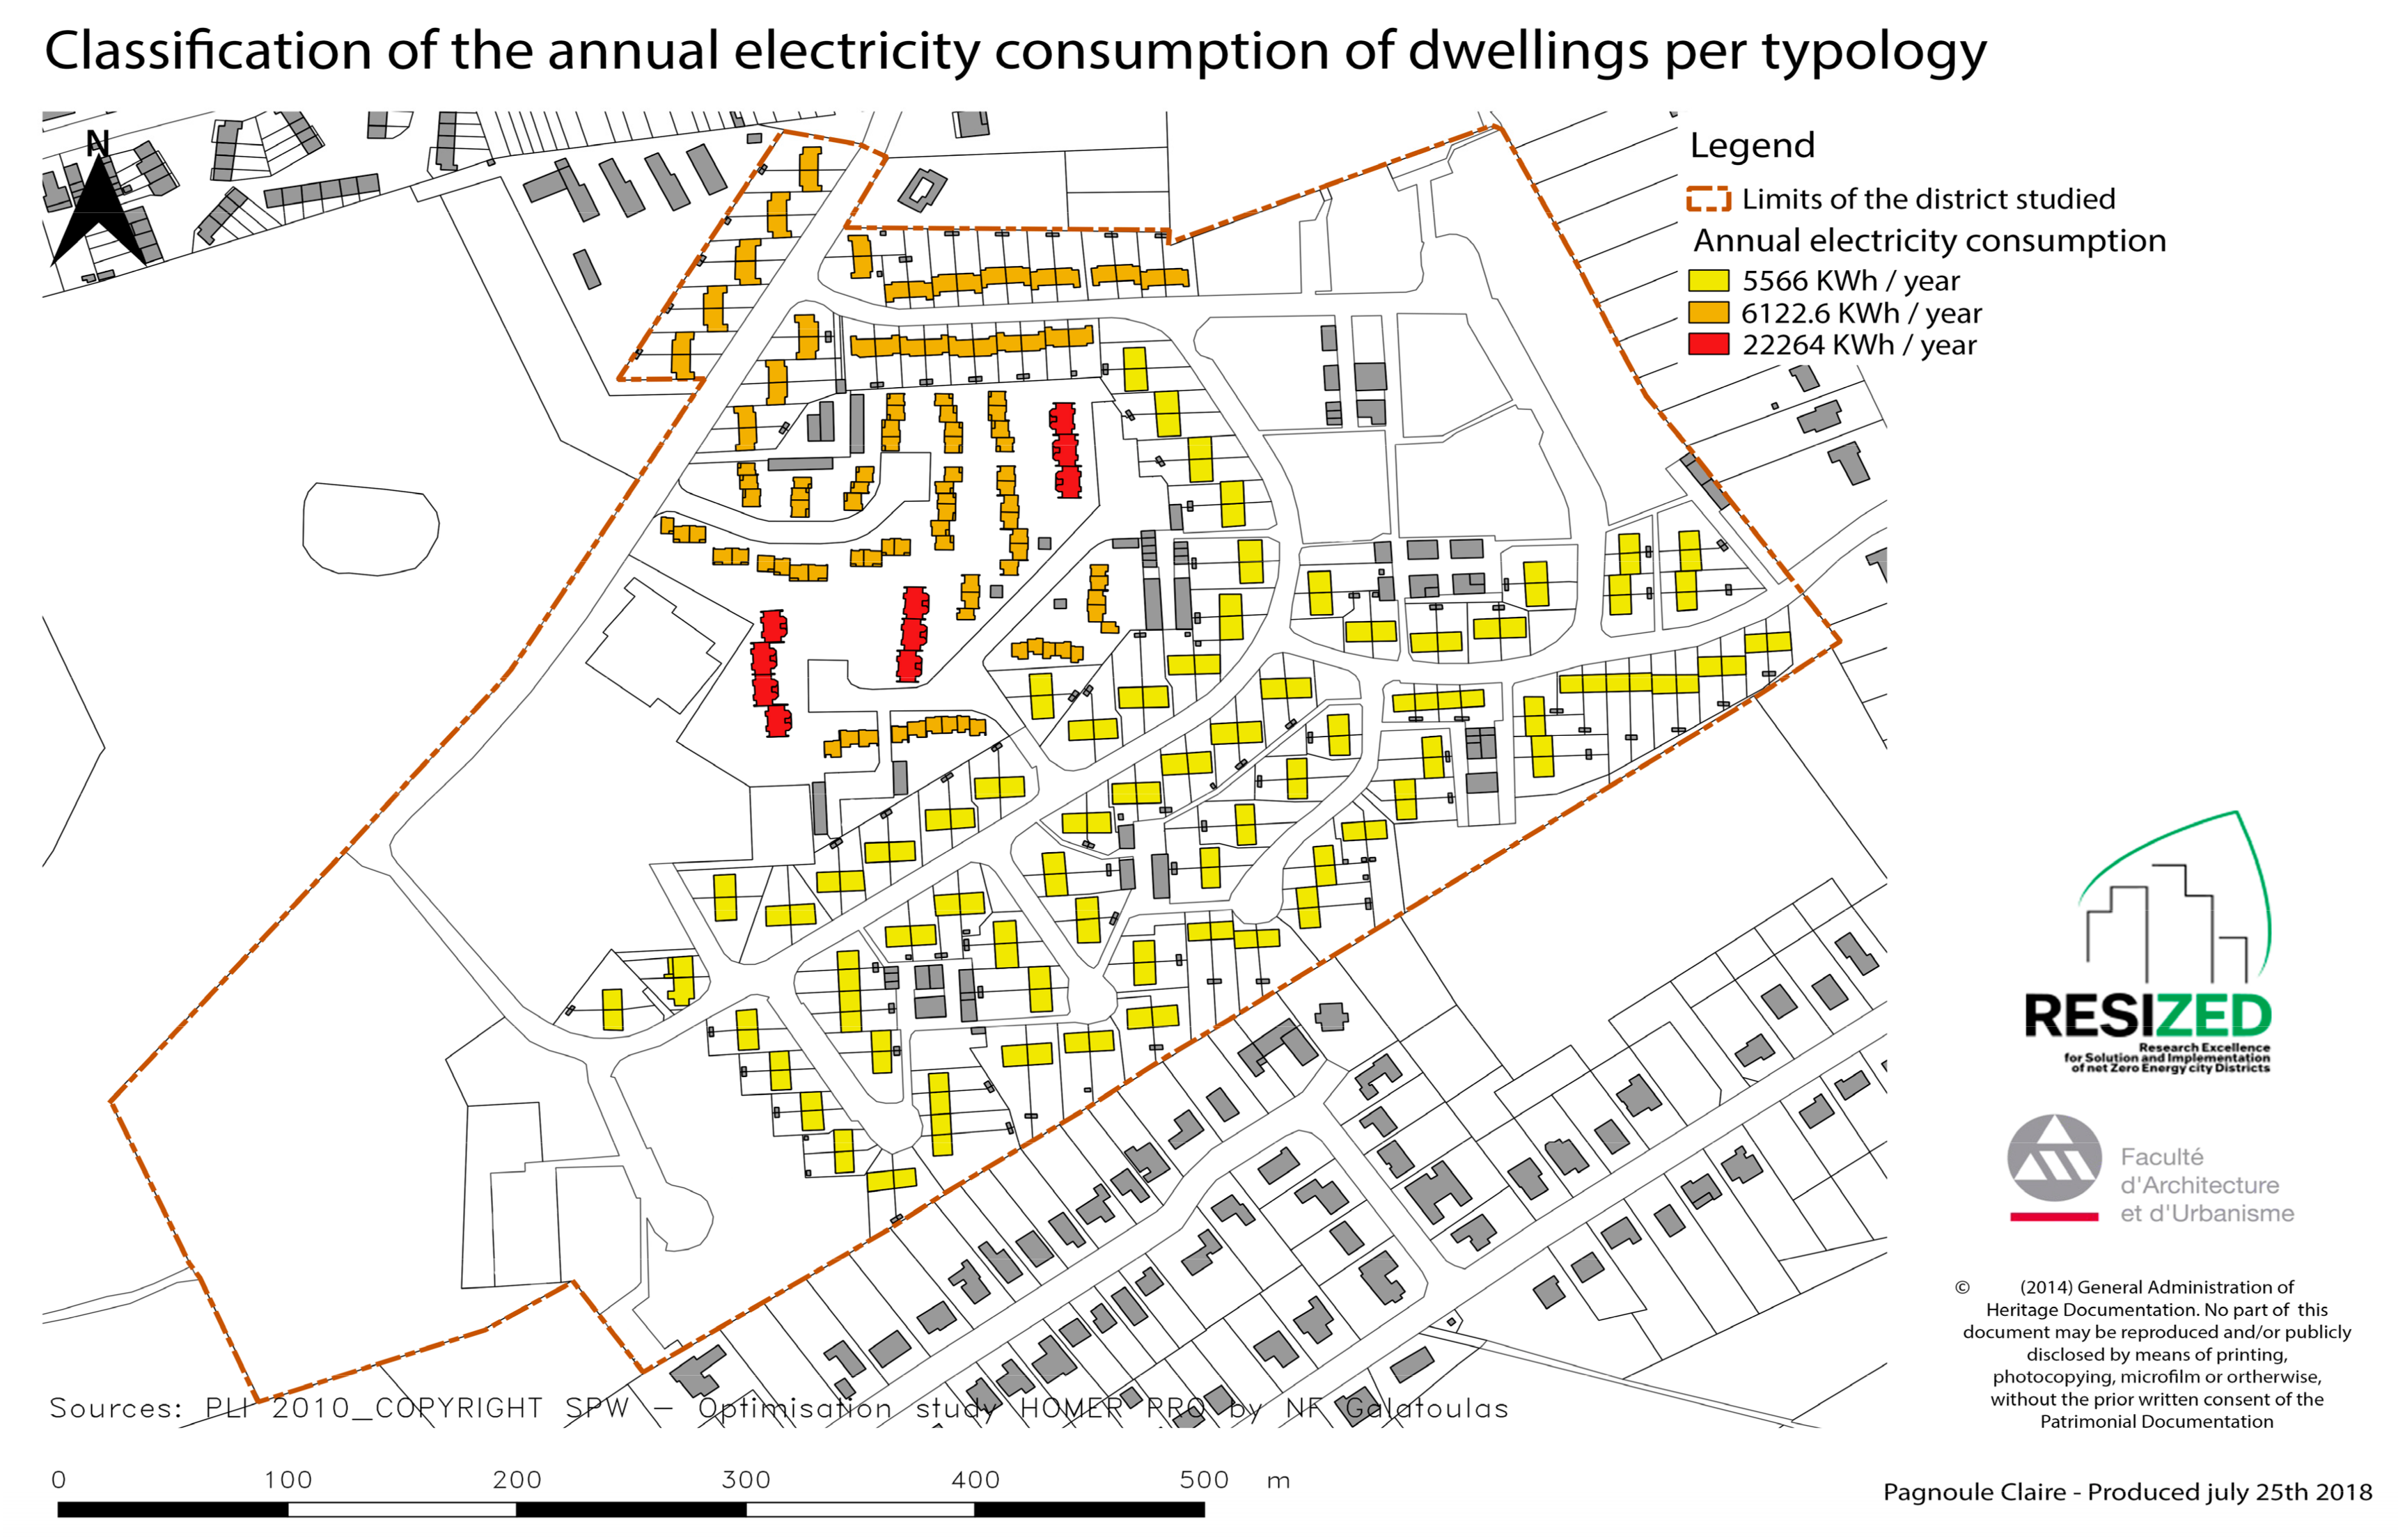
| Household Type | Estimated Annual Electricity Consumption (kWh/yr) | Calculated PV Output (kWh/yr) | PV Installation Surface Area (m2) Module Size (Peimar SG325P) | Levelized Cost of Energy (€/kWh) | Annual Energy Savings (%) |
|---|---|---|---|---|---|
| Small | 5566 | 5763 | 35.118 (5.72 kW) | 0.294 | 72.2% |
| Average | 6123 | 5474 | 33.167 (5.42 kW) | 0.290 | 67.3% |
| Large block | 22,264 | 14,999 | 89.746 (14 kW) | 0.230 | 47.2% |
© 2019 by the authors. Licensee MDPI, Basel, Switzerland. This article is an open access article distributed under the terms and conditions of the Creative Commons Attribution (CC BY) license (http://creativecommons.org/licenses/by/4.0/).
Share and Cite
Koutra, S.; Pagnoule, C.; Galatoulas, N.-F.; Bagheri, A.; Waroux, T.; Becue, V.; Ioakimidis, C.S. The Zero-Energy Idea in Districts: Application of a Methodological Approach to a Case Study of Epinlieu (Mons). Sustainability 2019, 11, 4814. https://doi.org/10.3390/su11174814
Koutra S, Pagnoule C, Galatoulas N-F, Bagheri A, Waroux T, Becue V, Ioakimidis CS. The Zero-Energy Idea in Districts: Application of a Methodological Approach to a Case Study of Epinlieu (Mons). Sustainability. 2019; 11(17):4814. https://doi.org/10.3390/su11174814
Chicago/Turabian StyleKoutra, Sesil, Claire Pagnoule, Nikolaos-Fivos Galatoulas, Ali Bagheri, Thomas Waroux, Vincent Becue, and Christos S. Ioakimidis. 2019. "The Zero-Energy Idea in Districts: Application of a Methodological Approach to a Case Study of Epinlieu (Mons)" Sustainability 11, no. 17: 4814. https://doi.org/10.3390/su11174814


