Abstract
Economic transformation and re-industrialization constantly change the geographical landscape of knowledge- and technology-intensive industries (KTI) globally, and the role of KTI agglomeration in city innovation is becoming increasingly decisive. Based on the employment data with a two-digit code in China’s 2010 Population Census, this paper compares the spatial difference between absolute and relative concentration of knowledge-intensive business service (KIBS) and technology-intensive manufacturing (TIM) in prefecture-level units, and interprets the diverse impact of KIBS and TIM specialisation on innovation in 286 prefecture-level cities. Results indicate that KIBS is concentrated mainly in the provincial capital cities, while the level of KIBS specialisation exceeds the national average in some border cities of the northwestern region and resource-based cities of the northeastern region. Unlike KIBS, TIM is highly concentrated in the Yangtze River Delta, the Pearl River Delta, and the Beijing–Tianjin and Shandong Peninsula urban agglomerations. KIBS specialisation matters more in boosting city innovation than does TIM specialisation, and TIM specialization exerts a significant positive spatial spillover effect on city innovation. Our empirical results could be considered by policy-makers for the development of KTI and the promotion of city innovation.
1. Introduction
Informatization and the AI revolution are accelerating the transformation of the global economy, and the role of the service industry, especially knowledge-intensive business service (KIBS), in economic growth and innovation is highlighted constantly. Global KIBS added value accounted for 15% of GDP in 2016, approximately 1.67 times that of knowledge-intensive public service (KIPS) and 7.5 times that of High-tech Manufacturing (HTM) [1], respectively. As the most innovative country in the world, the U.S. KIBS received 84% of the patents issued to nonmanufacturing industries in 2012 [2]. However, the contribution of developing countries to global KIBS growth continues to increase. The growth rate of KIBS added value in developing countries has exceeded that in developed countries since 2003, and the share of KIBS added value in developing countries has increased from 10% in 2003 to approximately 21% in 2012 [3].
Global economic transformation does not mean that the role of manufacturing in regional innovation is marginalized, and technology-intensive manufacturing (TIM) is still an essential factor boosting regional innovation. The U.S. HTM received approximately half of the patents granted to all U.S. manufacturing industries in 2012 [2]. Major economies have launched HTM development strategies, such as German Industry 4.0, British Industry 2050, American Advanced Manufacturing Partnership (AMP), and Made-in-China 2025, aiming at occupying the commanding heights of the global industrial revolution and technological innovation by means of re-industrialization. Globalization has led to the spatial separation of R and D and production/marketing sectors in the manufacturing industry, creating the general model of “produce-here-and-innovate-there” in the traditional manufacturing industry. However, as the Science journal says, the unique mode of “innovate-here-and-produce-here” is taking shape in the advanced manufacturing industry [4].
In China, the largest developing country in the world, KIBS and HTM have grown rapidly in recent years. The value-added output of KIBS grew at an average annual rate of nearly 20% from 2006 to 2016, and China possessed the third largest share of global KIBS (17%). The value-added output of HTM was growing by 70% between 2011 and 2016. The growth rates of both were higher than those of developed countries [1]. China has become an essential part of the growth of global knowledge-and technology-intensive industries (KTI). Unfortunately, the geographic concentration of KTI and the knowledge spillover of KTI agglomeration are mainly conducted in the developed world. Additionally, both the spatial difference between the geographic concentration of KIBS and TIM and their diverse impact on city innovation are examined rarely.
Overall, based on the employment data with a two-digit code in China’s 2010 Population Census, our research measures the absolute and relative concentrations of KIBS and TIM in prefecture-level units, and interprets the impact of KIBS and TIM specialization on innovation in 286 prefecture-level cities, aiming at answering two questions: (1) What are the spatial differences between the geographical concentration of KIBS and TIM in China? (2) Is KIBS specialization or TIM specialization more conducive to city innovation? What are the differences in their impact on city innovation in diverse regions?
The research structure of this paper is as follows: Section 2 provides two reviews of existing research into the geographic concentration of KTI and the knowledge spillover effect of industrial agglomeration. Section 3 is the theoretical model. Section 4 defines KIBS and TIM and describes measuring indicators and spatial econometric model. Section 5 reveals the spatial pattern of the absolute and relative concentrations of KIBS and TIM and describes the sector-based classification of prefecture-level units. Section 6 interprets the impact of KIBS and TIM specialization on city innovation in prefecture-level cities by using a spatial Durbin model. Conclusions and discussions are provided in Section 7.
2. Literature Review
2.1. Geographical Concentration of Knowledge- and Technology-Intensive Industries
The relationship between the spatial distribution of KIBS and urban hierarchy in developed countries has long attracted wide attention. Many empirical studies have shown that KIBS tends to be concentrated in large metropolitan areas [5,6,7,8,9]. The empirical analysis in the European Union (EU) indicated that capital cities, especially those in Western Europe, are generally the most specialized regions in terms of KIBS [10,11,12]. However, the relationship between the two may be constantly changing. Gong [13] put forward three stages of KIBS distribution in American urban hierarchy: centralization, partial decentralization, and complete decentralization. Chadwick et al. [14] found that the employment in KIBS is not concentrated necessarily in the top of the urban hierarchy, and the share of KIBS employment in the large cities, small cities, and large towns of Greater London and the South East is above the national average. In recent years, empirical analysis in this field has only begun to emerge in China, focusing mainly on the provincial scale [15] and the county–city scale in some provinces [16,17,18]. Zhang [3] used employment density to measure KIBS agglomeration of 280 prefecture-level cities and discovered that KIBS was concentrated mainly in cities with high administrative rank.
The geographical concentration of manufacturing is the core of industrial geography research. Many studies use the Herfindahl index, the Gini coefficient, the Krugman specialization index, and the E-G index to measure the geographic concentration of high-tech industry [19,20,21,22,23]. These indices are often used to measure the overall geographical concentration of industry, and they are unable to reveal where the industry is mainly concentrated, without considering either the geographical proximity or uniform dispersion of industrial agglomeration [24]. The spatial difference of industrial agglomeration can be measured by the absolute size of employment and output value, location quotient, or spatial autocorrelation coefficient. Based on the average output value, location quotient, and average value of exports, Wang et al. [25] found that ICT industry is concentrated mainly in the Pearl River Delta, the Yangtze River Delta, and the Beijing–Tianjin region, and these three urban agglomerations had the most developed economy in China. Similarly, by using the focal location quotient, Liu [24] discovered that China’s electronics and telecommunications industry is concentrated mainly in the above three regions. Unlike these, transportation equipment manufacturing is concentrated mainly in the Yangtze River Delta, the Beijing–Tianjin region, Shiyan City, and Changchun City [26]. It is not difficult to find that these studies focused only on one specific technology-intensive industry in China, and systematic and comprehensive research on the geographical distribution of technology-intensive industries is lacking.
The agglomeration mechanism of KIBS and TIM is distinguished, and the differences in the geographic concentration between them are also beginning to receive some attention in the EU. Merino and Rubalcaba [12] compared the differences in the geographic concentration of knowledge-intensive service (KIS), KIBS and HTM, and showed that the geographic concentration of both KIS and KIBS are lower than that of HTM. Corrocher and Cusmano [10] made a cluster analysis of the EU region based on GDP growth rate, the share of high-to-medium-technology manufacturing (HMT) and KIBS employment, and the results indicated that, in KIBS-intensive regions, the economic growth rate is faster than other regions and the proportion of HMT employment is lower than the EU average. However, in regions with the advantages of HMT specialization, the economic growth rate is slow, and the share of KIBS employment is lower than the EU average. On the whole, the spatial differences between the geographic concentration of KIBS and TIM are examined rarely, especially for developing countries. Therefore, based on the empirical findings of the geographical distribution of KIBS and TIM, the geographic concentration of KIBS may be different from that of TIM. We put forward our first hypothesis as follows:
Hypothesis 1.
KIBS is concentrated mainly in cities with high administrative rank, while TIM is concentrated mainly in urban agglomerations.
2.2. Industrial Agglomeration and City Innovation
Marshall argued that industry specialization is an essential factor in promoting technological innovation and economic growth, and this idea was developed further by Arrow and Romer, summarized as Marshall–Arrow–Romer (MAR) externalities by Glaeser et al. [27] and known as intra-industry knowledge spillover. MAR externalities hold that agglomeration of the same industry in a particular region contributes to knowledge spillover by sharing similar infrastructure, intermediate inputs, a professional labour force, and information. Contrary to MAR’s externalities, Jacobs’ externalities support the notion that it is inter-industry knowledge spillover rather than intra-industry knowledge spillovers that gives a genuine boost to regional innovation, which implies the importance of a diversified economy [28]. Though in agreement with Jacobs’ externalities, Porter [29] argued that it is the inter-industry competition that gives impetus to regional innovation. Since then, the question which of MAR’s externalities and Jacobs’ externalities matter more for regional innovation has become the focus of industrial geography, innovation geography, and other disciplines [30,31,32,33,34,35].
Manufacturing has always been an important research target regarding the knowledge spillover effect of industrial agglomeration [36]. The research can be summarised roughly as follows. First, the effect of manufacturing agglomeration on regional or city innovation has been analysed [37,38]. Second, the impact of different knowledge-intensive manufacturing agglomeration on city innovation has been discussed. Koo [39] observed that the existence of knowledge-intensive industries sharing similar knowledge bases boosts technology spillovers in metro areas. Santamara et al. [40] compared the influencing factors in the process innovation of high-tech and low-tech manufacturing and found that informal R and D activities and external resources play an important role in the process innovation of low-tech manufacturing. Third, the relationship between some types of manufacturing and innovation has also received attention. Audretsch and Feldman [21] found that computer, process control output, radio and TV communications, and semiconductors are the most innovative sectors in manufacturing. Moreno et al. [41] observed that there is a significant positive correlation between the specialization of EU 23 manufacturing sectors and innovation, whereas there is no evidence supporting the diversity of all manufacturing.
In the process of economic transition, the role of KIBS in the regional innovation system (RIS) has begun to be recognized widely [8,10,42,43,44]. KIBS can not only produce knowledge and skills in its own industry but also indirectly stimulate knowledge spills of other industries by providing knowledge-based services or products to manufacturing enterprises [10,45]. Existing studies are mainly in the context of the developed world, and developing countries have received little attention [15]. Additionally, these empirical studies concentrate primarily on the innovation in KIBS themselves, ignoring the impact of KIBS on regional innovative capacity and economic growth [46].
The innovation process of KIBS is different from that of TIM. The former depends highly on human capital and the consumer market. Production and consumption occur simultaneously, and their products are invisible [47]. Every process of R and D, design, production, marketing, and consumption in the industrial chain of TIM can be separated spatially. Several empirical studies comparing the different impacts of KIBS and TIM agglomeration on regional innovation have been conducted in the EU, and very few studies have been carried out in other countries. Capello et al. [36] observed that KIS contributes more to product and marketing innovation than does advanced manufacturing, and the simultaneous existence of advanced manufacturing and KIS creates synergic effects in stimulating innovative performance. Corrocher and Cusmano [10] found that core manufacturing regions with advantages of specialisation perform better in producing high- technology patents, whereas KIBS-intensive regions perform better than do other clusters in producing mid-technology patents.
KIBS needs proximity to suppliers and clients to provide professional services [48], and geographical proximity determines that industrial chain of KIBS is spatially clustered. Meanwhile, KIBS can greatly stimulate knowledge spillovers of other industries [10,45]. However, economic globalization makes the industrial chain of TIM separate, spatially. This process leads to that the underdeveloped regions or countries receiving the transfer of TIM’s production rather than its R and D process, have a low innovation efficiency of TIM, and the developed regions and countries with TIM’s R and D process cannot achieve the innovative output of production process. Therefore, we put forward our second hypothesis as follows:
Hypothesis 2.
KIBS specialisation has a stronger impact on city innovation than does TIM.
3. Theoretical Model
Consistent with MAR’s externalities, many studies have confirmed that industry specialisation is more beneficial to innovation intensity (INA) than industry diversity [31,32,33,35,49,50], which is especially true for technology-intensive manufacturing [39,41,51]. MAR externalities argue that the geographical proximity of similar industries dramatically facilitates the sharing of infrastructure, intermediate inputs, and the labour market, subsequently fostering knowledge spillover. KIBS needs proximity to suppliers and clients to supply professional services, and geographical proximity facilitates face-to-face contacts and non-market interaction among enterprises [48], which is a crucial determinant for KIBS locational distribution [52]. Therefore, MAR externalities also apply to KIBS. By choosing accessibility as a measure of geographical proximity to a mass of KIBS firms, Kekezi and Klaesson [42] observed that geographical proximity of KIBS enterprises significantly stimulates KIBS innovation, whereas the diversity of enterprise agglomeration is negatively correlated with KIBS innovation, which strongly supported MAR externalities in KIBS agglomeration. Thus, based on the theory of MAR externalities, this paper will compare the diverse impacts of KIBS and TIM specialization (KIB and TIML) on city innovation
Knowledge production function considers regional innovation as a result of R and D expenditure (RDG) and investment in human capital (HUM) [30,35,37,53,54]. At the same time, the foreign direct investment (FDI) of “market-for-technology” is also a vital breakthrough to city innovation. Particularly for China, the large-scale inflow of foreign direct investment has played a considerable role in improving the innovation ability of Chinese enterprises since the reform and opening up [30,35,55]. In the era of a knowledge economy, informationisation (INT) also effectively fosters the flow and production of tacit knowledge, compressing the space-time distance of knowledge production, accelerating the speed of factors flow and sharing, ultimately boosting city innovation and output considerably [56,57,58]. Marketization is the main driving factor of city innovation, for a country with an imperfect market economy system, and administrative rank (ADM) is an important factor that cannot be ignored in city innovation. Therefore, the above five factors are taken as control variables.
To control for the heteroscedasticity of variables, all variables are natural logarithm except for the administrative rank of dummy variable (ADM). Meanwhile, to control for endogeneity between independent and dependent variables, the independent variables need to be lagged for one year, from which the dummy variable is excluded. Therefore, the theoretical model is as follows:
where μ is the unobserved error term, and t denotes year. β is the constant term, and αi is the coefficient of independent variables.
Ln(INAt+1) = β + α1Ln(KIBt) + α2Ln(TIMLt) + α3Ln(RDGt) + α4Ln(FDIt) + α5Ln(HUMt) + α6Ln(INTt) + α7ADM + μ
4. Methodology
4.1. Definition of Knowledge- and Technology-Intensive Industries
The US National Science Foundation [2] defines knowledge-and technology-intensive industries (KTI) as knowledge-intensive services (KIS) and high-tech manufacturing (HTM). The KIS industry is made up of KIBS (business, finance and information) and knowledge-intensive public service (health and education). KIBS is the most innovative sector among the service industry, and the rates of product innovation in U.S. KIBS were 3–4 times those in non-manufacturing industries from 2008 to 2010 [2]. Therefore, only the knowledge spillover of KIBS is discussed in our paper. Most studies follow the detailed definition of KIBS proposed by Miles et al. [59]: (1) high-skilled labour market pooling, (2) providing knowledge-based intermediate inputs with organisations, (3) private and public sectors as the clients [42]. Decree No. 99 of the State Council of China has provided the classification standard of the KIBS industry: information transmission, computer services and software industry, financial industry, scientific research, technical services and geological prospecting industry, leasing and business services industry. This standard is also applied widely to KIBS research in China [16,17,18]. Thus, this standard is also chosen to define KIBS in our paper.
Based on four-digit codes, the OECD [60] divides manufacturing into high-technology, medium-high-technology, medium-low-technology and low-technology industries, in which the high-tech manufacturing (HTM) includes aircraft and spacecraft, pharmaceuticals, office, accounting and computing machinery, radio, TV and communication equipment, medical and precision and optical instruments. However, the employment data in China’s population census are specific only to two-digit codes, which are used often to define technology-intensive manufacturing (TIM). According to the classification standard of China’s HTM with two-digit codes (2013), combined with many empirical studies of TIM in China [61,62,63], TIM is composed of pharmaceuticals, special equipment, transportation equipment, instrument and culture, office machinery and communication equipment and computer and other electronic equipment.
4.2. Industrial Geographical Concentration
This study does not focus on the differences of overall geographical concentration of diverse industries, but aims to compare the spatial differences of the geographic concentration of KIBS and TIM, which consists of the absolute concentration and relative concentration of industries.
4.2.1. Absolute Concentration of Industries
The absolute concentration of industries can be measured either by the absolute size of employment or output value [64] or by the share of employment or output value in a region compared to that of the industry in the country:
where Aij is the absolute concentration coefficient of i industry in j prefecture-level unit, Eij is the employment size of i industry in j prefecture-level unit, and Ei is the employment size of i industry in the country. The bigger the value of Aij, the more concentrated the industry in a region.
4.2.2. Relative concentration of industries
Location quotient denotes the relative concentration of industry, which is used widely to measure the spatial difference of industrial relative concentration [65,66,67], and industrial specialisation [34,39,41].
where LQij is the location quotient of i industry in j prefecture-level unit, Eij is the employment size of i industry in j prefecture-level unit, and Ei is the employment size of i industry in the country. Ej and E are the employment size of all industries in j prefecture-level unit and the country. When LQ > 1, it means that the industry in this region has advantages of specialisation.
According to the level of KIBS and TIM specialisation (in contrast with China’s average value) [36], our empirical analysis identifies four types of regions:
- Knowledge-and technology-intensive (KTI) regions: LQ_KIBS > 1, LQ_TIM > 1
- Knowledge-intensive (KI) regions: LQ_KIBS > 1, LQ_TIM < 1
- Technology-intensive (TI) regions: LQ_KIBS < 1, LQ_TIM > 1
- Low knowledge and technology (LKT) regions: LQ_KIBS < 1, LQ_TIM < 1
4.3. Spatial Econometric Model
Innovation has spatial autocorrelation and a spatial spillover effect [30,37], and a spatial econometric model is necessary to analyse the impact of KIBS and TIM specialization on city innovation; this includes a spatial autocorrelation model (SAR), a spatial error model (SEM), and a spatial Durbin model (SDM).
The endogenous interaction of dependent variables is taken into account by the SAR model:
Y = ρWY +ατN + Xβ + ε
The SEM model considers the interaction effect of interference terms:
Y = Xβ + ατN + λWμ + ε
The SDM model nests the SLM and SEM models and takes into account exogenous interaction effects:
where Y is a N × 1 vector of the dependent variable; X is a N × K vector of independent variables; τN is a N × 1 unit vector related to the constant term α; θ is a spatial autoregressive coefficient; β and ρ are k × 1 parameter vectors, respectively; u is an N × 1 vector of residuals; λ is the spatial autocorrelation parameter; WY is an endogenous interaction of dependent variables; WX is an exogenous interaction of independent variables; W is a N × N spatial weight matrix; ε is an error term. The SAR and SDM models can report direct and indirect effects, and the indirect effect is interpreted as the impact of changing an independent variable on the dependent variable of all other units (spatial spillover effects). The ratio between the indirect and direct effect in the SAR model is same for each independent variable, which is heterogenous for each variable in SDM [68]; thus SDM is used widely to calculate spatial spillover effects of independent variables. The spatial weight matrix is the 0-1 matrix among spatial unities based on rook adjacency rules, and all spatial regression models are conducted in Elhorst’s spatial econometrics Matlab toolbox.
Y = ρWY + ατN + Xβ + WXθ + ε
5. Geographical Concentration Pattern of Knowledge- and Technology-Intensive Industries
5.1. Geographical Concentration Pattern of Knowledge-Intensive Business Industries
There is a difference between the absolute and relative concentration of KIBS in the four economic regions. KIBS employment is concentrated mainly in the eastern region, where the share of KIBS employment to that of the nation is as high as 66.55% (Table 1). However, the number and share of prefecture-level units in the eastern region, in which the location quotient of KIBS is greater than 1, is lower than is that of the western region and the northeast region, respectively, which means that the advantages of KIBS specialisation in the eastern region do not stand out among the four economic regions.

Table 1.
Geographical concentration of KIBS and TIM in China’s four economic regions.
KIBS employment is concentrated highly in the provincial capital cities of Beijing–Tianjin–Hebei, the Yangtze River Delta, the Pearl River Delta, and the Yangtze River Economic Belt, and their spatial distribution is scattered (Figure 1). The top ten cities account for 31.36% of KIBS employment in China, and nine of them are provincial capital cities. The absolute concentration coefficient of KIBS in Beijing and Shanghai is much higher than that in other cities. Beijing has the highest absolute concentration coefficient of KIBS, accounting for 8.51% of KIBS employment in China, followed by Shanghai (6.69%), Guangzhou (2.64%), and Shenzhen (2.58%), and these four cities have the most developed economy in China.
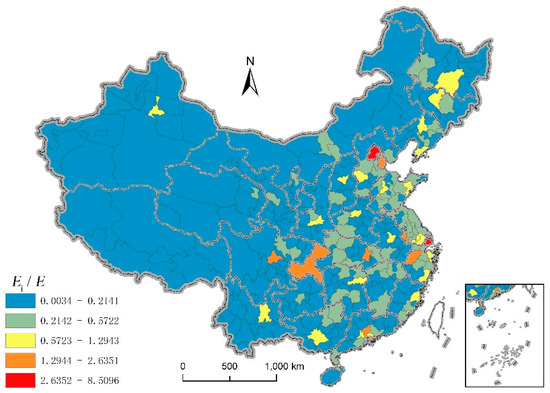
Figure 1.
The absolute concentration of KIBS in China’s prefecture-level units.
The advantages of KIBS specialisation are also most prominent in provincial capital cities (Figure 2). The location quotient of KIBS in Beijing is highest (6.15), followed by Shanghai (3.92); Urumqi, as the core city of the Silk Road Economic Belt in the China Section (3.25); and Karamay, as an oil-based city (3.16). The location quotient of KIBS in provincial capital cities is much higher than that in other cities, which is consistent with the spatial distribution of KIBS in the EU, whose capital cities have a higher level of KIBS specialisation than do others [10,11].
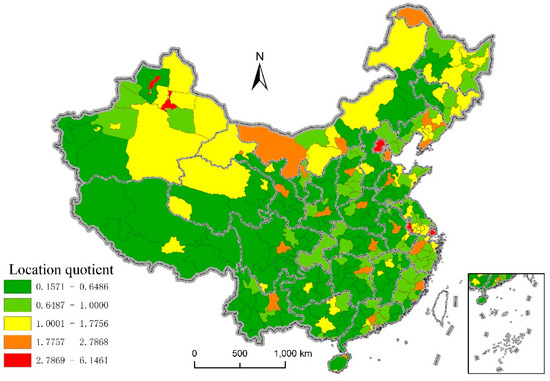
Figure 2.
The relative concentration of KIBS in China’s prefecture-level units.
Unlike the spatial distribution of KIBS absolute concentration, the location quotient of KIBS in the prefecture-level units, located in the eastern part of Xinjiang, the northwestern part of Gansu, and the northern part of Inner Mongolia province (Figure 2), is greater than 1, with the level of KIBS specialisation being lower than in provincial capital cities in the eastern and central regions. These regions are comprised of traditional resource cities in the northwest and northeast regions, such as Karamay, Ordos, Yichun, Hegang, Daqing and Fushun City—and border regions in Xinjiang and Inner Mongolia provinces, such as Urumqi, Altay, Hami, Xilingol, Alashan, Hulunbeir and Baotou City. This structural advantage of KIBS may create a strategic opportunity in the transformation of resource-based cities and the development of China’s Silk Road Economic Belt.
Metropolitan areas have a large and diversified labour market and a highly dynamic market to be served by KIS inputs, and urban agglomeration economy plays an essential role in fostering KIBS growth [10]. Urbanisation is a significant factor affecting the KIBS specialization [11]. The increase in the level of urbanisation can promote the supply of non-agricultural population and the growth of non-agricultural industries, and further enlarge the demand of KIBS [16]. The provincial capital cities, the northeast region, and border areas in the northwest region had a high urbanisation rate of the permanent population in 2000 and 2010 [69]. As political and economic centres of each province, the high urbanisation rate of provincial capital cities is naturally easy to understand. Meanwhile, the high level of urbanisation in the northeast region and border areas in the northwest region may be caused by the institutional policy of the central government. Since the establishment of Xinjiang Production and Construction Corps in the 1950s, there have been large-scale population migrations to Xinjiang from the central and eastern regions, creating a unique urbanisation mode combining military construction with local economic development [70], which is particularly evident in border areas. The priority development of the Northeast Heavy Industrial Base since the 1950s has greatly boosted the process of population urbanisation in the northeast region, and these historical structural advantages of urbanisation have accumulated gradually into the comparative advantages of KIBS.
5.2. Geographical Concentration Pattern of Technology-Intensive Manufacturing
TIM employment is concentrated highly in the eastern region. Different from KIBS, both the absolute and relative concentration coefficients of TIM in the eastern region are far higher than in other regions (Table 1). The share of TIM employment in the eastern region to that nationwide is 52.27%, which is lower than that of KIBS. However, there are 38 prefecture-level units with a location quotient of TIM above 1, which is higher than that of KIBS, indicating that the advantages of TIM specialisation stand out more than do those of KIBS in the eastern region.
TIM employment in China is concentrated highly in the Yangtze River Delta, the Pearl River Delta, and the Beijing–Tianjin urban agglomeration, and its spatial distribution is continuously compared with KIBS (Figure 3). The top ten cities account for 37.66% of TIM employment in China, which exceeds the share of KIBS. Nine of the top ten cities are located on the eastern coastal areas, and four of them are non-provincial capital cities. Shenzhen has the highest absolute concentration coefficient of TIM, which accounts for 8.57% of the TIM employment in China, followed by Shanghai (5.82%), Dongguan (5.41%) and Suzhou (5.13%). The absolute concentration coefficient of TIM in Beijing and Tianjin is less than a quarter of that in Shenzhen.
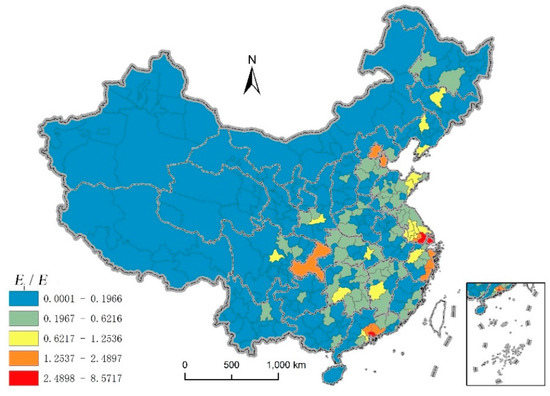
Figure 3.
The absolute concentration of TIM in China’s prefecture-level units.
The spatial patterns between the TIM absolute and relative concentrations are generally similar, and the level of TIM specialisation in the Shandong Peninsula is higher than is that in Beijing and Tianjin (Figure 4). There are nine non-provincial capital cities in the top 10 regions, and the location quotient of TIM in Shenzhen is highest (8.01), followed by Dongguan (6.10), Suzhou (5.65), and Zhuhai City (5.42). As two cities with the largest population in China, the location quotient of TIM in Shanghai is 88.11% of that of KIBS, whereas the location quotient of TIM in Beijing is approximately only one quarter of that of KIBS, which shows the different urban functions of the two cities.
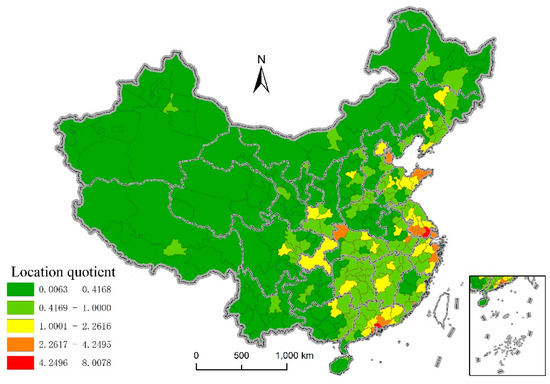
Figure 4.
The relative concentration of TIM in China’s prefecture-level units.
Transportation cost makes TIM highly concentrated in the eastern coastal areas. New Economic Geography argues that transportation cost affects industrial agglomeration and decentralisation. China’s manufacturing exports are dominated by the products of TIM, and the share of the export delivery value of pharmaceuticals, special equipment, transportation equipment, instrument and culture, office machinery and communication equipment, and computer and other electronic equipment manufacturing to that of total manufacturing reached 59.87% in 2010. This export orientation determines that TIM stays close to overseas markets to reduce transportation cost and gathers in the eastern coastal areas with major port hubs. Zheng and Kuroda [71] confirmed that export-oriented policies and transportation cost increase the geographic concentration of high-tech industries along the eastern coast of China.
5.3. Knowledge- and Technology-Intensive Sector-Based Classification of Regions
The TIM geographical concentration is quite different from that of KIBS. Both in absolute concentration and relative concentration, there is a weak positive correlation between TIM and KIBS (Figure 5). Knowledge-intensive manufacturing is the primary client of either productive service industry or knowledge-intensive commercial service [72]. Empirical research shows that EU HTM is an important factor affecting the distribution of KIBS [11], which may be different from the mismatched distribution between KIBS and TIM geographical concentration in most areas of China. The findings are basically consistent with hypothesis 1. There are high absolute and relative concentration coefficients of TIM in the three most developed urban agglomerations, while provincial capital cities have a high absolute and relative concentration coefficients of KIBS. Additionally, we also find that some border cities of the northwestern region and resource-based cities of the northeastern region have a high level of KIBS specialization.
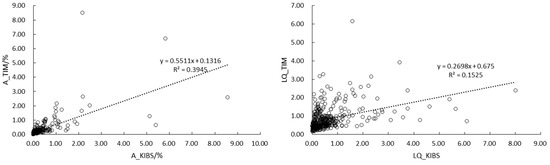
Figure 5.
The correlation between the geographical concentration of KIBS and TIM. Notes: LQ_KIBS and LQ_TIM denote the location quotient of KIBS and TIM, respectively. A_KIBS and A_TIM denote the absolute concentration coefficient of KIBS and TIM, respectively.
A total of 36 prefecture-level units with a high population concentration and developed economy are identified as KTI regions (Figure 6); these are mostly the core cities of major urban agglomerations in eastern coastal areas, and five provincial capital cities on the southeast of Hu Line. Among them, there are 14 cities located in the Yangtze River Delta. A total of 21 prefecture-level units defined as TI regions are peripheral cities of the Yangtze River Delta, the Pearl River Delta, and the Shandong Peninsula urban agglomeration, in addition to five prefecture-level cities in the middle reaches of the Yangtze River. A total of 49 KI regions consist of prefecture-level units in the northeast and northwest regions and some provincial capital cities in the southwest and central regions.
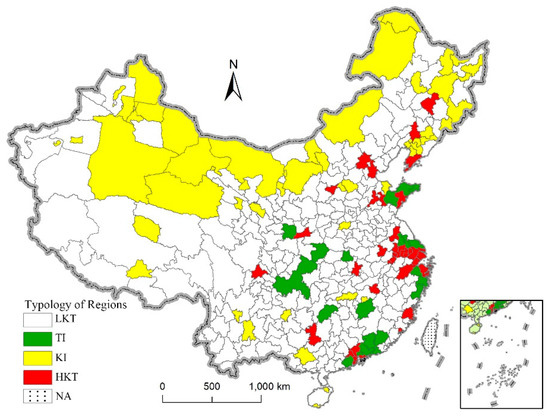
Figure 6.
Knowledge-and technology-intensive sector-based classification of prefecture-level units.
6. Geographical Concentration of Knowledge- and Technology-Intensive Industries and City Innovation
6.1. Descriptive Analysis
We analyse the impact of KIBS and TIM specialisation on the innovation of 286 prefecture-level cities nationwide and then discuss their influence in the eastern and midwest regions. The description and source of the dependent and independent variable are listed in Table 2, and descriptive statistics for the variables are listed in Table 3. The independent variable of R and D input is lagged by two years because of the data availability.
Table 2.
Description and source of variables.
Table 3.
Descriptive statistics for the variables.
6.2. Model Test
First, The VIF of independent variables in all models does not exceed 3.701, so there is no collinearity of independent variables. Second, Except for the variable of R and D intensity and administrative rank in the midwest region, Z-test values of other variables are larger than the key value of 2.576 and have a significance level of 0.05% (Table 4), which shows that significant spatial autocorrelation exists for independent and dependent variables. Therefore, the hypothesis of OLS that variables are independent and unrelated is not valid, and the spatial econometric model is needed.
Table 4.
Moran’s I test of variables.
The logarithmic likelihood ratio test (LR) proposed by Elhorst [68] is used to select spatial econometric models for cross-section data, comparing the difference of logl between constrained (loglc) and unconstrained models (logluc): −2 × (loglc − logluc). If it exceeds the critical value following chi-square distribution, the constrained model is better than the non-constrained model. It can be calculated from the table that the statistical values of the LR test for SDM and SAR, SDM and SEM in the three models exceed the critical values of 3.84 and 5.99, respectively (Table 5). The explanatory power of SDM is better than that of both SAR and SEM. Meanwhile, R2_Ad of three models are about 0.8, which means that the theoretical model we construct has good explanatory power for the city innovation, and R2_Ad of SDM is higher than that of both SAR and SEM in each model. Therefore, the results of SDM are chosen to explain the impact of KIBS and TIM specialisation on city innovation.
Table 5.
Regression results.
6.3. Empirical Results
Our empirical findings confirm Hypothesis 2, and KIBS specialisation plays a stronger role in city innovation than does TIM (Table 5). For every 1% increase in the location quotient of KIBS, the innovation intensity of cities increases by 0.74%, while the elasticity coefficient of TIM specialisation is only 0.15%. This relationship is also observed in the eastern region, but the elasticity coefficient of TIM specialization has increased by more than 2.5 times. The ratio of the elasticity coefficient between KIBS and TIM specialisation drops sharply, from approximately five nationwide to approximately two in the eastern region. However, TIM specialisation exerts no significant influence on city innovation in the midwest region, due to the level of TIM specialisation in this region being far lower than that in the eastern region. In contrast, KIBS specialisation is significantly positively correlated with city innovation, due to there is a certain advantage of KIBS specialisation in some border cities and provincial capital cities of the midwest region. However, the level of KIBS specialisation in the midwest region is still less than that in the eastern region, leading to its elastic coefficient being lower than that of the eastern region.
In terms of control variables, R and D input is an important factor boosting city innovation, and it has a stronger impact on city innovation in the developed eastern region than in the underdeveloped midwest region, which is caused mainly by that the R and D intensity in the eastern region is higher than that in the midwest region. FDI is only significantly positively related to city innovation in the midwest region, which is similar to the findings of Liu and Zhang [73] that FDI shows a negative and positive effect on urban innovation for the eastern region and the midwest region, respectively. The market opening occurred earlier in the eastern region than in the midwest region, gradually eliminating the path dependence of FDI-led knowledge spillover and technology diffusion. Instead, the midwest region is still at the stage of “market-for-technology” to enhance innovation ability [74].
The Internet also has a significantly positive impact on city innovation. Since the implementation of the Regional Coordinated Development Plan, Internet infrastructure in the central and western regions has been improved significantly and, thus, the internet exerts a positive effect on city innovation. Corporate innovation performance in the midwest region is worse than that in the eastern region, and the former excessively relies on government funding and policy support for innovation, which leads to a significant positive correlation between administrative rank and city innovation for the midwest region. This result is consistent with the findings of Wu and Liu [74] that government intervention has a significant negative and positive effect on the city innovation of the eastern and midwest regions, respectively. Though the average years of schooling are negatively correlated with city innovation [38,75], this impact is not statistically significant. There is a U-shaped relationship between human capital and innovation [38]. The level of human capital in China is relatively low at present, below the threshold value of human capital, and thus human capital has a negative impact on innovation [75].
6.4. Spatial Spillover Effect
The positive spatial spillover effect of city innovation has been verified by some empirical results [30,37,76], but our study finds that the positive spatial spillover effect of city innovation in the eastern region is stronger than that in the midwest region. Every 1% increase of INA in a city will augment INA in surrounding cities by 0.43% for the eastern region, while the corresponding figure in the midwest region is 0.39% (Table 6).
Table 6.
Direct and indirect effects.
Owing to TIM being concentrated mainly in the eastern coastal region, TIM specialization shows a significant positive spatial spillover effect only in the eastern region. Local TIM specialisation is conducive to raising the innovation output of surrounding cities. There are two possible reasons for the emergence of this phenomenon. First, because of the rising labour cost and land price, part of TIM industry may need to transfer to surrounding cities with a cost-based comparative advantage. Second, TIM also requires agglomeration of other related non-TIM in neighbouring cities; these two processes enhance the innovation ability of the surrounding cities. Analogously, Lyv et al. [37] found that manufacturing scale brings a significant positive spatial spillover effect on city innovation. Though not statistically significant, we also observe that KIBS specialisation has a negative spatial spillover effect on city innovation [56], which may be caused by the polarisation effect of KIBS. Face-to-face communication and non-market interaction among enterprises is the foundation of KIBS growth and innovation [48], and geographical proximity is still an important factor in determining the location of KIBS [52]. Ultimately, geographical proximity further leads to KIBS being highly concentrated in provincial capital cities, which gradually causes a brain drain from the surrounding cities, thus definitely restraining the innovation output of neighbouring cities.
Concerning the indirect effect of control variables, R and D input shows a positive spatial spillover effect both nationwide and in the midwest region. Local R and D input helps increase the innovation output of the surrounding cities [30,56]. Additionally, the Internet also has a positive spatial spillover effect on innovation nationwide, and local FDI inflow hinders the innovation output of neighbouring cities in the eastern region.
7. Discussion and Conclusions
7.1. Discussion
Empirical studies in the European Union, the United States, the United Kingdom and Canada show that KIBS tends to agglomerate in metropolitan areas, especially in capital cities [8,10,11,12,13,14], which is consistent with the geographical concentration of KIBS in China’s prefecture-level units. KIBS shows a high level of absolute and relative concentration in economically-developed provincial capital cities. However, this paper also finds that the level of KIBS specialisation is above the national average in some border cities of Xinjiang and Inner Mongolia province and in resource-based cities of the northeast region, which may be caused by historical policy; the exploitation of border areas in the northwest region and the construction of a heavy industry base in the northeast region was launched by central government in the 1950s. Population migration and industrial policy under the planned economy system have accelerated urbanisation in these areas. The high level of urbanisation has enlarged the product demand of KIBS, creating a unique geographical concentration pattern of KIBS with a small scale and a certain structural advantage. Even though we observe a mismatch between the geographical concentration pattern of KIBS and TIM in most areas, there are also 9.97% of prefecture-level units with the simultaneous advantages of both KIBS and TIM specialisation. Among them, 23 prefecture-level units are concentrated mainly in the economically-developed and densely-populated urban agglomerations of the Yangtze River Delta, the Pearl River Delta, and Beijing–Tianjin–Hebei. A similar study showed that 22% of EU regions have an employment share of KIS and advanced manufacturing above the EU average value, and 37.64% of these regions are located in the most densely-populated agglomeration areas [36].
In fact, some empirical analyses have confirmed that the service industry specialisation matters more for regional innovation than does manufacturing industry specialisation [74,76]. Our study further distinguishes the impacts of KIBS and TIM specialisation on city innovation and finds that KIBS specialisation is more beneficial to city innovation than TIM specialisation, even in the eastern region, where TIM is highly concentrated. Two factors lead to the different impact of two industries on city innovation. On the one hand, KIBS needs proximity to suppliers and clients to provide professional services [42,48] and geographical proximity determines that the industrial chain of KIBS is spatially clustered. However, economic globalization leads to that every process in the industrial chain of TIM can be spatially separated. The process of R and D and design for TIM is mainly located in developed countries, and the production is mainly carried out in developing countries. Even though the developed countries receive high innovation efficiency from the R and D process of TIM, they cannot achieve the innovative output of the production process. The enterprises of TIM have a low innovation intensity in the developing countries like China, such as transportation equipment manufacturing and computer and other electronic equipment manufacturing. Therefore, whether the industrial chain is spatially clustered or not can influence the difference in the innovation intensity of two industries.
On the other hand, KIBS can significantly stimulate knowledge spillovers of other industries like manufacturing and services industries [10,45]. Financial industry provides financial support for innovation in local manufacturing and service industries, and scientific research and technological service industries supply technical support and services to the innovation of other enterprises locally, for example, Silicon Valley and Zhongguancun Science Park. However, due to the specialized division of labour in the manufacturing industry, the related industries of technology-intensive manufacturing are not necessarily concentrated locally. TIM has a finite impetus to the innovation of other industries locally compared with KIBS. This factor mainly leads to that KIBS specialisation has a stronger impact on city innovation than does TIM.
Another interesting phenomenon is that only KIBS specialisation significantly boosts city innovation in the central and western regions. Actually, the quality in higher education in many provincial capital cities of the midwest region is better than most of prefecture-level cities in the eastern region, such as Wuhan, Chengdu, Chongqing, Xi’an, Hefei, Lanzhou and Changsha City, and so on, which leads to that scientific research and technological service industries significantly stimulate city innovation. Additionally, a significant positive spatial spillover effect of TIM specialisation on city innovation in the eastern region is found using the spatial Durbin model, which means that exogenous interaction effects of manufacturing specialisation on innovation cannot be ignored.
In contrast to the existing research, we combine the geographic concentration and knowledge spillover effects of KIBS with those of TIM, rather than analyse them separately. This paper makes two contributions to the current literature. First, taking the largest developing countries in the world as our case, we compare the spatial differences between the geographic concentration of KIBS and TIM by calculating the absolute and relative concentration coefficients of the two industries, respectively. Second, we attempt to interpret the different impacts of KIBS and TIM specialisation on city innovation, which is of great significance in perfecting the relevant theories of industrial agglomeration and urban innovation.
This empirical analysis puts forward two proposals for policy-makers to consider. First, the development of knowledge-and technology-intensive industries will reduce the consumption of natural resources, decrease pollutant emissions and improve economic efficiency and, consequently, the knowledge economy is much more conducive to boosting regional sustainable development. In terms of sustainable industrial development, even though KIBS is concentrated mainly in the eastern region, the level of its specialisation also needs to be further enhanced. Therefore, it is the eastern region that should accelerate industrial transformation and upgrading and elevate the contribution of KIBS to efficient and sustainable economic growth. Meanwhile, by means of implementing preferential policies, improving traffic conditions and establishing complementary industries, the central and western regions, without advantage of TIM specialisation, should optimize their business environments to undertake the transfer of TIM, ultimately leading to spatial agglomeration of TIM and promoting sustainable industrialization, which is an essential target of sustainable development for underdeveloped regions in Sustainable Development Goals (SDGs). In addition, the advantage of KIBS specialisation may be utilized fully in the transformation of resource-based cities and the development of China’s Silk Road Economic Belt in the future. Second, the industry-oriented innovation mode should also be efficient and intensive, and traditional innovation paradigm argues that innovation should be mainly driven by knowledge-and technology-intensive industries. It is unclear in the existing studies what the difference in the impact of KIBS and TIM specialization on city innovation is. However, our paper finds that the marginal elasticity of TIM in boosting city innovation is lower than that of KIBS. Furthermore, labour and capital-intensive manufacturing industries play a major role in boosting city innovation in China currently. Therefore, it will be necessary to set up a more sustainable innovation mode driven by KIBS in China, simultaneously, increasing the marginal elasticity of innovation output for TIM, especially in the central and western regions.
This research also has three limitations. First, the rules of industrial geography concentration at different scales may differ, and the geographical concentration of knowledge-and technology-intensive industries on a county scale also needs to be examined. Second, our empirical analysis focuses only on the spatial differences between the geographic concentration patterns of KIBS and TIM without revealing the change patterns of geographic concentration of KIBS and TIM, which is the key point of future research. Third, our study interprets the diverse impact of KIBS and TIM specialisation on city innovation; the different influences of KIBS and TIM diversity on urban innovation can be addressed in the future.
7.2. Conclusions
Based on the employment data with a two-digit code in China’s 2010 population Census, this paper compares the spatial difference between the absolute and relative concentrations of knowledge-intensive business service (KIBS) and technology-intensive manufacturing (TIM) in prefecture-level units and reveals the different impact of KIBS and TIM specialization on the innovation of 286 prefecture-level cities. Empirical results indicate that KIBS is concentrated mainly in the provincial capital cities and that the level of KIBS specialisation exceeds the national average in some border cities of the northwestern region and resource-based cities of the northeastern region. Unlike KIBS, TIM is highly concentrated in the Yangtze River Delta, the Pearl River Delta and the Beijing–Tianjin and Shandong Peninsula urban agglomerations. Population urbanization affected by market-oriented factors and historical policy, and transportation cost advantages close to overseas markets, lead to the spatial difference of KIBS and TIM specialisation. KIBS specialisation has a stronger impact on city innovation than does TIM, which is mainly due to that the industrial chain of KIBS is spatially clustered and that KIBS can significantly stimulate knowledge spillovers of other industries locally. However, the industrial chain of TIM is spatially separated, and TIM has a finite impetus to the innovation of other industries locally. Owing to the transfer of TIM to surrounding cities and the cluster of non-technology-intensive manufacturing in neighbouring cities, TIM specialisation shows a significant positive spatial spillover effect on city innovation in the eastern region. Only KIBS specialisation fosters city innovation in the central and western regions, which may be caused by the existance of many famous universities and scientific research institutes in the provincial capital cities of the midwest region.
Author Contributions
Conceptualization, methodology, formal analysis and writing-original draft preparation: H.Q.; writing—review and editing, methodology and funding acquisition: S.L.; writing—review and editing, and formal analysis: W.Q.; writing—review and editing: Z.L.
Funding
This research was funded by the Strategic Priority Research Program of the Chinese Academy of Sciences, grant No. XDA19040402, and the National Natural Science Foundation of China, grant No. 71433008 and 41771180.
Acknowledgments
The authors are grateful for the reviewers and the editor.
Conflicts of Interest
The authors declare no conflict of interest in this paper.
References
- National Science Foundation. Science and Engineering Indicators; National Science Foundation: Alexandria, VA, USA, 2018. [Google Scholar]
- National Science Foundation. Science and Engineering Indicators; National Science Foundation: Alexandria, VA, USA, 2016. [Google Scholar]
- Zhang, C. Agglomeration of knowledge intensive business services and urban productivity. Pap. Reg. Sci. 2016, 95, 801–818. [Google Scholar] [CrossRef]
- Bonvillian, W.B. Advanced manufacturing policies and paradigms for innovation. Science 2013, 342, 1173–1175. [Google Scholar] [CrossRef] [PubMed]
- Wood, P. Flexible accumulation and the rise of business services. Trans. Inst. Br. Geogr. 1991, 16, 160–172. [Google Scholar] [CrossRef]
- Coffey, W.; Drolet, R.; Polèse, M. The intrametropolitan location of high order services: Patterns, factors and mobility in Montreal. Pap. Reg. Sci. 1996, 75, 293–323. [Google Scholar] [CrossRef]
- Rubalcaba, L.; Gallego, J.; Gallo, M.T.; Garrido, R. Business services location and market factors in major European cities. Cities 2013, 31, 258–266. [Google Scholar] [CrossRef]
- Shearmur, R.; Doloreux, D. Urban Hierarchy or Local Buzz? High-Order Producer Service and (or) Knowledge-Intensive Business Service Location in Canada, 1991–2001. Prof. Geogr. 2008, 60, 333–355. [Google Scholar] [CrossRef]
- Wernerheim, C.M.; Sharpe, C. ‘High Order’ Producer Services in Metropolitan Canada: How Footloose Are They? Reg. Stud. 2003, 37, 469–490. [Google Scholar] [CrossRef]
- Corrocher, N.; Cusmano, L. The ‘KIBS Engine’ of Regional Innovation Systems: Empirical Evidence from European Regions. Reg. Stud. 2014, 48, 1212–1226. [Google Scholar] [CrossRef]
- Gallego, J.; Maroto, A. The Specialization in Knowledge-Intensive Business Services (KIBS) across Europe: Permanent Co-Localization to Debate. Reg. Stud. 2013, 49, 644–664. [Google Scholar] [CrossRef]
- Merino, F.; Rubalcaba, L. Are Knowledge-intensive Services Highly Concentrated? Evidence from European Regions. Tijdschr. Voor Econ. En Soc. Geogr. 2013, 104, 215–232. [Google Scholar] [CrossRef]
- Gong, H. A Hierarchical Change Model of Business and Professional Services in the United States. Urban Geogr. 2013, 22, 340–359. [Google Scholar] [CrossRef]
- Chadwick, A.; Glasson, J.; Smith, H.L. Employment Growth in Knowledge-Intensive Business Services in Great Britain during the 1990s—Variations at the Regional and Sub-Regional Level. Local Econ. J. Local Econ. Policy Unit 2008, 23, 6–18. [Google Scholar] [CrossRef]
- Shi, X.; Wu, Y.; Zhao, D. Knowledge intensive business services and their impact on innovation in China. Serv. Bus. 2014, 8, 479–498. [Google Scholar] [CrossRef]
- Fang, Y.; Bi, D.; Xie, M.; Lin, Z. Spatial Correlation Characteristics and Dynamic Mechanism of Knowledge Intensive Business Service: A Spatial Econometric Analysis of Guangdong Province. Sci. Geogr. Sin. 2014, 34, 1193–1201. (In Chinese) [Google Scholar] [CrossRef]
- Ren, G.; Jiang, T. The Agglomeration and Reasons of Knowledge-Intensive Business Service in Yangtze River Delta Region. Econ. Geogr. 2015, 35, 85–91. (In Chinese) [Google Scholar] [CrossRef]
- Zheng, C.; Hao, X.; Cheng, S.; Jiang, T. Spatial Agglomeration of Knowledge-Intensive Business Services in Zhejiang Province and Its Determinants: Spatial Statistical Survey and Econometric Analysis Based on Data of 69 Cities and Counties. Econ. Geogr. 2017, 37, 121–128. (In Chinese) [Google Scholar] [CrossRef]
- Alecke, B.; Alsleben, C.; Scharr, F.; Untiedt, G. Are there really high-tech clusters? The geographic concentration of German manufacturing industries and its determinants. Ann. Reg. Sci. 2006, 40, 19–42. [Google Scholar] [CrossRef]
- Alonso-Villar, O.; Chamorro-Rivas, J.-M.; González-Cerdeira, X. Agglomeration economies in manufacturing industries: The case of Spain. Appl. Econ. 2004, 36, 2103–2116. [Google Scholar] [CrossRef]
- Audretsch, D.B.; Feldman, M.P. R&D spillovers and the geography of innovation and production. Am. Econ. Rev. 1996, 86, 630–640. [Google Scholar]
- Devereux, M.P.; Griffith, R.; Simpson, H. The geographic distribution of production activity in the UK. Reg. Sci. Urban Econ. 2004, 34, 533–564. [Google Scholar] [CrossRef]
- Hong, J.; Fu, S. Information and communication technologies and the geographical concentration of manufacturing industries: Evidence from China. Urban Stud. 2011, 48, 2339–2354. [Google Scholar] [CrossRef]
- Liu, Z. Global and Local: Measuring Geographical Concentration of China’s Manufacturing Industries. Prof. Geogr. 2014, 66, 284–297. [Google Scholar] [CrossRef]
- Wang, C.C.; Lin, G.C.S.; Li, G. Industrial Clustering and Technological Innovation in China: New Evidence from the ICT Industry in Shenzhen. Environ. Plan. A Econ. Space 2010, 42, 1987–2010. [Google Scholar] [CrossRef]
- Fan, C.C.; Scott, A.J. Industrial agglomeration and development: A survey of spatial economic issues in East Asia and a statistical analysis of Chinese regions. Econ. Geogr. 2003, 79, 295–319. [Google Scholar] [CrossRef]
- Glaeser, E.L.; Kallal, H.D.; Scheinkman, J.A.; Andrei, S. Growth in cities. J. Political Econ. 1992, 100, 1126–1152. [Google Scholar] [CrossRef]
- Jacobs, J. The Economy of Cities; Random House: New York, NY, USA, 1969. [Google Scholar]
- Porter, M.P. The Comparative Advantage of Nations; The Free Press: New York, NY, USA, 1990. [Google Scholar]
- Ning, L.; Wang, F.; Li, J. Urban innovation, regional externalities of foreign direct investment and industrial agglomeration: Evidence from Chinese cities. Res. Policy 2016, 45, 830–843. [Google Scholar] [CrossRef]
- Buerger, M.; Cantner, U. The regional dimension of sectoral innovativeness: An empirical investigation of two specialized suppliers and two science-based industries. Pap. Reg. Sci. 2011, 90, 373–393. [Google Scholar] [CrossRef]
- Ejermo, O. Technological Diversity and Jacobs’ Externality Hypothesis Revisited. Growth Chang. 2005, 36, 167–195. [Google Scholar] [CrossRef]
- Henderson, V.; Kuncoro, A.; Turner, M. Industrial Development in Cities. J. Political Econ. 1995, 103, 1067–1090. [Google Scholar] [CrossRef]
- Feldman, M.P.; Audretsch, D.B. Innovation in cities: Science-based diversity, specialization and localized competition. Eur. Econ. Rev. 1999, 43, 409–429. [Google Scholar] [CrossRef]
- Wang, Y.; Ning, L.; Li, J.; Prevezer, M. Foreign Direct Investment Spillovers and the Geography of Innovation in Chinese Regions: The Role of Regional Industrial Specialization and Diversity. Reg. Stud. 2016, 50, 805–822. [Google Scholar] [CrossRef]
- Capello, R.; Caragliu, A.; Lenzi, C. Is innovation in cities a matter of knowledge-intensive services? An empirical investigation. Innov. Eur. J. Soc. Sci. Res. 2012, 25, 151–174. [Google Scholar] [CrossRef]
- Lyv, L.; Sun, F.; Huang, R. Innovation-based urbanization: Evidence from 270 cities at the prefecture level or above in China. Acta Geogr. Sin. 2018, 73, 1910–1922. (In Chinese) [Google Scholar] [CrossRef]
- Peng, X.; Jiang, C.H. Industrial Agglomeration, Technological Spillovers and Regional Innovation: Evidences from China. China Econ. Q. 2011, 10, 913–934. (In Chinese) [Google Scholar] [CrossRef]
- Koo, J. Determinants of Localized Technology Spillovers: Role of Regional and Industrial Attributes. Reg. Stud. 2007, 41, 995–1011. [Google Scholar] [CrossRef]
- Santamaría, L.; Nieto, M.J.; Barge-Gil, A. Beyond formal R&D: Taking advantage of other sources of innovation in low-and medium-technology industries. Res. Policy 2009, 38, 507–517. [Google Scholar] [CrossRef]
- Moreno, R.; Paci, R.; Usai, S. Innovation Clusters in the European Regions. Eur. Plan. Stud. 2006, 14, 1235–1263. [Google Scholar] [CrossRef]
- Kekezi, O.; Klaesson, J. Agglomeration and innovation of knowledge intensive business services. Ind. Innov. 2019, 1–24. [Google Scholar] [CrossRef]
- Mas-Verdú, F.; Wensley, A.; Alba, M.; García Álvarez-Coque, J.M. How much does KIBS contribute to the generation and diffusion of innovation? Serv. Bus. 2011, 5, 195. [Google Scholar] [CrossRef]
- Muller, E.; Zenker, A. Business services as actors of knowledge transformation: The role of KIBS in regional and national innovation systems. Res. Policy 2001, 30, 1501–1516. [Google Scholar] [CrossRef]
- Smith, K. What is the’ knowledge economy’. In Knowledge-Intensive Industries and Distributed Knowledge Bases; University of Western Sydney; AEGIS: Sydney, Australia, 2000. [Google Scholar]
- Liu, S. The relationship between strategic type and new service development competence: A study of Chinese knowledge intensive business services. Serv. Bus. 2012, 6, 157–175. [Google Scholar] [CrossRef]
- Tether, B.; Hipp, C. Competition and innovation amongst knowledge-intensive and other service firms: Evidence from Germany. In Knowledge and Innovation in the New Service Economy; Edward Elgar Publishing: Cheltenham, UK, 2000; pp. 49–67. [Google Scholar]
- Glaeser, E.L.; Scheinkman, J. Non-Market Interactions; National Bureau of Economic Research: Cambridge, MA, 2000. [Google Scholar]
- Ó Huallacháin, B.; Lee, D.-S. Technological Specialization and Variety in Urban Invention. Reg. Stud. 2011, 45, 67–88. [Google Scholar] [CrossRef]
- Ning, L.; Wang, F. Does FDI Bring Environmental Knowledge Spillovers to Developing Countries? The Role of the Local Industrial Structure. Environ. Resour. Econ. 2018, 71, 381–405. [Google Scholar] [CrossRef]
- Lim, U. Knowledge spillovers, agglomeration economies, and the geography of innovative activity: A spatial econometric analysis. Rev. Reg. Stud. 2004, 34, 11–36. [Google Scholar]
- Isaksen, A. Knowledge-based Clusters and Urban Location: The Clustering of Software Consultancy in Oslo. Urban Stud. 2004, 41, 1157–1174. [Google Scholar] [CrossRef]
- Griliches, Z. Issues in assessing the contribution of research and development to productivity growth. Bell J. Econ. 1979, 10, 92–116. [Google Scholar] [CrossRef]
- Jaffe, A.B. Real effects of academic research. Am. Econ. Rev. 1989, 79, 957–970. [Google Scholar]
- Wang, C.C.; Wu, A. Geographical FDI knowledge spillover and innovation of indigenous firms in China. Int. Bus. Rev. 2016, 25, 895–906. [Google Scholar] [CrossRef]
- Ma, J.; Deng, H.; Cai, A. Analysis on City Innovation Output of Space-Time Distribution Pattern and Influential Factors in China: Empirical Analysis of 285 Cities in China. Sci. Sci. Manag. S T 2017, 38, 12–25. (In Chinese) [Google Scholar]
- He, S.B.; Du, D.B.; Jiao, M.Q.; Lin, Y. Spatial-Temporal Characteristics of Urban Innovation Capability and Impact Factors Analysis in China. Sci. Geogr. Sin. 2017, 37, 1014–1022. (In Chinese) [Google Scholar] [CrossRef]
- Hao, Y.J.; Cheng, S.N. Industrial Agglomeration, Technological Innovation and Economic Growth of Urban Agglomeration in the Middle Reaches of Yangtze River—Based on the Perspective of Heterogeneous Industrial Agglomeration and Co-agglomeration. J. Ind. Technol. Econ. 2019, 38, 41–48. (In Chinese) [Google Scholar] [CrossRef]
- Miles, I.; Kastrinos, N.; Bilderbeek, R.; den Hertog, P.; Flanagan, K.; Huntink, W. Knowledge-Intensive Business Services: Their Role as Users, Carriers and Sources of Innovation; Report to the EC DG XIII Luxembourg; Sprint EIMS Programme; European Commission: Brussels, Belgium, 1995. [Google Scholar]
- OECD. Structural Analysis Statistics [EB/OL]. Available online: http://www.oecdilibrary.org/oecd/content/datacollection/stan-data-en (accessed on 7 April 2007).
- Yang, L.G.; Xie, R.; Zheng-Chu, H.E.; Han, F.; Sun, Y.L. Research on the Impact of Rising Labor Cost on Manufacturing Structure Upgrading—An Empirical Analysis Based on the Data of Sub-sectors of Chinese Manufacturing. China Soft Sci. 2014, 12, 136–147. (In Chinese) [Google Scholar]
- Jiang, J.; Liu, z.; Yu, M. Producer Services Development and Manufacturing Efficiency Improvement: An Empirical Analysis Based on Regional and Industry Panel Data. J. World Econ. 2007, 8, 52–62. (In Chinese) [Google Scholar] [CrossRef]
- Wang, G.X.; Li, M. The Spatial Interaction between Inter-provincial Migration and Manufacturing Industry Transfer. Sci. Geogr. Sin. 2019, 39, 183–194. (In Chinese) [Google Scholar] [CrossRef]
- He, C.; Wei, Y.H.D.; Pan, F. Geographical Concentration of Manufacturing Industries in China: The Importance of Spatial and Industrial Scales. Eurasian Geogr. Econ. 2007, 48, 603–625. [Google Scholar] [CrossRef]
- Lin, S.-W.; Ben, T.-M. Impact of government and industrial agglomeration on industrial land prices: A Taiwanese case study. Habitat Int. 2009, 33, 412–418. [Google Scholar] [CrossRef]
- Mukkala, K. Agglomeration economies in the finnish manufacturing sector. Appl. Econ. 2004, 36, 2419–2427. [Google Scholar] [CrossRef]
- O’Donoghue, D.; Gleave, B. A Note on Methods for Measuring Industrial Agglomeration. Reg. Stud. 2004, 38, 419–427. [Google Scholar] [CrossRef]
- Elhorst, J.P. Spatial Econometrics: From Cross-Sectional Data to Spatial Panels; Springer: Heidelberg, Germany, 2014. [Google Scholar]
- Qi, W.; Liu, S.H.; Jin, H.R. Calculation method and spatial pattern of urbanization rate of registered population in China. Geogr. Res. 2017, 36, 616–632. (In Chinese) [Google Scholar] [CrossRef]
- Wang, K.; Li, H.T.; Zhang, Q.; Xu, H. Reflection on the Connotation and Path of New Urbanization in Xinjiang. Urban Plan. Forum 2017, 8, 111–115. (In Chinese) [Google Scholar] [CrossRef]
- Zheng, D.; Kuroda, T. The impact of economic policy on industrial specialization and regional concentration of China’s high-tech industries. Ann. Reg. Sci. 2012, 50, 771–790. [Google Scholar] [CrossRef]
- Guerrieri, P.; Meliciani, V. Technology and international competitiveness: The interdependence between manufacturing and producer services. Struct. Chang. Econ. Dyn. 2005, 16, 489–502. [Google Scholar] [CrossRef]
- Liu, P.; Zhang, Y. Industrial Agglomeration, FDI and Urban Innovation Capability—Spatial Durbin Model Based on the Data of 264 Prefecture-level Cities in China. East China Econ. Manag. 2017, 31, 56–65. (In Chinese) [Google Scholar] [CrossRef]
- Wu, F.H.; Liu, R.M. Industrial Upgrading and Independent Innovation Ability Construction—Empirical Research Based on China’s Provincial Panel Data. China Ind. Econ. 2013, 57–69. (In Chinese) [Google Scholar] [CrossRef]
- Lu, Z.Y.; Liao, S.S. Dual-threshold Effect about Technology Spillovers of FDI and the Difference of Regional Innovation Capability. J. Quant. Tech. Econ. 2012, 29, 75–88. (In Chinese) [Google Scholar] [CrossRef]
- Sun, Y.K.; Sun, T.S.; Xi, Q.M. Influence factors and spillover effect of the innovation agglomeration in Beijing. Geogr. Res. 2017, 36, 2419–2431. (In Chinese) [Google Scholar] [CrossRef]


© 2019 by the authors. Licensee MDPI, Basel, Switzerland. This article is an open access article distributed under the terms and conditions of the Creative Commons Attribution (CC BY) license (http://creativecommons.org/licenses/by/4.0/).