6.1. Research Methodology
Considering all the above-mentioned associations between quality of life and green spaces, we have developed a quantitative research method in order to identify the degree to which citizens associate park activities with their quality of life. The present research is focusing on the subjective assessment made directly by respondents. The latest Eurofound study about QoL shows how a high proportion of people are reporting difficulties in terms of access to recreational areas in countries like Romania, Portugal or Malta, as it can be seen in
Table 1. Comparing Romania’s percentage, 29% (highest in EU), with that of Nordic countries (3–4%) motivated us to conduct an applied research focused on Romanian parks.
We have chosen Herăstrău, Cișmigiu and Carol I parks, the three biggest parks in Bucharest, the country’s capital, for two reasons. First of all, these parks are managed by the City Hall, which allows us to make a series of common recommendations at the end of this paper, recommendations that can lead to an increased collaboration between citizens and government representatives, the best way to discover long-term and sustainable working systems. Second of all, being the biggest parks in Romania, approaching these three parks gives us a broader perspective in terms of visitors’ segmentation.
The present research was developed around the main QoL dimensions associated with green spaces and recreational areas—health (mental and physical), social interaction, education and culture, family life, freedom, connection with nature. These dimensions were integrated among the following research objectives:
Degree of perceived association between QoL dimensions and park visit;
Mental associations made with parks by their visitors (the first thing that comes to their mind when thinking about a specific park);
Visiting parks habits (frequency and duration of the visit);
Reasons to visit parks;
Factors that will lead to an increased frequency of park visits.
As a research method, we have chosen the survey, conducting face-to-face interviews in parks (CAPI-computer assisted personal interview), with a total of 1200 respondents, for a ±3% margin of error and a 95% confidence level. Being a representative survey, the sample was structured based on age, income and gender (using the current data from the National Institute of Statistics [
35]), in order to correspond to the area’s population structure. Also, we took into consideration the park area in which visitors spend their time, thus the research was structured specifically to cover all the important entrances of Herăstrău, Cișmigiu and Carol I parks.
6.2. Research Results
The starting point in this research was represented by the QoL dimensions and their relationship to park visits, in the opinion of people who included this kind of activities in their spare time. As it can be seen in
Figure 1 and
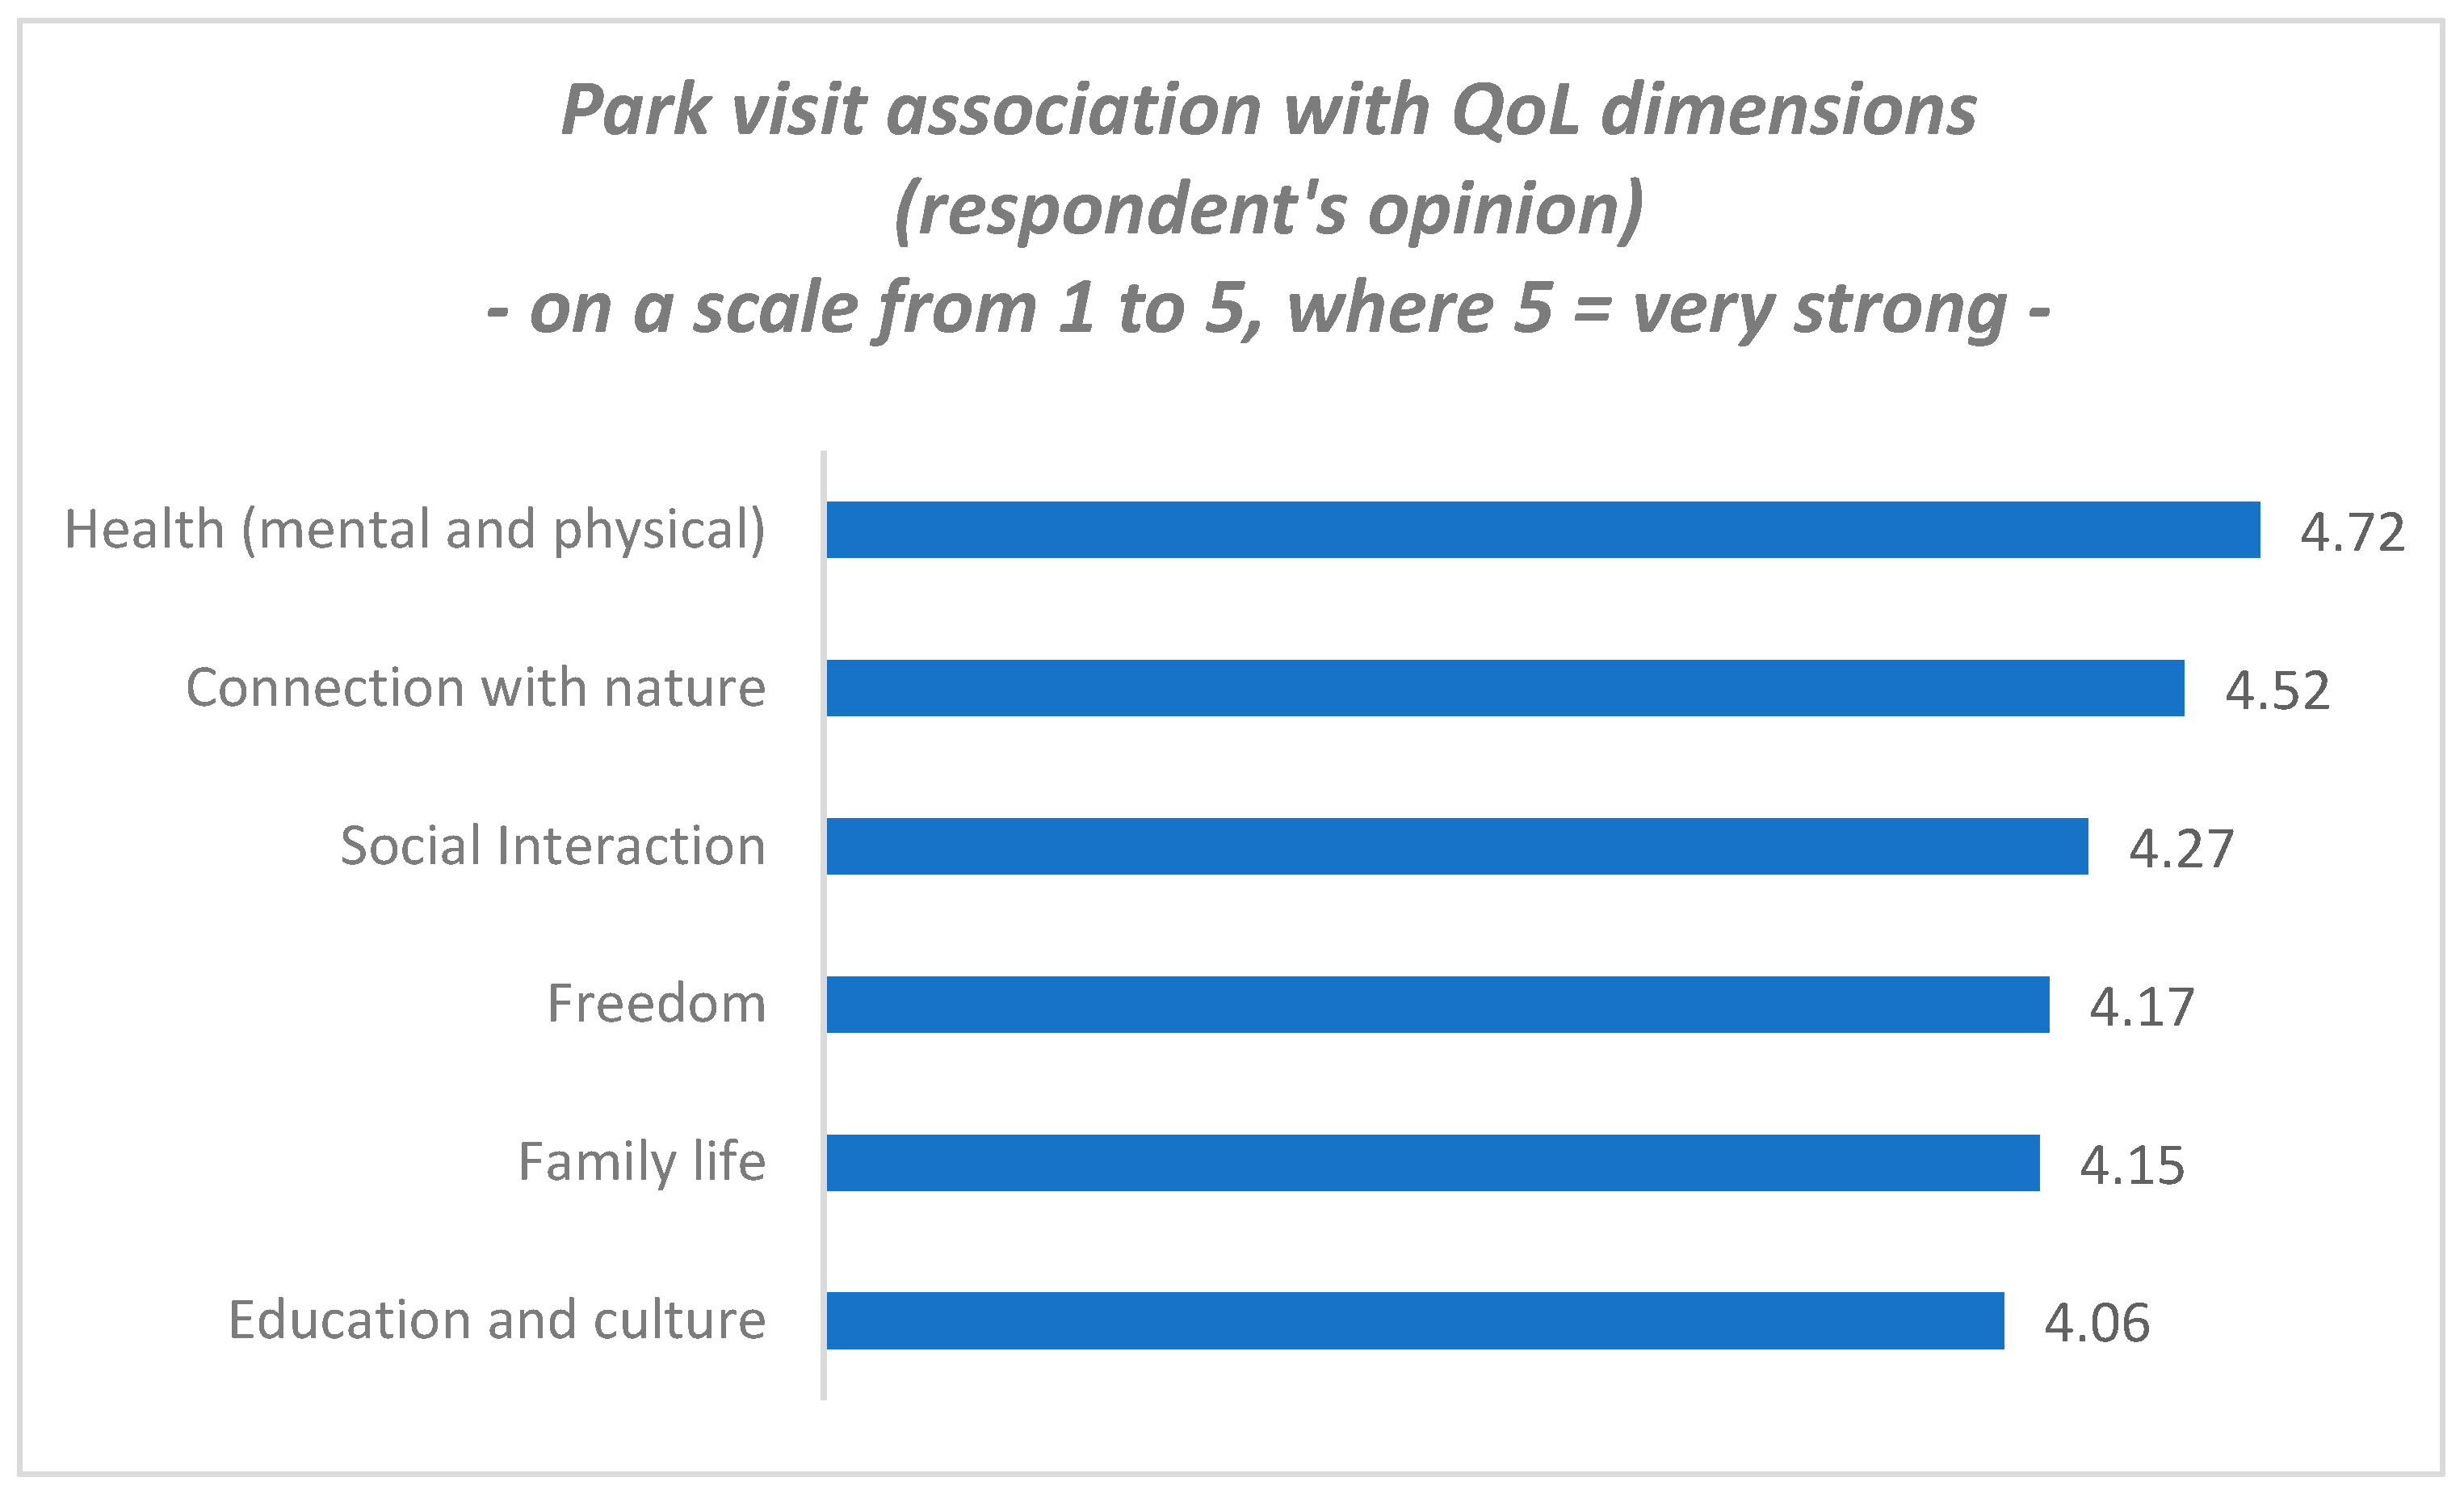
Table 2, the highest degree of perceived association, on a scale from 1 to 5 (where 5 means very strong), is with mental and physical health—4.72. Although we would have expected the connection with nature would be the strongest, health is the most important QoL dimension overall, which makes people consider it first when deciding on everyday life activities.
All six dimensions have high coefficients for perceived association with park visits, result which allows us to state that there is a:
Very strong association with health and nature;
Strong association with social interaction, freedom, family life, as well as education and culture.
These associations are based on the park’s image in the consumer’s mind, considering that the decision-making process always starts from the already known aspects which influence the way people see and consider products, services, organizations and other options in their life. This is the reason why we asked respondents to tell us the first things that came to their minds when thinking about parks. As can be seen in
Table 3, most often people associate parks with nature (23.1%), followed by history/tradition (12.4%) and relaxation (11.6%). Even though health was not directly mentioned by respondents, this can be caused by the fact that health is seen as a result of box-checking the other dimensions, especially if we talk about mental health.
These associations must be, for starters, understood in a general manner, as they represent the average description for the general park visitor. However, there are some differences when we make a segmentation based on park visit frequency and duration. As it can be seen in
Table 4 and
Table 5, before discussing the differences, we have tested the statistical significance of such correlations and in all cases we have less than 0.05 for the
p-value, which indicates that the differences are statistically significant. Although the Spearman test did not lead to high correlation coefficients, the crosstab shows that, as the frequency and duration of park visit decreases, so does the degree of association between parks and quality of life. This result can be interpreted in two ways: first, the more people visit the park, the better they perceive the association between different aspects of parks and their quality of life; and second, in a reverse logic, the higher the association, the more often people visit parks. Both interpretations can have a major impact on future sustainable public policies, if they are developed within a collaborative setting between citizens and government representatives, as people will see the impact of their decisions in park development, thus leading to an increase in park visit frequency and a stronger perceived association with quality of life.
In order to better understand the individual’s approach to park visits, we have asked respondents to describe the reasons for which they visit parks. We can see in
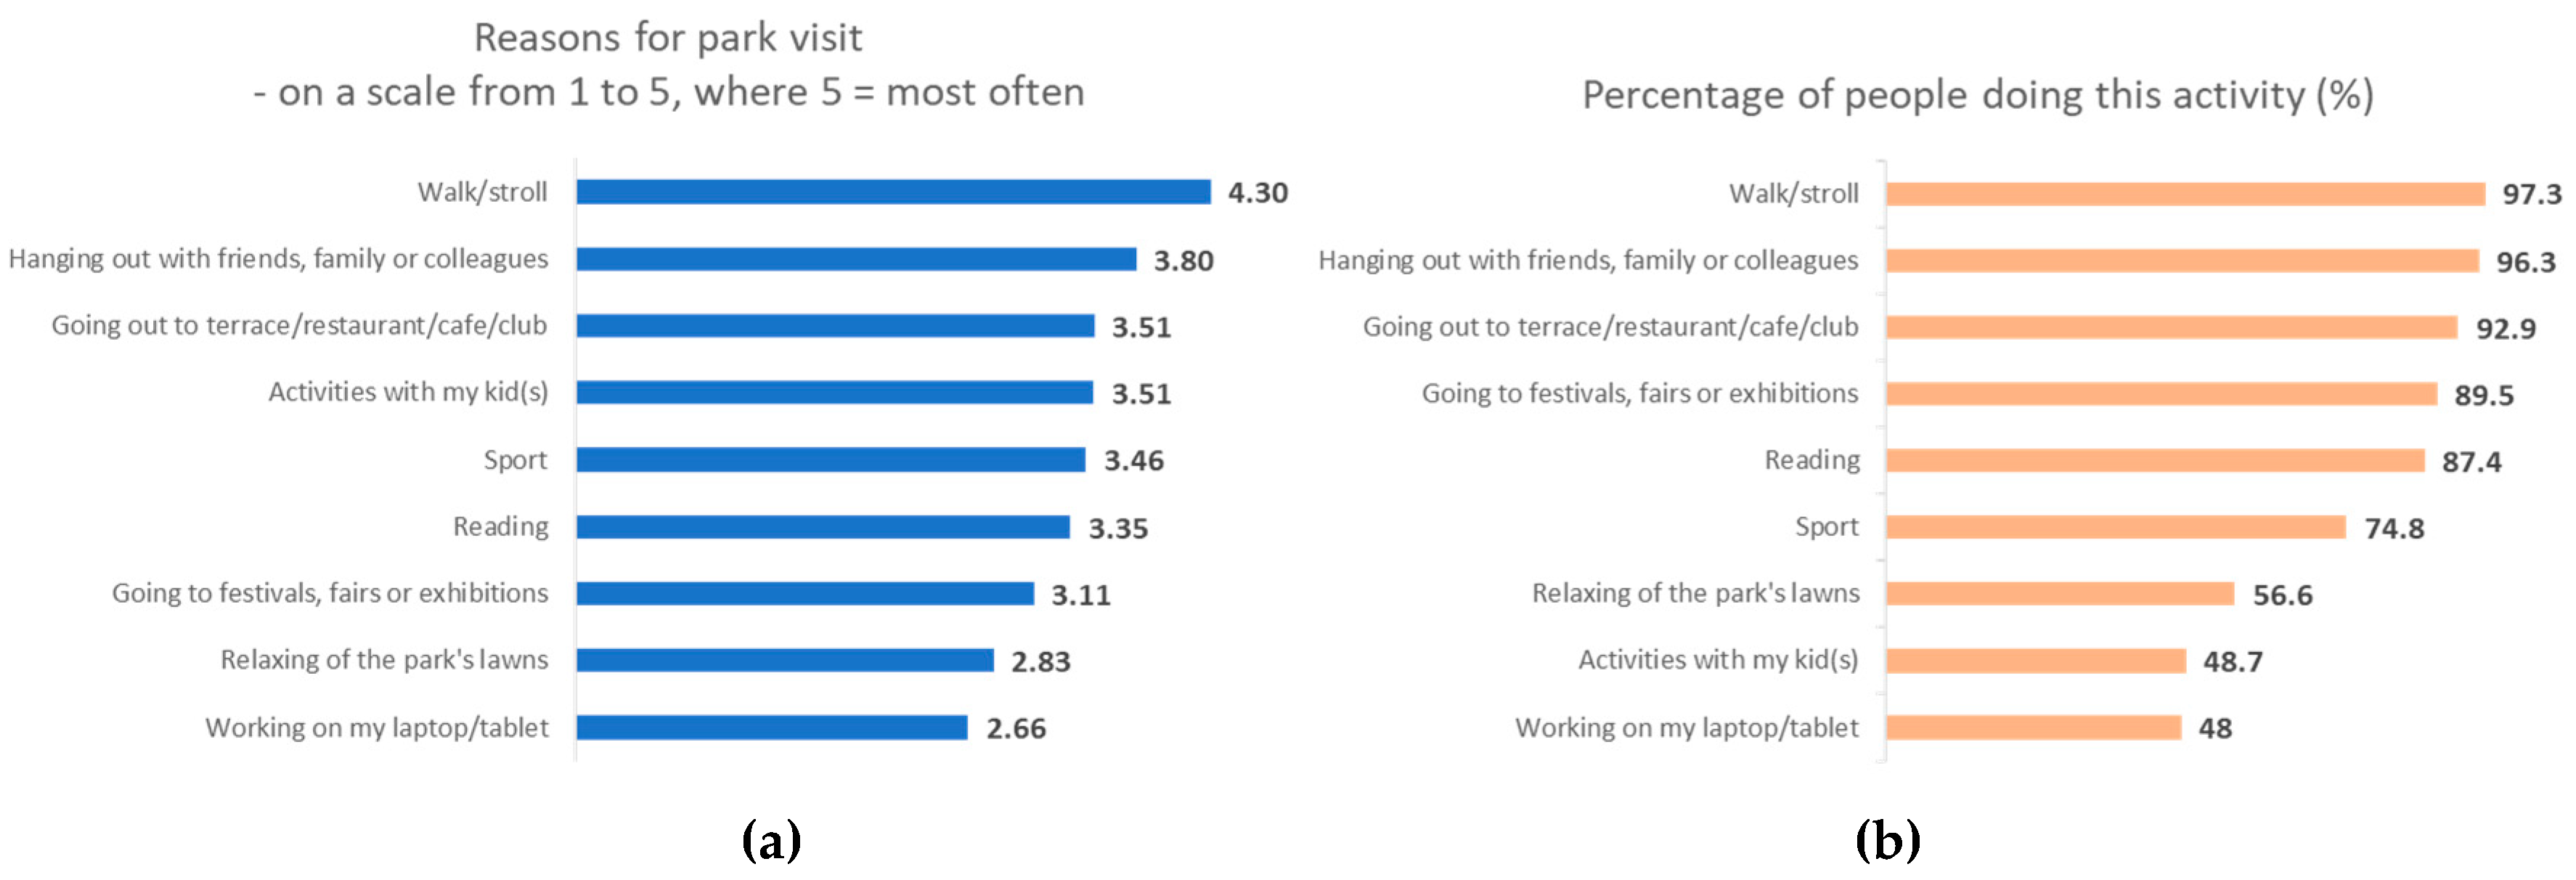
Figure 2a (average mean for visits’ frequency on a scale from 1 to 5) and
Figure 2b (percentage of people) that walking is the most common activity (97.3% of respondents chose it, with a frequency of 4.3), followed by three socially-related activities—hanging out, going to restaurants and spending time with kids. Sport, another health-related QoL activity, alongside walking, is done by ¾ of park visitors, being in 5th place in terms of frequency.
Education and cultural activities, such as reading and going to festivals, have a high percentage in terms of activities done in parks (87.4% and 89.5%, respectively), but a medium score in terms of frequency (3.35 and 3.11). This means that, by including people in the decision-making process of cultural agendas for parks (what type of events should be there, when, how they can be organized, how can visitors participate in the cultural activities, etc.), we can increase the frequency of park visits.
One activity that is directly related to a park’s purpose—relaxing on the park’s lawns—is at the bottom of the list, both in terms of percentage of people doing it and frequency. From a historical point of view, this situation has deep influences from the communist era, when people were not allowed to step on the grass. As no one told them otherwise since then, people tend to avoid such a potential-conflict type of behavior in parks. The sustainable development of parks should take into consideration this part, as it is directly correlated to one of the main QoL dimension—connection with nature—and involve citizens in an educational campaign about visitors’ behavior in parks.
Parks are also important to family life, as we see high frequency for activities related to this—hanging out with family members and doing special activities with kids. Being an important QoL indicator, family life has a major impact on decisions about everyday life activities, thus making parks more welcoming for families should represent a priority for local authorities.
As an open space, the park offers its visitors a higher degree of freedom, where they can express in a personal manner, do things they love and adapt must-do activities, so they become more pleasant, like working on laptops in the park. Although we see that activities related to freedom are not yet so obviously related to parks, this aspect of our life should be exploited in a positive way, giving people the certainty that they can really feel free in parks, in correlation to free access to park’s lawns, cultural activities of self-expression and adapting park components to visitors’ needs (such as skateparks, off-road tracks, yoga corners, painting and sculpture workshops).
From this analysis we can distinguish an association between activities done in parks and quality of life dimensions, some of them having multiple connections, not just with only one dimension (as will be presented in the final conceptual model of this paper).
All of the above-mentioned recommendations in terms of QoL dimensions and their related activities done by park’s visitors are also supported by citizens’ proposals when asked what could make them come more often to parks. As seen in
Table 6, besides the obvious need for cleanliness, there are also proposals about cultural and sport activities, quietness, as well as family-time-related aspects.
The results obtained from this research led us to the development of a conceptual model which links quality of life, through some of its dimensions, to park visits (analyzed separately through specific activities), as it can be seen in
Figure 3.
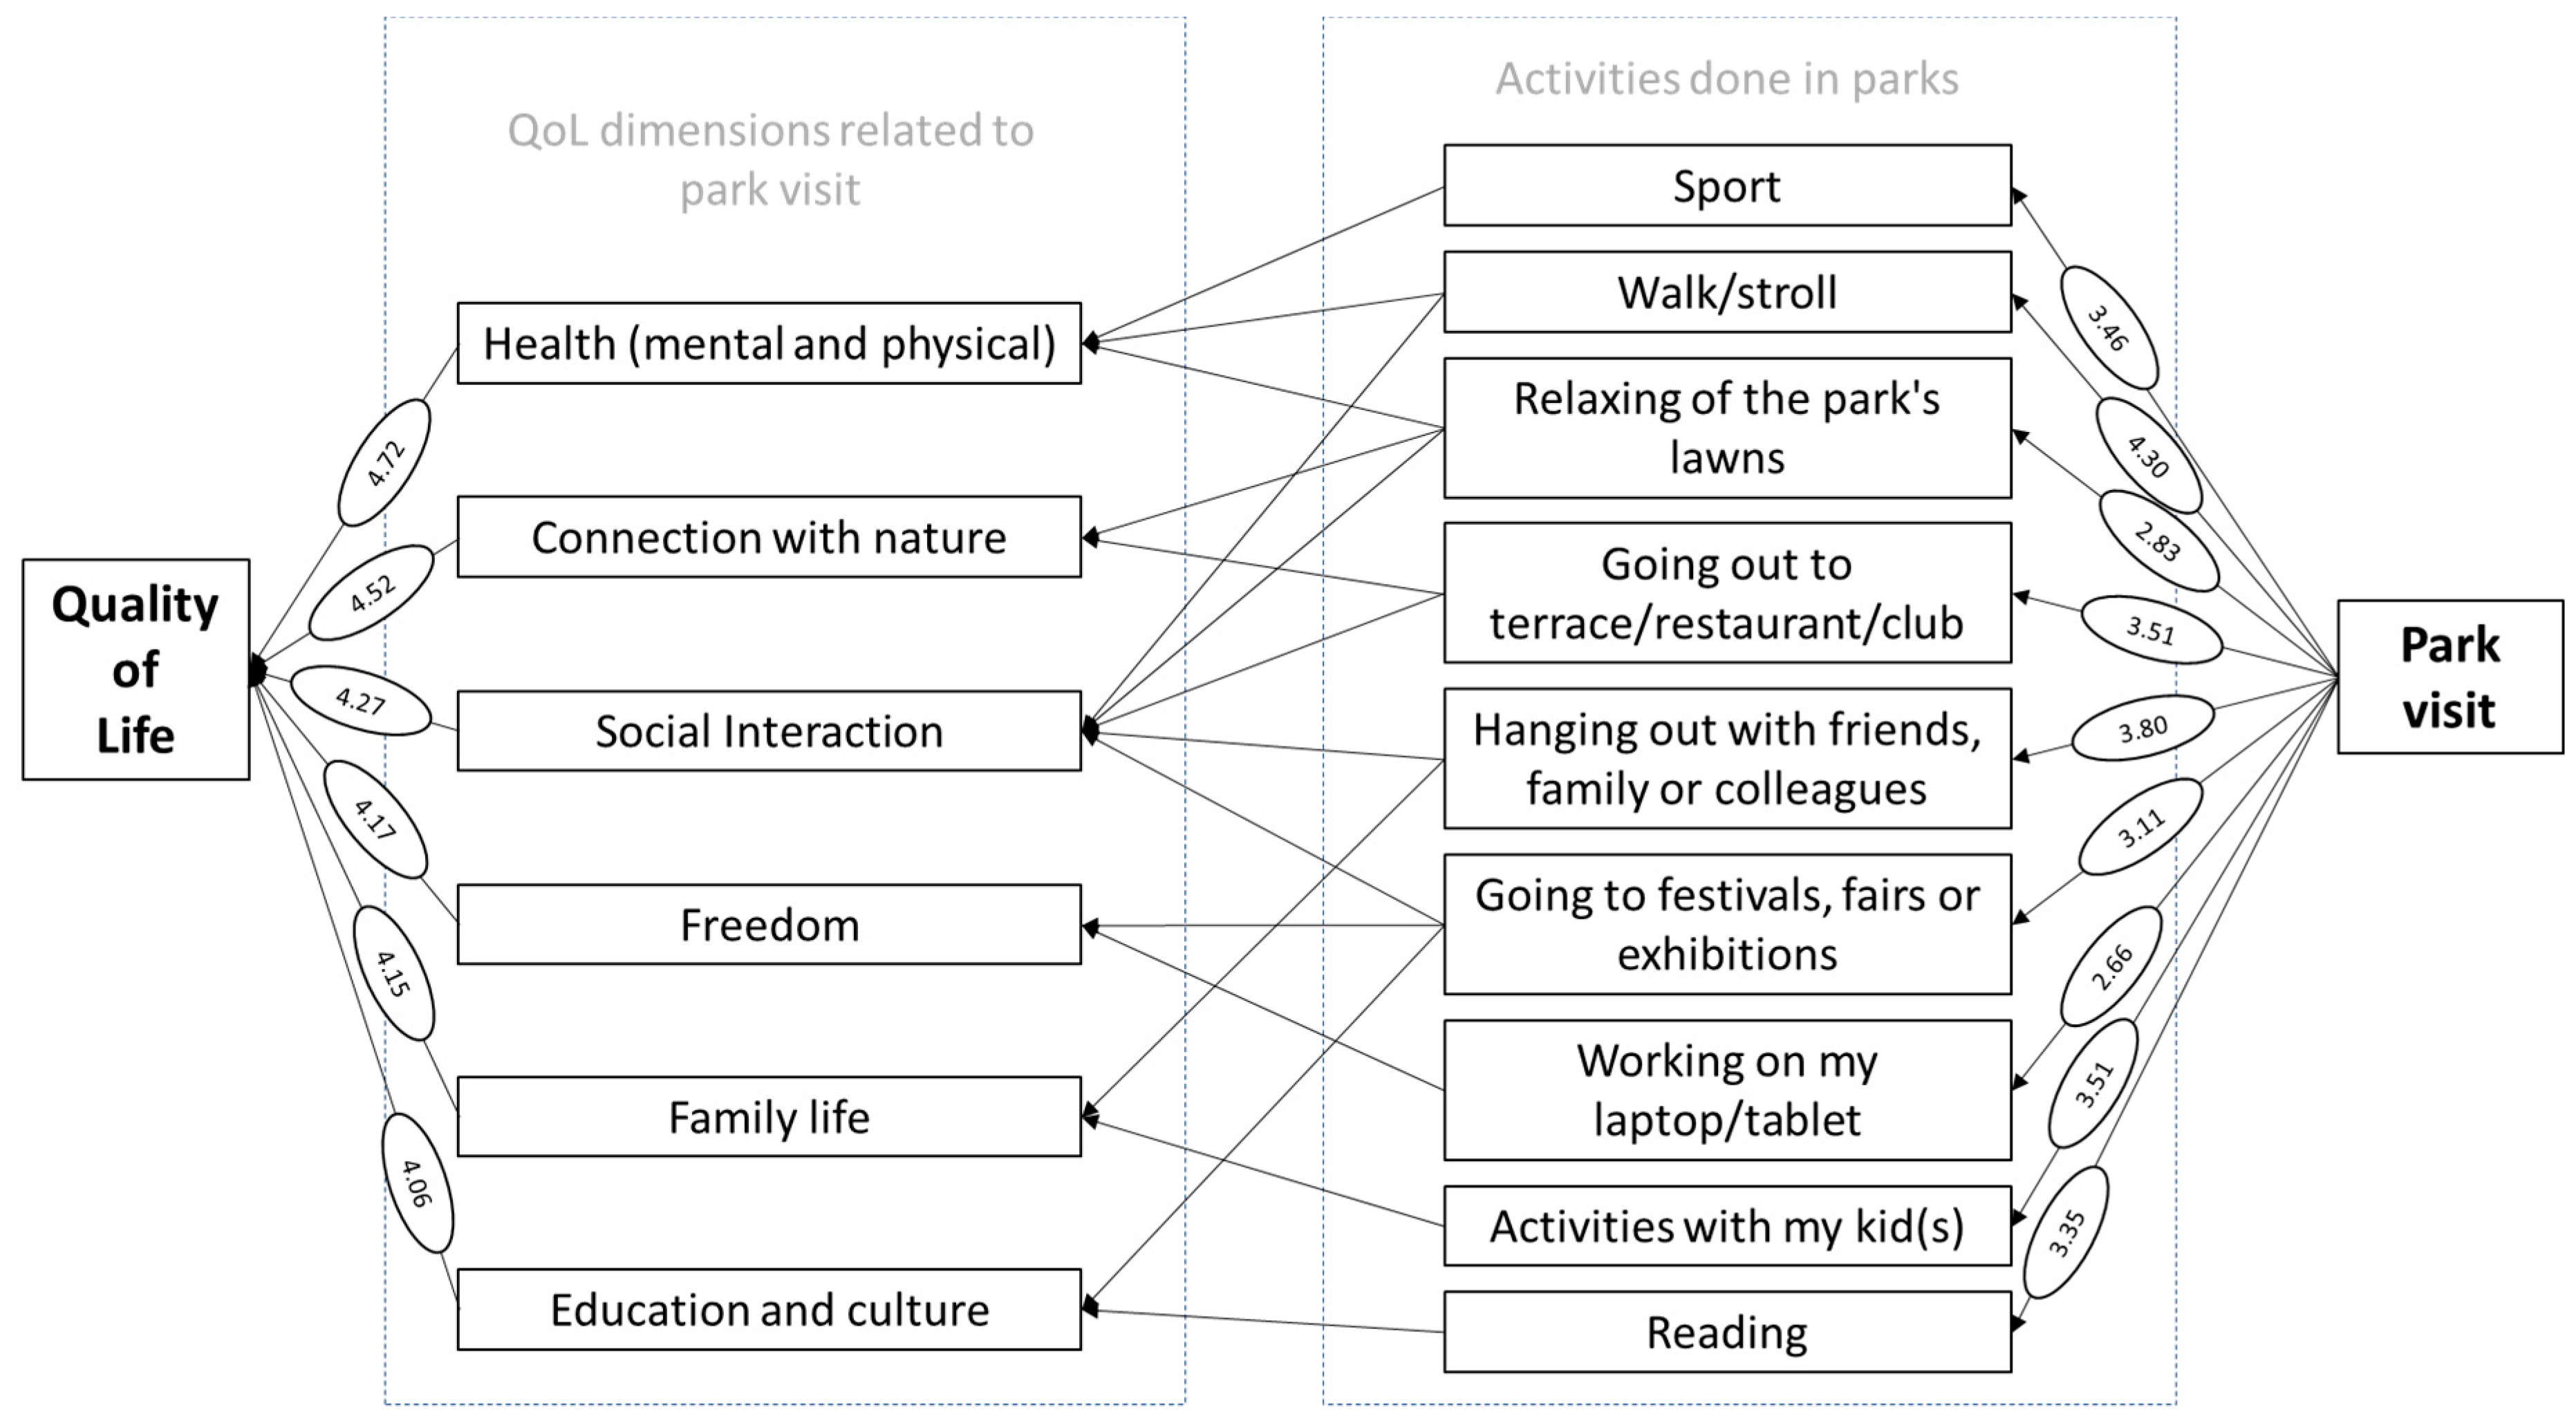
Starting from left to right, one can firstly observe the degree of perceived association of each QoL dimension to park visits, from the highest (health, with 4.72) to the lowest (education and culture, with 4.05). These dimensions are afterwards linked to specific activities done in parks, where the following perceived associations can be found:
Health (mental and physical)—sport, walk/stroll and relaxing on park’s lawns
Connection with nature—relaxing on park’s lawns and going out to terrace/restaurant/club
Social interaction—walk/stroll, relaxing on park’s lawns, going out to terrace/restaurant/club, hanging out with friends, family or colleagues and going to festivals, fairs or exhibitions
Freedom—going to festivals, fairs or exhibitions and working on my laptop/tablet
Family life—hanging out with friends, family or colleagues and activities with my kid(s)
Education and culture—going to festivals, fairs or exhibitions and reading.
In the right part of the model are the average means of each activity’s frequency (on a scale from 1 to 5, where 5 means very often). This coefficient, as commented in
Figure 2a, indicates the importance of each aspect on the park visit decision-making process, where a collaborative public policy for sustainable development can enhance the potential of each activity for quality of life improvement.


