Carbon Mitigation Strategies of Port Selection and Multimodal Transport Operations—A Case Study of Northeast China
Abstract
:1. Introduction
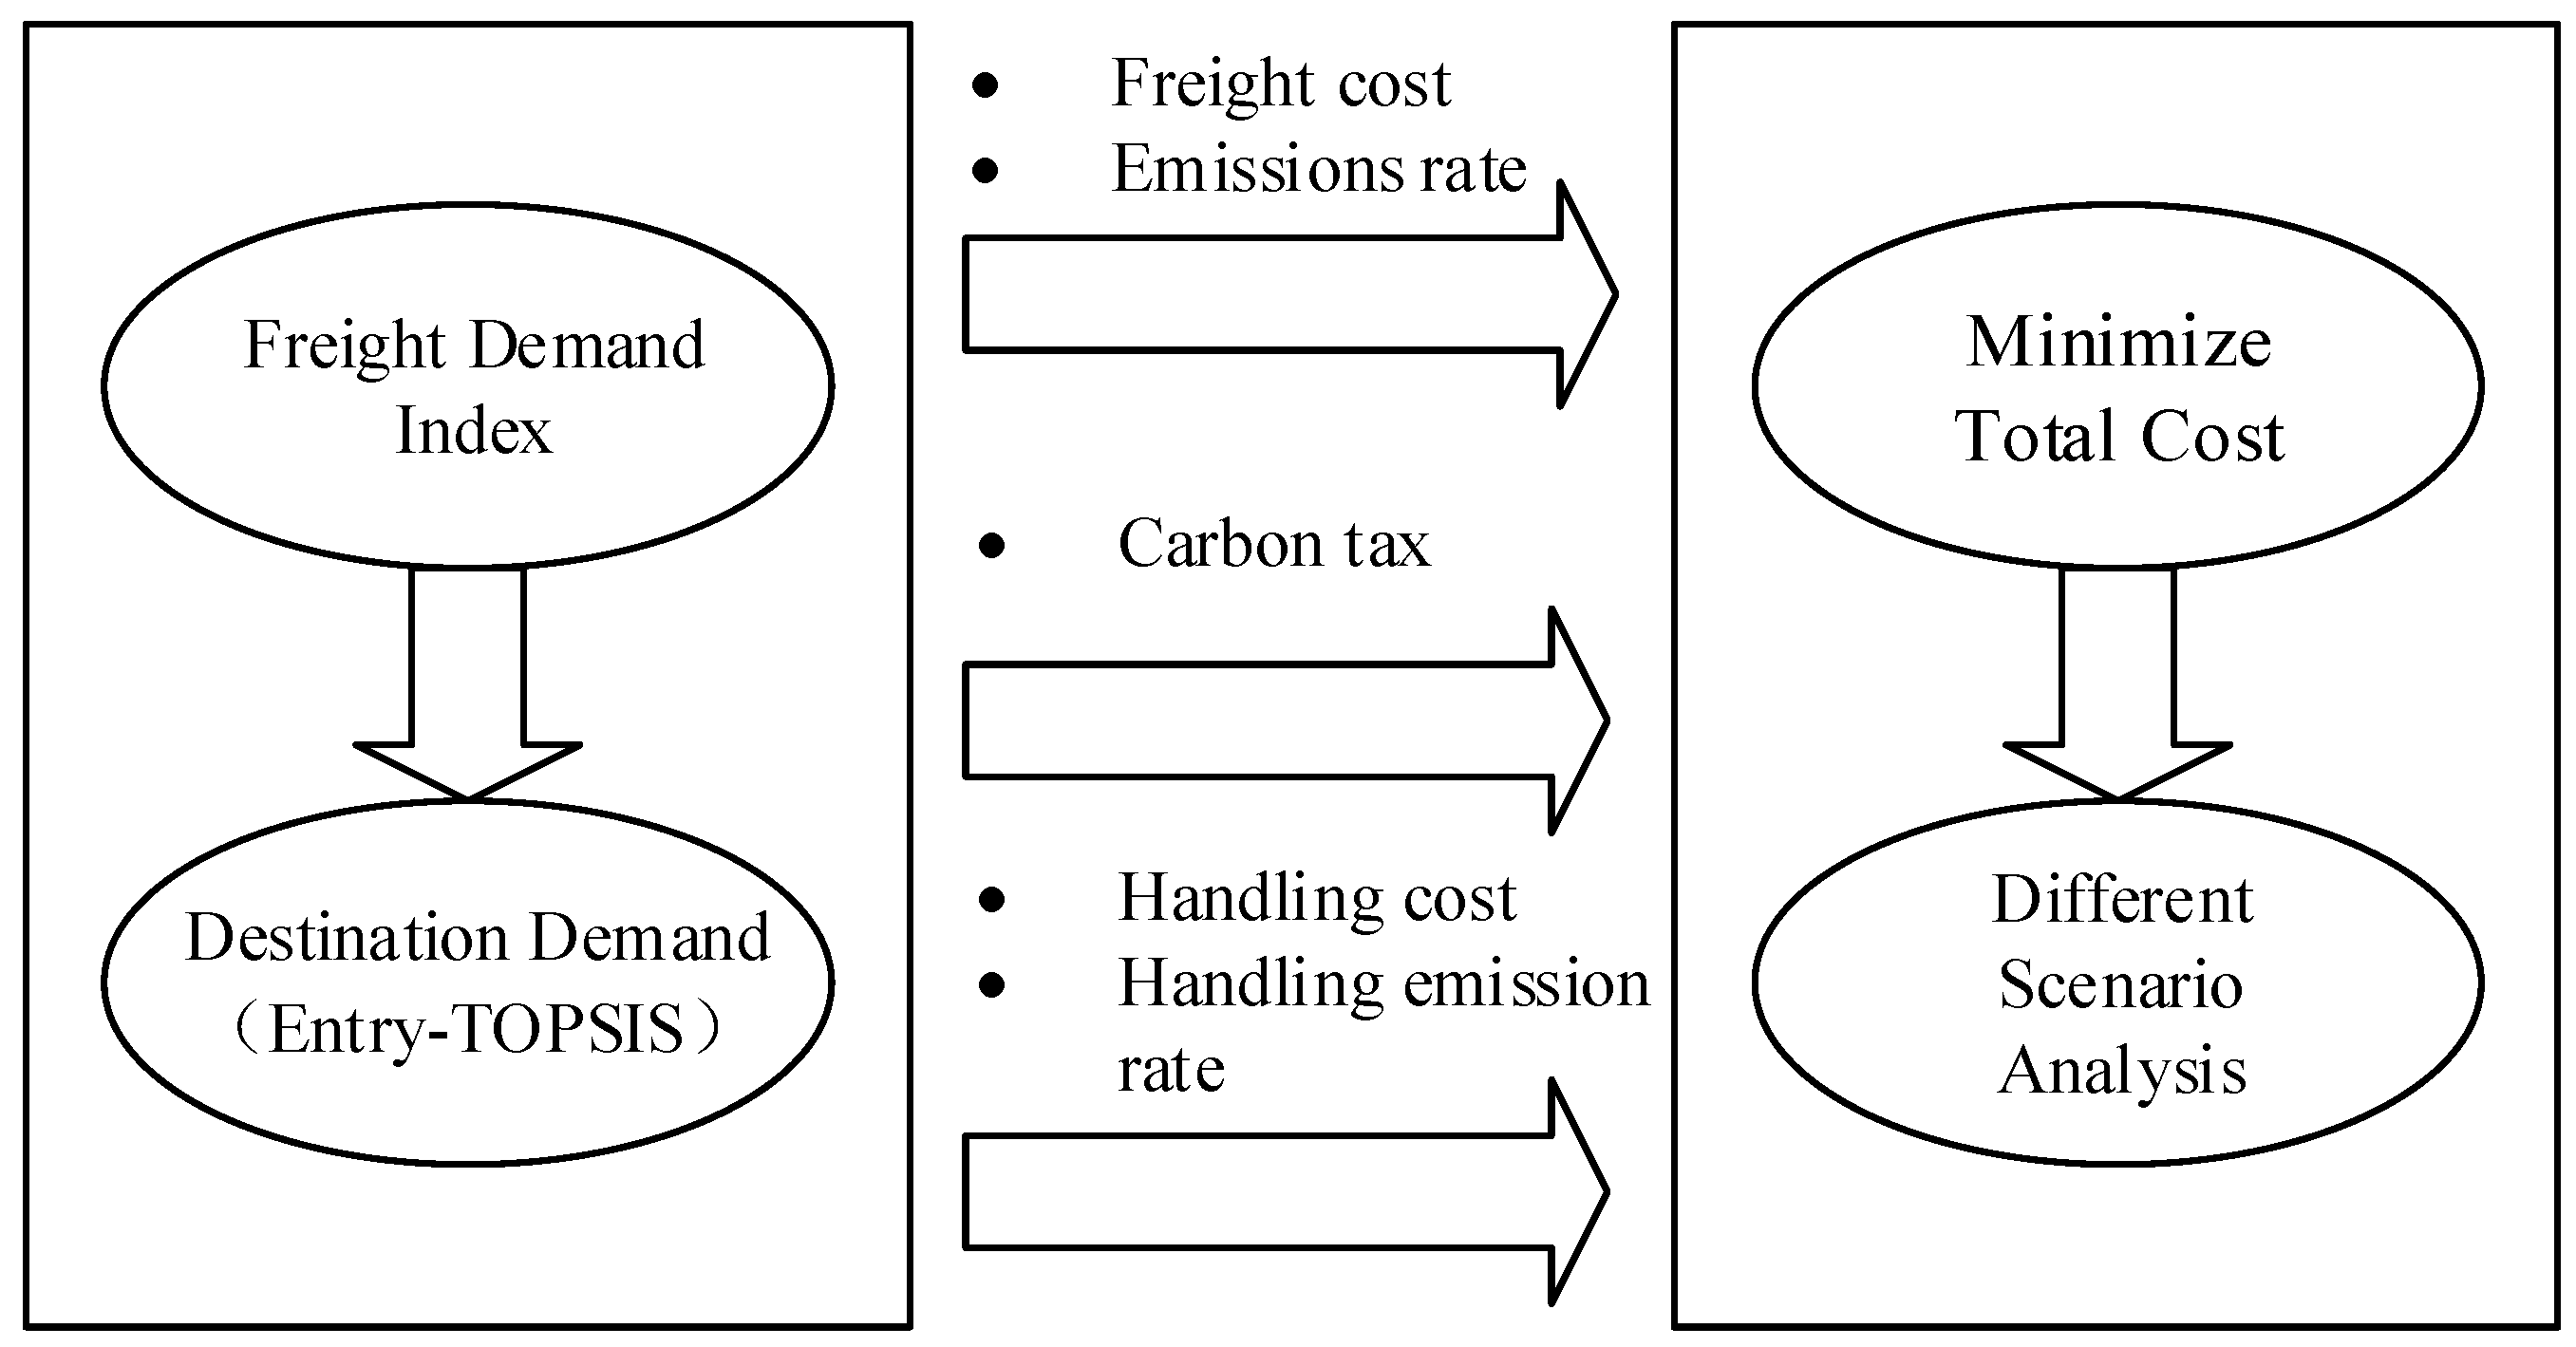
- In the studies presented by Sanchez et al. [12,13], the demand for freight in the destination city was determined by the population size. However, freight demand is associated with many economic indicators. Thus, in this study, in order to determine the freight demand of the destination city, a comprehensive multi-criteria decision-making (MCDM) approach is used to measure city freight performance. All relevant criteria for freight demand are taken into account, including the GDP, population size, and consumption level.
- For the modeling approach adopted in this study, a number of variables that affect the overall cost and carbon emissions are considered, including the multimodal freight costs, transportation handling costs, carbon tax, and carbon emissions from the use of alternative modes and routes. The scenarios modeled in this paper include a baseline scenario and a series of scenarios that capture the results of using alternative routes, which also reflect carbon emissions and the role of multimodal transport in port selection.
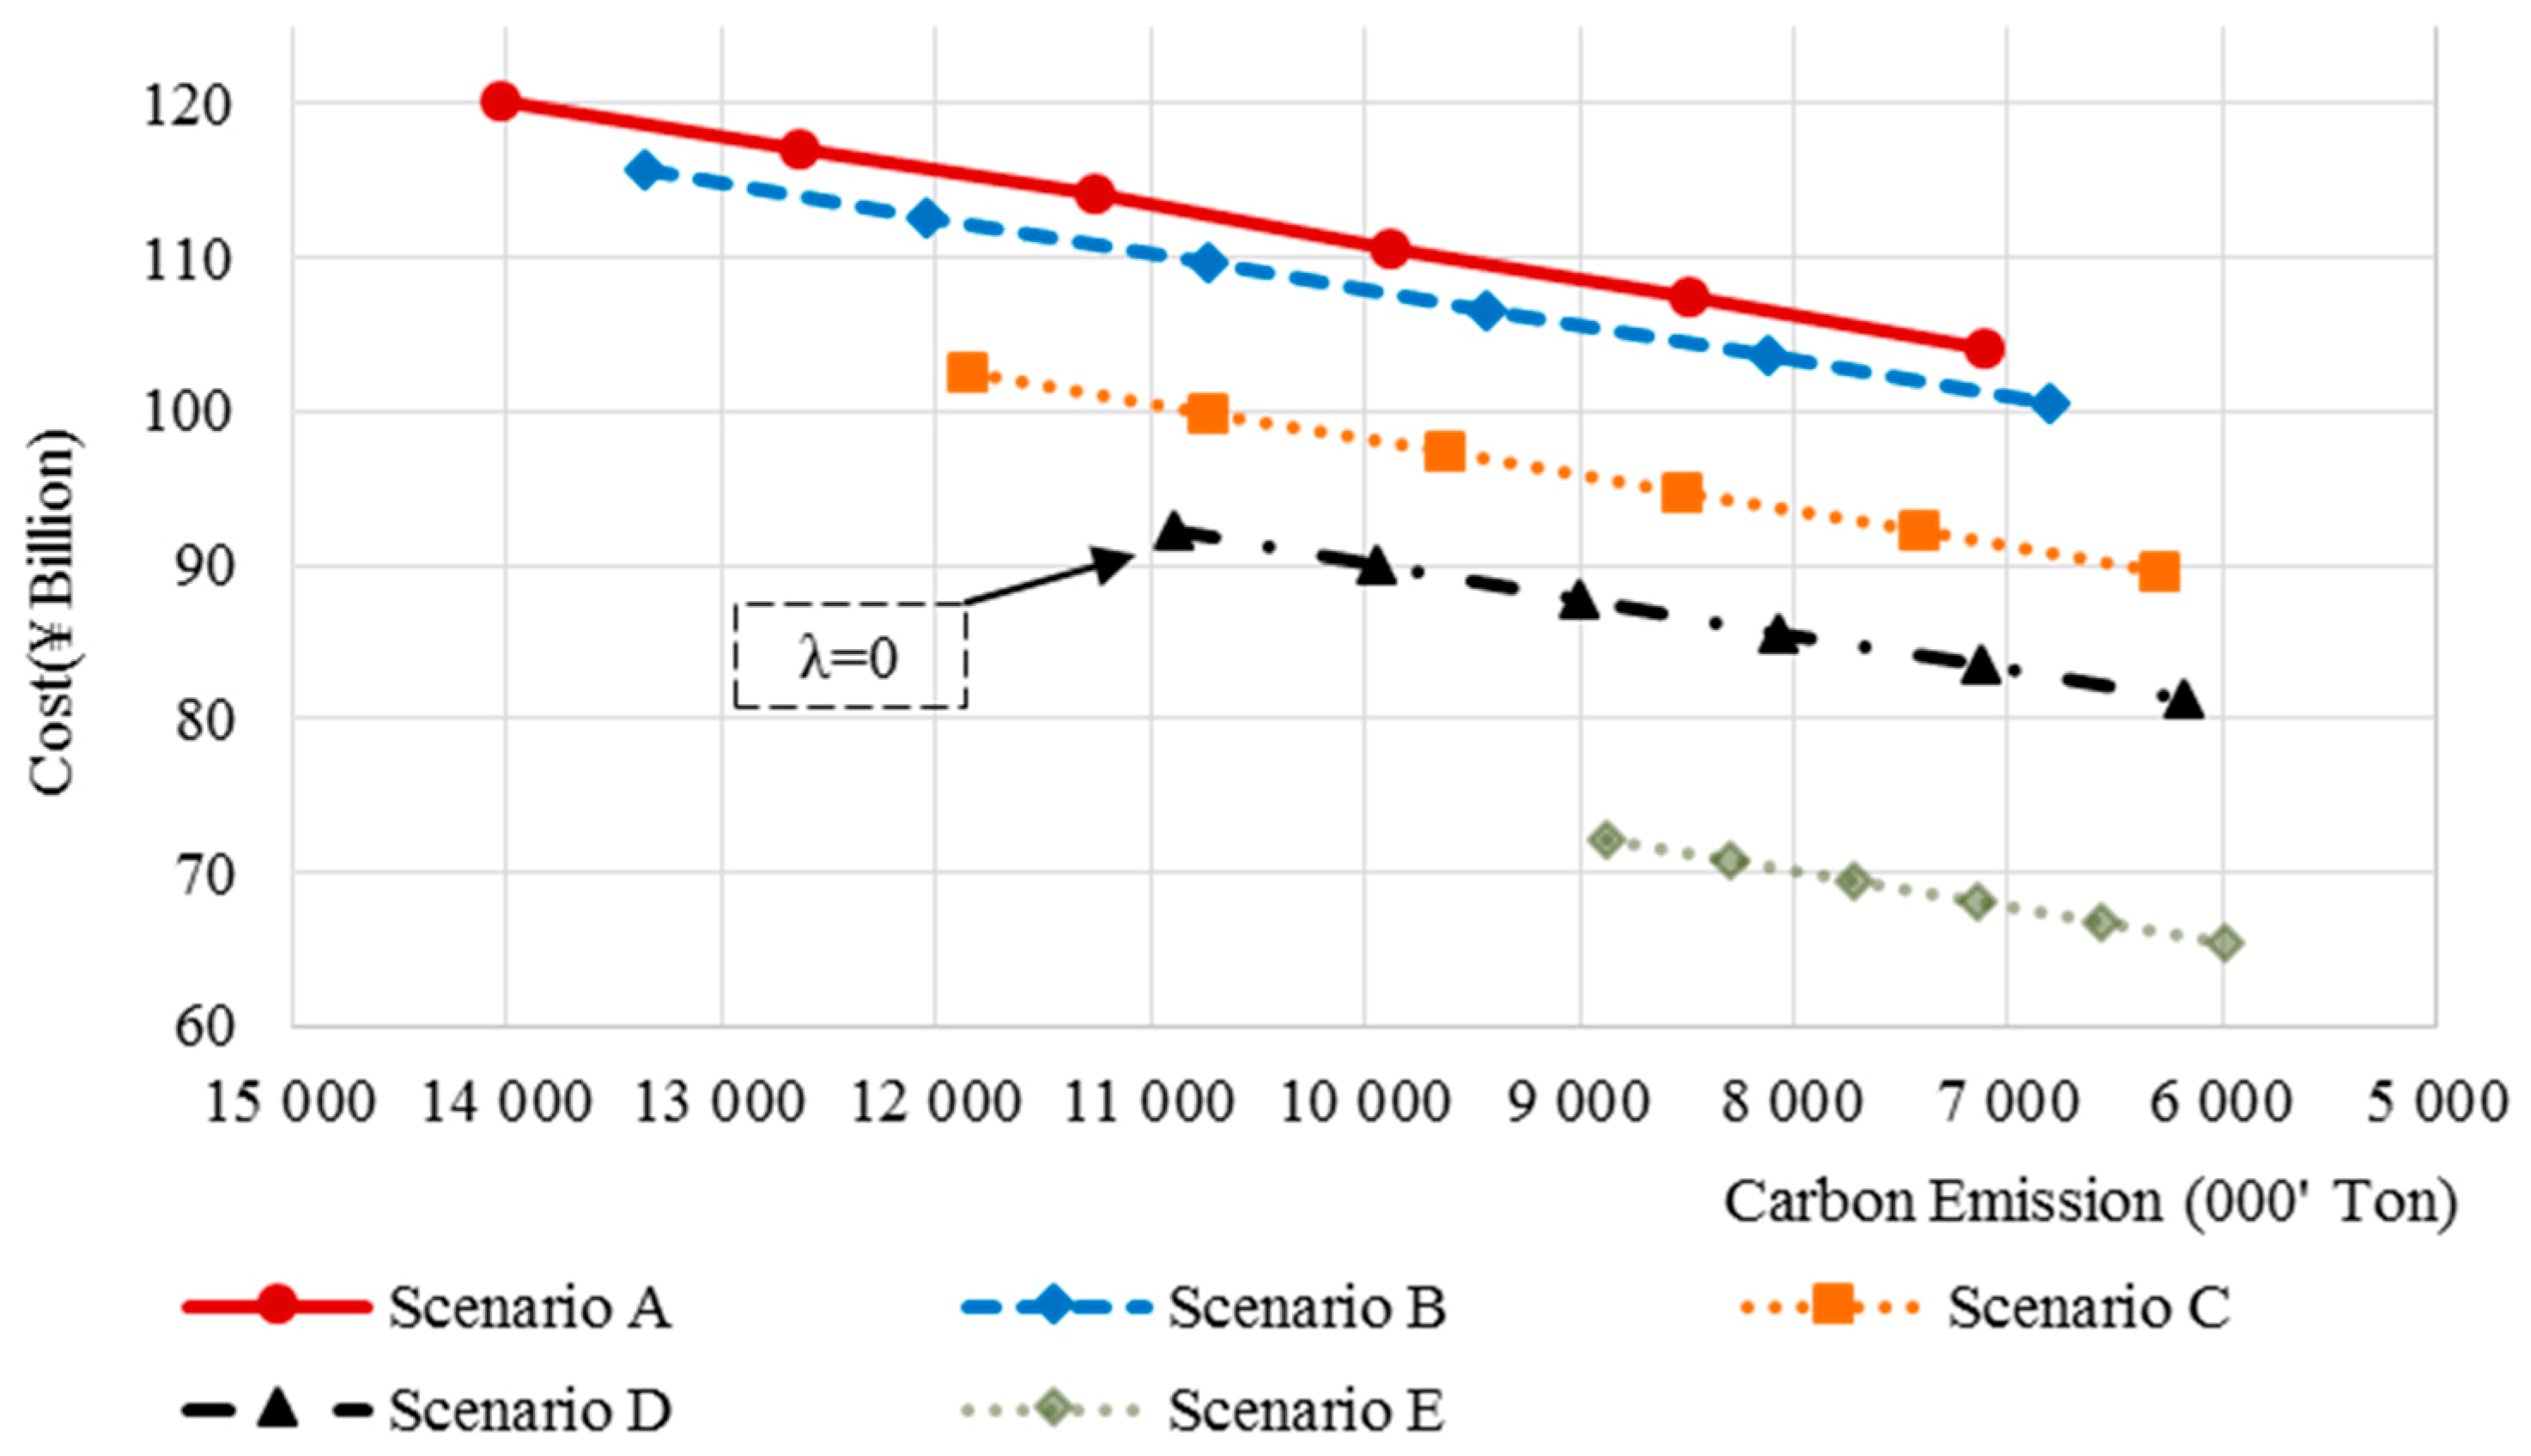
- In the sensitivity analysis, road cost reduction is taken into account to reflect the flexibility of road freight price during the imbalance between supply and demand. For example, when Shenyang port has a large number of goods to transport, and Dalian port has no goods, truck drivers will go to Shenyang to canvas more goods at lower prices.
2. Literature Review
3. Materials and Methods
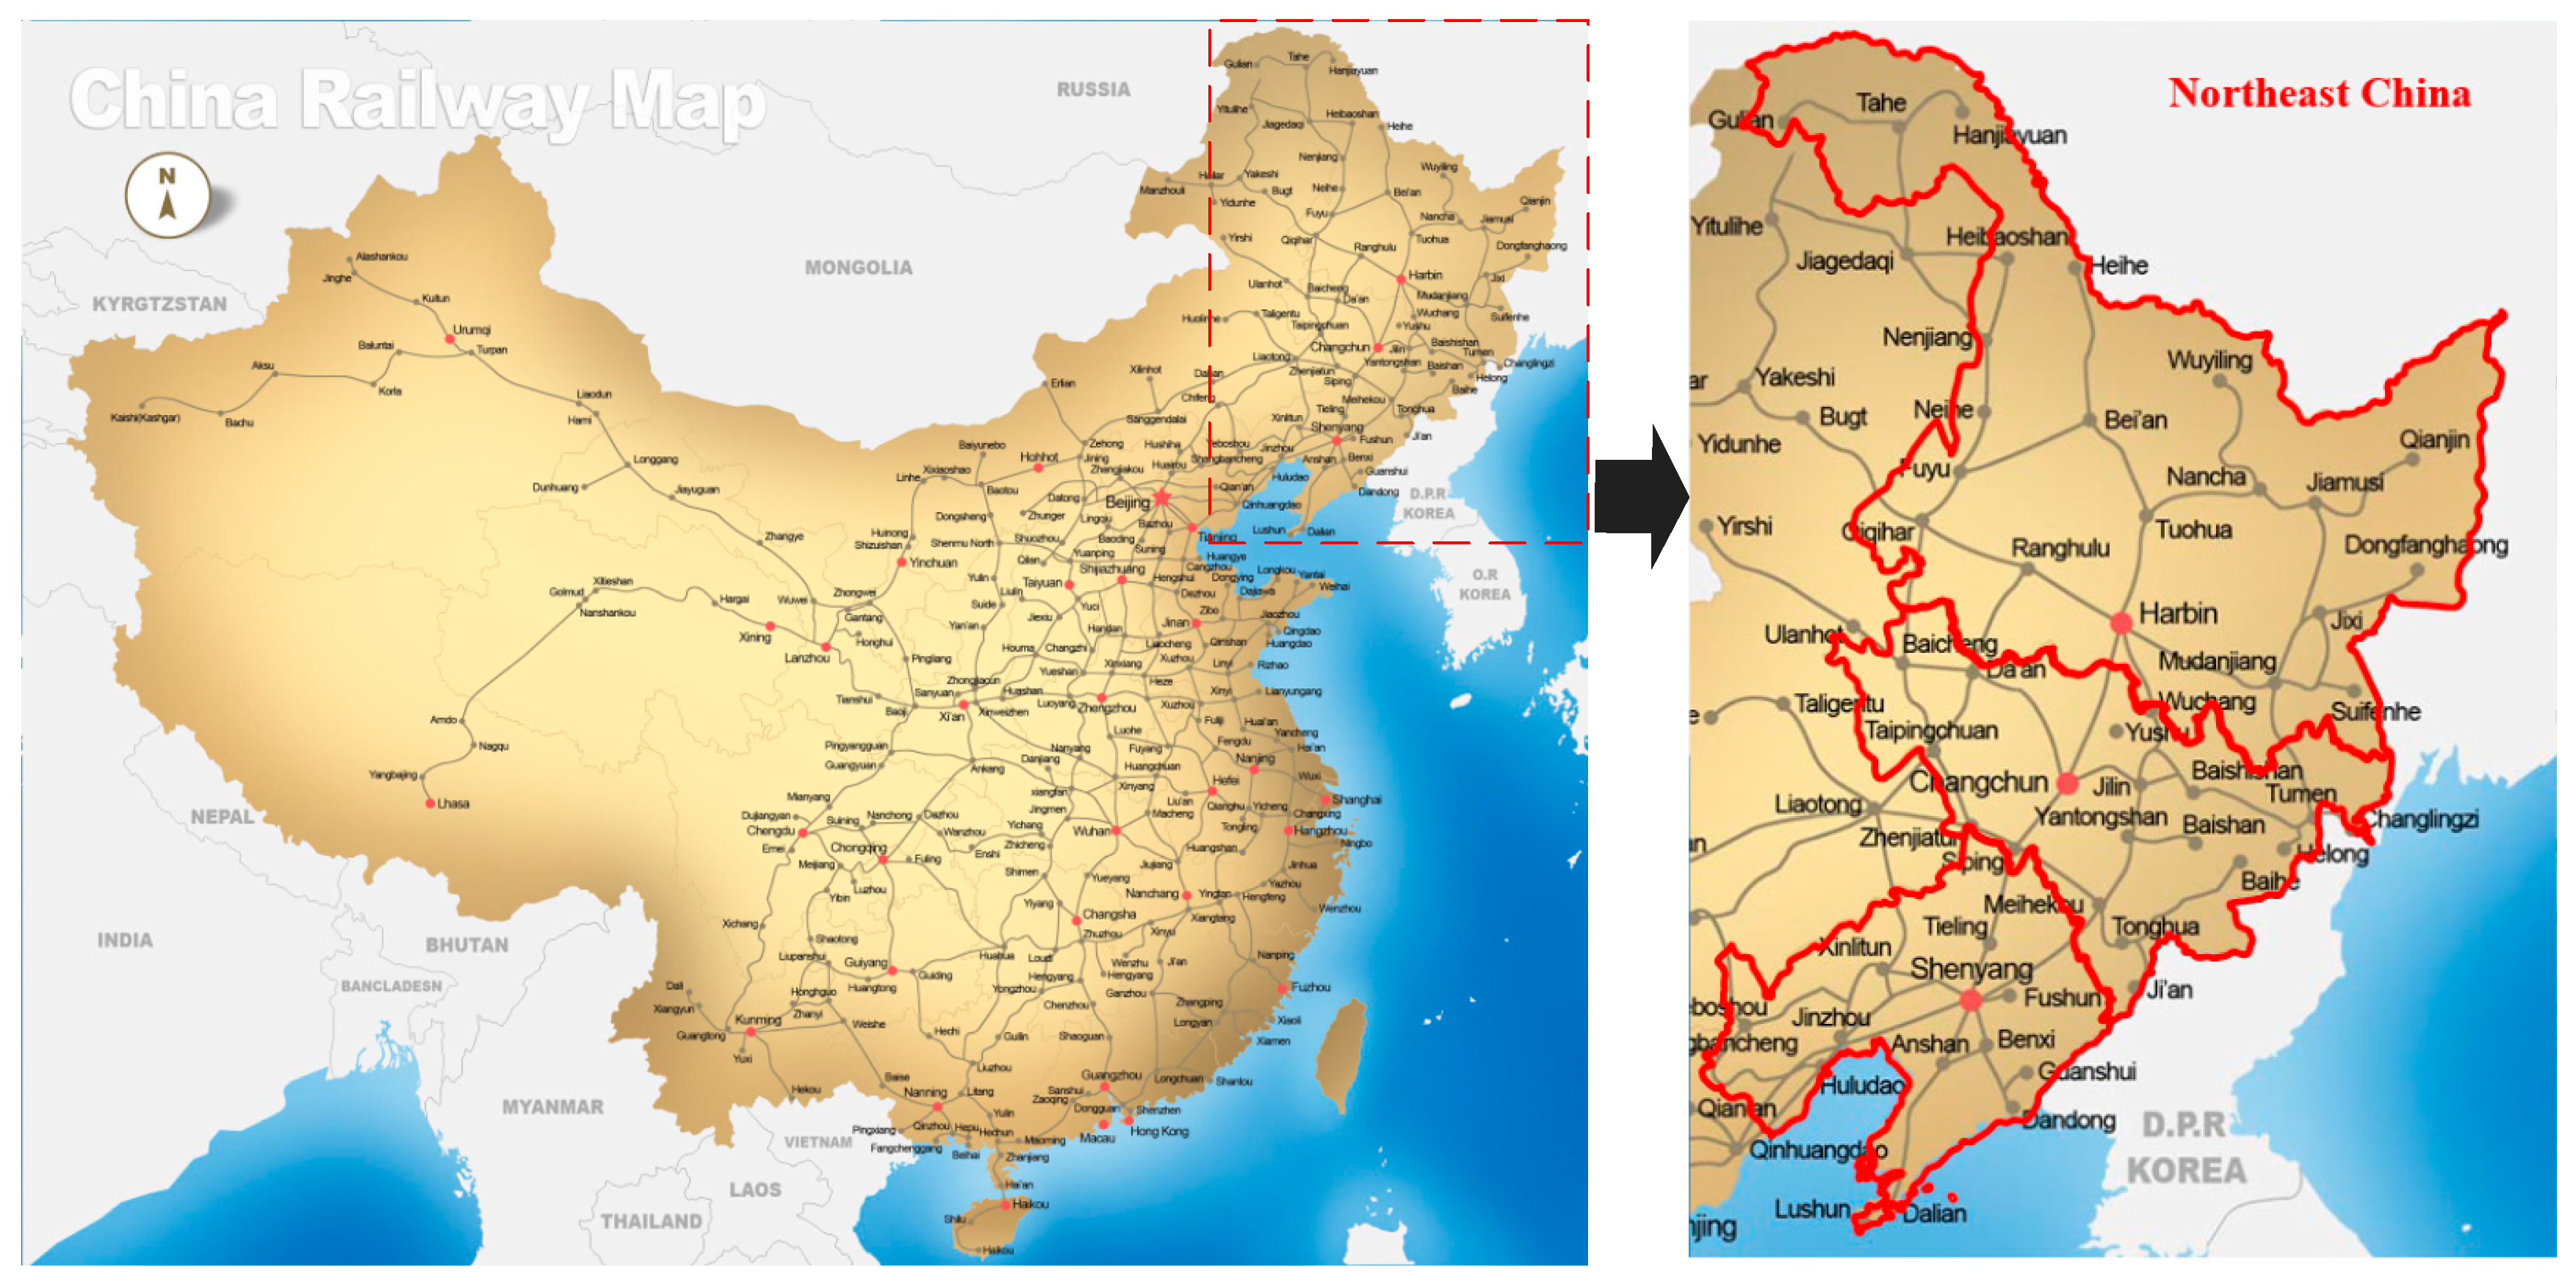
3.1. Description of the Case Study
3.2. Freight Demand in Destination Cities
- 1.
- Data Standardization Processing
- 2.
- Determination of Index Weight by the Entropy Weight Method
- 3.
- Confirm Freight Demand by TOPSIS
3.3. Model and Scenario Design
3.3.1. Decision Variables and Parameters
3.3.2. Multimodal Transportation Network Planning Model
- O1–D: All containers are transported by road.
- O1–R–D: This route depends on the capacity constraints of the railways. At the same time, according to the different freight rates and carbon intensities of the railway, the O2–R–D route is also possible.
- O1–O2–D: This route depends on whether the port of O2 is expanded or not. If the port of O2 can be expanded, then a large number of containers will be transported in O2 to reduce the total cost.
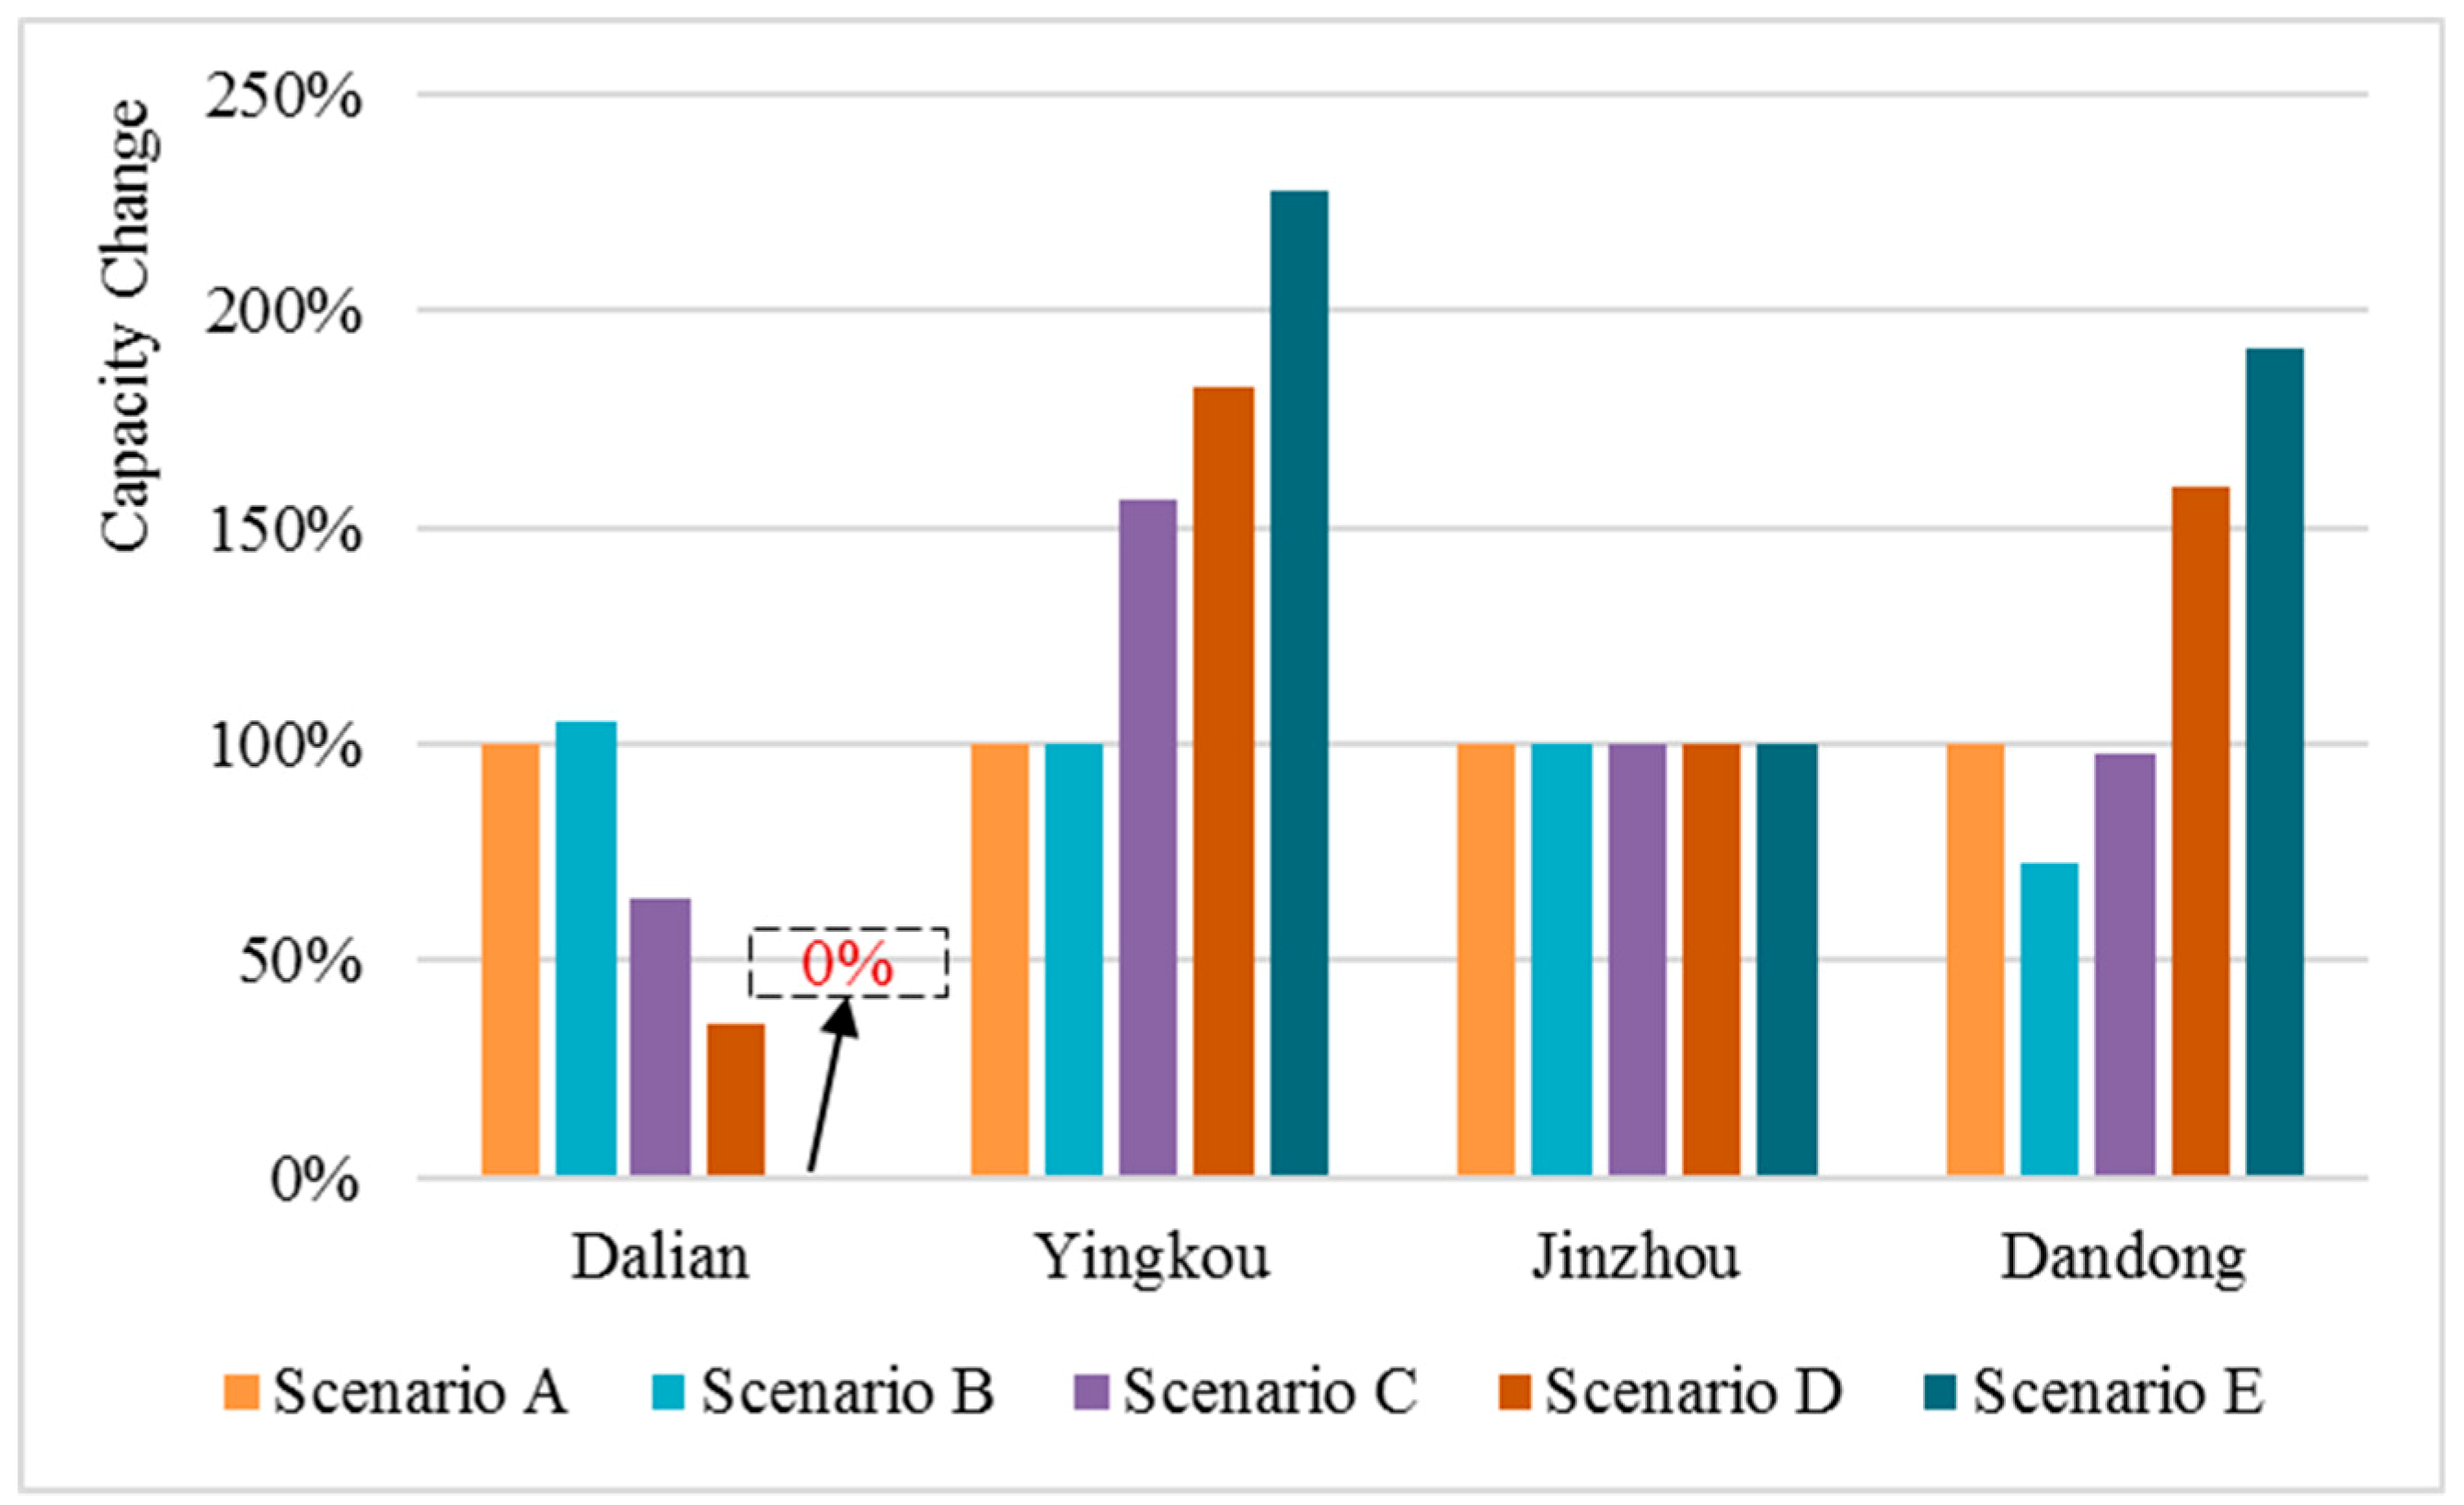
- Scenario A (basic scenario): Assuming that all containers are transported by road, this scenario was used as the comparison scenario, which served as the benchmark comparison between multimodal transport and single road transport.
- Scenario B: Assuming that all containers are transported by road and rail, Shenyang, Changchun and Harbin were selected as dry ports, Yingkou Port and Dalian Port can transport containers by rail, and Dalian can be expanded. The purpose of this scenario was to study the role of multimodal transport in port selection. In order to be consistent with the reality, the railway capacity limit was set to less than 5.4% of the total route capacity, which is, according to the 13th Five-Year Plan for the Development of Railway Container Multimodal Transport (13th FPDRCMT), the proportion of railway container transport in China—far lower than that in developed countries.
- Scenario C: On the basis of scenario B, we assumed that containers arriving at Dalian port could be trans-shipped to Yingkou port and Dandong port along the coast. At the same time, Yingkou port and Dandong port could be expanded. The purpose of this scenario was to study the impact of reducing road transport through the use of alternative ports or rail transport on the port selection and carbon emissions.
- Scenario D: On the basis of scenario C, we assumed that the railway traffic volume was limited to less than 20% of the total traffic volume. The purpose of this scenario was to reflect the 13th FPDRCMT, where the freight volume of China’s container railway is predicted to reach 20% by 2020.
- Scenario E: On the basis of scenario C, we assumed that the railway traffic volume was limited to less than 50% of the total traffic volume. The purpose of this scenario was to reflect the influence of multimodal transport and port selection when railway transport is more developed in the future. China’s ambition to vigorously promote multimodal transport and the integration of Liaoning Port Group strongly confirm this scenario.
4. Results and Discussion
4.1. Model Results
4.2. Sensitivity Analysis
4.2.1. The Impact of Highway Unit Cost Reduction
4.2.2. Impact of Road Carbon Emission Reduction
5. Conclusions
Author Contributions
Funding
Conflicts of Interest
References
- D’Avignon, A.; Carloni, F.A.; Rovere, E.L.L.; Dubeux, C.B.S. Emission inventory: An urban public policy instrument and benchmark. Energy Policy 2010, 38, 4838–4847. [Google Scholar] [CrossRef]
- International Energy Agency (IEA). World Energy Outlook 2018; IEA: Paris, France, November 2018. [Google Scholar]
- Liao, C.-H.; Tseng, P.-H.; Lu, C.-S. Comparing carbon dioxide emissions of trucking and intermodal container transport in Taiwan. Transp. Res. Part Transp. Environ. 2009, 14, 493–496. [Google Scholar] [CrossRef]
- Liao, C.-H.; Tseng, P.-H.; Cullinane, K.; Lu, C.-S. The impact of an emerging port on the carbon dioxide emissions of inland container transport: An empirical study of Taipei port. Energy Policy 2010, 38, 5251–5257. [Google Scholar] [CrossRef]
- Hui-Huang, T. A comparative study on pollutant emissions and hub-port selection in Panama Canal expansion. Marit. Econ. Logist. 2015, 17, 163–178. [Google Scholar] [CrossRef]
- Corbett, J.J.; Deans, E.; Silberman, J.; Morehouse, E.; Craft, E.; Norsworthy, M. Panama Canal expansion: Emission changes from possible US west coast modal shift. Carbon Manag. 2012, 3, 569–588. [Google Scholar] [CrossRef]
- Ugboma, C.; Ugboma, O.; Ogwude, I.C. An Analytic Hierarchy Process (AHP) Approach to Port Selection Decisions—Empirical Evidence from Nigerian Ports. Marit. Econ. Logist. 2006, 8, 251–266. [Google Scholar] [CrossRef]
- Veldman, S.; Garcia-Alonso, L.; Vallejo-Pinto, J.Á. Determinants of container port choice in Spain. Marit. Policy Manag. 2011, 38, 509–522. [Google Scholar] [CrossRef]
- Chang, Y.-T.; Lee, S.-Y.; Tongzon, J.L. Port selection factors by shipping lines: Different perspectives between trunk liners and feeder service providers. Mar. Policy 2008, 32, 877–885. [Google Scholar] [CrossRef]
- Kengpol, A.; Tuammee, S.; Tuominen, M. The development of a framework for route selection in multimodal transportation. Int. J. Logist. Manag. 2014, 25, 581–610. [Google Scholar] [CrossRef]
- Notteboom, T.E. Complementarity and Substitutability among Adjacent Gateway Ports. Environ. Plan. Econ. Space 2009, 41, 743–762. [Google Scholar] [CrossRef]
- Sanchez Rodrigues, V.; Beresford, A.; Pettit, S.; Bhattacharya, S.; Harris, I. Assessing the cost and CO2e impacts of rerouteing UK import containers. Transp. Res. Part Policy Pract. 2014, 61, 53–67. [Google Scholar] [CrossRef]
- Sanchez Rodrigues, V.; Pettit, S.; Harris, I.; Beresford, A.; Piecyk, M.; Yang, Z.; Ng, A. UK supply chain carbon mitigation strategies using alternative ports and multimodal freight transport operations. Transp. Res. Part E Logist. Transp. Rev. 2015, 78, 40–56. [Google Scholar] [CrossRef] [Green Version]
- Wang, C.; Ducruet, C.; Wang, W. Port integration in China: Temporal pathways, spatial patterns and dynamics. Chin. Geogr. Sci. 2015, 25, 612–628. [Google Scholar] [CrossRef]
- Lam, J.S.L.; Gu, Y. Port hinterland intermodal container flow optimisation with green concerns: A literature review and research agenda. Int. J. Shipp. Transp. Logist. 2013, 5, 257–281. [Google Scholar] [CrossRef]
- Monios, J.; Wilmsmeier, G. The role of intermodal transport in port regionalisation. Transp. Policy 2013, 30, 161–172. [Google Scholar] [CrossRef] [Green Version]
- Malchow, M.B.; Kanafani, A. A disaggregate analysis of port selection. Transp. Res. Part E Logist. Transp. Rev. 2004, 40, 317–337. [Google Scholar] [CrossRef]
- Garcia-Alonso, L.; Sanchez-Soriano, J. Port selection from a hinterland perspective. Marit. Econ. Logist. 2009, 11, 260–269. [Google Scholar] [CrossRef]
- Sanchez, R.J.; Ng, A.K.Y.; Garcia-Alonso, L. Port Selection Factors and Attractiveness: The Service Providers’ Perspective. Transp. J. 2011, 50, 141–161. [Google Scholar] [CrossRef]
- Tongzon, J.L. Port choice and freight forwarders. Transp. Res. Part E Logist. Transp. Rev. 2009, 45, 186–195. [Google Scholar] [CrossRef]
- Wiegmans, B.W.; Hoest, A.V.D.; Notteboom, T.E. Port and terminal selection by deep-sea container operators. Marit. Policy Manag. 2008, 35, 517–534. [Google Scholar] [CrossRef]
- Psaraftis, H.N.; Kontovas, C.A. Ship speed optimization: Concepts, models and combined speed-routing scenarios. Transp. Res. Part C Emerg. Technol. 2014, 44, 52–69. [Google Scholar] [CrossRef] [Green Version]
- Chen, K.; Yang, Z.; Notteboom, T. The design of coastal shipping services subject to carbon emission reduction targets and state subsidy levels. Transp. Res. Part E Logist. Transp. Rev. 2014, 61, 192–211. [Google Scholar] [CrossRef]
- Liao, C.-H.; Lu, C.-S.; Tseng, P.-H. Carbon dioxide emissions and inland container transport in Taiwan. J. Transp. Geogr. 2011, 19, 722–728. [Google Scholar] [CrossRef]
- Chen, L.; Lin, B.L.; Wang, L.; Wen, X.H.; Li, J. Transfer of freight flow between highway and railway based on carbon emissions. J. Southeast Univ. (Nat. Sci. Ed.) 2015, 45, 1002–1007. (In Chinese) [Google Scholar]
- Meng, Q.; Wang, X. Intermodal hub-and-spoke network design: Incorporating multiple stakeholders and multi-type containers. Transp. Res. Part B Methodol. 2011, 45, 724–742. [Google Scholar] [CrossRef]
- Cavone, G.; Dotoli, M.; Epicoco, N.; Seatzu, C. Intermodal terminal planning by Petri Nets and Data Envelopment Analysis. Control Eng. Pract. 2017, 69, 9–22. [Google Scholar] [CrossRef]
- Heggen, H.; Molenbruch, Y.; Caris, A.; Braekers, K. Intermodal Container Routing: Integrating Long-Haul Routing and Local Drayage Decisions. Sustainability 2019, 11, 1634. [Google Scholar] [CrossRef]
- Zhao, Y.; Xue, Q.; Zhang, X. Stochastic Empty Container Repositioning Problem with CO2 Emission Considerations for an Intermodal Transportation System. Sustainability 2018, 10, 4211. [Google Scholar] [CrossRef]
- Christodoulou, A.; Raza, Z.; Woxenius, J. The Integration of RoRo Shipping in Sustainable Intermodal Transport Chains: The Case of a North European RoRo Service. Sustainability 2019, 11, 2422. [Google Scholar] [CrossRef]
- Patil, G.R.; Sahu, P.K. Estimation of freight demand at Mumbai Port using regression and time series models. KSCE J. Civ. Eng. 2016, 20, 2022–2032. [Google Scholar] [CrossRef]
- Fite, J.T.; Taylor, G.D.; Usher, J.S.; English, J.R.; Roberts, J.N. Forecasting freight demand using economic indices. Int. J. Phys. Distrib. Logist. Manag. 2002, 32, 299–308. [Google Scholar] [CrossRef]
- Li, Y.; Zhao, L.; Suo, J. Comprehensive Assessment on Sustainable Development of Highway Transportation Capacity Based on Entropy Weight and TOPSIS. Sustainability 2014, 6, 4685–4693. [Google Scholar] [CrossRef] [Green Version]
- Liang, X.; Liu, C.; Li, Z. Measurement of Scenic Spots Sustainable Capacity Based on PCA-Entropy TOPSIS: A Case Study from 30 Provinces, China. Int. J. Environ. Res. Public. Health 2018, 15, 10. [Google Scholar] [CrossRef]
- Dai, S.; Niu, D. Comprehensive Evaluation of the Sustainable Development of Power Grid Enterprises Based on the Model of Fuzzy Group Ideal Point Method and Combination Weighting Method with Improved Group Order Relation Method and Entropy Weight Method. Sustainability 2017, 9, 1900. [Google Scholar] [Green Version]
- Liu, L.; Zhou, J.; An, X.; Zhang, Y.; Yang, L. Using fuzzy theory and information entropy for water quality assessment in Three Gorges region, China. Expert Syst. Appl. 2010, 37, 2517–2521. [Google Scholar] [CrossRef]
- Opricovic, S.; Tzeng, G.-H. Compromise solution by MCDM methods: A comparative analysis of VIKOR and TOPSIS. Eur. J. Oper. Res. 2004, 156, 445–455. [Google Scholar] [CrossRef]
- Yang, L.; Cai, Y.; Zhong, X.; Shi, Y.; Zhang, Z. A Carbon Emission Evaluation for an Integrated Logistics System—A Case Study of the Port of Shenzhen. Sustainability 2017, 9, 462. [Google Scholar] [CrossRef]
- Downie, J.; Stubbs, W. Evaluation of Australian companies’ scope 3 greenhouse gas emissions assessments. J. Clean. Prod. 2013, 56, 156–163. [Google Scholar] [CrossRef]
- Hao, H.; Wang, H.; Ouyang, M. Fuel consumption and life cycle GHG emissions by China’s on-road trucks: Future trends through 2050 and evaluation of mitigation measures. Energy Policy 2012, 43, 244–251. [Google Scholar] [CrossRef]
- Wang, L. An Empirical Study on the Structure and Driving Factors of China’s Road Transportation Cost Based on GTC Model. J. Beijing Jiaotong Univ. (Soc. Sci. Ed.) 2013, 12, 7–13. (In Chinese) [Google Scholar]


| Topic | Main Purpose | Author (Year) | Limitation |
|---|---|---|---|
| Port Selection |
| Ugboma et al. (2006) [7] Veldman et al. (2011) [8] Chang et al. (2008) [9] Malchow et al. (2004) [17] Garcia-Alonso and Sanchez-Soriano (2009) [18] Sanchez et al. (2011) [19] Tongzon (2009) [20] Wiegmans et al. (2008) [21] | They ignoring port selection as an important part of the carbon reduction strategy |
| Carbon Emissions from Container Transport |
| Psaraftis and Kontovas (2014) [22] Chen et al. (2014) [23] Liao et al. (2011) [24] Chen et al. (2015) [25] | The existing literature lacks the scenario of container re-routing and road price reduction. |
| Multimodal Transport Network |
| Meng and Wang (2011) [26] Cavone et al. (2017) [27] Heggen et al. (2019) [28] Zhao et al. (2018) [29] Christodoulou et al. (2019) [30] | They mainly focused on model design or algorithm design; it is necessary to extend the quantitative model study of the multimodal transport network at the strategic level |
| Ports | Dalian | Yingkou | Jinzhou | Dandong | Total |
|---|---|---|---|---|---|
| Handling Capacity (000′ TEU) | 9441 | 6080 | 825 | 1829 | 18,175 |
| Index Name | Description |
|---|---|
| GDP (X1) | The core index of national economic accounting |
| Population (X2) | There is a large demand for containers in densely populated areas |
| Total Retail Sales of Consumer Goods (X3) | Reflects the total amount of consumer goods in various commodity circulation channels. |
| Per Capita Consumption Expenditure (X4) | Reflects the satisfaction degree of people’s material and cultural life needs. |
| Per Capita Disposable Income (X5) | Reflects the income people can use for consumption. |
| Type | Notations | Descriptions |
|---|---|---|
| Decision Variable | Container throughput from node to (TEU), | |
| Parameters | Container handling carbon emissions per TEU (kg) | |
| Container handling capacity limitation in node (TEU), | ||
| Container demand in destination city (TEU), | ||
| Transportation cost from node to per TEU*km (RMB), | ||
| Container handling cost per TEU (RMB), | ||
| Distance from node to (km), | ||
| Carbon emissions from node to per TEU*km (kg) | ||
| Carbon emissions tax per kg (RMB) |
| Destination City | Shenyang | Anshan | Benxi | Fushun | Changchun | Jilin |
| FDI | 23.03 | 4.50 | 1.24 | 1.65 | 18.46 | 7.88 |
| Destination City | Songyuan | Siping | Harbin | Daqing | Qiqihar | Jiamusi |
| FDI | 3.53 | 2.78 | 24.21 | 6.95 | 4.71 | 1.07 |
| Destination City | Shenyang | Anshan | Benxi | Fushun | Changchun | Jilin |
| Container demand | 4186 | 817 | 224.8 | 299.1 | 3354.9 | 1432.8 |
| Destination City | Songyuan | Siping | Harbin | Daqing | Qiqihar | Jiamusi |
| Container demand | 640.8 | 505.1 | 4400.3 | 1264.1 | 855.6 | 194.6 |
| Transportation Mode | Emission (kg/TEU-km) | Cost (¥/TEU-km) |
|---|---|---|
| Road | 1.1538 | 9.28 |
| Coastal | 0.191 | 1.12 |
| Railway | 0.403 | 2.02 |
| Scenario A | Scenario B | Scenario C | ||||
| Cost ¥ Billion | CO2e 000′tonne | Cost ¥ Billion | CO2e 000′tonne | Cost ¥ Billion | CO2e 000′tonne | |
| Road | 111.14 | 13,818 | 105.14 | 13,072 | 89.16 | 11,085 |
| Railway | 0.0 | 0.0 | 1.24 | 247 | 1.20 | 240 |
| Sea | 0.0 | 0.0 | 0.0 | 00 | 2.85 | 486 |
| Handling | 9.09 | 204 | 9.28 | 205 | 9.28 | 205 |
| Total | 120.23 | 14,022 | 115.66 | 13,524 | 102.49 | 12,016 |
| Scenario D | Scenario E | |||||
| Cost ¥ Billion | CO2e 000′tonne | Cost ¥ Billion | CO2e 000′tonne | |||
| Road | 75.54 | 9392 | 46.27 | 5753 | ||
| Railway | 4.01 | 800 | 9.53 | 1902 | ||
| Sea | 2.85 | 486 | 3.46 | 590 | ||
| Handling | 9.80 | 208 | 11.11 | 219 | ||
| Total | 92.20 | 10,886 | 70.37 | 8464 | ||
| Scenario A | Scenario B | Scenario C | Scenario D | Scenario E | |
|---|---|---|---|---|---|
| Total Cost | 1202.3 | 1156.6 | 1024.9 | 922.0 | 703.7 |
| Carbon Tax | 2.80 | 2.67 | 2.37 | 2.18 | 1.69 |
| Proportion | 0.232% | 0.230% | 0.231% | 0.236% | 0.240% |
| Scenario A | Scenario B | Scenario C | ||||
| Cost ¥ Billion | CO2e 000′tonne | Cost ¥ Billion | CO2e 000′tonne | Cost ¥ Billion | CO2e 000′tonne | |
| Road | 55.57↓ 1 | 13,818 | 52.57↓ | 13,072 | 44.77↓ | 11,132↑ |
| Railway | 0.0 | 0.0 | 1.24 | 246 | 1.12↓ | 223↓ |
| Sea | 0.0 | 0.0 | 0.0 | 0.0 | 2.85 | 486 |
| Handling | 9.09 | 204 | 9.28 | 205 | 9.23↓ | 204↓ |
| Total | 64.66↓ | 14,022 | 63.09↓ | 13,523 | 57.97↓ | 12,045↑ |
| Scenario D | Scenario E | |||||
| Cost ¥ Billion | CO2e 000′tonne | Cost ¥ Billion | CO2e 000′tonne | |||
| Road | 38.46↓ | 9565↑ | 23.72↓ | 5899↑ | ||
| Railway | 3.71↓ | 740↓ | 9.22↓ | 1840↓ | ||
| Sea | 2.85 | 486 | 3.46 | 590 | ||
| Handling | 9.63↓ | 207↓ | 10.69↓ | 214↓ | ||
| Total | 54.65↓ | 10,998↑ | 47.09↓ | 8543↑ | ||
| Road Reduction % | Scenario A | Scenario B | ||||||
| Cost ¥ Billion | Reduction % | CO2e 000′tonne | Reduction % | Cost ¥ Billion | Reduction % | CO2e 000′tonne | Reduction % | |
| 0 | 120.23 | - | 14,022 | - | 115.66 | - | 1352.4 | - |
| 10 | 116.99 | 2.6 | 12,640 | 9.8 | 112.59 | 2.6 | 1221.6 | 9.6 |
| 20 | 114.08 | 5.1 | 11,258 | 19.8 | 109.65 | 5.1 | 1090.9 | 19.3 |
| 30 | 110.64 | 7.9 | 9876 | 29.5 | 106.59 | 7.8 | 960.2 | 28.9 |
| 40 | 107.41 | 10.6 | 8495 | 39.4 | 103.53 | 10.4 | 829.5 | 38.6 |
| 50 | 104.18 | 13.3 | 7112 | 49.2 | 100.47 | 13.1 | 698.7 | 48.3 |
| Road Reduction % | Scenario C | Scenario D | ||||||
| Cost ¥ Billion | Reduction % | CO2e 000′tonne | Reduction % | Cost ¥ Billion | Reduction % | CO2e 000′tonne | Reduction % | |
| 0 | 102.49 | - | 12,016 | - | 92.20 | - | 10,886 | - |
| 10 | 99.89 | 2.5 | 10,907 | 9.2 | 90.00 | 2.3 | 9947 | 8.6 |
| 20 | 97.30 | 5.0 | 9798 | 18.5 | 87.88 | 4.6 | 9008 | 17.2 |
| 30 | 94.80 | 7.5 | 8690 | 27.7 | 85.68 | 7.2 | 8068 | 25.9 |
| 40 | 92.21 | 10.0 | 7581 | 36.9 | 83.48 | 9.4 | 7129 | 34.5 |
| 50 | 89.61 | 12.5 | 6473 | 46.1 | 81.29 | 11.8 | 6190 | 43.1 |
| Road Reduction % | Scenario E | |||||||
| Cost ¥ Billion | Reduction % | CO2e 000′tonne | Reduction % | |||||
| 0 | 70.37 | - | 8464 | - | ||||
| 10 | 69.03 | 1.9 | 7889 | 6.8 | ||||
| 20 | 67.74 | 3.8 | 7314 | 13.6 | ||||
| 30 | 66.39 | 5.7 | 6738 | 20.4 | ||||
| 40 | 65.04 | 7.6 | 6163 | 27.2 | ||||
| 50 | 63.70 | 9.5 | 5588 | 34.0 | ||||
© 2019 by the authors. Licensee MDPI, Basel, Switzerland. This article is an open access article distributed under the terms and conditions of the Creative Commons Attribution (CC BY) license (http://creativecommons.org/licenses/by/4.0/).
Share and Cite
Li, X.; Kuang, H.; Hu, Y. Carbon Mitigation Strategies of Port Selection and Multimodal Transport Operations—A Case Study of Northeast China. Sustainability 2019, 11, 4877. https://doi.org/10.3390/su11184877
Li X, Kuang H, Hu Y. Carbon Mitigation Strategies of Port Selection and Multimodal Transport Operations—A Case Study of Northeast China. Sustainability. 2019; 11(18):4877. https://doi.org/10.3390/su11184877
Chicago/Turabian StyleLi, Xiaodong, Haibo Kuang, and Yan Hu. 2019. "Carbon Mitigation Strategies of Port Selection and Multimodal Transport Operations—A Case Study of Northeast China" Sustainability 11, no. 18: 4877. https://doi.org/10.3390/su11184877
APA StyleLi, X., Kuang, H., & Hu, Y. (2019). Carbon Mitigation Strategies of Port Selection and Multimodal Transport Operations—A Case Study of Northeast China. Sustainability, 11(18), 4877. https://doi.org/10.3390/su11184877


