Article

Energy Sustainability Analysis (ESA) of Energy-Producing Processes: A Case Study on Distributed H2 Production

by
Carlos E. Gómez-Camacho
* and
Bernardo Ruggeri
*
DISAT, Dep. Applied Science and Technology, Politecnico di Torino, C/so Duca degli Abruzzi 24, 10129 Torino, Italy
*
Authors to whom correspondence should be addressed.
Sustainability 2019, 11(18), 4911; https://doi.org/10.3390/su11184911
Submission received: 18 July 2019 / Revised: 26 August 2019 / Accepted: 5 September 2019 / Published: 9 September 2019
(This article belongs to the Special Issue Sustainable Energy Transformations and Storage Plants)

Abstract

:
In the sustainability context, the performance of energy-producing technologies, using different energy sources, needs to be scored and compared. The selective criterion of a higher level of useful energy to feed an ever-increasing demand of energy to satisfy a wide range of endo- and exosomatic human needs seems adequate. In fact, surplus energy is able to cover energy services only after compensating for the energy expenses incurred to build and to run the technology itself. This paper proposes an energy sustainability analysis (ESA) methodology based on the internal and external energy use of a given technology, considering the entire energy trajectory from energy sources to useful energy. ESA analysis is conducted at two levels: (i) short-term, by the use of the energy sustainability index (ESI), which is the first step to establish whether the energy produced is able to cover the direct energy expenses needed to run the technology and (ii) long-term, by which all the indirect energy-quotas are considered, i.e., all the additional energy requirements of the technology, including the energy amortization quota necessary for the replacement of the technology at the end of its operative life. The long-term level of analysis is conducted by the evaluation of two indicators: the energy return per unit of energy invested (EROI) over the operative life and the energy payback-time (EPT), as the minimum lapse at which all energy expenditures for the production of materials and their construction can be repaid to society. The ESA methodology has been applied to the case study of H2 production at small-scale (10–15 kWH2) comparing three different technologies: (i) steam-methane reforming (SMR), (ii) solar-powered water electrolysis (SPWE), and (iii) two-stage anaerobic digestion (TSAD) in order to score the technologies from an energy sustainability perspective.

Graphical Abstract

1. Introduction

The appearance of certain ground-breaking technologies (promethean or viable technologies) significantly shaped societal metabolism. Following Georgescu-Roegen [1], these technological innovations induced long-lasting techno-economic cycles due to the vast amount of energy that was made available to the human species. In this context, mastery of fire is often considered as one of the first viable innovations of the human species. The use of fire in the early stages of human evolution increased the amount of available energy, which initially could be used for basic needs such as nourishment and heating (endosomatic needs) and later diverted to find and forge metals, substituting stone tools (exosomatic needs) [2]. The industrial revolution increased the energy use towards exosomatic societal energy-dependence by harnessing the chemical energy of coal in steam-engines. Steam engines evolved into steam turbines and electrical generators and started the revolution of one of the most ubiquitous, versatile and expensive forms of energy that modern society uses to cover energy services: electricity. However, as far back as the nineteenth and early twentieth century, the question of the societal patterns of energy consumption has been addressed by different authors [3,4,5,6].
A sustainable approach for economic activities should consider the limits of the biosphere as a determinant factor. In this regard, flow-fund models [7] consider energy and material resources as flow resources which are transformed into products, by-products and waste and fund resources which are not directly embodied in the output product but provide key services in the production process. The notion of viable technologies is stressed, in the bioeconomic context [8], as the capacity of feasible recipes, similar to living organisms, to operate given a fuel flow, maintaining and reproducing their material structure (fund resources), and yielding surplus energy to society (of the desired quality), which is ultimately used to cover endosomatic and exosomatic human needs at the expense of the entropy of terrestrial energy and material resources (flows resources) [7,8]. Although there are no absolutely efficient technologies from the thermodynamics point of view, understanding the working conditions to maximize the attainable output is essential where sustainability is concerned [9].
During the last decades, there has been an accelerated growth in human exosomatic energy consumption, which has put an increasing pressure on the energy sector. Per capita, primary energy use differs among countries and regions, and the global average has significantly increased from 1970 to 2013, by more than 43%, passing from 1.37 to 1.89 (toe/(p·y)). In 2015, the European Union annual per capita average was c. 3.21 toe [10], although the energy efficiency directive (EED) 2012/27/EU [11] has set an ambitious framework to reduce energy consumption, it seeks to reduce not only the consumption of primary energy but also of final consumption [12], with target values of approximately 1.99 and 1.45 (toe/(p·y)) for 2020, respectively.
Human endosomatic needs due to nourishment have been estimated in c. 10 (MJedible/(p·d)), but recent studies suggest they can reach up to 25 [13], which roughly corresponds to an interval 0.087–0.217 (toe/(p·y)) and depends on individual physical activities and metabolism. In this respect, Sanfilippo et al. [14] studied the energy requirements and the environmental impact of different dietary choices and concluded that beef-based meals present a cumulative energy demand (CED) footprint which is 6.25 times the edible energy in foods, while the vegetarian menu merely requires 3.28 and the poultry and pork choices demand intermediate values between 3.50–4.50.
The stages of the energy trajectory (see Figure 1) can be briefly described as: (i) primary energy, which is a resource extracted from ground, sun, air, water bodies, which can be converted into (ii) secondary energy, as energy carriers to be transported or to be saved in different storage units, until finally distributed to consumers as (iii) energy services to cover all societal energy requirements. At the point of utilization, other technologies can further convert the energy delivered into services to feed civilization needs such as food production, mobility, heating, cooling, lighting, among others [12], these transformations also merit attention, particularly energy-producing processes (energy harvesting and transforming plants). Considering this trajectory, many of the worldwide efforts have sought to tackle only the first stage, although there are different primary sources available today (Figure 1), centering the debate on the renewability [15] of these sources excludes other important aspects, such as the downstream stages until the end-user is reached. Hence, renewability is different from sustainability, since the former addresses the resources, while the latter constitutes a comprehensive mindset. The yield of energy resources strongly depends on the environmental exploitable potential, as the potential gravitational energy in the case of hydroelectric or the incoming irradiance in the case of photovoltaics, but sustainable energy services require technology and/or process configurations that can meet societal needs in an efficient and sustainable way.
Formerly, rather little interest was given to process efficiency and life cycle environmental impact assessments of products and services. The growing use of life cycle assessment (LCA) studies, during the last 30 years, has generated tremendous debates regarding the applicability of this type of continuously-evolving studies and methodologies, its potential to describe the attributes of a specific production process and/or the consequences assessed through certain environmental indicators [16]. This is especially critical in the energy sector, where LCAs are used as regulatory instruments to address the two corners that the present anthropological organization must solve: the energy crisis and climate change [17].
The use of fossil fuels in thermoelectric plants or for transportation is associated with constant and direct production of CO2. One of the most recurrent proposals is the complete electrification of energy services, including mobility. This solution, although at first sight may seem quite adequate, requires a more careful analysis to evaluate its effectiveness and to avoid indirect CO2 emissions, which can ultimately lead to adverse scenarios [18,19]. An interesting solution which has been on the table for more than twenty years is the question of hydrogen [20]. Hydrogen has been under continuous investigation due to its potential to be a key player in the energy transition, mainly because of the versatility of this energy carrier, which can be integrated in different areas such as power grids [21], transport [22], heating [23], fuel-cell electric vehicles, and energy storage [24]. Nevertheless, and unlike fossil fuels, molecular hydrogen (H2) is not present in large deposits on the earth’s crust, nor is it found in the atmosphere. Even though reservoirs have recently been discovered with relatively high levels of entrained hydrogen in different basements and sediments [25], these resources are certainly not able to cover the present and future energy demand. As a matter of fact, the majority of the hydrogen which is used nowadays (>90%) is produced from fossil fuels via the reforming of fossil fuels and, in a lesser proportion, (<10%) from water electrolysis and from biomass sources [26].
Although economic analyses are often believed to capture all relevant features of a given technology [27,28], in a finite resource scenario, more complex evaluation tools are required, due to the potential negative externalities which cannot be included in price-schemes, such as the depletion of energy sources or the reduction of useful energy which is delivered to society to satisfy energy services. A simple fundamental idea, suggested by Hubbert in 1956 [29], states: if extraction of fuel requires more energy than the fuel provides, no economical argumentation can overpass this physical limit. Future energy networks are likely to include not only the technology to transform available energy resources into adequate carriers following the adequacy principle [30], but also to combine different technologies for storage purposes, seeking to increase the overall efficiency. It is fundamental to monitor these technologies used to harvest primary energy and the successive transformations which are required to deliver efficient energy services in order to produce a transition which is really in line with the precepts of sustainable development. Hence, energy sustainability should be evaluated in primis due to its hierarchical importance in the quantification of the useful energy that can be diverted from societal uses into sustainable solutions, innovations and policies. As noted in [27], it is the flow of useful energy which allows society to divert attention from endosomatic life-sustaining needs towards exosomatic needs, such as health care, arts, education, research, and innovation. Energy sustainability could be one of the most important criteria to select among different technologies which harvest resources to store energy and to use energy as a pillar in the design of technologies and/or process configurations which enable sustainable energy services [31].
ESA comprehends a practical methodology for energy-producing processes based on the flow-fund model pertaining only to energy within the technology boundary. Contrary to ecological models which address flow-fund models applied simultaneously to matter and energy and, therefore, resort to entropic levels of terrestrial resources, ESA avails itself of different indicators, which are often used in economic analysis, but adapted to energy flows and funds. The first energy sustainability indicator, which can be used for fast screening, is the energy sustainability index (ESI) [27]. This indicator compares the main flow of produced energy with the flow of direct energy input to the process (flow resources), without considering the indirect energy expenditures (fund resources). As is obvious, the ESI index is a translation of the economic parameter cash flow, and hence provides short-term information about the process, in a narrow time-window. ESI has been used in different energy production processes, for example, to evaluate the early-stage convenience of different pre-treatments on the production of biohydrogen and biomethane [32,33,34]. The second indicator, which has recently gained attention, is the Energy Return on Invested (EROI) [35]. EROI relates the amount of net energy produced (a derived flow resource within the technology boundary) to the total invested energy (fund resources of the production process), to score energy-producing processes, using different system boundaries such as society, point-of-use, technological, extended boundaries [36]. The similarity with the economic return on investment (ROI) is immediate. In the calculation of the EROI, different expenses are accounted for in the total energy invested beyond direct expenses to run the facility, hence a wider timescale is considered. Moreover, a complementary energy sustainability parameter, for the long-term level of analysis, is the energy payback time (EPT) [37], which indicates the time framework that a particular technology requires for the compensation of the indirect energy diverted for the production of materials and its construction along with other important energy investments. Again, in this case, the similarity with economic payback time (PBT) is evident.
Recently, interest in EROI has spread to a variety of multi-disciplinary fields [38]. It has been used as a common ground for the comparison of fossil fuels and renewable energy resources [39] and to link the use of different energy resources with societal welfare and development [40,41]. It has also been framed in the light of the peak-oil paradigm [35] and has been hypothesized as a key driver for biological evolution [42]. Moreover, EROI has recently been proposed as a benchmark tool by the international energy agency (IEA) in the guideline methodology for the net energy analysis of photovoltaic systems [43]. However, there is still much debate, in the scientific and policy-making communities about the correct use of energy units and their respective weighting factors when analyzing complex systems involving the use of electric power, heat and chemical energy, and about discriminating among primary energy sources [44,45]. Nonetheless, it is clear that energy sustainability evaluation is a concern which is currently under revision due to its importance for the current and future energy scenarios. In the present study, a comprehensive approach combining the short-term sustainability perspective (ESI) with the long-term perspective (EROI and EPT) has been introduced to form the ESA methodology. In addition, the ESA methodology is applied to case-study of distributed hydrogen production at small-scale (10–15 kWH2) comparing three different technologies: (i) steam-methane reforming (SMR), (ii) solar-powered water electrolysis (SPWE) and (iii) two-stage anaerobic digestion (TSAD). The analysis was conducted using data collected over long experimental campaigns (>1 year), for the production of hydrogen at the point-of-use.

2. Methodology

2.1. Energy Sustainability Analysis (ESA)

As previously introduced in [27], the ESA methodology applied to a given technology is based on the concept of viability, resembling the feature of living organisms of harnessing energy to sustain and reproduce themselves [46]. Hence, a viable technology or an energy sustainable technology should be able to produce an energy surplus, useful energy, which is able to feed society after the direct and indirect energy costs of the process itself are discounted. ESA is of utmost importance in the context of energy recovery or production process, to score the performance of technological choices based on the use of direct energy required on-site to operate the technology and on the indirect energy, which is the share of diverted energy from society, at anthroposphere level on-site and/or off-site to provide the materials, chemicals and fuels flows as well as other additional auxiliary services. The ESA aims to measure the potential of supplying sustainable energy services, at short-term level and long-term level, by means of dedicated indicators ESI, EROI, and EPT which reflect the intrinsic use of energy resources within the technology boundary.
In order to quantify all energy fluxes, an LCA approach is used, setting proper boundaries of analysis and choosing an adequate Inventory procedure. Different strategies can be applied for the Inventory step, which should be in accordance with the scope of the ESA. Hence, bottom-up as well as top-bottom approaches are valid, even a combination of them when data is not fully available, using either process flow diagrams, matrix representations, input/output analysis or hybrid models [47]. On the whole, the adopted strategy should be able to quantify the overall performance of the system under analysis, compiling the necessary data and features of the process/technology and expressing relevant energy flows in terms of consistent declared or functional units [48,49].

2.2. Boundaries of Analysis

One of the most critical aspects of sustainability studies, such as LCA, is the boundaries of the system under analysis and correspondent adopted approach. The boundaries of analysis must be well defined and should be in line with the purposes of the study in question (see Section 2.1).
The suggested ESA methodology encourages the use of the analogical model (AM), where the key energy fluxes are assessed in flow diagrams to rank and compare different technological choices. The ESA includes the technological boundaries in order to assess the internal use of energy of the given technology but also tracks the external energy flows which go through the technological boundaries. Moreover, the methodology of ESA can also be used to rationalize the Materials Input (MI) [50] and quantify the material intensity and the correspondent embodied energy that a specific technology requires. The most relevant energy flows of the AM are depicted in Figure 2.

2.3. Energy Sustainability Index (ESI)

The ESA study for a given process is conducted by the evaluation firstly the short-term sustainability level, by means of the ESI. This is a dimensionless index since it is expressed as an energy quotient that aims to compare two physical energy quantities: the produced energy (Eprod) and the spent direct energy (Edir). In the case that the system comprehends additional relevant energy fluxes, prior to the technological boundary, such as already spent energy and/or avoided energy (see Figure 2), these quantities need to be considered for the calculation of the Eavailable and computed in the evaluation of the Eproduced, as shown in Equation (1).
E S I = E p r o d   E a l r e a d y   s p e n t   +   E a v o i d e d   e n e r g y E d i r
The ESI indicator is useful to discriminate between technologies at different stages of development, mature as well as at the infancy level. Obviously, for an accurate calculation, it is necessary to use the values that correspond to average or steady-state operation conditions, or it can also be done in different time points if there are significant variations in the energy output or the direct energy of the process. However, in the case of renewable resources, a historical mean series on a significant large timescale is necessary, since the variabilities in climate conditions substantially influence the energy output. Hence the ESI index is not able to give information about the performance of the technology over its useful lifetime, but rather provides an energy performance picture at some fixed time point.
The ESI index should be greater than one, ESI > 1. For processes with ESI < 1, it is a clear indication that the technology, in the present state and working conditions is not energy sustainable. The sum of direct energy flows either from thermal and electrical nature is due to the purpose of the ESI, which is analogous to the economic parameter cash flow, but presented in terms of relationship and not as a net term (cash flow ratio), which does not differentiate between physical types of energy and serves to assess the energy sustainability at short-term level of the process independently from the apparent form of energy.
For example, a useful way to understand the ESI concept is to consider a heat exchanger, which is a technology that provides an energy service (heating a fluid) rather than an energy production process. The direct energy effect, in this case, is the quantity of heat received by the cold fluid. However, for the heat transfer to take place, it is necessary to spend a certain quantity of direct energy which is consumed for the flow of fluids (e.g., using pumps). The calculation of the ESI would, therefore, require the evaluation of the energy effect (thermal energy received by the cold fluid), as well as the direct energy expenditures (e.g., electrical power). On the other hand, the efficiency indicator merely represents the fraction of the maximum attainable heat exchange which actually occurs (η < 1), while ESI, (i.e., ideally ESI > 1) reflects the intrinsic use of energy for providing the energy service, hence, it is strictly linked with the technology and not only to the thermodynamics of heat exchange. Conversely, a condition of ESI < 1 means that the energy to move the fluid, for the above-given example, is higher than the energy which is exchanged among the fluids. Lastly, the ESI index is strongly dependent on the technological choice (type of pump) and therefore, serves for comparing purposes with substitute technologies and/or different process configurations as different type of heat exchanger or pump.
For the ESA methodology, only energy-producing technologies presenting an ESI > 1 merit to be analyzed with a more detailed approach towards long-term energy sustainability. This is particularly important because the direct energy is required at an instantaneous rate in order to run the facility and to obtain the produced energy, contrary to the share of indirect energy, which could be spent off-site or on-site and compensated at different rates along the operative technology life-time.

2.4. Analogical Model (AM)

The following step in the ESA is the rationalization of all energy quotas that are present in the process/technology under analysis, besides the produced energy and direct energy. Following [27], a suitable way to perform this step is through the use of the AM, used typically in LCA studies for the inventory analysis [51], combined with a bottom-up approach. The AM comprehends a careful look at the process, within the chosen boundaries, to calculate the energy contributions (Eind,i) of the indirect energy (Eind) using Equation (2), where n represents the number of the considered components in the analysis (see Table 1).
E i n d = i = 1 n E i n d ,   i
Table 1 reports the components of Eind, some of these are difficult to estimate, the importance and weight strongly depend on the process under analysis and on the chosen approach. However, useful recommendations are found in [34,52]. An exhaustive study should, therefore, include chemicals and materials, which are generally monitored through mass balances or input-output accounting, but is necessary to express these terms as energy fund resources, which is the scope of the ESA. The indirect energy expenditures can be obtained through the use of tabulated cumulative energy demand (CED) values [53], which in some cases are referred as gross energy requirements (GER), to quantify the equivalent primary energy which is invested for the entire process chain of materials and chemicals, prior to the technological boundary [54]. Additionally, and based on previous performance studies or available data, the total mass of required materials and chemicals (i.e., mchem and mmat, respectively) over the useful lifetime of the plant should be estimated, for the calculation of the Echem and Emat, as follow:
E c h e m = i = 1 n C E D i · m c h e m , i
E m a t = i = 1 n C E D i · m m a t , i
Although the approach is bottom-up, the layer on which the ESA is carried out corresponds to the technology level. Hence, values of CED are used to transform the materials and chemicals flows into energy funds at the technological boundary. CED values are, typically, of empirical and integral nature, which tend to encompass the quota corresponding to the production, disposal, recycling and transport of each item and can be found in environmental data banks [55,56].
Through the AM, each component can be identified and quantified, detecting limiting steps and also allowing rational modifications, substitutions or improvements of the process.
One of the most critical factors is the energetic footprint of materials and chemicals, even though materials enter into the system as matter, its production and/or assembly has an energetic cost considered in the ESA as energy fund-resource, in many cases at different geographical locations. For example, an installed Photovoltaic System in Europe but produced abroad has an energetic burden to society in energy terms, however, the economic analysis includes the disparity in salaries and services costs between countries, which can mislead sustainability studies [57].
A complex term to evaluate is the energy used to sustain human labor (Elabor). This contribution tends to be disregarded in different studies [58] or allocated as general energy services. In the Author’s opinion, it is important to consider the energy expenditure of labor in ESA analysis to prevent large errors in the estimation of energy sustainability. For example, the labor energy contribution in PV systems is close to zero, while in the cultivation of sugar cane for ethanol production, labor contribution is very significant. However, in large-scale energy-producing facilities, human capital and its energy consumption tend to be very low compared to the other relevant energy fluxes, but it could become limiting in small- and medium- scale facilities. The labor contribution includes different terms. First of all, the food, dietary edible energy consumption), and the correspondent spent energy from the ground to the table [14]. In addition, the Elabor includes additional energy services necessary for the correct accomplishment of the required tasks: heating, air conditioning, transportation, uniforms, recreation, among others. Nonetheless, these additional contributions are very difficult to evaluate because they depend on the localization of the plant and on the modus vivendi of the workers. In the present study, Elabor was calculated by considering the edible energy embedded in the food plus the indirect expenditures to produce it.
The terms of Emaint, Econstr, and Edecomm are important to have a broad vision of the energy performance of the full life cycle of the plant under analysis. The construction and decommissioning quotas are fundamental, overlooking them can lead to neglect large energy contributions. The decommissioning phases (demolition, decontamination, transport, and recycling or landfill disposal) depend on the type of materials and also on the local regulations that determine the different recycling and/or disposal scenarios [59]. It is a term which is controversial due to the great uncertainty associated and the difficulties to estimate the share of energy necessary for these purposes, in this sense, the amount of energy that must be destined for the decommissioning phase can be estimated through LCA studies or based on the knowledge of the materials used.
The production of Edir which is given to the process/plant has also an indirect energy cost (Eind to prod edir). This quota is thus included in the quantification of indirect energy since, in order for Edir to enter the process, an additional amount of energy must be spent. This contribution, which is present in the AM (see Table 1), could be an energy expenditure on- or off-site, depending on the type of process. If a plant is equipped with a cogeneration plant, capable of producing the two most used direct energy qualities, thermal energy, and electricity, the cost of Eind to prod edir is the energy expenditure associated to the cogeneration plant (on-site), while if the energy arrives at the plant from an off-site point, e.g., the national electricity grid, the Eind to prod edir contribution can be estimated using the CED of the electrical production mix as well as other relevant stage efficiencies [12].
Another important term which is fundamental for the ESA methodology is the vitality of energy-producing processes, similar to living organisms which assure their sustainability by generating offspring. Eamort is an energy fund resource, which takes into consideration the capacity to reproduce its materials structure (i.e., inherent to vital systems provided with energy flow resources). This contribution is assumed to correspond, in the ESA, to the sum of the Emat and Echem and serves to amortize in energy terms, over the operative technology life-time, the required materials and chemicals of the replacement facility at the end of the technological life assuming that the energetic societal requirements still need to be covered. In this sense, the present ESA methodology aims to establish not only the net energy balance of the process but also the continuity of the supply of sustainable energy services at societal level, which can only be assured if part of the produced energy is stored elsewhere or destined to the production of the necessary materials and chemicals to reproduce a similar plant, possibly with higher useful energy yield.

2.5. Energy Return on Invested (EROI) and Energy Payback Time (EPT)

The long-term sustainability potential is assessed through two important indicators: Energy return on investment (EROI) and energy payback time (EPT). Once the AM has been constructed and the indirect energy has been quantified, two relevant derived energy fluxes can be calculated:
E n e t =   E p r o d   E d i r
E u s e f u l =   E n e t   E i n d
which can be then used for the calculation of EROI and EPT, as follow:
E R O I = E n e t E i n d
E P T = E i n d E n e t m
The EROI (Equation (7)) is the ratio between the net energy (Equation (5)) and the indirect energy, the particular components of this term are discussed previously in Section 2.4. In order to calculate the EPT (Equation (8)), it is necessary to compare the total indirect energy required in the technological life of the plant to the average annual rate of net energy production by diving the overall net energy production over the years of useful life—m), in order to determine the time that will take the system under analysis to repay the indirect energy that was diverted from other societal purposes for its construction and operation.
Finally, Equation (6), Euseful represents the real energy available to sustain the societal energy demand to cover a wide range of energy services (see Figure 1).
Although there are different methodologies for the calculation of EROI, this study proposes the use of net energy, which corresponds to the produced energy discounted by the direct energy, divided by the integral value of indirect energy. The EROI indicator, in the present formulation, uses integral values of indirect energy, including the vitality term.

3. Case Study: Distributed H2 Production

The case study regards the distributed production of hydrogen, using three different technologies, and the comparison of the short-term and long-term energy sustainability among them. The three technologies for distributed hydrogen production under analysis are steam-methane reforming (SMR), solar-powered water-electrolysis (SPWE) and two-stage anaerobic digestion (TSAD). The nominal power of the technologies are 10 kW(H2), 10 kW(H2), and 15 kW(H2), respectively. In the latest case, experimental tests were conducted at laboratory scale using a bench-scale pilot plant and results were scale-up by adequate procedure considering constant kinetic productivity and geometric similarity as bases [52]. Simplified flow diagrams of the three experimental plants are presented in Figure 3. The selected approach for the case-study is bottom-up, applied by collecting data for each case corresponding to long experimental campaigns. These tests lasted more than one year to assess the performance of the systems, evaluating the materials and chemicals input, the direct energy expenses and monitoring all the key parameters necessary to conduct the ESA analysis.

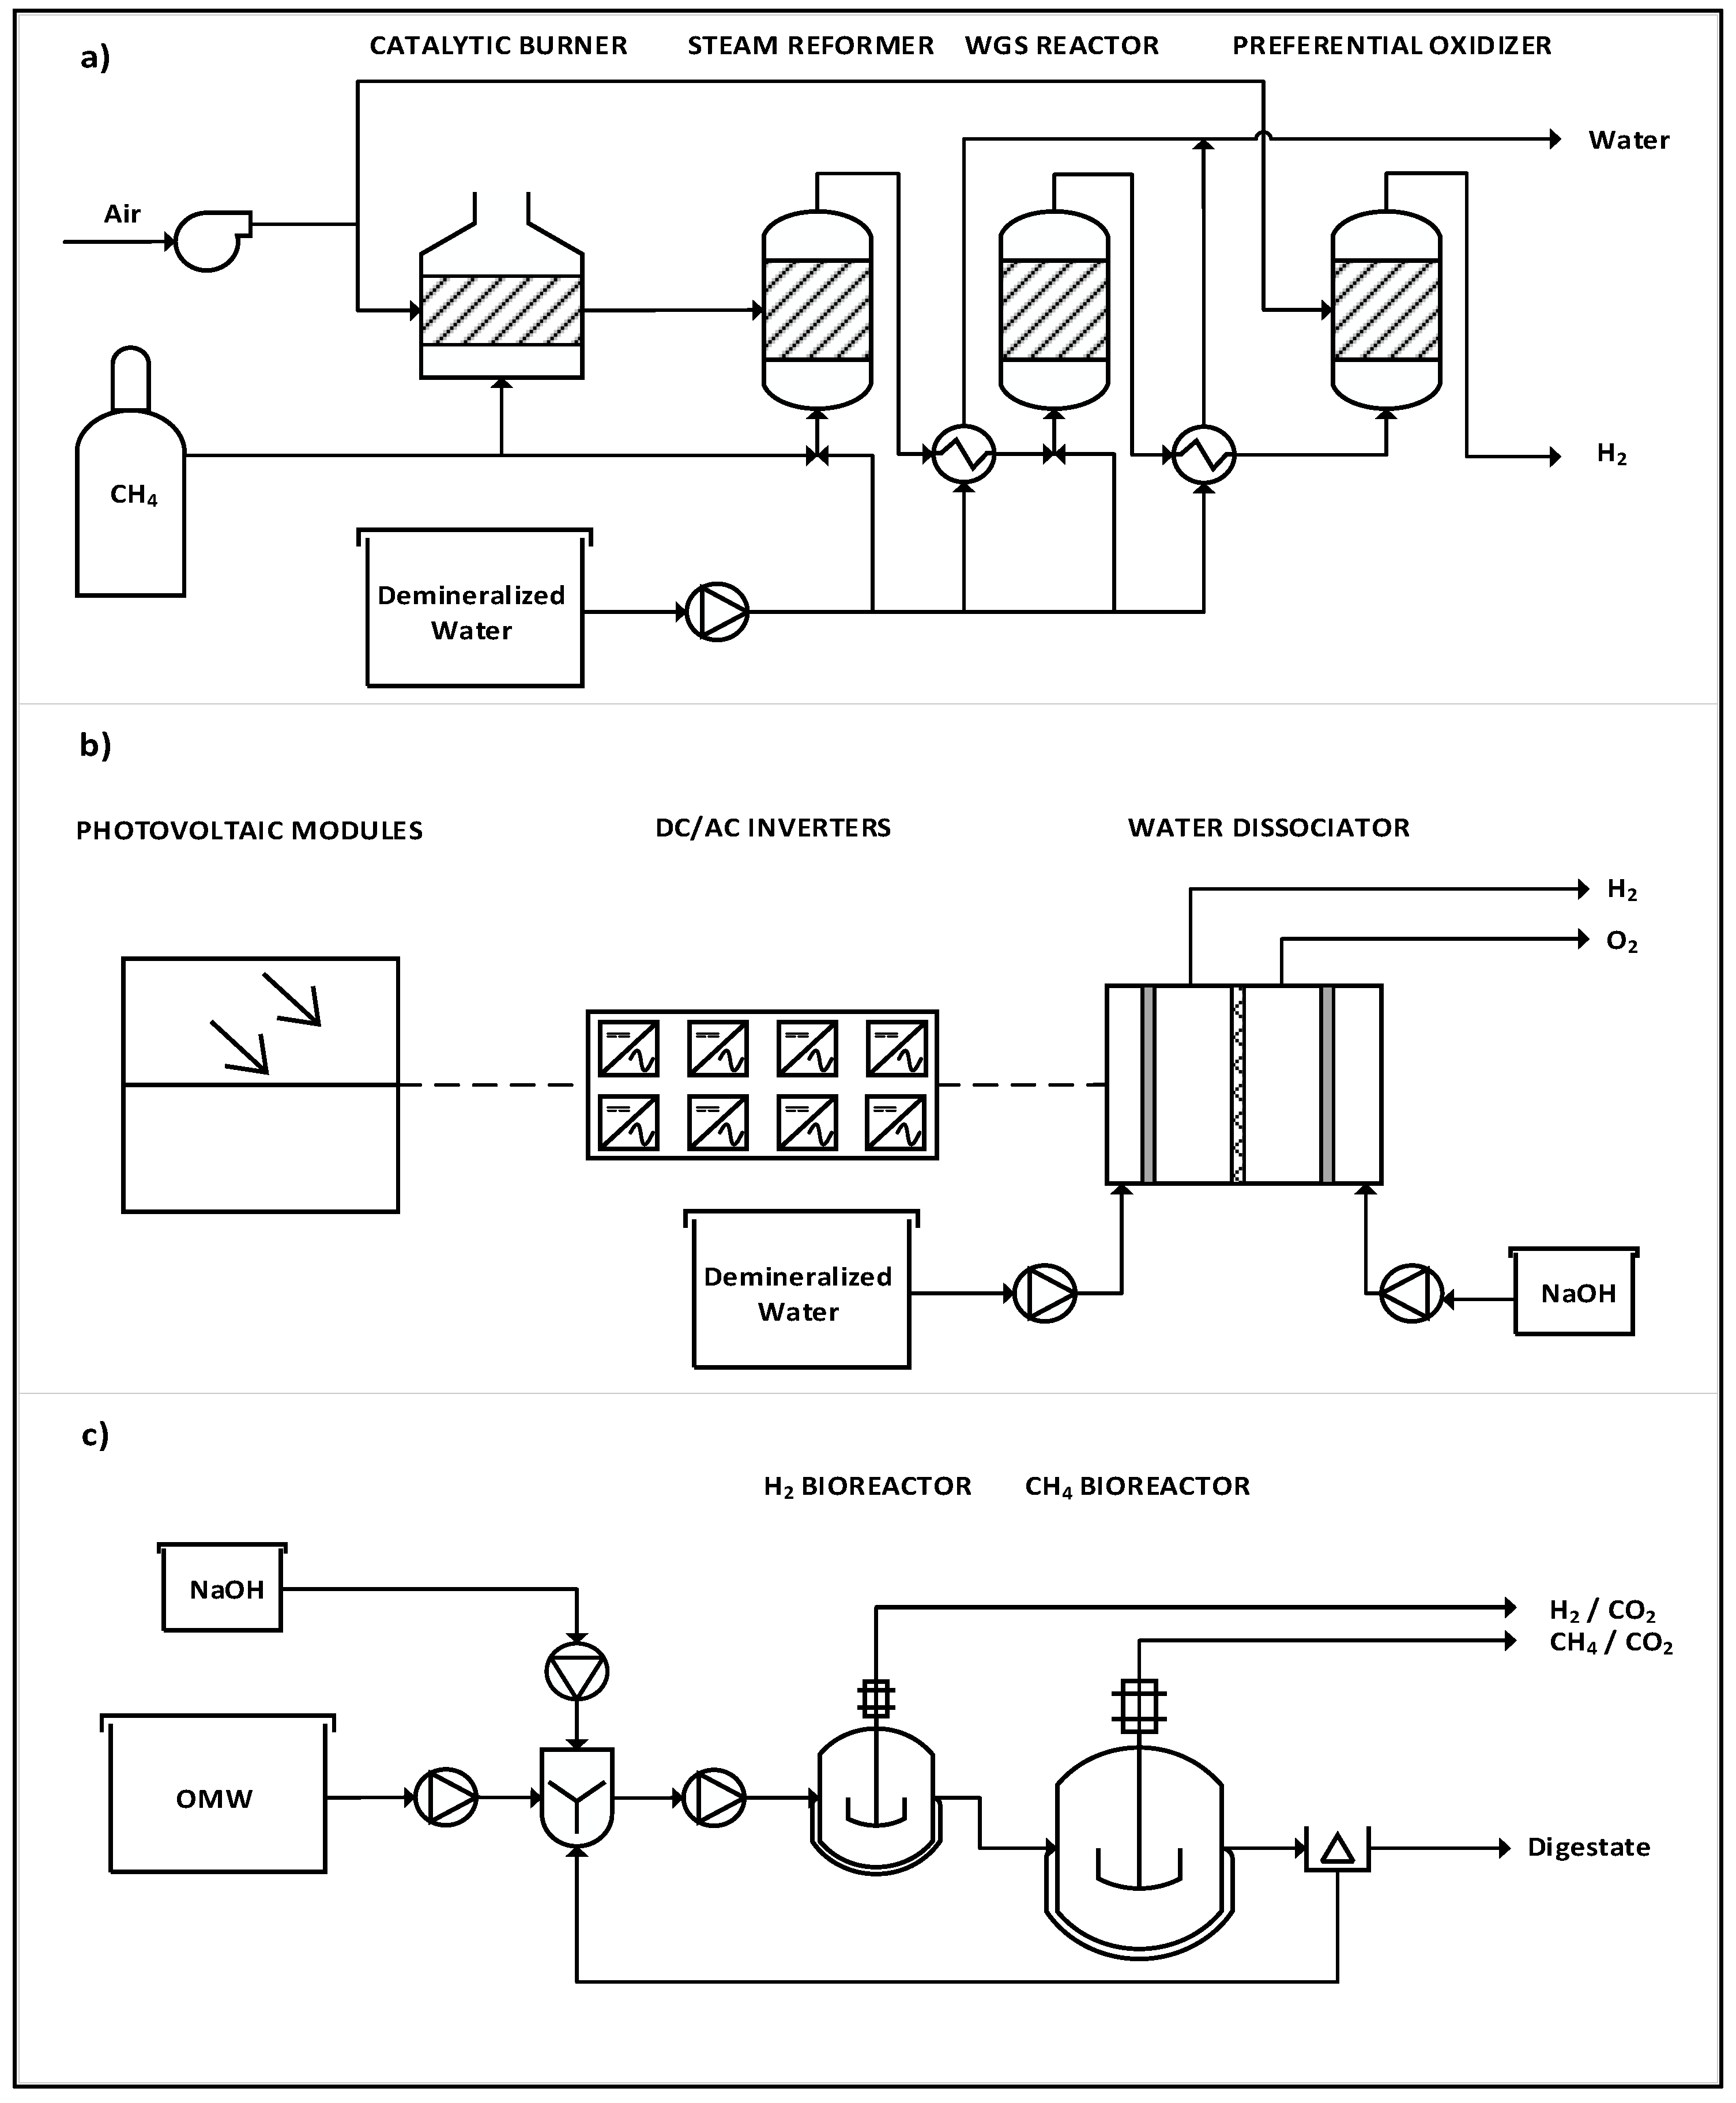
3.1. Steam-Methane Reforming (SMR)

With reference to the general flow diagram of the SMR systems of Figure 3a, the experimental tests were conducted using an Ultraformer compact fuel processor unit (Catator AB, Lund, Sweden). The design of this unit allows flexible feeds, either gaseous such as biogas, natural gas, and methane or liquids fuels as liquified petroleum gas, naphtha, methanol and ethanol [60,61].
The system comprehends four wire mesh catalytic units, integrated into a compact block, to carry out the process of SMR, which are:
  • Catalytic Burner (CATBUR), where methane is fed from a gas cylinder, i.e., high purity >99.995% mol/mol) and mixed with air, in an excess of O2 of 50–60% of the stoichiometric ratio, to provide the temperature conditions of the highly endergonic reaction of steam-reforming,
  • the proper Steam-REFormer (SREF), where water or water vapor are mixed with methane, to permit the steam-reforming reaction to take place (see Table 2) using the heat produced in the burner (ΔHreaction = +206 kJ/mol CH4),
  • the output gases are then sent to the Water-Gas Shift (WGS) reactor, where carbon monoxide is further oxidized to carbon dioxide. Water is required for this step as a reactant and as cooling agent due to the temperature differences with the previous units, (ΔHreaction = −41 kJ/mol CO),
  • the final unit is the Preferential Oxidation unit (PROX), which aims at oxidizing some of the reaction by-products of the previous stages into CO2, in order to meet the gas output stream specifications. This unit requires air input (O2) and cooling water, and it is composed by two sections (PROX1 and PROX2), which operate at different temperatures, in the 125–130 °C and 100–105 °C ranges, respectively.
Other process configurations often include pre-treatment units, such as hydrodesulfurization, to remove impurities prior to the SMR, while others also include in the downstream phase NOx and CO2 capture units, which in the experimental set-up under analysis were not present since the feed to the system was high purity grade methane. However, these contributions can affect the overall energy sustainability and should be included in the pertinent cases. An outlook of the chemicals flow and the different materials used in the Ultraformer are presented in Table 3.

3.2. Solar-Powered Water Electrolysis (SPWE)

The second technology which was tested for the production of hydrogen consists of a combined system of PV panels coupled to a water electrolyzer. The PV system is composed by commercially available photovoltaic cells (Sunways Plus, Hefei, China), placed in a wave-form array to optimize the capture of solar radiation at the Environment Park of Turin (Italy, 45°05′14.1″ N 7°40′25.7″ E).
The support consists of a triple-glazed double-glass (i.e., glass thickness 22 mm, 80 kg/m2 max. wind load and 190 kg/m2 max. snow load) semi-transparent structure covering c. 190 m2, containing 160 modules of 100 × 100 mm polycrystalline cells (i.e., 78 cells per module). The PV modules are arranged in 8 parallel strings, Solar Irradiance (SI) is measured at the bottom, therefore proportional values of SI were estimated through the ratio of the curvature, diving the total area in five key strings as presented in Table 4. The DC output from the PV modules is connected to a series of eight inverters (SMA Sunny Boy 1700E, Niestetal, Germany) in order to convert the DC to AC, which is fed directly into the Water Electrolyzer (Idroenergy Spa. 3.7, Livorno, Italy), a general diagram of the system is shown in Figure 3b.
Coupling PV power generation to water electrolysis is difficult due to variations in the daily and seasonal SI. This produces a variable power output from the PV modules and leads to under-utilization of the capacity of the electrolyzer [62], which should be then supplied ultimately by grid electricity (Figure 4) or an energy storage systems to maintain a constant flow of produced hydrogen.
Hence, the components of the experimental set-up were carefully selected, the maximal nominal power of the electrolyzer is c. 80% of the maximum output from the PV arrangement, further technical data of the main equipment considered for the analysis can be found in Table 5.

3.3. Two-Stage Anaerobic Digestion (TSAD)

Finally, the third technological option belongs to the biotechnological field and is the utilization of a Two-Stage Anaerobic Digestion (TSAD) system for the production of bio-H2 and bio-CH4, using organic waste as feed [33,63]. The flow diagram of the system is presented in Figure 3c, the process configuration comprehends two CSTR operated in series. The experimental data were collected using a laboratory setup composed by a Minifors I bioreactor (Infors HT, Bottmingen, Switzerland) for bio-H2 production and a Chemap fermenter (Chemap AG. CH-8708, Manedorf, Switzerland), for bio-CH4 production with a working volume ratio of 1:10. Both bioreactors were inoculated with adequate microbial consortia for the optimized production of each biofuel [64], the tested substrate was the organic fraction of municipal solid waste (OFMSW), additional information can be found in [34,63].
In order to perform a more adequate comparison with the above-presented technologies, the obtained yields in laboratory scale (see Table 6) were used for the scale-up procedure [52,65,66] as design specifications for a system to have a production comparable to the other technologies of this case study, in the range 10–15 kWH2 (Table 7).
Moreover, Table 8 shows the sizing parameters used to perform the ESA. They are necessary to quantify the number of materials and chemicals (indirect energy) that are necessary for a plant of the required conditions.

4. Results and Discussion

4.1. Direct Energy and ESI

Although for the calculation of ESI (Equation (1)), the main fluxes to be compared are the direct energy and the produced energy, in the present case study relevant flows of energy previous to the technological boundaries significantly influence the results. Following the AM (Figure 2) the amount of available energy in the primary energy source for SMR and TSAD was estimated using the LHV values of CH4 and biomass (OFMSW) respectively. In the case of SPWE, the primary energy source was calculated based on the available yearly average irradiance at the geographic coordinates of the photovoltaic panels. However, for SMR, there is an energy flow of already spent energy associated with the methane production phase, which includes extraction, pre-treatment, and transportation to the point-of-use estimated using the CEDCH4, using the SimaPro 7.2.4 software (2010) and the Ecoinvent data v2.0 database [55]. In the case of TSAD, since the OFMSW is obtained from the differentiated collection of MSW, there is an energy cost associated to the sorting step of about 100 kWh/tonMSW [65] and an important flux of avoided energy that corresponds to the energy saved for the avoided waste-to-landfill scenario (~117 kWh/tonMSW) [65]. The produced energy for SMR, SPWE, and the first stage (S1) of the TSAD corresponds to the energy contained in the produced H2, for the first case due to the chemical conversion of CH4, while for the second case corresponds to the production of the electrolyzer using electrical energy, which accounts for 8–10% of solar primary energy and electric grid supply. The materials input for each case is reported in Table 9, while the computed direct and indirect energy flows, as well as the primary energy and available energy for each case are shown in Table 10. For the two-step system TSAD (S1 + S2) the sum of energy contained in the produced H2 and CH4 was considered (see Table 10).
The direct energy in each case corresponds to the energy expenses during operation, which ideally consumes a fraction of the produced energy to meet the requirement for short-term sustainability, ESI > 1. Moreover, the different contributions of the indirect energy for each case, which allow the further assessment of the long-term sustainability, are displayed in Figure 5.
SMR is a technology that requires high working temperatures, due to the thermodynamics of the reactions involved in the process along with a continuous flow of gases, which also requires a high-power input for the compressors. In this case, only the direct CH4 spent at the burners was considered as direct energy expenditure, while the CH4 at the reformer was accounted as chemical, hence only CEDCH4 was considered as already spent energy.
PV has few direct energy expenses, mainly the electrical energy consumption of the inverters (with different threshold during operation and stand-by conditions), which, although rather modest, were still considered in the analysis. When the PV system is coupled to the water electrolyzer, the required direct energy significantly increases, since the system then requires a continuous supply of electricity and not only during the hours of SI, to operate in optimal conditions, and therefore the deficit is supplied by the electric grid. The experimental tests conducted with the electrolyzer showed a long start-up time (approximately 50–60 min) until operative conditions were achieved and resulted in an average power demand of 7.81 kW, with H2 production of 0.92 Nm3/h and an average yield of 39.63%, which contrasted with the values for steady-state operation: 8.11 kW power, 1.83 Nm3/h H2 production and 72.17% efficiency.
In the TSAD case, the main contributions to the direct energy are: (i) the expenses to heat the feed up to the working temperature conditions (35 °C) of the bioreactors (ii) to compensate the environmental thermal losses and (iii) the electrical energy input to the agitators, which is a requirement in both stages (S1 and S2), although in different proportions [63], and to other auxiliary equipment [34,67].
The first screening, as explained in Section 2.3, consisted in the calculation of the ESI indicator, which resulted in >1 (Figure 6) for all the three systems except for the S1 configuration of the TSAD, where a value of 0.12 was obtained. Alone S1, as shown in Table 10, the energy produced (H2) was not enough to cover direct energy expenses, whereas when the complete system is considered (S1 + S2), the produced energy was sufficient to supply the direct energy. This means that the energy produced in the form of hydrogen was enough to cover only 12% of the direct energy requirements, short-term sustainability is not guaranteed and therefore the long-term analysis, via EROI, could not be conducted for this configuration. On the other hand, for the combined configuration (S1 + S2), the ESI value was 3.63 (Figure 6), which respected the first criterion of the ESA methodology for the subsequent phases.
For SPWE, the only use of PV panels had a very high ESI value (ESI~180) due to the low energy expenditure that the PV system had during operation, while for the coupled system of (PV + WE), the ESI was very close to 1 (calculated as produced H2 on electrical energy supplied as summation of that produced by PV plus that input from the grid), which indicated that the technology hardly meets the criteria for short-term energy sustainability. Lastly, SMR technology with an ESI value close to 2.5.

4.2. Materials Input (MI) and Indirect Energy

The next phase of the ESA consists in the quantification of the indirect energy carried out by considering CED SimaPro 7.2.4 and the aforementioned database [55] to estimate the amount of energy used for extraction, manufacturing, and transport of the materials and chemicals of interest. CED values were used as reported in the database, using the cumulative terms for all energy sources without any weighting factor. In addition, as a common temporary reference framework, a useful lifetime of 20 years for the three technologies was set and the corresponding assessment of the elements that must be replaced when their useful life is inferior to that of the technology was included (Table 9).
The next stage consisted in the use of Equation (4) to estimate the total energy footprint, as energy fund resources of the process, of the materials, which is given by the sum of the particular contributions of each material times the specific CED. Moreover, the choice of materials and assembly methods can significantly influence the amount of energy embedded in the technology, and ultimately its long-term energy sustainability.
For the case of SMR, the total required mass of materials was low, in fact, the employed technology (Ultraformer) was designed for small-scale applications, mainly domestic use and/or urban transportation, which require a compact structure and limited quantities of materials. On the other hand, some of the required materials such as the catalytic meshes are very energy-intensive (high CED values), which are additionally, subject to deactivation over operation and must, therefore, be replaced periodically (Table 9).
For the SPWE technology, the MI and their corresponding energy footprint were computed considering not only the photovoltaic panels and the structure, but also taking into account the corresponding CED for the necessary electrical components. As reported in Table 9, the MI used for the panels and the bracket was quite high in the order of 104 kg, while the other components presented a lower MI in the 10210–3 kg range. Where the embedded energy of the PV modules is concerned, recent studies provide diverse CED values, with large uncertainties, for the different types (mono-, poly-crystalline, and metals-based thin-film), ranging from 200 kWhel/m2 up to 1500 kWhel/m2 [68,69,70,71]. However, the values reported in literature should be carefully considered. The CED values for the PV modules of the present case study corresponded to the actual values for the type under analysis.
Finally, the case of the TSAD presented a large MI (in the order of 104 kg), mainly dedicated to the construction materials for both fermenters (with relatively low CED), in particular, large amounts of cement and insulating material and lower amounts of steel for auxiliary equipment and pipelines.
The total indirect energy was calculated using the materials presented in Table 9 (Emat), the flows of chemicals (Echem) required for the operation and estimating the corresponding energy quotas for maintenance (Emain), construction (Econstr) and decommissioning (Edecomm), in addition to the indirect energy quota needed to produce and use the direct energy (Eind to prod edir). The labor contribution (Elabor) was only considered for the TSAD system, considering the mean CED to provide the daily calories of human diet (Section 2.4). On the contrary, the SMR and the SPWE do not have allocated Elabor shares, because the daily operation did not require dedicated human operators. The SPWE case is similar to SMR, labour force is only required for some special operations, such as start-up, cleaning of panel surface, eventual replacement of PV panels due to some adverse weather events. Finally, the contribution of Eamor was calculated for each case under analysis, as explained in Section 2.4, including the energy quota corresponding to the sum of indirect energy of materials and chemicals for the replacement facility at the end of technological life of the plant.
Figure 5 reports the share of each component of the indirect energy, in percentage, which most important contributions are:
SMR: indirect energy was mainly constituted by three key contributions: the energy of chemicals (35.93%), the Eamor which is 36.45% and the Eind to prod edir (26.83%), which corresponds to the energy costs of methane production (Figure 5a).
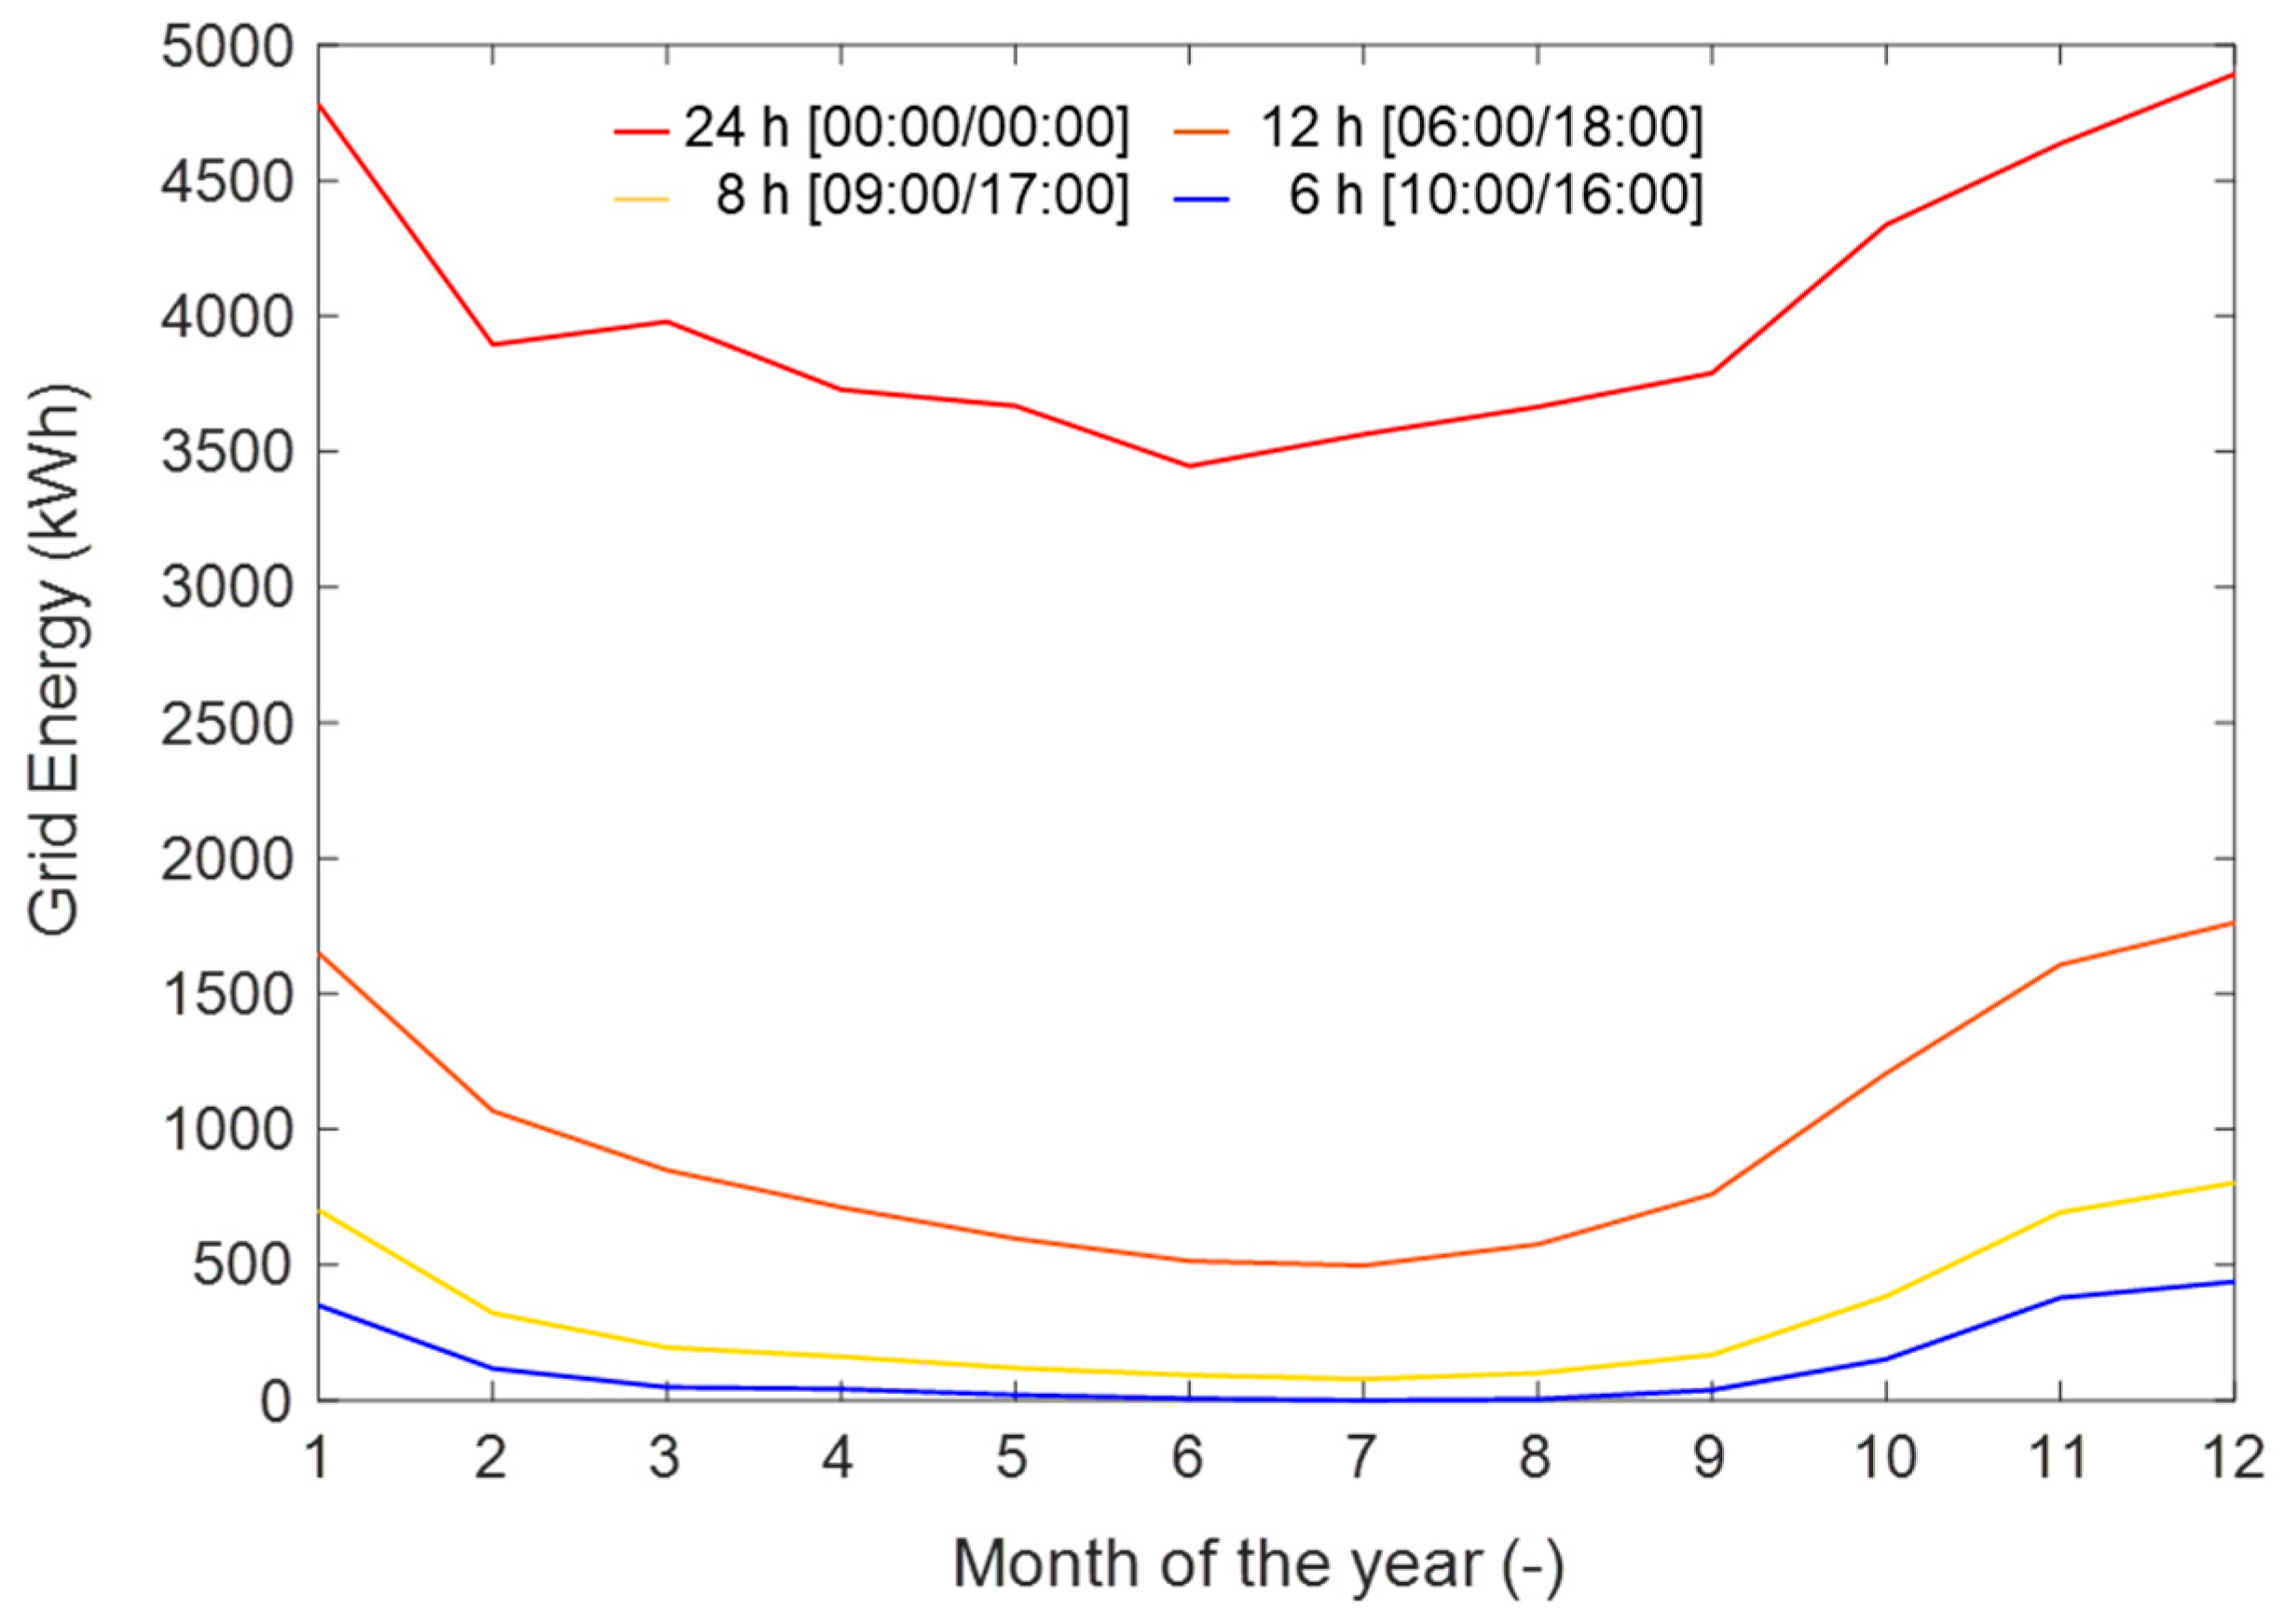
SPWE: for the PV alone system, most of the indirect energy (87.70%) corresponded to materials and amortization in equal proportions since there are no chemical flows requested for operation, the Emaint and Econst fractions are low, together representing 5.72%, while the Edecomm corresponds to 6.59% (Figure 5b). For the case of SPWE (Figure 5c), the flow of indirect energy significantly increased, mainly due to the grid power input, which was necessary to supply the electrolyzer during the hours when there is no SI and/or when it was not sufficient to run under optimal conditions. For SPWE the distribution of the indirect energy changed, and the Eind to produce edir amounted to 90.55%, the Eamor 4.14%, and the Emat 4.10%.
TSAD: The system configuration of only S1 and two-stages (S1+S2) presented a distribution of indirect energy mainly constituted (78.11–83.40%) by the Eindto produce edir, which was the energy required for maintaining operative mixing and temperature conditions, while materials represented a modest fraction (3.80–5.34%), as well as the share of chemicals (1.14–3.84%). The Econst and Edecomm were relatively low (<1%) for both cases under analysis. The Elabor, which was assumed to be an operator during the 365 days of the year, resulted in a fraction of 5.06% for the case of S1, while for the system (S1 + S2) it represented only 1.50%. Finally, the share of Eamor resulted in 7.65% for S1 and the S1 + S2 system in 6.48% (Figure 5d,e).
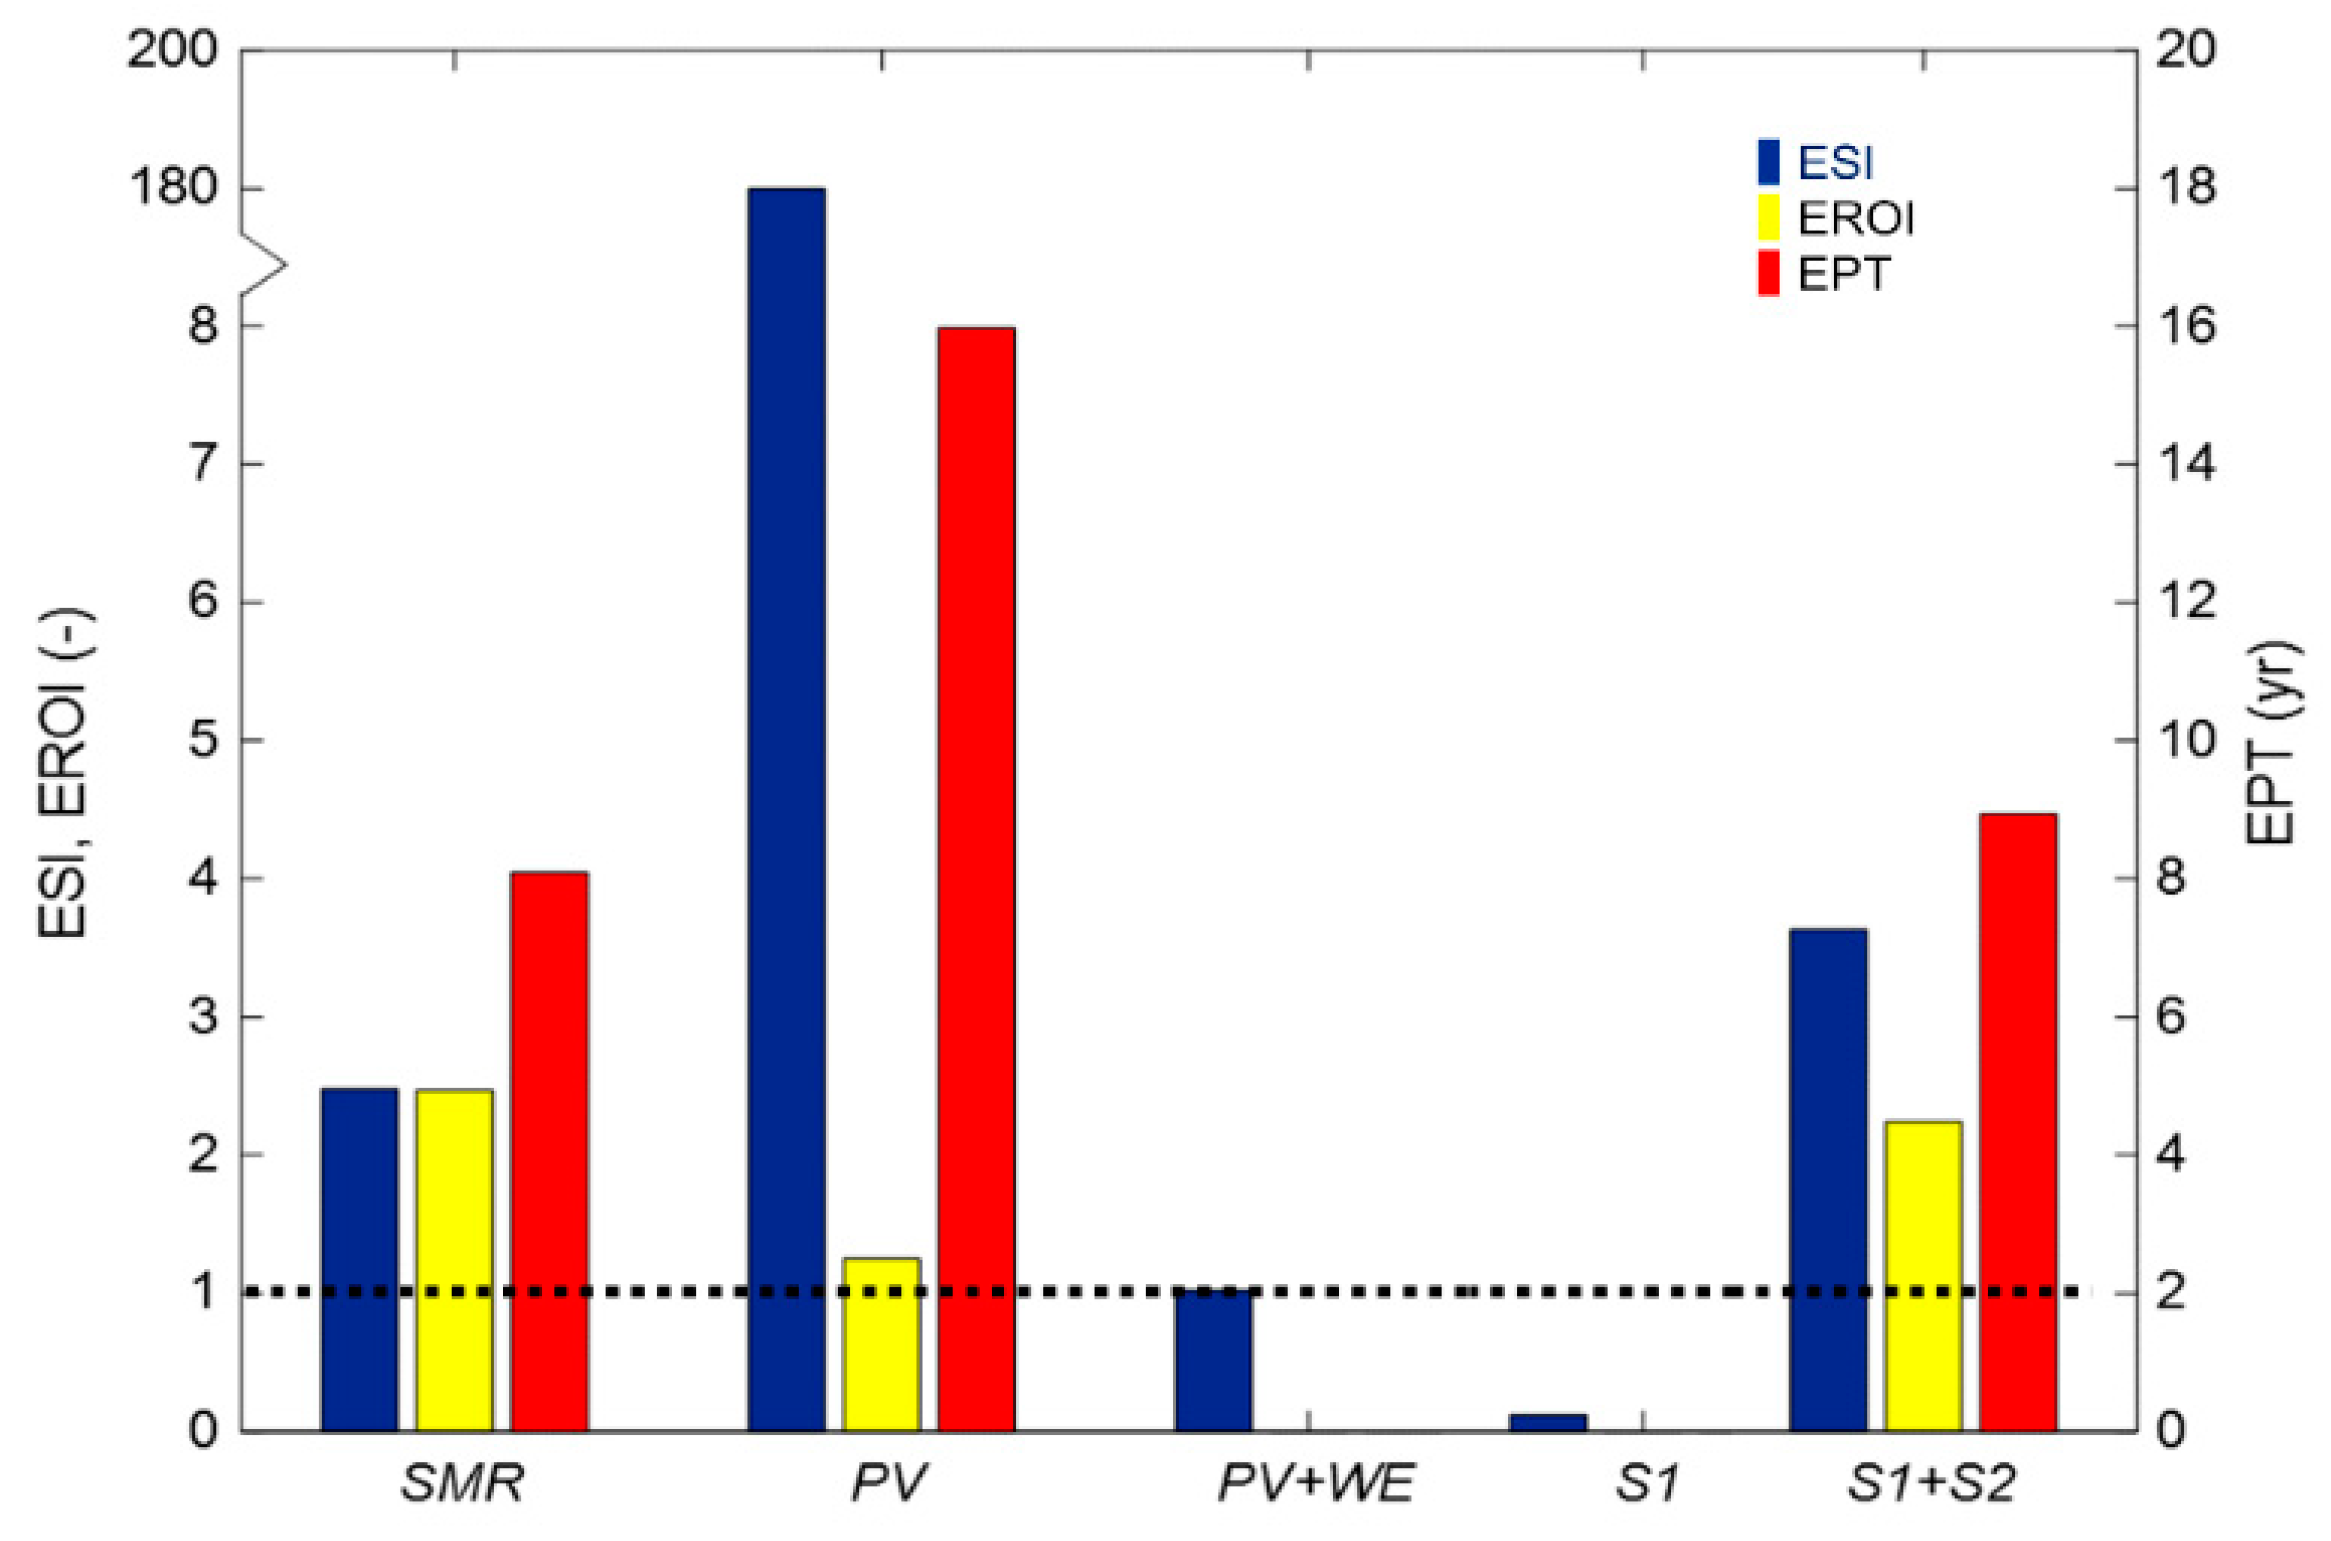
After calculating the different components of the indirect energy and the quantification of the total value, the indicators of the ESA can be obtained, by applying Equations (2)–(6) according to the flow diagrams depicted in Figure 2. The final results of ESA analysis are reported in Table 10 and Figure 6.

4.3. EROI and EPT

The last step of the ESA is the evaluation of long-term sustainability by means of the EROI and EPT indicators, as presented in Section 2.5, applying Equations (7) and (8). Figure 6 shows the comparison of the energy sustainability parameters for all the technology considered in this case study.
For SMR and TSAD, EROI values of 2.47 and 2.24 were obtained, respectively. For SPWE, the PV system alone yielded an EROI value of 1.25, while the combined system (PV+WE) resulted of 0.01, which means that for every 100 units of invested energy, only 1 or less than one was obtained. This indicated that long-term energy sustainability of this technology was not reached, at least under the studied configuration. Finally, the estimated EPT in years amounted to 8.09 for SMR, 15.97 for only PV and 8.94 for TSAD. Since the combined SWPE system (PV + WE) technology yielded a low EROI value (i.e., < 1), the EPT evaluation is unrealistic.
As a general comment, it is possible to affirm that despite different methodologies try to assess the performance of energy production processes and technologies, especially in the field of renewable energies, for the sustainability perspective it is not enough to conduct net energy balances. Furthermore, the quantification of the net energy, typically computed as output-input difference at the technological boundary neglecting the indirect energy for large scales plants could be acceptable, but become significant for small ones, thus making the ESA analyses strongly dependent on the scale under study as shown in [34]. This fact partially explains the great uncertainties that are usually linked with these indicators, which also have given rise to multiple debates on how energy analysis should be conducted. Moreover, the present ESA methodology includes the temporal dimension of sustainability evaluated at two levels, since in the Author’s opinion, is fundamental to understand the viability of a continuous supply of useful energy to sustain societal demand. For this, in the present case, the Eamor quota is included, aiming at precisely deducting from the useful energy delivered to society a fraction that should be available exclusively for the future self-replicability of the technology.

5. Conclusions

The case study of ESA methodology on H2 production reported in this paper shows how to evaluate different technologies of different nature, based on an energy accounting flow-fund model within the technology boundary. Hence, the ESA takes a closer look at the way in which each technology requires and produces energy, either directly or indirectly. The cases under analysis (SMR, SPWE, and TSAD) have different characteristics such as primary energy source, intermediate carriers, direct and indirect energy expenditures and, in addition, produces different useful energy flows and has been presented with a detailed outlook to the relevant indirect energy contributions. As it concerns the short-term energy sustainability, PV for only electricity generation resulted as the best-performing (ESI = 180), while the coupled system with water electrolysis aimed at producing H2 resulted in a modest value (ESI = 1.25) and an EROI < 1, indicating that long-term sustainability is not met. Moreover, DF alone for the production of bio-H2 did not meet the requirements for short-term sustainability (ESI = 0.12), while the system coupled to AD considering the additional energy produced under the form of bio-CH4 resulted in ESI = 3.63. SMR complied with the criteria either for short-term or long-term energy sustainability since ESI resulted in 2.48, EROI in 2.47 and the EPT in 8.09 years.
However, after the application of the ESA, other relevant Life Cycle Assessments (LCA) should be performed to quantify additional environmental sustainability issues. It should be highlighted that the ESA analysis aims to evaluate the energy sustainability of technologies and to score them, and not to score the energy sources. In fact, in the present case study, SMR proved more sustainable even if it is fed by non-renewable resources. However, in order to score the energy resources, additional issues need to be taken into account. Lastly, the ESA methodology offers a consistent approach, which encompasses the different energy flows that cross the boundaries of a determined technology and it that can be of great help for future energy systems to find the best technological configurations and to quantify, if extended, the scarcity of energy sources at broader levels beyond the technology boundary.

Author Contributions

Conceptualization, B.R. and C.E.G.C.; methodology, B.R. and C.E.G.C.; software, B.R. and C.E.G.C.; validation, B.R. and C.E.G.C.; formal analysis, B.R. and C.E.G.C.; investigation, B.R. and C.E.G.C.; resources, B.R.; data curation, B.R. and C.E.G.C.; writing—original draft preparation, B.R. and C.E.G.C.; writing—review and editing, B.R. and C.E.G.C.; visualization, C.E.G.C.; supervision, B.R.

Funding

This research received no external funding.

Acknowledgments

The authors kindly thank Giuseppe Casti, Alessandro Peiretti and Stefano La Malfa for their valuable support in the experimental tests and for the data compilation.

Conflicts of Interest

The authors declare no conflict of interest.

References

  1. Georgescu-Roegen, N. The Promethean Condition of Viable Technologies. Mater. Soc. 1983, 7, 425–435. [Google Scholar]
  2. Lotka, A.J. Elements of Physical Biology. Nature 1925, 116, 461. [Google Scholar]
  3. Sacher, E. Grundzüge Einer Mechanik der Gesellschaft; Fischer: Salzburg, Austria, 1881. [Google Scholar]
  4. Geddes, P. An Analysis of the Principles of Economics. Proc. R. Soc. Edinburgh 1884, 12, 943–980. [Google Scholar] [CrossRef]
  5. Clausius, R. Über die Energievorräte der Natur und ihre Verwertung zum Nutzen der Menschheit; Max Cohen & Sohn: Bonn, Germany, 1885. [Google Scholar]
  6. Soddy, F. Cartesian Economics: The Bearing of Physical Science Upon State Stewardship; Students’ Unions of Birkbeck College; The London School of Economics: London, UK, 1922. [Google Scholar]
  7. Georgescu-Roegen, N. Energy and Economic Myths: Institutional and Analytical Economic Essays, 1st ed.; Pergamon: Oxford, UK, 1976. [Google Scholar]
  8. Vivien, F.-D.; Nieddu, M.; Befort, N.; Debref, R.; Giampietro, M. The Hijacking of the Bioeconomy. Ecol. Econ. 2019, 159, 189–197. [Google Scholar] [CrossRef]
  9. Kerschner, C.; Wächter, P.; Nierling, L.; Ehlers, M.H. Degrowth and Technology: Towards feasible, viable, appropriate and convivial imaginaries. J. Clean. Prod. 2018, 197, 1619–1636. [Google Scholar] [CrossRef]
  10. The World Bank/International Energy Agency (IEA). Energy use (kg of oil equivalent per capita)|Data. Available online: https://data.worldbank.org/indicator/eg.use.pcap.kg.oe (accessed on 24 April 2019).
  11. European Commission. Directive of the European Parliament and of the Council amending Directive 2012/27/EU on Energy Efficiency; European Commission: Brussels, Belgium, 2016. [Google Scholar]
  12. Gomez Camacho, C.E.; Muto, G.; Ruggeri, B. Electrical energy network efficiencies evaluation as milestones for smart grids development: Italy’s case study. In IEEE PES Innovative Smart Grid Technologies Conference Europe Proceedings (ISGT-Europe); IEEE PES: Piscataway, NJ, USA, 2017; pp. 1–6. [Google Scholar]
  13. Thurber, C.; Dugas, L.R.; Ocobock, C.; Carlson, B.; Speakman, J.R.; Pontzer, H. Extreme events reveal an alimentary limit on sustained maximal human energy expenditure. Sci. Adv. 2019, 5, 1–8. [Google Scholar] [CrossRef] [PubMed]
  14. Sanfilippo, S.; Raimondi, A.; Ruggeri, B.; Fino, D. Dietary vs. transport: An analysis of environmental burdens pertaining to a typical workday. Int. J. Consum. Stud. 2012, 36, 133–140. [Google Scholar] [CrossRef]
  15. Harjanne, A.; Korhonen, J.M. Abandoning the concept of renewable energy. Energy Policy 2019, 127, 330–340. [Google Scholar] [CrossRef]
  16. McManus, M.C.; Taylor, C.M. The changing nature of life cycle assessment. Biomass Bioenergy 2015, 82, 13–26. [Google Scholar] [CrossRef] [Green Version]
  17. Jägemann, C.; Fürsch, M.; Hagspiel, S.; Nagl, S. Decarbonizing Europe’s power sector by 2050–Analyzing the economic implications of alternative decarbonization pathways. Energy Econ. 2013, 40, 622–636. [Google Scholar] [CrossRef]
  18. Hawkins, T.R.; Singh, B.; Majeau-Bettez, G.; Strømman, A.H. Comparative Environmental Life Cycle Assessment of Conventional and Electric Vehicles. J. Ind. Ecol. 2013, 17, 53–64. [Google Scholar] [CrossRef]
  19. Holmberg, H.; Siitonen, S.; Laukkanen, T.; Tuomaala, M.; Niskanen, T. Comparison of Indirect CO2-emissions of Different Renewable Transport Fuels. Energy Procedia 2015, 72, 19–26. [Google Scholar] [CrossRef] [Green Version]
  20. Quakernaat, J. Hydrogen in a global long-term perspective. Int. J. Hydrogen Energy 1995, 20, 485–492. [Google Scholar] [CrossRef]
  21. Dahbi, S.; Aziz, A.; Messaoudi, A.; Mazozi, I.; Kassmi, K.; Benazzi, N. Management of excess energy in a photovoltaic/grid system by production of clean hydrogen. Int. J. Hydrogen Energy 2018, 43, 5283–5299, no. 10. [Google Scholar] [CrossRef]
  22. Moriarty, P.; Honnery, D. Prospects for hydrogen as a transport fuel. Int. J. Hydrogen Energy 2019, 44, 16029–16037. [Google Scholar] [CrossRef]
  23. Dodds, P.E.; Staffell, I.; Hawkes, A.D.; Li, F.; Grünewald, P.; McDowall, W.; Ekins, P. Hydrogen and fuel cell technologies for heating: A review. Int. J. Hydrogen Energy 2015, 40, 2065–2083. [Google Scholar] [CrossRef] [Green Version]
  24. Eberle, U.; Felderhoff, M.; Schüth, F. Chemical and physical solutions for hydrogen storage. Angew. Chem. Int. Ed. 2009, 48, 6608–6630. [Google Scholar] [CrossRef] [PubMed]
  25. Parnell, J.; Blamey, N. Global hydrogen reservoirs in basement and basins. Geochem. Trans. 2017, 18, 1–8, no. 2. [Google Scholar] [CrossRef] [PubMed] [Green Version]
  26. Sharma, S.; Ghoshal, S.K. Hydrogen the future transportation fuel: From production to applications. Renew. Sustain. Energy Rev. 2015, 43, 1151–1158. [Google Scholar] [CrossRef]
  27. Di Addario, M.; Malavè, A.C.L.; Sanfilippo, S.; Fino, D.; Ruggeri, B. Evaluation of sustainable useful index (SUI) by fuzzy approach for energy producing processes. Chem. Eng. Res. Des. 2016, 107, 153–166. [Google Scholar] [CrossRef]
  28. Costanza, R. Embodied energy and economic valuation. Science 1980, 210, 1219–1224. [Google Scholar] [CrossRef] [PubMed]
  29. Hubbert, M.K. Nuclear energy and the fossil fuel. Am. Pet. Inst. Drill. Prod. Pract. 1956, 7–25. [Google Scholar]
  30. Delina, L.L. Accelerating Sustainable Energy Transition(s) in Developing Countries: The Challenges of Climate Change and Sustainable Development; Routledge: London, UK, 2017. [Google Scholar]
  31. Brebbia, C.A.; Sendra, J.J. Towards Energy Sustainability; WIT Press: Southampton, UK, 2018. [Google Scholar]
  32. Kist, D.L.; Cano, R.; Sapkaite, I.; Pérez-Elvira, S.I.; Monteggia, L.O. Macrophytes as a Digestion Substrate. Assessment of a Sonication Pretreatment. Waste Biomass Valoriz. 2018, 1–11. [Google Scholar] [CrossRef]
  33. Malave, A.C.L.; Fino, D.; Gómez, C.E.; Camacho, C.E.G.; Ruggeri, B. Experimental tests on commercial Sweet Product Residue (SPR) as a suitable feed for anaerobic bioenergy (H2+CH4) production. Waste Manag. 2018, 71, 626–635. [Google Scholar] [CrossRef] [PubMed]
  34. Ruggeri, B.; Tommasi, T.; Sanfilippo, S. BioH2 & BioCH4 Through Anaerobic Digestion: From Research to Full-scale Applications; Springer: London, UK, 2015. [Google Scholar]
  35. Hall, C.A.S.; Lambert, J.G.; Balogh, S.B. EROI of different fuels and the implications for society. Energy Policy 2014, 64, 141–152. [Google Scholar] [CrossRef] [Green Version]
  36. Hall, C.A.S.; Balogh, S.; Murphy, D.J.R. What is the minimum EROI that a sustainable society must have? Energies 2009, 2, 25–47. [Google Scholar] [CrossRef]
  37. Harvey, L.D.D. Energy Efficiency and the Demand for Energy Services; Earthscan: London, UK, 2010. [Google Scholar]
  38. Hall, C.A.S. Synthesis to Special Issue on New Studies in EROI (Energy Return on Investment). Sustainability 2011, 3, 2496–2499. [Google Scholar] [CrossRef] [Green Version]
  39. Fizaine, F.; Court, V. Energy expenditure, economic growth, and the minimum EROI of society. Energy Policy 2016, 95, 172–186. [Google Scholar] [CrossRef]
  40. Atlason, R.S. EROI and the Icelandic society. Energy Policy 2018, 120, 52–57. [Google Scholar] [CrossRef]
  41. Lambert, J.G.; Hall, C.A.S.; Balogh, S.; Gupta, A.; Arnold, M. Energy, EROI and quality of life. Energy Policy 2014, 64, 153–167. [Google Scholar] [CrossRef] [Green Version]
  42. Hall, C.A.S. Energy Return on Investment as Master Driver of Evolution. In Energy Return on Investment: A Unifying Principle for Biology, Economics and Sustainability; Springer: London, UK, 2016; pp. 59–72. [Google Scholar]
  43. Raugei, M.; Frischknecht, R.; Olson, C.; Sinha, P.; Heath, G. Methodological Guidelines on Net Energy Analysis of Photovoltaic Electricity; International Energy Agency–Photovoltaic Power Systems Programme: Shanghai, China, 2016. [Google Scholar]
  44. Frischknecht, R.; Wyss, F.; Büsser, S.; Knöpfel, T.; Lützkendorf, M.; Balouktsi, M. Cumulative energy demand in LCA: The energy harvested approach. Int. J. Life Cycle Assess. 2015, 20, 957–969. [Google Scholar] [CrossRef]
  45. Noris, F.; Musall, E.; Salom, J.; Berggren, B.; Jensen, S.Ø.; Lindberg, K.; Sartori, I. Implications of weighting factors on technology preference in net zero energy buildings. Energy Build. 2014, 82, 250–262. [Google Scholar] [CrossRef]
  46. Georgescu-Roegen, N. Dynamic models and economic growth. World Dev. 1975, 3, 765–783. [Google Scholar] [CrossRef]
  47. Suh, S.; Huppes, G. Methods for Life Cycle Inventory of a product. J. Clean. Prod. 2005, 13, 687–697. [Google Scholar] [CrossRef]
  48. Simonen, K. Life Cycle Assessment; Routledge: London, UK, 2014. [Google Scholar]
  49. Trabold, T.; Babbitt, C.W. Sustainable Food Waste-to-Energy Systems; Elsevier: London, UK, 2018. [Google Scholar]
  50. Wiesen, K.; Wirges, M. From cumulated energy demand to cumulated raw material demand: The material footprint as a sum parameter in life cycle assessment. Energy. Sustain. Soc. 2017, 7, 1–13. [Google Scholar] [CrossRef]
  51. Brunner, P.H.; Rechberger, H. Practical Handbook of Material Flow Analysis; CRC Press: Boca Raton, FL, USA, 2004. [Google Scholar]
  52. Ruggeri, B.; Sanfilippo, S.; Tommasi, T. Sustainability of (H2 + CH4) by Anaerobic Digestion via EROI Approach and LCA Evaluations. In Life Cycle Assessment of Renewable Energy Sources; Springer: London, UK, 2013; pp. 169–194. [Google Scholar]
  53. Huijbregts, M.A.J.; Hellweg, S.; Frischknecht, R.; Hendriks, H.W.M.; Hungerbühler, K.; Hendriks, A.J. Cumulative Energy Demand As Predictor for the Environmental Burden of Commodity Production. Environ. Sci. Technol. 2010, 44, 2189–2196. [Google Scholar] [CrossRef] [PubMed] [Green Version]
  54. Patel, M. Cumulative energy demand (CED) and cumulative CO2 emissions for products of the organic chemical industry. Energy 2003, 28, 721–740. [Google Scholar] [CrossRef]
  55. Ecoinvent data v2.0-Swiss Centre for Life Cycle Inventories. 2007. Available online: www.ecoinvent.org (accessed on 7 March 2019).
  56. Ecoinvent data v3.5-Swiss Centre for Life Cycle Inventories. 2018. Available online: www.ecoinvent.org (accessed on 7 March 2019).
  57. Algunaibet, I.M.; Pozo, C.; Galán-Martín, Á.; Guillén-Gosálbez, G. Quantifying the cost of leaving the Paris Agreement via the integration of life cycle assessment, energy systems modeling and monetization. Appl. Energy 2019, 242, 588–601. [Google Scholar] [CrossRef]
  58. Zhao, H.; Lin, B. Assessing the energy productivity of China’s textile industry under carbon emission constraints. J. Clean. Prod. 2019, 228, 197–207. [Google Scholar] [CrossRef]
  59. Puig, R.; Fullana-i-Palmer, P.; Baquero, G.; Riba, J.-R.; Bala, A. A Cumulative Energy Demand indicator (CED), life cycle based, for industrial waste management decision making. Waste Manag. 2013, 33, 2789–2797. [Google Scholar] [CrossRef]
  60. Silversand, F.A. Fuel Processor for Small-Scale Production of Hydrogen-Experimental Study. Available online: http://www.sgc.se/ckfinder/userfiles/files/SGC139.pdf (accessed on 6 February 2019).
  61. Jannasch, A.-K.; Silversand, F. Reliability Study of a Small-Scale Fuel Processor System STUR-10 kWH2. Available online: http://www.sgc.se/ckfinder/userfiles/files/SGC151.pdf (accessed on 6 February 2019).
  62. Dobó, Z.; Palotás, Á.B. Impact of the voltage fluctuation of the power supply on the efficiency of alkaline water electrolysis. Int. J. Hydrogen Energy 2016, 41, 11849–11856, no. 28. [Google Scholar] [CrossRef]
  63. Gomez Camacho, C.E.; Ruggeri, B.; Mangialardi, L.; Persico, M.; Luongo Malave, A.C. Continuous two-step anaerobic digestion (TSAD) of organic market waste: Rationalising process parameters. Int. J. Energy Environ. Eng. 2019, 11, 1–15. [Google Scholar] [CrossRef]
  64. Pachapur, V.L.; Kutty, P.; Pachapur, P.; Brar, S.K.; Le Bihan, Y.; Galvez-Cloutier, R.; Buelna, G. Seed Pretreatment for Increased Hydrogen Production Using Mixed-Culture Systems with Advantages over Pure-Culture Systems. Energies 2019, 12, 530. [Google Scholar] [CrossRef]
  65. Lombardelli, G.; Pirone, R.; Ruggeri, B. LCA Analysis of different MSW treatment approaches in the light of energy and sustainability perspectives. Chem. Eng. Trans. 2017, 57, 469–474. [Google Scholar]
  66. Fiore, S.; Ruffino, B.; Campo, G.; Roati, C.; Zanetti, M.C. Scale-up evaluation of the anaerobic digestion of food-processing industrial wastes. Renew. Energy 2016, 96 Pt A, 949–959. [Google Scholar] [CrossRef]
  67. Pierie, F.; van Someren, C.E.J.; Benders, R.M.J.; Bekkering, J.; van Gemert, W.J.T.; Moll, H.C. Environmental and energy system analysis of bio-methane production pathways: A comparison between feedstocks and process optimizations. Appl. Energy 2015, 160, 456–466. [Google Scholar] [CrossRef]
  68. Ferroni, F.; Hopkirk, R.J. Energy Return on Energy Invested (ERoEI) for photovoltaic solar systems in regions of moderate insolation. Energy Policy 2016, 94, 336–344. [Google Scholar] [CrossRef] [Green Version]
  69. Ferroni, F.; Hopkirk, R.J. Energy Return on Energy Invested (ERoEI) for photovoltaic solar systems in regions of moderate insolation: A comprehensive response. Energy Policy 2017, 102, 377–384. [Google Scholar] [CrossRef]
  70. Breyer, C.; Görig, M. “Energy Learning Curves of PV Systems. Wiley Environ. Prog. Sustain. Energy 2016, 35, no. 3. [Google Scholar]
  71. Leccisi, E.; Raugei, M.; Fthenakis, V. The energy and environmental performance of ground-mounted photovoltaic systems—A timely update. Energies 2016, 9, 622. [Google Scholar] [CrossRef]
Figure 1. Life stages of energy in our modern society: from primary energy to energy services.
Sustainability 11 04911 g001
Figure 2. Analogical model (AM) flow diagram used to simplify the key energy fluxes of each technology.
Sustainability 11 04911 g002
Figure 3. Simplified flow diagrams of the three technologies under analysis: (a) steam-methane reforming (SMR), (b) solar-powered water electrolysis (SPWE) and (c) two-stage anaerobic digestion (TSAD).
Sustainability 11 04911 g003
Figure 4. Monthly grid power demand to balance PV (for continuous operation of the electrolyzer), considering different operation time slots.
Sustainability 11 04911 g004
Figure 5. Percentage composition of the indirect energy for each technology configuration under analysis.
Sustainability 11 04911 g005
Figure 6. Resulting indicators for the ESA methodology applied to the distributed-H2 production, comparing three technological choices SMR, SPWE, and TSAD.
Sustainability 11 04911 g006
Table 1. Relevant components of the indirect energy (from [34]).
Eind,iDescription
EchemIndirect energy used to produce the chemicals of the process
EmatIndirect energy used to produce the materials of the process
Eind to prod edirIndirect energy used to produce and use the direct energy of the process
EmaintIndirect energy used for maintenance purposes
ElaborIndirect energy used to sustain the human labor
EconstrIndirect energy used for construction purposes
EdecommIndirect energy used for decommissioning purposes
EamortIndirect energy allocated for the amortization of materials and chemicals of the replacement facility
Table 2. Reactions of interest for each section of the Ultraformer fed with CH4.
Combustion Reaction (CATBUR)CH4 + 2O2 → CO2 + 2H2O
Reforming reaction (SREF)CH4 + H2O → CO + 3H2
Water-Gas Shift reaction (WGS)CO + H2O → CO2 + H2
Oxidation reactions (PROX)C + O2 → CO2
2CO + O2 → 2CO2
2H2 + O2 → 2H2O
CH4 + 2O2 → CO2 + 2H2O
Table 3. Ultraformer materials and chemicals.
CATBURSREFWGSPROX
Dimensions [cm]10 × 10 × 1023 × 8 × 813 × 7 × 107 × 4 × 10
8 × 5 × 10
Catalysts mesh [cm]7 × 77 × 307 × 77 × 7
7 × 7
Catalysts [% w/w Me]Pd5%/Al2O3Pt5%/Al2O3Pt5%/ZrO2Rh5%/Al2O3
Working Temperature [°C]900–920360–645390–440105–125
Chemicals Flow
CH4 [NL/min]6.00016.000--
Air [NL/min]107.000--7.500
Demineralized water [L/min]0.051-0.024-
Table 4. Curvature-weighted irradiated surface for each string of the PV array.
StringCurvature [m−1]Curvature Ratio [%]Irradiated Surface [m2]
I0.05710759.8623.75
II, III0.05858261.4147.50
IV, V0.04470546.8647.50
VI, VII0.09468899.2647.50
VIII0.095393100.0023.75
Table 5. Technical Specifications and dimensions of the main equipment of the SPWE system.
PV CellsInverterWater Dissociator
Dimensions
Size [mm]801 × 1491Size [mm]434 × 295 × 214Size [cm]115 × 95 × 140
Weight [kg]66Weight [kg]25Weight [kg]420
Units [-]160Units [-]8Units [-]1
Technical Specifications
Power-PMPP [W]102.2PAC, nominal [W] 1500H2 FlowMAX [Nm3/h]2.47
Voltage-UMPP [V]18.9PAC,max [W]1700O2 FlowMAX [Nm3/h]1.23
Current-IMPP [A]5.4Harm. Dist.Max [%]<4%PressureMAX [bar]1.80
VOpen Circuit [V]23.4Output Voltage-VAC [V]198–251Gas purity [%]≥99.5
IShort-Circuit [A]5.8FrequencyOutput-fAC [Hz]49.8–50.2ConsumptionMAX [kW]13.5
Max. efficiency-ηMAX≥93.5Supply VoltageAC [V]400
Power Consumption [W]<5Frequency [Hz]50–60
PowerStand-by [W]<0.1Distillated WaterMAX [L/h]2.20
Electrolyte Solution [L]25
Electrolyte [% w/w]18 NaOH
Table 6. Performance of the laboratory TSAD using OFMSW as feed.
H2-BioreactorCH4-Bioreactor
Working Temperature [°C]35.035.0
Mean Ambient temperature [°C]1313
Power input, pre-treatment [kW/m3]0.2-
Power input, mixing [kW/m3]0.10.20
Mixing application time [h/h]1/10.25/1.00
Hydrogen potential [NLH2/kgDM]79.04-
Methane potential [NLCH4/kgDM]-247.32
Hydraulic Retention Time [d]215
Mean gas composition [%]CH4: <1
CO2: 65 ± 5
H2: 35 ± 5
CH4: 72 ± 5
CO2: 28 ± 5
H2: <1
Table 7. Input parameters for the scale-up and design.
Served inhabitants [p]10,000
MSW [kg/(d·p)]1.50
Separate Collection [%]50.00
OFMSW [%]55.00
LHVOFMSW [MJ/kgDM]17.00
Table 8. Sizing of the TSAD system.
H2-BioreactorCH4-Bioreactor
Volume - V [m3]21.18158.81
Diameter – D [m]1.758.46
Height - h [m]8.752.82
D/h0.23
Cement-ε1 [m]0.300.30
Insulator-ε2 [m] 0.080.08
Table 9. Main materials input (MI) considered for the ESA.
ComponentAmount [kg]CED [MJ/kg]Material Description
Steam-Methane Reforming (SMR)
Block UnitTotal1.12 × 1015.25 × 101Stainless Steel 304 X5CrNi18 (304)
Catalyst Mesh WiresCATBUR9.12 × 10−29.50 × 10³Pd5%/Al2O3; Replacement each 8 months
SREF1.01 × 10−19.84 × 10³Pt5%/Al2O3; Replacement each 8 months
WGS4.78 × 10−19.89 × 10³Pt5%/ZrO2; Replacement each 8 months
PROX3.37 × 10−21.45 × 10⁴Rh5%/Al2O3; Replacement each 12 months
AuxiliariesTotal1.00 × 1015.25 × 101Pumps, blower and pipelines
Solar-Powered Water Electrolysis (SPWE)
PV1.06 × 1046.64 × 101Materials covering 190 m2; Polycrystalline silicon
Structure3.17 × 1031.10 × 10170% Wood Class II/30% Construction Steel Fe520 I
Inverter4.00 × 1021.36 × 102Inverter 1500W; (Replacement 10 years)
Electrolyzer1.68 × 1032.39 × 101Electrolyzer; (Replacement 5 years)
Two-Stage Anaerobic Digestion (TSAD)
Mixer2.32 × 1025.25 × 101Stainless Steel 304 X5CrNi18 (304)
S1Cement2.36 × 1043.58 × 100General purpose cement
Insulation2.85 × 1039.52 × 101Polystyrene foam slab
PVC3.82 × 1016.86 × 101PVC calendared sheet (Digester Dome)
Auxiliaries2.65 × 1025.25 × 101Integrated value pumps and pipelines
S2Cement9.06 × 1043.58 × 100General purpose cement
Insulation1.09 × 1049.52 × 101Polystyrene foam slab
PVC1.46 × 1026.86 × 101PVC calendered sheet (Digester Dome)
Auxiliaries1.02 × 1035.25 × 101Integrated value pumps and pipelines
Table 10. Main energy flows considered for the ESA evaluation.
Primary Energy SourceFossilSolar RadiationBiomass
(SMR)(PV)(PV + WE)(S1)(S2)
Primary Energy [MJ]6.01 × 1062.50 × 1072.50 × 1071.79 × 1081.79 × 108
Avoided Energy [MJ]---1.26 × 1071.26 × 107
Already Spent Energy [MJ]5.56 × 10⁵--1.97 × 1071.97 × 107
Available Energy [MJ]5.46 × 1062.50 × 1072.50 × 1071.72 × 1081.72 × 108
Produced Energy [MJ]6.15 × 1062.27 × 1066.15 × 1068.96 × 1061.02 × 108
Direct EnergyHeat [MJ]2.25 × 10⁶--1.27 × 1071.69 × 107
Power [MJ]3.57 × 1001.26 × 1046.02 × 1062.58 × 1069.26 × 106
Indirect EnergyMaterials [MJ]8.19 × 1037.91 × 1058.31 × 1053.85 × 1051.81 × 106
Chemicals [MJ]5.66 × 10⁵-8.49 × 1033.88 × 1053.88 × 105
Maintenance [MJ]1.64 × 1032.38 × 1042.78 × 1043.85 × 1041.81 × 105
Eind to produce Edir [MJ]4.23 × 10⁵-1.84 × 1077.89 × 1062.83 × 107
Construction [MJ]1.23 × 1037.93 × 1048.33 × 1045.77 × 1042.72 × 105
Decomm. [MJ]1.23 × 1031.19 × 1051.25 × 1055.77 × 1042.72 × 105
Labour [MJ]---5.11 × 1055.11 × 105
Amortisation [MJ]5.74 × 1057.91 × 1058.39 × 1057.73 × 1052.20 × 106
Enet [MJ]3.90 × 1062.26 × 1061.28 × 105−6.33 × 1067.60 × 107
Eind [MJ]1.58 × 1061.80 × 1062.03 × 1071.01 × 1073.40 × 107
Euseful [MJ]2.32 × 1064.55 × 105−2.01 × 10⁷−1.64 × 1074.20 × 107
H2 production [Nm3]5.72 × 10⁵-5.72 × 1058.33 × 105-

