1. Introduction
Currently, global warming is one of the most serious environmental issues across the globe, and carbon dioxide (CO
2) emissions are the major contributor to global warming. China has become the largest carbon emitter since 2006 and the largest energy consumer since 2009. In 2015, CO
2 emissions in China reached 9.23 billion tons, making up 27.6% of the world’s total emissions [
1].
In recent years, China has committed to mitigating its CO
2 emissions. During the Copenhagen Climate Change Conference in 2009, the Chinese government proposed to reduce China’s CO
2 emission intensity by 40–45% in 2020 compared with the 2005 level [
2]. During the Paris Climate Conference in 2015, China further made a commitment of reducing its CO
2 emission intensity by 60–65% by 2030 compared to the 2005 level. More specifically, the Chinese government aims to decrease its total CO
2 emissions after 2030 [
3].
The BTH (Beijing–Tianjin–Hebei) region’s industrial development occurred earlier and this region is also the most important region in China’s steel industry until now. As a result of the high proportion of heavy industry, energy consumption of this region was extraordinarily high, which was 0.32 billion tons of coal equivalent (tce) in 2006 and 0.45 billion tce in 2014, corresponding to an increase in energy consumption of nearly 50% between 2006 and 2014. Over the same period, CO
2 emissions of the BTH region increased by approximately 37.0%. To control environmental problems and promote rational energy use, the national 12th (2011–2015) and 13th (2016–2020) Five Year Plans identified the collaborative development of the BTH region as a national strategy [
4]. In this study, we investigate the trends in CO
2 emissions in the BTH region from 2006 to 2016 and attempt to determine the different factors contributing to CO
2 emissions within subregions in the BTH region.
Factor decomposition analysis is frequently used to explain the influencing factors of changes in CO
2 emissions. Kaya [
5] reported that the total CO
2 emissions of one region can be expressed as a product of four factors: population, GDP per capita, energy intensity, and carbon intensity. Index decomposition analysis has been the primary method used to study changes in carbon emissions since the 1980s [
6,
7]. Several types of index decomposition analysis have been developed, including the Laspeyres Divisia index method, arithmetic mean Divisia index method, and LMDI method. Among them, the multiplicative and additive forms of the LMDI method proposed by Ang and colleagues [
7,
8,
9] are the most commonly used due to their outstanding theoretical foundation, adaptability, ease of use, and easy interpretation of results [
10,
11]. At present, the LMDI method is the most popular approach for determining the driving forces of changes in CO
2 emissions [
12,
13,
14,
15].
In China, CO2 emissions have become a popular topic of research, and studies on the driving factors of CO2 emissions in China have increased sharply in recent years. These studies can be divided into three types based on their area of focus: national-level, regional-level, and sector-level studies.
Many studies have investigated the influencing factors of CO
2 emissions at the national level, with some focusing specifically on the period since China’s opening up [
16,
17]. These studies provide a panoramic view of China’s CO
2 emissions during important periods in China’s development [
18]. Most of these studies evaluated activity, structure, intensity, and scale effects. Recently, investment-related factors such as investment scale, investment share, and investment efficiency [
19], along with research and development (R&D) factors such as R&D efficiency and R&D intensity [
11], have been studied to explain changes in China’s carbon emissions. The findings suggest that R&D intensity has an apparent alleviating impact on carbon emissions in China, whereas investment intensity and R&D efficiency exert overall promoting effects with some volatility.
CO
2 emissions in China show large differences among regions. Thus, it is critical to conduct regional-level studies of carbon emissions. Many studies have investigated China’s CO
2 emissions at the regional level in areas including Beijing [
20,
21], Tianjin [
22], Shanghai [
11], Xinjiang [
23], and Tibet [
24]. The BTH region is of particular importance in understanding China’s CO
2 emissions. Zhou et al. [
25] found that the main factors affecting carbon emissions in the BTH region are economic factors followed by population size. Wang and Yang [
26] found that industrial energy-related carbon emissions and industrial development in the BTH region have exhibited coupling and decoupling characteristics in different time periods. Han et al. [
4] proposed a method to allocate carbon emission quotas among regions.
At the sector level, the agriculture sector [
27], iron and steel industry [
28], transport sector [
29], cement sector [
30], mining sector [
31], and nonferrous metal industry [
32] have been investigated in terms of the influential factors of carbon emissions in China. These studies showed that the driving forces of carbon emissions have changed in different industries in different time periods.
Due to environmental policies and regulations in China, the trends in energy-related CO2 emissions within the BTH region in recent decades are unclear, and the driving forces of changes in CO2 emissions in different subregions within BTH are unknown. As a result, the implications of policies implemented under the strategy of integrated development in the BTH region are not clear. To address these issues, this study attempts to answer three questions: (1) What are the trends in CO2 emissions within the BTH region? (2) Which factors play the most important roles in recent trends in CO2 emissions within the BTH region? (3) Based on the answers to the two previous questions, what measures could be taken to control CO2 emissions in the BTH region? This paper takes socioeconomic factors such as investment and R&D factors into analysis of the energy-related industrial CO2 emissions (EICE) change across the BTH region over the recent decade. It shows how these socioeconomic factors differently contributed to the EICE change of subregions in the great BTH region and how these factors contributed to the EICE change over time. This paper deepens the understanding of the EICE change in the BTH region and assists in proposing feasible and effective emission reduction policies.
The remainder of this paper is organized as follows.
Section 2 presents the introduction of the study area.
Section 3 presents the method used to calculate CO
2 emissions, the decomposition model of CO
2 emissions based on the LMDI method, and the data sources.
Section 4 presents the decomposition results of EICE in the BTH region. The conclusions and policy implications are provided in
Section 5.
4. Results and Discussions
4.1. Structure of Industrial Energy Consumption within the BTH Region
Total industrial energy consumption and its structure is crucial for EICE owing to the fact that different types of energy have very different CO2 emission coefficients, which is obvious given that the CO2 emission coefficient of coal and coke is much higher than that of oil and gas. Therefore, we first analyzed the trend of industrial energy consumption and its structure among subregions of the BTH region during 2006–2016.
The detailed information is illustrated in
Figure 2. From this figure, first we can see that the trend of industrial energy consumption in Hebei and Tianjin is very similar, which both increased sharply before 2012 and then decreased slightly; however, industrial energy consumption of Beijing peaked in 2010 for 33.9 Mtce at a relatively slight speed. Then we investigated deeper into this figure; the divergent changing trends of industrial energy consumption structure is a bit shocking. Industrial energy consumption structure of Beijing had a tremendous change from 2006 to 2016; coal and coke consumption accounted for 35.5% in 2006 and only 6.2% of total industrial energy consumption in 2016, and this strongly implicates that great improvement in cleaning energy consumption in Beijing has been achieved. In contrast, Tianjin and Hebei showed much less progress in changing energy consumption structure, which coke and coal consumption accounted for 45.9% in 2006 and 38.9% in 2016 for Tianjin. It was much worse for Hebei, which coke and coal consumption accounted for 75.2% in 2006 and still 67.3% in 2016.
4.2. Economic Conditions in the BTH Region
As shown in
Figure 3, economic development accelerated in the BTH region from 2006 to 2016. The annual growth rates in GDP per capita were 8.29%, 10.57%, and 9.82% in Beijing, Tianjin, and Hebei, respectively. Thus, Tianjin developed the fastest, while Beijing had the lowest rate of development. Moreover, it showed great divergence in development level within the BTH region; Beijing and Tianjin had the same development level, and their development level was much higher than that of Hebei. Hebei had the largest total population but the lowest population growth rate (8.29% during the studied period). In contrast, the populations of Beijing and Tianjin increased by 35.73% and 45.30%, respectively, from 2006 to 2016 because these cities attracted laborers. The changes in GDP per capita and population in the subregions of BTH reflect the significant differences in the socioeconomic systems within the BTH region, which are expected to also affect EICE.
From
Figure 4, the growth of fixed-asset investment from 2006 to 2016 was much higher in Tianjin and Hebei (21.30% and 19.07%, respectively) compared to in Beijing (8.87%). Considering the growth in GDP, this may suggest that Beijing and Tianjin had similar levels of development, while the growth mode of Tianjin was more similar to that of Hebei. Furthermore, R&D investment was much higher in Beijing than in Tianjin or Hebei, whereas R&D investment increased fastest during the studied period in Tianjin (average annual increase of 25.60% compared to 13.11% in Beijing and 17.39% in Hebei).
Energy intensity is an indirect indicator of energy efficiency [
42]. As shown in
Figure 5, energy intensity in all three subregions of BTH decreased sharply from 2006 to 2016. Energy intensity in Beijing decreased by 65.7%, while energy intensity in Tianjin and Hebei declined by nearly 50%. In addition, the energy intensity in Hebei was much higher than those in Beijing and Tianjin; in 2006, the energy intensity in Hebei was 0.82 tce/10
4 Yuan, compared to 0.39 tce/10
4 Yuan in Tianjin and 0.20 tce/10
4 Yuan in Beijing. This indicates that the energy efficiency increased steadily in the BTH region, although there were significant differences in energy efficiency among the BTH subregions.
4.3. Decomposition Results of EICE in the BTH Region
Figure 6 shows that EICE was much larger in Hebei than in Beijing and Tianjin from 2006 to 2016. In 2006, EICE was 362.2 Mt in Hebei compared to 73.8 Mt in Beijing and 67.0 Mt in 2006. The trend was similar in 2016, with EICE values of 512.2, 77.2, and 99.5 Mt in Hebei, Beijing, and Tianjin, respectively. From 2006 to 2016, EICE in Beijing increased only 4.6%, while much higher increases in EICE were observed in Tianjin (48.6%) and Hebei (41.4%). Thus, the changes in EICE were significantly different among BTH subregions. Looking more closely at the changes in EICE from 2006 to 2016 reveals some interesting phenomena. First, EICE first increased and then decreased from 2006 to 2016 in Beijing, Tianjin, and Hebei. Second, the EICE in Beijing, Tianjin, and Hebei peaked in different years: 84.2 Mt in 2010 in Beijing, 103.6 Mt in 2014 in Tianjin, and 552.7 Mt in 2011 in Hebei.
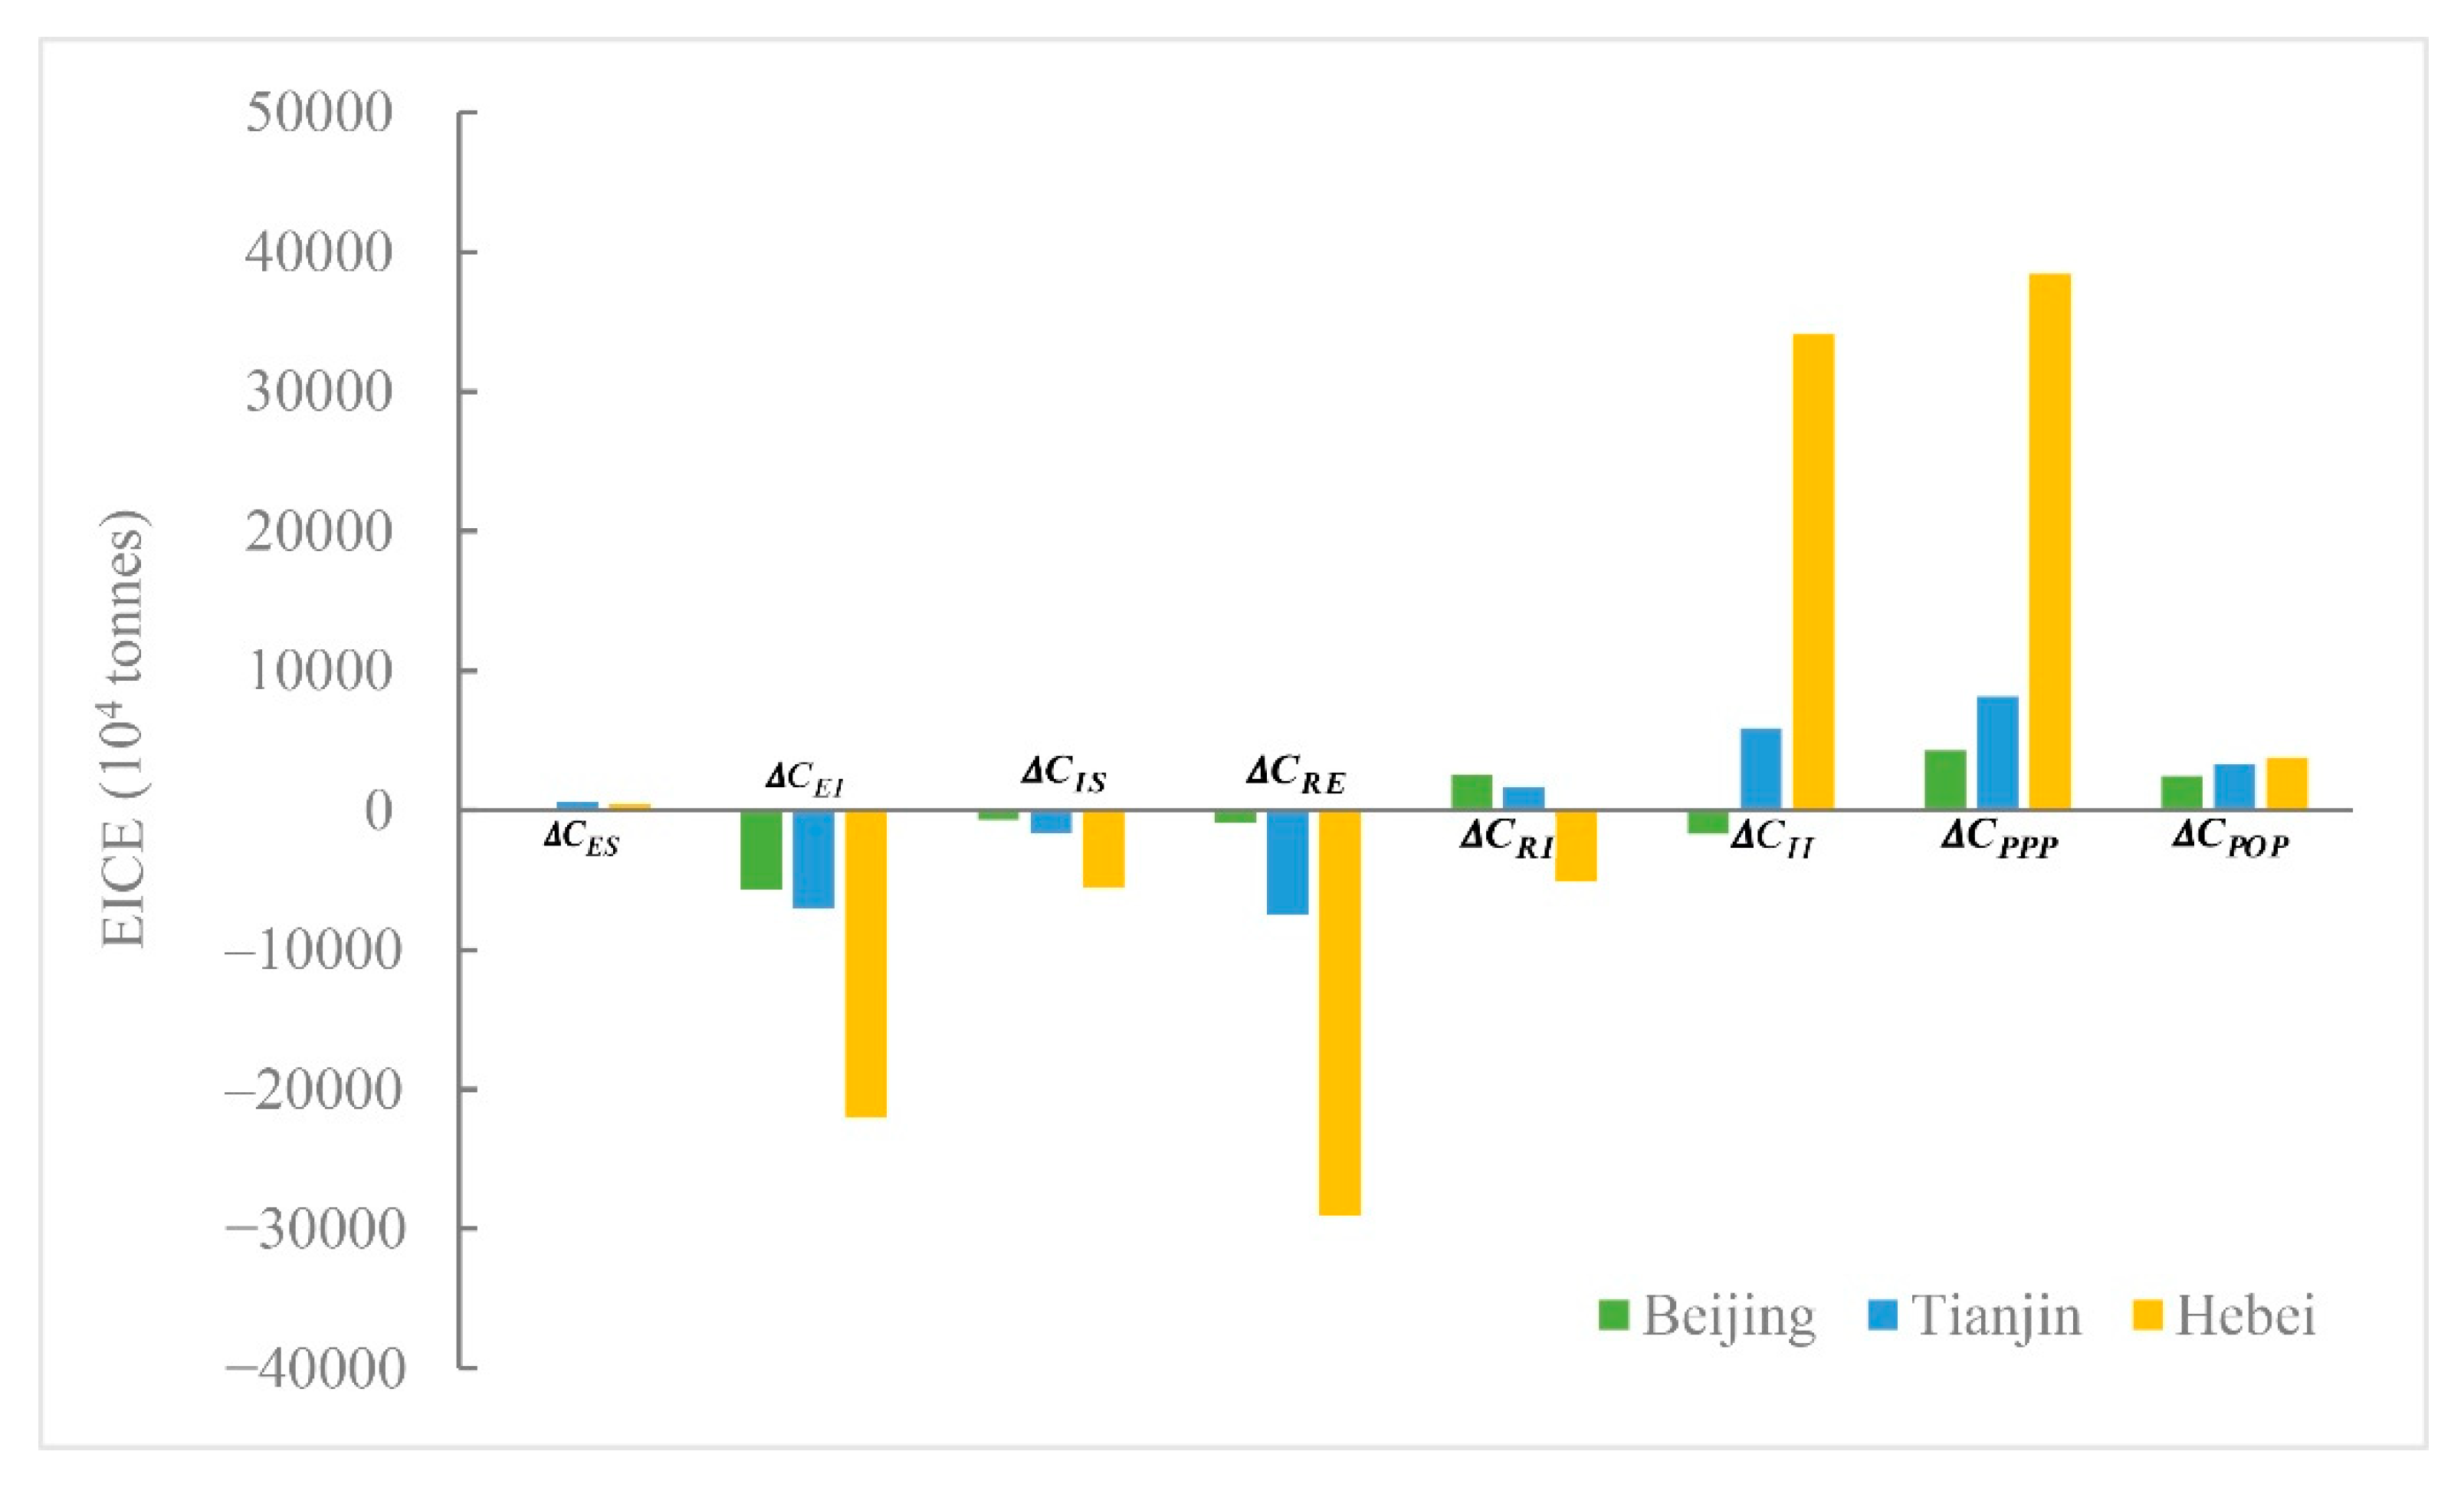
Figure 7 shows the effects of the different factors contributing to EICE in the BTH region and here, the CO
2 coefficient factor remains unchanged, so among the other eight factors, six had the same effect (either positive or negative) on EICE in all three subregions of BTH; energy structure, GDP per capita, and population positively affected EICE in all three subregions from 2006 to 2016, whereas energy intensity, industrial structure, and R&D efficiency negatively affected EICE in these areas. On the other hand, the effects of R&D intensity and investment intensity on EICE differed within the BTH region. R&D intensity contributed to increases in EICE in Beijing and Tianjin, whereas its effect on EICE was negative in Hebei. The effect of investment intensity was to decrease the EICE of Beijing, whereas it had the opposite effect in Tianjin and Hebei.
Although some factors had the same overall effect on EICE across the BTH region, the magnitudes of the effects differed among subregions. As shown in
Table 2, the positive effect of energy structure on EICE was relatively weak in all three subregions. The negative effect of energy intensity on EICE was relatively strong, particularly in Tianjin and Beijing, where energy intensity accounted for average annual decreases in EICE of 7.49% and 5.89%, respectively, compared to only 3.51% in Hebei. Similarly, the negative effects of R&D efficiency on EICE differed greatly among subregions, contributing to average annual decreases in EICE of 7.81% in Tianjin, 4.43% in Hebei, and 1.10% in Beijing.
4.4. Decomposition Analysis Results for Different Time Periods
In view of the rapid economic development, technical progress, and energy and environmental regulation in the BTH region in the past decade, we further examined EICE in this region by dividing the 10-year period into three intervals with the hypothesis that fundamental structural changes in factors contributing to EICE occurred over time, driving changes in EICE. We selected years in which important environmental policies were enacted to separate the time intervals. In 2009, the Chinese government promised to reduce carbon emission intensity by 40–45% in 2020 compared to 2005 levels. In 2012, China released the 12th Five-Year Plan for Energy Conservation and Emission Reduction, an important plan for reducing carbon emissions. Thus, we selected the following three intervals: 2006–2009, 2009–2012, and 2012–2016. The complete time-series decomposition results for the extended LMDI model are presented in
Table A2,
Table A3, and
Table A4.
Figure 8,
Figure 9 and
Figure 10 indicate that the trends in EICE were the same across the BTH region during the three time periods. However, the decomposition results show that the factors contributing to EICE differed among time periods within the BTH region. From 2006 to 2009, the increase in EICE was much lower in Beijing (8.0%) than in Tianjin (25.8%) and Hebei (22.8%). Energy structure contributed relatively little to these changes in EICE, while energy intensity had a significant negative effect on EICE, leading to decreases of 18.4%, 24.8%, and 10.2% in Beijing, Tianjin, and Hebei, respectively. This indicates that technological progress occurred much slower in Hebei than in Tianjin and Beijing during this period. Industrial structure also had a negative effect on EICE, indicating the optimization of industrial structure within the BTH region. R&D efficiency and R&D intensity were also leading factors that negatively contributed to EICE in the BTH region, especially in Tianjin and Hebei, where R&D efficiency contributed to 48.5% and 17.7% decreases in EICE, respectively, and R&D intensity decreased EICE by 6.1% and 27.9%, respectively. However, in Beijing, R&D efficiency only contributed to a 3.62% decrease in EICE, while the effect of R&D intensity on EICE was positive (+7.8%). Investment intensity also showed different effects on EICE within the subregions of BTH. Investment intensity was a leading factor in the increases in EICE in Tianjin and Hebei, contributing to 54.6% and 45.6% increases, respectively. In contrast, the effect of investment intensity on EICE was negative (−4.2%) in Beijing during this time period. Population is another important factor contributing to increases in EICE; this factor accounted for increases of 16.1% and 15.1% in Beijing and Tianjin, respectively. However, population had a relatively minor role in EICE in Hebei, where it contributed to a 2.2% increase in EICE.
From 2009 to 2012, EICE again increased across the BTH region (increases of 3.0%, 20.6%, and 20.1% in Beijing, Tianjin, and Hebei, respectively). Compared to the previous time period, the rate of increase in EICE was slower in all three subregions. The decomposition result shows that energy intensity was an important factor in decreasing EICE; it accounted for decreases in EICE of 23.4%, 25.7%, and 14.9% in Beijing, Tianjin, and Hebei, respectively. The effect of energy intensity was greater in this period than in the previous time period. R&D efficiency remained a prominent factor in decreasing EICE in Tianjin and Hebei (contributing decreases of 40.0% and 19.7%, respectively). Similar to in the previous period, R&D efficiency contributed to a decrease in EICE of only 7.5% in Beijing. The effect of R&D intensity in this period was opposite that in the previous period; R&D intensity contributed to EICE increases of 18.23%, 36.8%, and 15.4% in Beijing, Tianjin, and Hebei, respectively. Similar to in the previous period, GDP per capita and population had important positive effects on EICE in this time period.
In contrast to the above two time periods, the trend in EICE was completely different in the BTH region from 2012 to 2016, when EICE began to decrease. During this period, EICE decreased by 5.9%, 2.0%, and 4.2% in Beijing, Tianjin, and Hebei, respectively. While these decreases are small, they can be seen as significant progress compared to the previous time periods. The decomposition results show how different factors contributed to the decreases in EICE within the BTH region. First, energy intensity played a leading role in decreasing EICE and contributed to greater decreases in EICE compared to previous periods. From 2012 to 2016, energy intensity generated decreases in EICE of 30.3%, 32.1%, and 21.9% in Beijing, Tianjin, and Hebei, respectively. The negative effects of industrial structure on EICE in Tianjin (−13.1%) and Hebei (−9.6%) were stronger in this time period than in the previous two periods. The effect of R&D efficiency on EICE differed among subregions in this time period. In Hebei province, R&D efficiency remained an important factor in decreasing EICE, producing a decrease of 25.8%. However, this factor was much less important in Beijing and Hebei, where it produced decreases in EICE of only 0.14% and 8.87%, respectively. Investment intensity remained a leading factor increasing EICE in Tianjin and Hebei, where it contributed increases of 19.1% and 29.3%, respectively, similar to in the previous periods. In contrast, investment intensity had a negative effect on EICE in Beijing. GDP per capita was an important factor that increased EICE in this time period; GDP per capita led to increases in EICE of 21.5%, 29.2%, and 24.4% in Beijing, Tianjin, and Hebei, respectively. Compared to in previous periods, the effect of population was less important in this time period. Population increased EICE in Beijing by only 4.6% in this time period, while population still remained an important factor increasing EICE in Tianjin.
4.5. Discussions
The BTH region is geographically adjacent but economically divergent. This region is facing serious environmental issues, which makes it very important in analyzing how the socioeconomic factors affect EICE divergently. In this paper, we find that traditional factors, such as energy intensity effect, contributed greatly to the decrease of EICE change across this region, which is in accordance with previous studies [
43,
44]. In terms of R&D factors, there was a paper [
20] using the STIRPAT (stochastic impacts by regression on population, affluence and technology) model to identify that the increase of R&D output was an efficient way to reduce CO
2 emissions. This finding is similar to ours, that the R&D efficiency effect contributed to the decrease of EICE in Beijing. However, our paper further shows that R&D intensity effect contributed differently to the change of EICE. Since the divergent regional economic development conditions will continue playing important roles in future decades, it will be meaningful in figuring out how these factors contribute differently to other environment issues across the region in future studies. Such research will make a difference in future policy making of jointly dealing with regional environmental issues.
5. Conclusions and Policy Implications
5.1. Conclusions
In this study, we calculated energy-related industrial CO2 emissions within the BTH region from 2006 to 2016. We then applied the extended LMDI method to identify the different driving factors of changes in EICE within the BTH region during different time periods. The changes in EICE were decomposed into the effects of nine factors: energy coefficient, energy structure, energy intensity, industrial structure, R&D efficiency, R&D intensity, investment intensity, GDP per capita, and population. The main conclusions can be summarized as follows:
(1) From 2006 to 2016, EICE increased in all BTH subregions, although the magnitude of the increases was greatly different. EICE increased by only 4.6% during this period in Beijing, compared to increases of 48.6% in Tianjin and 14.4% in Hebei. We also analyzed the changes in EICE in three time intervals; EICE increased in all BTH subregions from 2006 to 2009 and from 2009 to 2012, while it decreased from 2012 to 2016.
(2) Energy intensity, industrial structure, and R&D efficiency had negative effects on EICE over the study period within all BTH subregions. In contrast, GDP per capita and population contributed to increases in EICE during the study period in all subregions. Deepening into the three periods, we find that the energy intensity effect increasingly contributed to the decrease of EICE of three subregions in the BTH over the periods. The contribution of R&D efficiency effect to the decrease of EICE declined over the periods in Beijing and Tianjin, but increased gradually in Hebei.
(3) The effects of R&D intensity and investment intensity on EICE differed among subregions of the BTH region. R&D intensity drove EICE growth in Beijing and Tianjin from 2006 to 2016, whereas it decreased EICE in Hebei, while during the three periods, R&D intensity effect showed similar effects of EICE in Tianjin and Hebei in each period, it contributed increase to EICE in Beijing in each period. Investment intensity decreased EICE in Beijing but had significant positive effects on EICE in Tianjin and Hebei from 2006 to 2016 and also for each period over the study period.
5.2. Policy Implications
Based on the above research results, we present the following policy implications.
First, energy intensity is still the most important driving factor of decreases in EICE. Energy intensity is much higher in Hebei than in Beijing and Tianjin, indicating that Hebei has a significant opportunity to reduce its energy intensity. Thus, it is particularly urgent for policy-makers to promote and improve energy efficiency in Hebei Province.
Second, industrial structure is another important factor in reducing EICE. However, it is very difficult to optimize industrial structure. Therefore, the government should make more efforts to optimize industrial structure by promoting the development of technology-intensive and knowledge-intensive manufacturing along with high-tech industries, especially in Tianjin and Hebei.
Third, R&D investment plays a crucial role in mitigating EICE within the BTH region. R&D investment has both direct and indirect effects on EICE. For example, R&D investment in low-carbon technology directly improves energy efficiency. R&D investment also improves the entire production process, which indirectly mitigates CO2 emissions. Thus, the government should provide incentives for R&D investment in industrial enterprises, particularly to incentivize R&D investment in low-carbon technologies.
Fourth, since the BTH is a metropolitan area, there are many differences in the socioeconomic systems within the BTH region. These differences must be carefully considered when selecting low-carbon development strategies in this region. To develop a strategy for development in the BTH region, policy-makers should improve industrial division and cooperation as well as promote low-carbon technology.


