Article

Assessment of the Irrigation Water Requirement and Water Supply Risk in the Tarim River Basin, Northwest China

1
State Key Laboratory of Desert and Oasis Ecology, Xinjiang Institute of Ecology and Geography, Chinese Academy of Sciences, Urumqi 830011, China
2
University of Chinese Academy of Sciences, Beijing 100049, China
*
Author to whom correspondence should be addressed.
Sustainability 2019, 11(18), 4941; https://doi.org/10.3390/su11184941
Submission received: 6 August 2019 / Revised: 4 September 2019 / Accepted: 5 September 2019 / Published: 10 September 2019
(This article belongs to the Section Environmental Sustainability and Applications)

Abstract

:
Studying the relationship between agricultural irrigation water requirements (IWR) and water supply is significant for optimizing the sustainable management of water resources in Tarim River Basin (TRB). However, the related studies have not quantified the total IWR and the imbalance of irrigation water supply and requirements in the TRB. The study analyzed the spatial-temporal variations of IWR by a modified Penman–Monteith (PM) method during 1990–2015. Five major crops—rice, wheat, maize, cotton, and fruit trees—are chosen for calculating the IWR. It was found that the IWR increased significantly, from 193.14 × 10⁸ m3 in 1990 to 471.89 × 10⁸ m3 in 2015, for a total increase of 278.74 × 10⁸ m3. For the first period (1990–2002), the total IWR remained stable at 200 × 108 m3 but started to increase from 2003 onwards. Significantly more irrigation water was consumed in the oasis regions of the Tienshan Mountains (southern slope) and the Yarkand River (plains). Furthermore, there was an intensified conflict between IWR and water supply in the major sub-basins. The ratios of IWR to river discharge (IWR/Q) for the Weigan-Kuqa River Basin (WKRB), Aksu River Basin (ARB), Kaxgar River Basin (KGRB), and Yarkand River Basin (YRB) were 0.93, 0.68, 1.05, and 0.79, respectively. The IWR/Q experienced serious annual imbalances, as high flows occurred in July and August, whereas critical high IWR occurred in May and June. Seasonal water shortages further aggravate the water stress in the arid region.

1. Introduction

Water is important in the extreme arid region, especially for agriculture [1]. The extremely arid Tarim River Basin (TRB) has experienced significant warming over the past few decades [2]. Global warming has greatly affected the distribution and circulation of water resources in the region and exacerbated already serious water crisis [3]. Water crisis has become a crucial obstacle to the sustainable development [4]. The TRB is one of the world’s major water-scarce regions, with few water resources and fragile ecosystems. The main soils are anthrosols, saline–alkali soil, desert soil [5,6], and the water use efficiency is 0.38–0.52 [7]. The agriculture largely depends on the application of fertilizers such as nitrogen, phosphate, and potash, which improve the crop production. However, because the TRB is also an important cotton and fruit-producing region, water resources has become a constraining factor in local agricultural production. According to the Statistical Yearbook of Xinjiang Uygur Autonomous Region, by the year of 2015, the sown area of the basin was 369 × 104 ha, with the crop yields of grain crops and economic crops that were 728 × 104 and 2047 × 104 tons, respectively. In recent decades, with the expansion of crop cultivation and a subsequent rapid increase in the use of irrigation water requirements (IWR), the region’s scant water supplies have been seriously squeezed and a large amount of groundwater has been extracted [8]. The over-exploitation of groundwater has led to a decline in terrestrial water storage (TWS) and the death of natural vegetation. Contradiction between agricultural water demand and water supply is becoming more and more extreme in the region [9,10]. Currently, the irrigation of farmland accounts for 95% of the total water consumption in the TRB [11], far above 40% suggested by the global warning line [12]. Therefore, it is crucial to optimize water resources management in the region in order to realize sustainable development.
Several different methods can be used to calculate crop water requirements (CWR), including the crop model method based on surface observation, the remote sensing method, and the Penman–Monteith (PM) method, the latter is recommended by the Food and Agriculture Organization (FAO) [13]. Ground observations can help to calculate exactly how much water is needed at farmland scales, but this method is difficult to apply in the study region for estimating water requirements. The remote sensing approach aims to estimate CWR by combining ground meteorological observations and growing stages of crop [14,15]. The Penman–Monteith method, on the other hand, has been widely and successfully used to estimate CWR. For instance, Smith [16] calculated and predicted CWR using this method, and Liu et al. [17] also used it to calculate CWR of major crops in North China. Furthermore, Xiao et al. [18] applied the PM method to analyze the spatiotemporal variations of CWR of maize in China, while Er-Raki et al. [19] employed it in combination with the remote sensing data to study CWR of wheat in Morocco. As well, Ye et al. [20] also adopted the PM method to discuss the IWR of rice in southern China and analyzed the effect of climate change on IWR. Li et al. [21] used it to build a CWR model to analyze irrigation supply and requirements in the Lhasa River Valley, Tibet. Recently, many studies have estimated the crop water and IWR in the TRB from different perspectives. Shen et al. [1] concluded that the IWR in this region have been on the rise in the past two decades, mainly due to the rapid increase of cotton planting areas. Fang et al. [11] found that agricultural water requirements in those regions increased by 9.47 mm/year from 1989 to 2015, and that the variation of planting structures was the most important factor in this increase. Guo et al. [22] noted that IWR has shown a significant growth trend in the Kaidu-Kongque River Basin from 1985 to 2009.
Although the above studies analyzed agricultural water requirements in the TRB and sub-basins, they have not quantified the total IWR on a spatial scale, nor have they analyzed existing issues regarding the imbalance of irrigation water supply and requirements in the TRB and typical headwaters of TRB. To address the current research gap, this study built a CWR model based on the Penman–Monteith equation [23] by combining the crop planting area and ground observation data and also analyzed the irrigated areas and spatial-temporal changes of IWR in the TRB and the typical sub-basins. The current study aims (1) to gain a comprehensive understanding of changes in crop planting structure as well as the spatio-temporal change of IWR in the region; (2) to provide an agricultural irrigation water quota and a water requirement structure for the various crops in the oasis; and (3) to emphatically analyze the IWR and supply risk in the irrigated areas of the typical headwaters of TRB. We are convinced our findings offer a theoretical basis to improve water resources management in the TRB.

2. Materials and Methods

2.1. Study Area

The TRB is located in the inland basin of the northwest arid region of China, with a basin area of 1.02 × 10⁶ km2. It is bordered by the Tienshan Mountains to the north and the Kunlun Mountains to the south (Figure 1). The Tarim River is a dissipative inland river whose runoff is mainly supplied by meltwater from glaciers and snow. In the river’s runoff composition, glacial meltwater accounts for 48.2%, a mixed recharge of rain and snow accounts for 27.4%, and the basal stream accounts for 24.4%. The TRB, being located in the middle latitude Eurasian continental hinterland, has a typical temperate arid continental climate. Over the centuries, the region has developed a typical oasis agricultural production area, with agricultural cultivated land area constantly increasing, particularly over the past few decades. The cultivated land, which is distributed throughout the oasis on the edge of the desert, is irrigated mainly by surface water and groundwater. In the oasis where most of the agricultural activities take place, annual rainfall is typically less than 50 mm, while the annual potential evaporation could be as high as 3200 mm in this arid region [24,25]. The issues of land desertification and soil salinization are growing increasingly direr due mainly to human activities. According to the World Resources Institute’s global water risk map (http://www.wri.org/our-work/project/aqueduct), more than a third of the region faces extremely high water stress.

2.2. Datasets

2.2.1. Meteorological Data

Daily meteorological data were provided by the China Meteorological Administration at 26 meteorological stations from 1990 to 2015. In consideration of data availability and reliability, the main meteorological variables include the maximum temperature (Tmax), minimum temperature (Tmin), and mean temperature (T), sunshine duration (n), wind speed (uz), maximum relative humidity (RHmax), and minimum relative humidity (RHmin).

2.2.2. Runoff and Groundwater Data

Monthly runoff data at nine hydrological stations (Kelek, Kalikuli, Shaman, Heizi, Langan, Kaqun, Yuzimenlek, Xiehela, and Shaliguilan) in the TRB come from the Xinjiang Hydrologic Year Book, the Xinjiang Uygur Autonomous Region Water Resources Bulletin, and the Xinjiang Tarim River Basin Management Bureau. The river runoff data were used to analyze the water supply of each river basin. The groundwater table data can be obtained from the Kashgar Hydrology Bureau and China Geological Environment Information, China Institute of Geo-Environment Monitoring (CIGEM).

2.2.3. Socio-Economic Statistical Data

These data were derived from the Statistical Yearbook of Xinjiang Uygur Autonomous Region and Xinjiang Production and Construction Corps (1990–2015) in this area, including the arable land acreage of each county, and the crops sown in these areas.

2.2.4. Land Use Data

The datasets from 1990 to 2015 were derived from the Data Center for Resources and Environmental Sciences, Chinese Academy of Sciences (RESDC; http://www.resdc.cn). The spatial resolution of the data was 1 km. The data were combined with statistics and socio-economic data to establish the spatial distributions of crop-sowing areas from 1990 to 2015.

2.2.5. GRACE Data

The monthly 0.5° × 0.5° GRACE (Gravity Recovery and Climate Experiment) datasets can be obtained from the Jet Propulsion Laboratory (JPL). In the study, the spatio-temporal variation of TWS in TRB was estimated using GRACE data from January 2003 to December 2015. The datasets were missing for 12 months (i.e., January and June 2011; May and October 2012; March, August, and September. 2013; February and December 2014; and June, October, and November 2015), and therefore were interpolated based on Long’s method [26].

2.3. Methods

2.3.1. Calculation of Reference Evapotranspiration, Crop Water Requirement, and Irrigation Water Requirement

The modified Penman–Monteith method [1,23,27,28], recommended by the FAO (PM-FAO) and widely identified as being efficient and effective for estimating reference evapotranspiration (ET0), was used to calculate ET0 (mm/d) [29]. The ET0 was calculated based on the PM-FAO method for a well-watered short grass with height, albedo, and stomata resistance of 0.12 m, 0.23, and 70 s/m, respectively [30].
The ET0 was calculated using the PM-FAO method:
E T 0 = 0.408 Δ ( R n G ) + γ ( 900 T + 273 ) u z ( e s e a ) Δ + γ ( 1 + 0.34 u 2 ) ,
where Δ (kPa/°C) is the slope vapor pressure curve; Rn (MJ/m2·d) is the net radiation; G (MJ/m2·d) is the soil heat flux and generally can be ignored at daily time-steps; γ (kPa/°C) is the psychrometric constant; uz (m/s) is the daily mean wind speed at 2 m height; es (kPa) is the saturation vapor pressure calculated using the measured Tmax and Tmin; and ea (kPa) is the daily mean actual vapor pressure expressed as a function of measured Tmax, Tmin, RHmax, and RHmin [19].
The net radiation was calculated as follows:
R n = 0.77 ( a + b n N ) R a R n l ,
where a and b are empirical coefficients (a = 0.18 and b = 0.55); n (h) is the sunshine duration; N (h) is the maximum sunshine duration; Ra (MJ/m2·d) is the extraterrestrial radiation; and Rnl (MJ/m2·d) is the net outgoing longwave radiation [13].
Crop water requirement was calculated as follows:
CWR = E T c P e .
CWR indicates the crop water requirement of a certain crop, and Pe is the effective rainfall. The CWR is influenced by soil properties, crop variety, weather conditions, aquifer conditions, and other factors.
This approach is based on the crop coefficient to calculate the ETc of each crop at 26 meteorological stations [31].
E T C = K c × E T 0 ,
where crop coefficients (Kc) and ETc (mm) are the crop coefficient and crop water requirement, respectively. The Kc value depends on climate, soil evaporation, crop type, and different growth stages [32].
In the current study, five main crops—rice, wheat, maize, cotton, and fruit trees—were considered for covering the largest planting area [11]. Other crops, including potato, beet, soybean, peanuts, and oilseed rape, were not respectively assessed as for their small planting areas (<0.16). The Kc of rice, wheat, maize, cotton, and fruit trees were derived from previous correlative researches and FAO recommendations [23,33]. The intra-annual variations of (Kc) of five main crops are shown in Figure 2.
Effective rainfall can be generally estimated by the following equation:
P e = P × δ ,
where P is the daily precipitation, and δ is an empirically effective utilization coefficient of rainfall, which is adopted as 0.52 in the study area [34].
Irrigation water requirement can be formulated:
IWR = S × C W R I c ,
where IWR is the irrigation water requirement of a certain crop; S is the acreage of the crop; and Ic is the irrigation efficiency. Improvements in the development of water-saving technologies and irrigation infrastructure have resulted in a marked improvement in irrigation efficiency in the TRB. Irrigation coefficients were estimated IWR in the current study [35]. Based on the “China Water Conservancy Yearbook” and the Xinjiang Uygur Autonomous Region Water Resources Bulletin, the Ic has increased from 0.38 to 0.52 during 1990–2015 (Table 1).

2.3.2. Extracting Crop Planting Structure Based on Statistical and Remote Sensing Data

Based on ground meteorological observation data, the current study employed the simple Thiessen polygon approach to calculate spatial interpolation of CWR. The distribution of the crop growing area is rasterized by combining the land use map and socio-economic statistical data [36]. The arable land distribution and the simple Thiessen polygon division are shown in Figure 1b. Using the spatial analysis function of ArcGIS, the statistical data of agricultural acreage and the vector data of the county-level administrative boundary of TRB are spatially linked. The spatial distribution of the main crop based on county-level administrative units is obtained. The rasterized crop planting area and its LUCC (Land-Use and Land-Cover Change) data were then spatially superimposed, resulting in a spatial-temporal distribution grid data set of five main crops (rice, wheat, maize, cotton, and fruit trees) for the TRB from 1990 to 2015.

2.3.3. Terrestrial Water Storage Calculations

In this study, surface mass change was analyzed by the Mascons method. The replacement of Earth’s oblateness scales (C20) coefficients because of the C20 values have larger uncertainty in GRACE data [37], and the degree-1 coefficients were calculated using the Swenson method [38]. Meanwhile, a glacial isostatic adjustment (GIA) correction in a 3-D finite-element model [39] was implemented in order to remove glacial rebound effects. Finally, the scaling factors were applied to the Grace data, and the scale-corrected time series can be expressed as [40]:
g ( x , y , t ) = g ( x , y , t ) × s ( x , y ) ,
where x and y are the longitude and latitude, respectively; t is the time (months); g (x, y, t) is the grid of surface mass change value; and s (x, y) is the scaling grid. The uncertainty estimates method was applied to this study [41], and the seasonal cycle of TWS was removed [42].

3. Results

3.1. Crop Water Requirement and its Trend

From 1990 to 2015, the average P showed continuous increasing trends, with annual increases of 0.33 mm/year. Tmax and Tmin showed continuous increasing trends, with annual increases of 0.03 and 0.04 °C/year, respectively. And the average ET0 of TRB was calculated to be 1015.58 mm, and it increased significantly (5.62 mm/year), the ET0 showed a significant increasing trend, implied the increasing IWR for the major crops in the region. This study calculated the CWR for the five major crops and tested the trends using the Mann–Kendall during 1990–2015 (Table 2). Table 2 showed that the fruit trees are the highest water consumption crop, with an annual CWR of 858 mm. This is followed by cotton, whose CWR is also very high, reaching 774 mm. The annual CWR for rice and maize are 609 mm and 548 mm, respectively, while wheat has the lowest CWR of the five crops, at 429 mm. The study is based on the Mann–Kendall test to reveal that the annual CWR of the five crops showed an increasing trend from 1990 to 2015, especially for fruit trees and cotton.
Due to the different geographical conditions of the sub-regions, there is a certain difference in the spatial distributions of CWR (Figure 3). From a regional perspective, the areas with higher water demand for all crops are mainly located in the oasis regions of the Tienshan Mountains (southern slope) and the Yarkand River (plains). Figure 3 showed that the CWR of rice in the TRB ranged from 348 mm to 805 mm. For the CWR of wheat and maize, the spatial difference was obvious. This is mainly due to the fertility characteristics of spring–summer maize and winter–spring wheat and the differences in the climate environment during the growth period of each region. The growth period of spring maize is about 50 days longer than summer maize. Compared with maize and wheat, the spatial difference of CWR in other crops is not evident. It is pointed out that the CWR of fruit trees is the highest in the TRB.

3.2. Variations of the Crop Growing Area and Spatial-Temporal Distribution of the Irrigation Water Requirement

From 1990 to 2015, cultivation in the TRB expanded significantly, especially in the Yarkand River Basin (YRB) and Aksu River Basin (ARB). The irrigated area increased from 122.91 × 10⁴ ha in 1990 to 335.30 × 10⁴ ha in 2015, with the fastest increase owing to land allotted to cotton (Table 3). Planting areas of cotton increased from 28.17 × 10⁴ ha in 1990 to 87.69 × 10⁴ ha in 2010 and then to 146.72 × 10⁴ ha in 2015, at which time it accounted for nearly half of the total planting area. In irrigated farmland, areas devoted to wheat and maize have not changed much in the past 26 years. The irrigated area growing wheat increased from 47.20 × 10⁴ ha in 1990 to 60.03 × 10⁴ ha in 2015, while the irrigated area growing maize increased from 31.22 × 10⁴ ha in 1990 to 50.32 × 10⁴ ha in 2015. Meanwhile, the irrigated area of rice decreased from 6.41 × 10⁴ ha in 1990 to 3.59 × 10⁴ ha in 2015. However, fruit trees saw a major increase. In 1990, there were only 9.92 × 10⁴ ha planted with fruit trees, but by 2015, the fruit trees-dedicated irrigated area had increased to 74.65 × 10⁴ ha.
Based on the calculated crop water requirement, the current study calculated and created IWR distribution maps for different periods in the TRB. Since 1990, the IWR has largely increased because changes in planting structure and increases in crop growing areas. The IWR for the five major crops climbed from 193.14 × 10⁸ m3 in 1990 to 471.89 × 10⁸ m3 by 2015. A time series for the IWR in the TRB during 1990–2015 is shown in Figure 4b. A clear turning point (year 2003) was tested. During the period 1990–2002, the total amount of IWR remained more or less steady at 200 × 108 m3. From 2003, however, the IWR started to rise swiftly, increasing to 471.89 × 10⁸ m3 by 2015. The main reason for this rapid increase in IWR is that, starting in 2003, the southern Xinjiang region began major cotton-planting activities and also developed a special fruit industry. Analysis of the IWR of various crops, including rice, wheat, and maize, shows that they accounted for half of the IWR share prior to 2003. Then, as of 2003, the irrigation water allotment of fruit trees and cotton consistently exceeded 70% of total water consumption for the region. This indicates that the IWR of fruit trees and cotton is substantial and led to continuous increasing trends in the IWR. In contrast, during the entire study period, rice accounted for only 0.9–5% of the total water consumption. Indeed, the farmland allotted to rice declined in size, resulting in a decrease in the IWR of rice.
As seen in the Figure 5b, the quota of agricultural irrigation water in the TRB ranged from 400 × 103 m3/km2 to 1100 × 103 m3/km2 in 2015. Fruit trees consumed the most (859.6 × 10³ m3/km2), followed by cotton, rice, maize, and wheat at 770.2 × 10³ m3/km2, 597.6 × 10³ m3/km2, 560.1 × 10³ m3/km2, and 434.7 × 10³ m3/km2, respectively. Due to changes in the crop planting structure, the IWR generally increased since 1990. The most significant increases occurred in the oasis on the southern slope of Tienshan Mountains as well as the oasis in the YRB (Figure 5c). This phenomenon indicates that changes in planting structure, particularly the expansions of fruit trees and cotton, are the main reasons for the notable increase in the IWR during 1990–2015.
There are five crops that account for the vast majority of planted crops, and other crops account for 16% of the total area in the TRB. However, in order to further verify the accuracy of calculation results, the research selects the actual agricultural irrigation data of the water department of the Kuqa County and compares it with the simulated IWR. Kuqa County is located in the northeastern part of the Aksu Prefecture, mainly extracting agricultural irrigation water from the Kuqa River and the Weigan River. The comparison found that there is some error between the IWR and the local actual irrigation water amount, but the changing trend is basically the same, and the simulation accuracy is relatively good in some years (Figure 6). In general, the assessment indicates that the simulated IWR can reflect the actual water use in this study. The results can provide some reference for regional water management.

3.3. Effects of the Increasing Irrigation Water Requirement on TWS and Groundwater Level

The temporal changes in TWS anomalies were analyzed from January 2003 to December 2015 in the TRB. The TWS declined at a rate of −0.27 mm/month over the past 14 years (Figure 7a). It was noted that a remarkable decreasing trend of about −1.01 mm/month (p < 0.01) during 2005–2008, but an increasing trend from 2009 to 2012, with a rate of 0.38 mm/month (p < 0.01). Meanwhile, spatial changes in TWS anomalies indicate significant spatial differences between 2003 and 2015 (Figure 7b). The phenomena that the amount of TWS in the south of basin was more than the amount of TWS in the north of the basin. Additionally, there were notable spatial differences in the TWS trend variations: The positive trend and the negative trend were exhibited in the southern areas (Kunlun Mountains) and northern areas (Tienshan Mountains), respectively. An increasing trend was clearly obvious in the annual variability of TWS anomalies in the southern areas (about 10–39 mm/year), but declining in the northern areas (about −20 to −68 mm/year).
Figure 7c shows the temporal dynamics of annual average IWR and TWS in the TRB during 2003–2015. Starting in 2003, the southern Xinjiang region began major cotton-planting activities and also developed a special fruit industry, causing the IWR starting to rise swiftly, increasing to 471.89 × 10⁸ m3 by 2015. The current study analyzed the relationship between IWR and TWS and concluded that the increase in agricultural irrigation water led to a decline in regional water storage. The relationship had a correlation coefficient of −0.83, with a significant level at 0.99. It revealed a rapid increase in irrigated cropland with a rapid decrease in freshwater storage in TRB. As it turns out, much of the region’s surface water is redirected to agricultural areas, where it evaporates, leaving the region with a net loss of water.
Based on the in-situ observation, the groundwater table has declined from 2004 to 2010 (Figure 8). The average groundwater level at the observation point (a1, a2, and a3) in the Kaxgar River Basin (KGRB) has dropped by nearly 1 m from 2004 to 2010. The groundwater level for the b1, b2, and b3 have dropped by 0.78 m, 0.38 m, and 0.68 m, respectively. The groundwater table experienced a rapid decline at the observation point in the KGRB (0.3 m/year, Figure 8a) and the YRB (0.1 m/year, Figure 8b). The changes in groundwater table were induced by the development of IWR. The groundwater table in the region had fallen sharply and the water crisis had become more prominent.

3.4. Analysis of Water Requirement and Supply Risk in Irrigation Areas of Four Headwaters of the Tarim River Basin

The agricultural land of the TRB is primarily located in an oasis, which heavily relies on irrigation. The main source of irrigation water comes from mountain glaciers, snow melt water, and summer rainfall, so any changes in runoff will significantly affect IWR. In this section, this study analyzed the supply and requirement risks of irrigation water in annual and seasonal seasons of the four headwaters (Weigan-Kuqa River Basin (WKRB), Aksu River Basin (ARB), Kaxgar River Basin (KGRB), and Yarkand River Basin (YRB)) of the TRB.
Table 4 showed the comparison annual river runoff (deemed as the maximum available water resource) with the requirement for irrigation water. Applying an inter-annual scale, the IWR to river discharge (IWR/Q) ratios for the WKRB, ARB, KGRB, and YRB were 0.93, 0.68, 1.05, and 0.79, respectively, from 1990 to 2015. According to the water shortage index [43], which is defined as the ratio of water consumption to water supply, when IWR/Q was greater than 0.47, the basin was considered to be in severe water shortage. From this, the results showed that the above four basins were experiencing severe water shortages. The most significant water shortage areas were found in the KGRB and WKRB, with an IWR/Q of over 0.9. Both the Kaxgar River and the Weigan-Kuqa River have no water recharging the mainstream of the Tarim River. Hence, the natural riparian vegetation is dying and the ecosystem is seriously degraded. As a result, a large amount of groundwater is extracted for irrigation, and the groundwater table has declined sharply.
The data show that the IWR in the four headwater basins was lower than the annual river runoff. However, as we saw above, the IWR/Q ratio of the KGRB exceeded 0.9 from 1990 to 2002, so the contradiction between supply and requirement had begun to emerge. In the process of large-scale development of water resources and land during 2003–2015, the IWR/Q ratios of the four basins all exceeded 0.9, and the IWR/Q ratio of the KGRB and WKRB even reached the limit of 1.1. These watersheds are facing extremely serious water shortages. The large requirement for irrigation led to the extensive use of groundwater for irrigation of farmland, which caused the downstream rivers to be cut off and the ecological environment to deteriorate in the region.
A lag in the seasonal variation of river runoff and IWR can be seen in the Figure 9. The high flow period is in July and August, but the critical period for IWR is in May and June. Hence, there is a major contradiction between IWR and river runoff. The ARB and YRB experience water shortages in April–June, while the KGRB and WKRB, both of which have lost surface water relations with the mainstream, not only experience shortages in April–June but also in July. As for the inconsistent seasonal distribution of IWR and runoff, the seasonal shortage of irrigation water is severe in the four headwater basins. The maximum flow of rivers generally occurs in July and August and IWR is much lower than the river flow during this period, so there is no water shortage in summer.
However, in April and May, during the crucial period of spring crops (cotton, spring wheat, and summer maize) and winter wheat flowering, due to low temperatures in the mountains, snow and glacial meltwater cannot meet the irrigation requirements. The seasonal water shortages that already exist in the basin will greatly reduce crop yield, while the spring drought will increase the contradiction between water requirement and supply. This seasonal shortage of water induces a hysteresis effect that exacerbates water stress in the region. Consequently, mining groundwater or building a reservoir is especially important as a means to compensate for seasonal water shortages. The runoff does not match IWR during this period, so any change in runoff seriously affects the amount of available agricultural irrigation water. Given the current trends, the water supplies is challenging to meet the water requirement in the future, making a relationship between IWR and runoff increasingly prominent. Therefore, a plan to rationally formulate water allocation is critical for ensuring the sustainable development of water resources.

4. Discussion

The TRB is located in an arid region of northwest China. It is also the core area for construction of the Silk Road Economic Belt. The region has an arid climate, limited water resources, and one of the most fragile ecological environments in the country. According to the 2015 Xinjiang Water Resources Bulletin, Xinjiang’s agricultural water sector shares more than 95% of total water use. Therefore, as a means to optimize water resources management to achieve sustainable development of the oasis, it is critical to explore the requirements for agricultural irrigation water. At the same time, it is also inevitable to estimate the spatial-temporal characteristics of IWR as well as the balance of supply and requirement water.
Across the basin region, runoff is produced by mountain glaciers, snow melt water, and precipitation recharge, which passes through the oasis’ natural and artificial irrigation systems. The oasis would have difficulty surviving without irrigation. Within the past 26 years, large-scale water and soil development increased the irrigated area from 122.91 × 10⁴ ha in 1990 to 335.30 × 10⁴ ha in 2015. The IWR also increased. In their study, Fang et al. [11] found that the water crisis is becoming more and more serious in TRB. Shen et al. [1] concluded that the IWR in the TRB was 204.6 × 10⁸ m3 in 2010, which could be a significant underestimation. The present study calculated IWR in 2010 as 358.97 × 10⁸ m3. The major difference in findings is likely due to the use of different data related to crop selection and irrigated area. In terms of the crop irrigated area data based on the Xinjiang Statistical Yearbook, we added the Yearbook of Xinjiang Production and Construction Crops, which would make the data more comprehensive and better reflect the real situation.
As climate change continues to aggravate the spatial and temporal heterogeneity of hydrological cycles and water resource allocation in the TRB, the risk of insufficient irrigation water use may further increase. It is necessary to use a variety of adaptation methods not only to strengthen regional water resources allocation and integrated management of river basins but also to adapt to the transformation, so that it can respond scientifically and effectively to climate change [44]. The seasonal shortage, which occurs annually from April to June, has increased the water pressure in the study area. Meanwhile, the expansion of a large number of high-yield crops (e.g., fruit trees and cotton) has led to a continuous increasing trends in the crop water requirement, resulting in ecological degradation of the downstream of the river basin [1,25], such as drying up of the river [24]. Therefore, in areas where water resources are scarce and becoming increasingly scarcer, it is imperative that relevant authorities optimize water management processes, such as regulating local water prices, adjusting crop planting patterns, and developing water-saving technologies.
Furthermore, due to the continuous expansion of cultivated land area in the TRB during 1990–2015, the water designated for agricultural irrigation use has been increasing and the river cut off. As a result, the groundwater is continuously being over-extracted for agricultural irrigation purposes, which has led to a significant drop in the water table [45]. Water resources are the key element in coordinated development of the socio-economic and ecological environment in the inland River Basin. In view of the current water shortage situation, the establishment of an optimal allocation plan to improve irrigation efficiency and ease the contradiction between supply and requirement should be suggested [46]. Therefore, how to allocate effective water resources scientifically, quantitatively, and sustainably will be the core issue of our future research.

5. Conclusions

Currently, the agricultural water use accounts for 95% of the total water consumption in the TRB. However, it is hard to precisely calculate the amount of irrigation water being used due to the lack of observational data. The current study calculated the IWR based on the PM-FAO approach and the crop coefficient model, combined with land use data and irrigated area data for five major crops during 1990–2015. The findings are summarized below.
(1)
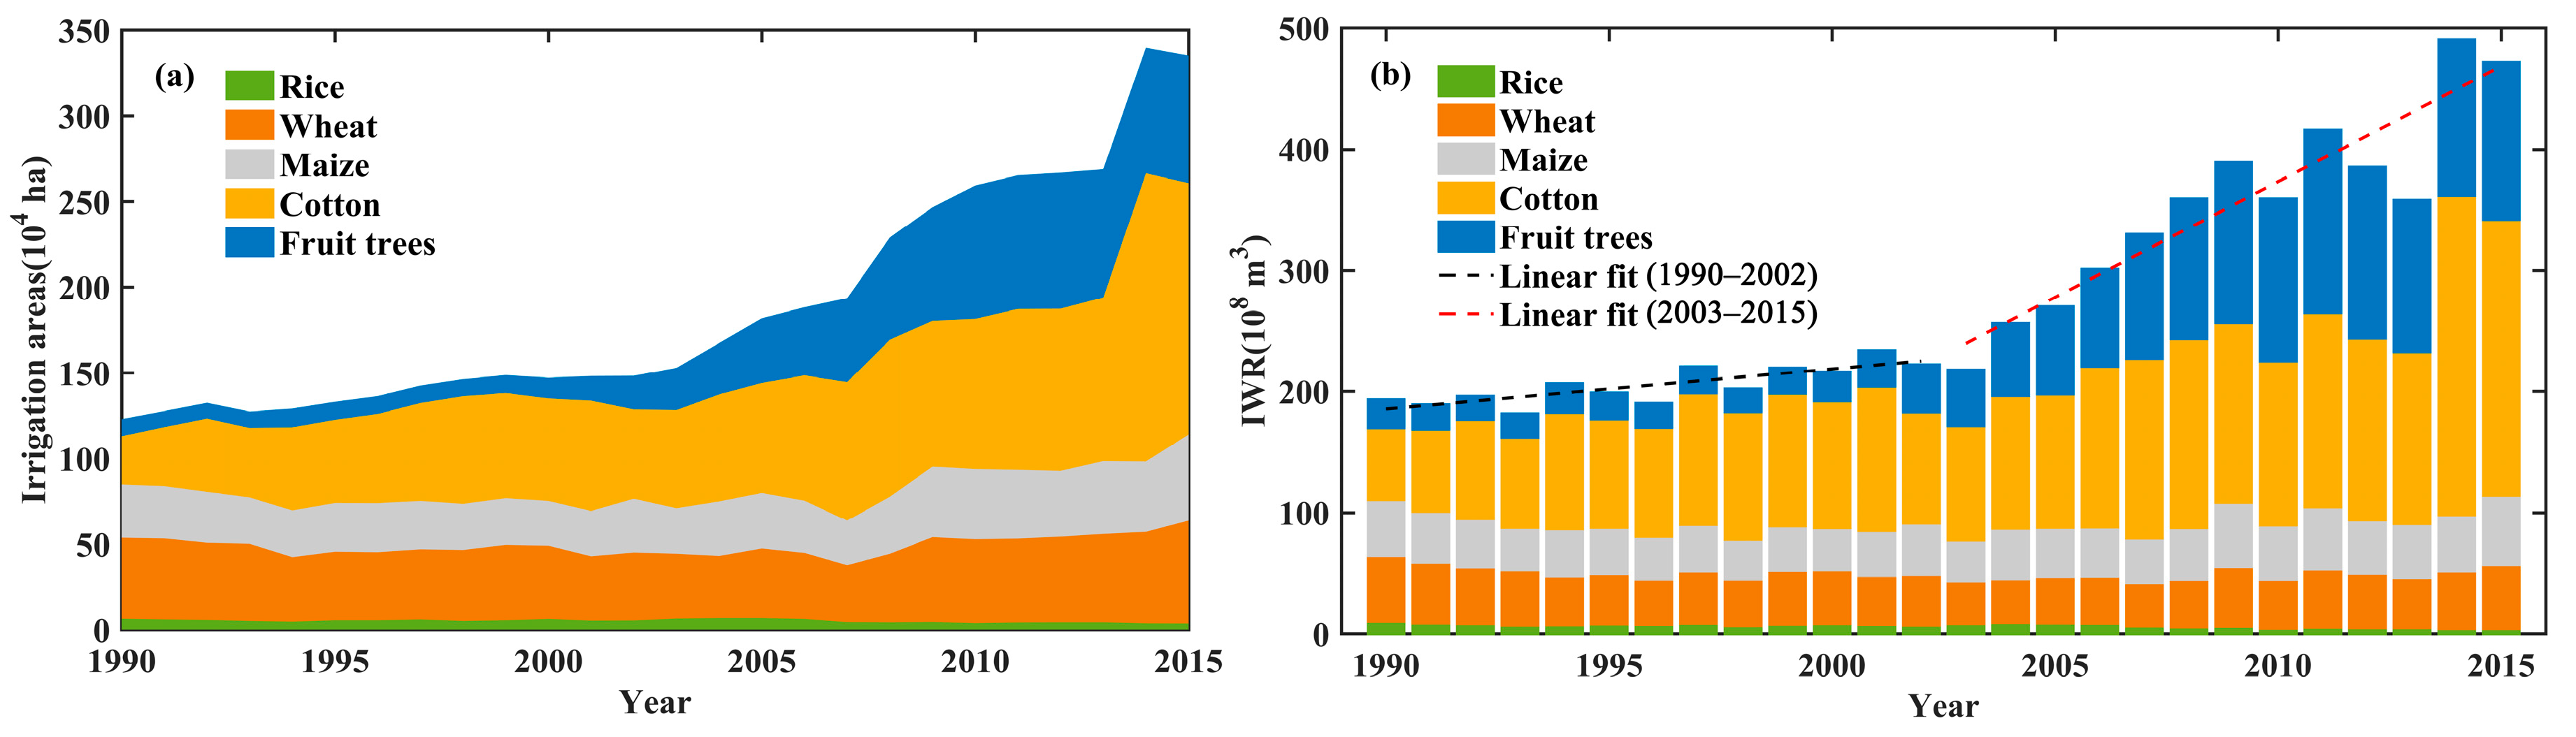
In 2015, the total IWR was 471.89 × 10⁸ m3, an increase of 278.74 × 10⁸ m3 compared to 1990. For roughly the first half (1990–2002) of the study period, the total IWR remained relatively consistent at 200 × 108 m3. From 2003, however, the IWR steadily rose, increasing to 471.89 × 10⁸ m3 by 2015. The main reason for the 2003–2015 increase is that the southern Xinjiang region had started an extensive cotton-planting project and also promoted the fruit industry.
(2)
Among the five main crops (rice, wheat, maize, cotton, and fruit trees) grown in the TRB, cotton had the largest water requirement. The IWR of cotton reached 227.53 × 10⁸ m3 in 2015, accounting for 48.2% of the total annual water consumption that year. In terms of the quota of agricultural irrigation water, fruit trees consumed the most (859.6 × 10³ m3/km2), followed by cotton, rice, maize, and wheat at 770.2 × 10³ m3/km2, 597.6 × 10³ m3/km2, 560.1 × 10³ m3/km2, and 434.7 × 10³ m3/km2, respectively.
(3)
With increasing IWR, TWS declined at a rate of −0.27 mm/month over the past 14 years in the TRB and groundwater table dropped obviously. Severe water shortages were detected with IWR/Q ratios of the WKRB, ARB, KGRB, and YRB during 1990–2015 being 0.93, 0.68, 1.05, and 0.79, respectively. Seasonally, as the seasonal variations of river runoff and IWR were not consistent, the water stress was severe especially for May and June. This annual seasonal shortage served to further increase water stress in this region.

Author Contributions

F.W. analyzed the data and wrote the first draft. Y.C. proposed the main structure of this study. Z.L., G.F. and Y.L. provided useful advice and revised the manuscript. Z.X. processed the runoff data. All authors contributed to the final manuscript.

Funding

This research was funded by the Strategic Priority Research Program of Chinese Academy of Sciences, (Grant No. XDA20100303).

Acknowledgments

We appreciate the editors and the reviewers for their constructive suggestions and insightful comments, which helped us greatly to improve this manuscript.

Conflicts of Interest

The authors declare no conflict of interest.

References

  1. Shen, Y.; Li, S.; Chen, Y.; Qi, Y.; Zhang, S. Estimation of regional irrigation water requirement and water supply risk in the arid region of Northwestern China 1989–2010. Agric. Water Manag. 2013, 128, 55–64. [Google Scholar] [CrossRef]
  2. Li, Z.; Chen, Y.; Fang, G.; Li, Y. Multivariate assessment and attribution of droughts in Central Asia. Sci. Rep. 2017, 7, 1316. [Google Scholar] [CrossRef]
  3. Chen, Y. Ecological Protection and Sustainable Management of the Trim River Basin; Science Press: Beijing, China, 2015. [Google Scholar]
  4. Fu, M.; Guo, B.; Wang, W.; Wang, J.; Zhao, L.; Wang, J. Comprehensive Assessment of Water Footprints and Water Scarcity Pressure for Main Crops in Shandong Province, China. Sustainability 2019, 11, 1856. [Google Scholar] [CrossRef]
  5. Shi, X.; Yu, D.; Warner, E.; Sun, W.; Petersen, G.; Gong, Z.; Lin, H. Cross-Reference System for Translating Between Soil Classification of China and Soil Taxonomy. Soil Sci. Soc. Am. J. 2006, 70, 78–83. [Google Scholar] [CrossRef]
  6. Shi, X.; Yu, D.; Warner, E.; Pan, G.; Petersen, G.; Gong, Z.; Weindorf, C. Soil Database of 1:1,000,000 Digital Soil Survey and Reference System of the Chinese Genetic Soil Classification System. Soil Surv. Horiz. 2004, 45, 129–136. [Google Scholar] [CrossRef]
  7. Qi, F.; Wei, L.; Si, J.; Su, Y.; Zhang, Y.; Cang, Z.; Xi, H. Environmental effects of water resource development and use in the Tarim River basin of northwestern China. Environ. Geol. 2005, 48, 202–210. [Google Scholar] [CrossRef]
  8. Sun, T.; Huang, Q.; Wang, J. Estimation of Irrigation Water Demand and Economic Returns of Water in Zhangye Basin. Water 2018, 10, 19. [Google Scholar] [CrossRef]
  9. Wang, F.; WU, Z.; Wang, Y.; Jiao, W.; Chen, Y. Dynamic monitoring of desertification in the Tarim Basin based on RS and GIS techniques. Chin. J. Ecol. 2017, 36, 1029–1037. [Google Scholar]
  10. Liu, X.; Shen, Y.; Guo, Y.; Li, S.; Guo, B. Modeling demand/supply of water resources in the arid region of northwestern China during the late 1980s to 2010. J. Geogr. Sci. 2015, 25, 573–591. [Google Scholar] [CrossRef]
  11. Fang, G.; Chen, Y.; Li, Z. Variation in agricultural water demand and its attributions in the arid Tarim River Basin. J. Agric. Sci. 2018, 156, 1–11. [Google Scholar] [CrossRef]
  12. Malin, F.; Carl, W. Population and water resources: A delicate balance. Popul. Bull. 1993, 47, 1–36. [Google Scholar]
  13. Zotarelli, L.; Dukes, M.D.; Romero, C.C.; Migliaccio, K.W.; Morgan, T.K. Step by Step Calculation of the Penman-Monteith Evapotranspiration (FAO-56 Method). Agric. Biol. Eng. 2010. Available online: http://edis.ifas.ufl.edu/ae459 (accessed on 10 May 2016).
  14. Thevs, N.; Peng, H.; Rozi, A.; Zerbe, S.; Abdusalih, N. Water allocation and water consumption of irrigated agriculture and natural vegetation in the Aksu-Tarim river basin, Xinjiang, China. J. Arid Environ. 2015, 112, 87–97. [Google Scholar] [CrossRef]
  15. Uniyal, B.; Dietrich, J.; Vu, N.Q.; Jha, M.K.; Arumí, J.L. Simulation of regional irrigation requirement with SWAT in different agro-climatic zones driven by observed climate and two reanalysis datasets. Sci. Total Environ. 2018, 649, 846. [Google Scholar] [CrossRef] [PubMed]
  16. Smith, M. The application of climatic data for planning and management of sustainable rainfed and irrigated crop production. Agric. Forest Meteorol. 2000, 103, 99–108. [Google Scholar] [CrossRef]
  17. Liu, X.; Li, Y.; Hao, W. Trend and causes of water requirement of main crops in North China in recent 50 years. Trans CSAE 2005, 21, 155–159. [Google Scholar]
  18. Xiao, J.; Liu, Z.; Duan, A.; Liu, Z.; Li, X. Studies on Effects of Irrigation Systems on the Grain Yield Constituents and Water Use Efficiency of Winter Wheat. J. Irrig. Drain. 2006, 25, 20–23. [Google Scholar]
  19. Er-Raki, S.; Chehbouni, A.; Guemouria, N.; Duchemin, B.; Ezzahar, J.; Hadria, R. Combining FAO-56 model and ground-based remote sensing to estimate water consumptions of wheat crops in a semi-arid region. Agric. Water Manag. 2007, 87, 41–54. [Google Scholar] [CrossRef] [Green Version]
  20. Ye, Q.; Yang, X.; Dai, S.; Chen, G.; Li, Y.; Zhang, C. Effects of climate change on suitable rice cropping areas, cropping systems and crop water requirements in southern China. Agric. Water Manag. 2015, 159, 35–44. [Google Scholar] [CrossRef]
  21. Li, D.; Luo, H.; Luo, Y.; Gui, Y.; Li, Y.; Meng, Q. Analysis of irrigation water demand and supply in the Lhasa River valley, Tibet. J. Grainage Irrig. Mach. Eng. 2018, 36, 1053–1058. [Google Scholar]
  22. Guo, B.; Li, W.; Guo, J.; Chen, C. Risk Assessment of Regional Irrigation Water Demand and Supply in an Arid Inland River Basin of Northwestern China. Sustainability 2015, 7, 12958–12973. [Google Scholar] [CrossRef] [Green Version]
  23. Allen, R.G. Crop Evapotranspiration—Guidelines for Computing Crop Water Requirements; FAO Irrigation and Drainage Paper No.56; FAO: Rome, Italy, 1998; 300p. [Google Scholar]
  24. Chen, Y.; Ye, Z.; Shen, Y. Desiccation of the Tarim River, Xinjiang, China, and mitigation strategy. Quat. Int. 2011, 244, 264–271. [Google Scholar] [CrossRef]
  25. Shen, Y.; Chen, Y.; Liu, C.; Chen, Y.; Xu, Z. Global perspective on hydrology, water balance, and water resources management in arid basins. Hydrol. Process. 2010, 24, 129–135. [Google Scholar] [CrossRef]
  26. Di, L.; Yang, Y.; Wada, Y.; Yang, H.; Wei, L.; Chen, Y.; Yong, B.; Hou, A.; Wei, J.; Lu, C. Deriving scaling factors using a global hydrological model to restore GRACE total water storage changes for China’s Yangtze River Basin. Remote Sens. Environ. 2015, 168, 177–193. [Google Scholar]
  27. Xu, S.; Yu, Z.; Yang, C.; Ji, X.; Zhang, K. Trends in evapotranspiration and their responses to climate change and vegetation greening over the upper reaches of the Yellow River Basin. Agric. For. Meteorol. 2018, 263, 118–129. [Google Scholar] [CrossRef]
  28. Gu, S.; He, D.; Cui, Y.; Li, Y. Temporal and spatial changes of agricultural water requirements in the Lancang River Basin. J. Geogr. Sci. 2012, 22, 441–450. [Google Scholar] [CrossRef]
  29. Han, S.; Xu, D.; Yang, Z. Irrigation-Induced Changes in Evapotranspiration Demand of Awati Irrigation District, Northwest China: Weakening the Effects of Water Saving? Sustainability 2017, 9, 1531. [Google Scholar] [Green Version]
  30. Shahid, S. Impact of climate change on irrigation water demand of dry season Boro rice in northwest Bangladesh. Clim. Change 2011, 105, 433–453. [Google Scholar] [CrossRef]
  31. Yang, Y.; Disse, M.; Yu, R.; Yu, G.; Sun, L.; Huttner, P.; Rumbaur, C. Large-Scale Hydrological Modeling and Decision-Making for Agricultural Water Consumption and Allocation in the Main Stem Tarim River, China. Water 2015, 7, 2821–2839. [Google Scholar] [Green Version]
  32. Jia, H.; Zhang, T.; Yin, X.; Shang, M.; Chen, F.; Lei, Y.; Chu, Q. Impact of Climate Change on the Water Requirements of Oat in Northeast and North China. Water 2019, 11, 91. [Google Scholar] [CrossRef]
  33. Zhang, L.; Zhang, N.; Ma, Y. Study on Water Use of Walnut Trees under Drip Irrigation. Mod. Agric. Sci. Technol. 2010, 21, 117–121. [Google Scholar]
  34. Xu, X.; Zhou, H.; Wang, Z.; Rouzi, J. Study on Effective Rainfall Use Efficiency in Arid Irrigation District. Water Sav. Irrig. 2010, 12, 46–50. [Google Scholar]
  35. Grafton, R.Q.; Williams, J.; Perry, C.J.; Molle, F.; Ringler, C.; Steduto, P.; Udall, B.; Wheeler, S.A.; Wang, Y.; Garrick, D.; et al. The paradox of irrigation efficiency. Science 2018, 361, 748–750. [Google Scholar] [CrossRef] [PubMed] [Green Version]
  36. Lv, N.; Bai, J.; Chang, C.; Li, J.; Luo, G.; Wu, S.; Ding, J. Spatial-temporal changes in evapotranspiration based on planting patterns of major crops in the Xinjiang oasis during 1960–2010. Geogr. Res. 2017, 36, 1443–1454. [Google Scholar]
  37. Cheng, M.; Ries, J.C.; Tapley, B.D. Variations of the Earth’s figure axis from satellite laser ranging and GRACE. J. Geophys. Res. Solid Earth 2015, 116, B01409. [Google Scholar] [CrossRef]
  38. Swenson, S.; Chambers, D.; Wahr, J. Estimating geocenter variations from a combination of GRACE and ocean model output. J. Geophys. Res. Solid Earth 2008, 113. [Google Scholar] [CrossRef] [Green Version]
  39. Geruo, A.; Wahr, J.; Zhong, S.J. Computations of the viscoelastic response of a 3-D compressible Earth to surface loading: An application to Glacial Isostatic Adjustment in Antarctica and Canada. Geophys. J. Int. 2013, 192, 557–572. [Google Scholar]
  40. Deng, H.; Pepin, N.C.; Liu, Q.; Chen, Y. Understanding the spatial differences in terrestrial water storage variations in the Tibetan Plateau from 2002 to 2016. Clim. Change 2018, 151, 379–393. [Google Scholar] [CrossRef] [Green Version]
  41. Wahr, J.; Swenson, S.; Velicogna, I. Accuracy of GRACE mass estimates. Geophys. Res. Lett. 2006, 33, 178–196. [Google Scholar] [CrossRef]
  42. Deng, H.; Chen, Y. Influences of recent climate change and human activities on water storage variations in Central Asia. J. Hydrol. 2016, 544, 46–57. [Google Scholar] [CrossRef]
  43. Falkenmark, M.R., Jr. Balancing Water for Humans and Nature: An Ecohydrological Approach for Sustainability; Earthscan Publications: London, UK, 2004; p. 247. [Google Scholar]
  44. Wang, Y.; Dahe, Q. Influence of climate change and human activity on water resources in arid region of Northwest China: An Overview. Clim. Change Res. 2017, 13, 483–493. [Google Scholar] [CrossRef]
  45. Chen, Y.; Li, Z.; Li, W.; Deng, H.; Shen, Y. Water and ecological security: Dealing with hydroclimatic challenges at the heart of China’s Silk Road. Environ. Earth Sci. 2016, 75, 881. [Google Scholar] [CrossRef]
  46. Kang, J.; Zi, X.; Wang, S.; He, L. Evaluation and Optimization of Agricultural Water Resources Carrying Capacity in Haihe River Basin, China. Water 2019, 11, 999. [Google Scholar] [CrossRef]
Figure 1. Study area: (a) Location of the Tarim River Basin in China; (b) Thiessen polygon division, meteorological station, and arable land distribution in 2015; (c) groundwater station, hydrological station, and distribution of nine river sub-basins in the Tarim River Basin.
Sustainability 11 04941 g001
Figure 2. Intra-annual variations of crop coefficients (Kc) during different growing stages of main crops in the Tarim River Basin.
Sustainability 11 04941 g002
Figure 3. Spatial distribution of main crop average CWR in the Tarim River Basin (unit: mm). (a) Rice, (b) wheat, (c) maize, (d) cotton, and (e) fruit trees.
Sustainability 11 04941 g003
Figure 4. Variations in irrigated crop growing area (a) and inter-annual variations in irrigation water requirements for various crops (b) in the Tarim River Basin.
Sustainability 11 04941 g004
Figure 5. Spatial distribution of irrigation water requirement in the Tarim River Basin in (a) 1990 and (b) 2015, and (c) its change compared to 1990.
Sustainability 11 04941 g005
Figure 6. Irrigation water requirements (IWR) compared with the actual irrigation water amount in Kuqa County.
Sustainability 11 04941 g006
Figure 7. The temporal (a) and spatial variations (b) distribution of terrestrial water storage (TWS) anomalies and temporal dynamics of annual average IWR and TWS (c) in the Tarim River Basin (TRB) during 2003–2015.
Sustainability 11 04941 g007
Figure 8. Changes in the groundwater table based on in situ station data in the Tarim River Basin from 2004 to 2010 ((a): Kaxgar River Basin (KGRB); and (b): Yarkand River Basin (YRB)).
Sustainability 11 04941 g008
Figure 9. Intra-annual distribution of river discharge (Q) and irrigation water requirement (IWR) in four headwaters of the Tarim River Basin (ad) ((a): Weigan-Kuqa River Basin (WKRB); (b): Aksu River Basin (ARB); (c): Kaxgar River Basin (KGRB); and (d): Yarkand River Basin (YRB)).
Sustainability 11 04941 g009
Table 1. Irrigation water efficiency in the study region from 1990 to 2015.
Year199019952000200520102015
Irrigation water efficiency0.380.400.420.450.480.52
Table 2. Annual average crop water requirement (CWR) and meteorological variables in the Tarim River Basin and trends (1990–2015, unit: mm).
RegionRiceWheatMaizeCottonFruit treesET0PTmax (°C)Tmin (°C)
WKRB553387496699777902.76121.9515.772.33
MK trend2.946 **2.267 **2.713 **4.335 **4.809 **5.62 **−0.150.020.03 **
ARB593416535747828972.38118.4518.004.55
MK trend0.8671.147 *1.0871.3201.5453.09 **0.630.020.03 **
KGRB6394405718048901057.29117.5117.114.27
MK trend2.160 *1.972 **2.190 **2.706 *3.043 *4.70 **0.770.020.04 **
YRB605426545763846998.3972.5818.434.28
MK trend1.946 *1.534 *1.863 *2.679 *2.976 *4.85 **0.510.030.03 *
TRB6094295487748581015.5896.4817.694.02
MK trend2.513 **1.803 **2.156 **3.649 **4.055 **5.62 **0.330.030.04 **
MK trend indicates the statistic value for the Mann-Kendall test. * Significant at the 0.05 level. ** Significant at the 0.01 level.
Table 3. Variations of the irrigated main crop growing area in the Tarim River Basin (1990–2015, unit: 104 ha).
Year199019952000200520102015
Rice6.415.476.356.793.843.59
Wheat47.2040.0342.6640.6048.8860.03
Maize31.2228.5426.2432.4340.9950.32
Cotton28.1748.5659.7964.1987.69146.72
Fruit trees9.9210.3912.0537.6877.8274.65
All122.91133.00147.07181.68259.22335.30
Table 4. Characteristics of the irrigation water requirement and river discharge in four headwaters of the Tarim River Basin (×108 m3/year).
YearWKRBARBKGRBYRB
IWRQIWR/QIWRQIWR/QIWRQIWR/QIWRQIWR/Q
1990–200221.633.70.6440.086.90.4634.738.50.9046.977.10.61
2003–201543.236.31.1973.979.50.9357.749.51.1779.183.10.95
Average32.435.00.9356.983.20.6846.244.01.0563.080.10.79

