Article

Analysis of Spatial and Temporal Characteristics of Citizens’ Mobility Based on E-Bike GPS Trajectory Data in Tengzhou City, China

1
Chinese Academy of Surveying and Mapping, Beijing 100830, China
2
Beijing No.4 High School International Campus, Beijing 100031, China
*
Author to whom correspondence should be addressed.
Sustainability 2019, 11(18), 5003; https://doi.org/10.3390/su11185003
Submission received: 2 August 2019 / Revised: 9 September 2019 / Accepted: 10 September 2019 / Published: 12 September 2019

Abstract

:
Environmentally friendly shared transit systems have become ubiquitous at present. As a result, analyzing the ranges and tracts of human activities and gatherings based on bike share data is scientifically useful. This paper investigates the spatial and temporal travel characteristics of citizens based on real-time-extracted electric bikes (e-bikes) Global Positioning System (GPS) data from May to July in 2018 in the central area of Tengzhou City, Shandong Province, China. The research is conducive for the exploration of citizens’ changes in mobility behaviors, for the analysis of relationships between mobility changes and environmental or other possible factors, and for advancing policy proposals. The main conclusions of the study are as follows. First, in general, citizens’ travelling is featured by rides that are less than 10 min, shorter than 5 km, and with a speed between 5 km/h and 20 km/h. Second, in terms of temporal characteristics, monthly e-bike usage and citizens’ mobility are positively correlated with temperature in May and negatively correlated with temperature in July; an overall negative correlation is also manifested between the e-bike usage (mobility) and air quality index; daily usage reaches a trough on Tuesday and a peak on Friday, indicating the extent of mobility on respective days; e-bike usage and human outdoor behaviors are significantly lowered in rainy weather than in sunny weather; hourly rides reach a peak at 18:00 (more human activities) and a trough at 2:00 (less activities), and average hourly riding speed maximizes at 5:00 and minimizes around 8:00 and 17:00. Third, for spatial characteristics, destinations (D points) during morning rush hour and regions where e-bikes are densely employed are concentrated mainly in mid-north and middle parts of the central area (major human gatherings), and the rides have a diffusing pattern; e-bike origin–destination (O–D) trajectories radiate mostly towards the mid-north and the east during evening rush hour. In addition, 9.4% of the total trips to work areas during morning rush hour represent spillover commuting, indicating that separations between jobs and residential are not severe in the central area of Tengzhou City and commuting is relatively convenient.

1. Introduction

Accompanied with the promulgation of the slogan, “low-carbon life, green travel,” environmentally friendly vehicle sharing has been widely adopted by local citizens and advocated by the government due to its low cost for production, convenience, and cheap price. In the era of big data, the use of the Global Positioning System (GPS) information of shared vehicles can unveil the tracts and regions of users’ activities and gatherings. Therefore, studying shared bike usage has pivotal implications for understanding human behaviors and lifestyles and assessing city development.
At present, studies based on bike-sharing have mainly focused on the analysis of the mode and prospect of the shared economy [1], spatial and temporal characteristics of trajectories [2], and vehicle regulations [3,4]. However, the existing studies about spatial and temporal characteristics based on origin–destination (O–D) points have shortcomings. First, studies concentrate on bike-sharing in large-scale cities [5] and hinge on outdated data or less-than-a-month data, and few studies target small-scale cities, such as prefectures [6,7], and employ current more-than-a-month data. Data that covers a time length greater than a month is more conducive in reflecting the daily changes in mobility behavior. Second, compared to shared bicycles (aimed at addressing last-kilometer problems for bus station and subway transit), shared e-bikes cover longer distances and are oriented towards recreational or work destinations, for example, rendering them typical subjects for comprehending citizens’ travel behaviors. Additionally, few contemporary studies have examined the spatial and temporal characteristics (and raw data cleansing method) based on e-bike GPS data.
Therefore, this paper analyzes the spatial and temporal travel characteristics of citizens in the central area of Tengzhou City based on real-time captured GPS data from May to July in 2018 in the central area of Tengzhou City, Shandong Province. This study is based on the station-free bike-sharing system (SFBSS), which is unique especially in China for its strong flexibility and convenience in usage [6,7,8]. The objectives are: (1) to analyze the overall trip patterns of shared electric bikes (e-bikes); (2) to explore the characteristics of human travelling activities and changes in mobility behaviors at the daily temporal scale, hourly temporal scale, and spatial scale considering geographic hotspots and commuting; and (3) to assess the environmental and other possible factors that influence citizens’ mobility and suggest policy proposals. The study can reveal the routines, activities, and changing mobility behaviors of Tengzhou citizens and serve as a supplement for early spatial and temporal studies based on bike sharing. It also provides helpful guidance for future city planning in Tengzhou.
The paper is organized as follows. Section 2 presents a review of the relevant literature on bike sharing. Section 3 introduces the study area, data sources, data preprocessing, and modeling. Section 4 presents and analyzes patterns of e-bike usage, spatial and temporal travel characteristics of Tengzhou citizens, and their changes in mobility behaviors. Section 5 concludes the paper and makes plausible suggestions.

2. Literature Review

Understanding citizens’ mobility is important for developing knowledge on the structure of urban areas, the spatial distribution of hot areas, and the provision of transportation services [8]. For instance, Cools et al., 2010a, 2010b identified the weather conditions that had significant impacts on the daily traffic intensities of Belgian highways and also reported that weather can influence travel demand, traffic flow, and traffic safety [9,10]. In another research, Cools et al., 2013 assessed how weather forecasts trigger changes in Flemish activity-travel behavior and showed that the likelihood of changes in activity-travel behavior significantly depends on the weather forecasted [11]. Besides, Liu et al., 2016 hinged on travel data in Sweden and pointed out that people in central and southern Sweden tend to walk less in abnormal temperature conditions in summer, while people in northern Sweden tend to walk more in these situations [12]. Moreover, Luo et al., 2017 analyzed the taxi’s spatial–temporal distribution in Shanghai and reported that the highest activity moment of residents is 9–10:00 a.m., the second peak occurred in 7–8:00 p.m. by applying big data analysis on GPS data of taxies [13].
With the development of environmentally friendly shared transit, research that involved using GPS trajectories to identify transportation modes and analyze ranges and tracts of human activities and gatherings from bike share data has become a focus recently. Current studies of various spatial and temporal characteristics are based on bike share data from the Bike Sharing System (BSS). For example, based on the O–D pairs from the station-free BSS in Shenzhen in six days, Yang et al., 2017 cleansed the data, preserved trips exceeding 150 m, and examined cycling flows [14]. According to GPS data from the station-less BSS during 6:00–23:00 on 27 September 2017 in Shanghai, Sun et al., 2019 completed primary data cleansing and discovered that bike sharing is more intense at the urban center and less intense in the surroundings [15]. With GPS data from the station-less BSS recorded per 5 min for half the month of April, 2017, in Nanjing, Zhou et al., 2018 performed simple data cleansing and revealed that citizens in the major urban zone tend to ride less than 1500 m, while those in secondary centers tend to travel longer distances, ranging from 1500 m to 7000 m [16]. Wei et al., 2018 adopted 267 million pieces of GPS data from the station-less BSS on October 31, November 2, and November 12 in 2017 and researched the bike usage in Tianhe center, Guangzhou. Using coupling analysis, they concluded that, during weekdays, bike sharing was concentrated in transit hubs along the expressway and educational-and-research zones. On weekends, however, trajectories were spread along the periphery, particularly the business circle on Tianhe Road and Pearl River new town [17].
In accordance with O–D pair data in Nanjing from the Ofo company, a dockless bike-sharing operator, Liu et al., 2018 preprocessed the data to exclude redundant information and errors, and they put forward a method for reallocating dockless bikes according to the spatial distribution patterns [6]. Opting for the O–D data of bikes in station-based BSS from April 15 to May 27 in 2014 in Taipei, Cheng et al., 2014 deleted data with technical errors and discussed the spatial and temporal characteristics and influencing factors of bike station availability [18]. With respect to the GPS data from a station-based BSS in Vienna from 2008 to 2009, Vogel et al., 2011 removed the trajectory data of broken bikes, utilizing data cleansing and mining. They discovered unequal distribution in bike usage and put forward regulation advice for bike sharing systems [19]. Fernando Munoz-Mendez et al., 2018 used 1,459,945 ordered O–D pairs from the London station-based BSS from June to July in 2014 and showed that bike usage reflected rush hours. Compared to daytime trajectories, night trajectories were irregular and significantly decreased in number [20]. Employing O–D data pairs from station-based BSS during several months in 2013 and 2014 in Chicago, Zhou et al., 2015 identified and verified clusters where shared bikes are densely used [21]. Data from station-based BSS in eight cities in America are adopted by Kou et al., 2018 to identify the travel patterns, including the trip distance and distribution [22]. In accordance with the station-based BSS data from a New York shared bike station in September, Faghih-Imani et al., 2016 notes that there is no statistically important relationship between bike usage and temperature [23].
The existing spatial and temporal studies based on green transportation vehicles have various shortcomings. First, the studies adopt data that are concentrated on a time scale of less than one month (mainly several days), resulting in restrictions of time sensitivity and applicability. Second, the majority of studies on spatial and temporal characteristics (and data cleansing) are based on shared bikes instead of shared e-bikes, while e-bikes possess traits such as longer riding distance, faster speed, and destination orientation (directly targeting the ride destinations, such as work and entertainment districts, instead of transit stations). Third, past studies neglect small-scale areas, such as prefectures, as study areas and mostly focus on large-scale and metropolitan regions. Thus, this paper is conducted based on e-bike GPS data from May to July in 2018 in Tengzhou City and aims to shed light on the spatial and temporal characteristics of Tengzhou e-bike usage and human activities and gatherings.

3. Materials and Methods

3.1. Study Area and Data Source

Tengzhou City is a prefecture-level city located in southwestern Shandong Province in eastern China. The topography appears to be high in the northeast and low in the southwest. E-bikes are widely used, especially in the downtown areas of Tengzhou City [24].
This paper hinges on real-time extracted GPS trajectory points from May to July in 2018 in the central area of Tengzhou City, Shandong Province, as shown in Figure 1. After cleansing, there are 291,138 pieces of data, including e-bike ID numbers, geographic locations (latitude and longitude coordinates), and acquisition time (as shown in Figure 1). Each e-bike has installed an integrated module with GPS and communication, which sends GPS information to the specified internet address every minute. Based on the data acquisition interace of the HyperText Transfer Protocol (HTTP protocol) provided by the shared e-bike operator, GPS trajectory point data can be obtained from a specified internet address by a high frequency timer system developed by MATLAB software by MathWorks, Inc.

3.2. Data Processing and Cleansing

The raw GPS data used in this study is structured with the e-bike ID, the acquisition time, longitude, and latitude of GPS data, as indicated in Figure 2.
The data cleansing approach proposed by Li et al., 2019 is taken as a reference. Speed factors and traffic lights are accounted for when cleansing the disordered raw GPS points to acquire trajectory segments that contain only valid O–D pairs [24]. Python language is applied in this study to perform cleansing procedures and statistical analysis, and the process is as follows.
(1)
Determine data range: delete trajectory points that are located out of the e-bike service area.
(2)
Identify device abnormality: if the sample includes a greater-than-10-min time gap between two points, it is regarded as device abnormality. These two points are thus separated to be independent from each other and labeled as a destination and an origin point, respectively.
(3)
Cleanse special and invalid values: After calculating the average speed between adjacent points (Euclidean distance between points divided by time intervals), there are several possible scenarios that require sample cleansing.
a)
Cases of e-bike relocation using high-speed cars: for all continued interval(s) with speed > 35 km/h, abandon the interval(s) and redefine O–D pairs. Contrary to Li et al., 2019 research [24], to avoid the appearance of apparent O–D path discontinuity, this study set the filtering speed to 35 km/h instead of 20 km/h (government speed limit). This can also provide insight into some behaviors and phenomena that violate traffic rules.
b)
Cases of traffic light and unused bikes: for independent intervals with speeds < 4 km/h, if the time gap is less than 2 min, we suspect that users are waiting for traffic lights, with no alteration to the data sample. If the time gap is longer than 2 min, eliminate the sample interval (device abnormality). For continued intervals with speed < 4 km/h, delete all intervals (we speculate that bicycles are unused during this period).
c)
Cases of positioning floating: after steps a and b, cleanse all the O–D pairs that have a sample distance less than 50 m.

3.3. Methods and Models

To develop a comprehensive and deeper analysis of the use of shared e-bikes, the following methodology and models are adopted: (1) mean value and standard deviation; (2) Three Modes Gaussian Function; (3) kernel density; and (4) spillover commuting. The kernel density model is realized using ArcGIS software published by the Environmental Systems Research Institute (ESRI).
The spillover commuting model derives from the concept of the excess commuting model (the additional journey-to-work travel represented by the difference between the actual average commute and the shortest possible average commute, given the spatial configuration of workplace and residential sites [25]). Nevertheless, considering that excess commuting applies better to accurate sample survey data than to extensive trajectory big data without attributes such as job employment, this paper modifies the excess commuting model and advances the “spillover commuting model,” which integrates the characteristics of the e-bike trajectory data in Tengzhou City, to measure the optimization and efficiency of citizens’ commuting paths. Formulas for the spillover commuting model are as follows:
d m i n = j min ( X j ) Z
S = d a d m i n d a * 100 %
In the formula, S measures the percentage of actual commute that spills over the shortest possible commute; da gauges the average actual commuting distance (equal to the average length of all O–D paths); dmin symbolizes the average shortest commuting distance to each identified work district; min (Xj) is the path length from a work district j to its nearest residential district; Z represents the total quantity of work districts.

4. Results

This section mainly analyzes the spatial and temporal bike usage patterns of Tengzhou citizens, which can reflect citizens’ changes in mobility behaviors to some extent and their relationships with various influencing factors such as environmental factors.

4.1. Overall Travel Pattern

Figure 3 describes the overall characteristics of e-bike trip time, distance, and speed. In accordance with the pie chart, from May to July in 2018 in the central area of Tengzhou City, the citizens’ e-bike mobility patterns are as follows: 98% of the trip rides cover a distance between 0 km and 5 km; 75% were between 0 and 10 min; 95% had a speed ranging from 5 km/h to 20 km/h, and 3% displayed a speed exceeding the government speed limit of 20 km/h. The chart indicates that, for most people, trips that are less than 10 min or 5 km are acceptable. It should be noted that intervals with denser concentration employ the unit of 5, and less-dense intervals utilize the unit of 10.

4.2. Temporal Mobility Patterns

4.2.1. Monthly Mobility Characterization and Its Relationships between Influencing Factors

Table 1 illustrates the statistics of temperatures and air quality index (AQI) from May to July in Tengzhou City, and their relationships with bike usage across different months. As shown in this table, bike usage has an apparent positive correlation with temperature in May (a coefficient of 0.5633) and a notable negative correlation in July (a coefficient of −0.11422). In May (spring time), the temperature rises from cool to warm (with an average temperature of 21.7 °C), citizens may tend to spend time outside riding e-bikes for recreational, commuting, and dining purposes during warm and comfortable weathers, and, as a result, when the temperature gets higher, there are higher corresponding e-bike usage and mobility. Cools et al., 2010a revealed similar results that higher temperature increases traffic intensity (transportation usage) [9]. This finding is contrary to July, when temperature is already very high (with an average temperature of 28.2 °C). A hot summer may dissuade most citizens from staying outdoors and biking, leading to decreased citizens’ outdoor mobility.
In general, air quality index has a negative correlation with e-bike usage and citizens’ mobility, and reduced pollution may be the effect of employing e-bikes, an environmental-friendly transportation. Shen et al., 2018 also noted that the usage of railways and shared transit and the extent of air pollution have a negative correlation [26]. In consideration of specific monthly relationships, air quality is positively correlated with e-bike usage (and citizens’ mobility) when air is lightly polluted in May and June (coefficients of 0.7183 and 0.2579), and is negatively correlated with e-bike usage (and citizens’ mobility) when air quality reaches approximately excellent in July (a coefficient of −0.2648). In these cases, air quality may be the cause of changes in e-bike usage and mobility. As people manifest less sensitivity towards a light level of pollution, their mobility is not largely influenced by the changing air quality and is, rather, influenced by other possible factors. In contrast, during July, the air pollution is markedly low, raising citizens’ sensitivity towards air condition; significantly lowered air quality index thus prompts high e-bike usage and more outdoor activities.

4.2.2. Daily Mobility Characterization

Figure 4 displays the daily temporal characteristics of average shared e-bike usage from May to July in 2018 in the central area of Tengzhou City. The mobility of citizens who travel on e-bikes is related to daily behaviors throughout different days of a week. The graph shows that e-bike usage reaches a peak on Friday (approximately 6749 trips per day) and a trough on Tuesday (approximately 4480 trips per day). The finding may show that citizens are busy traveling to workplaces and schools (mainly concentrating on labor and working behaviors) on most weekdays and their mobility are more likely reflected in usage of relatively faster vehicles, including buses, subways, or cars. In contrast, Friday (especially after the evening rush hour) approaches the weekend, when citizens tend to take a break with plenty of time (mostly manifesting resting and recreational behaviors), and greener and cheaper transit vehicles, such as e-bikes, are instead adopted for citizens’ mobility, resulting in a marked increase of e-bike usage.

4.2.3. Temporal Characterization in Special Weather

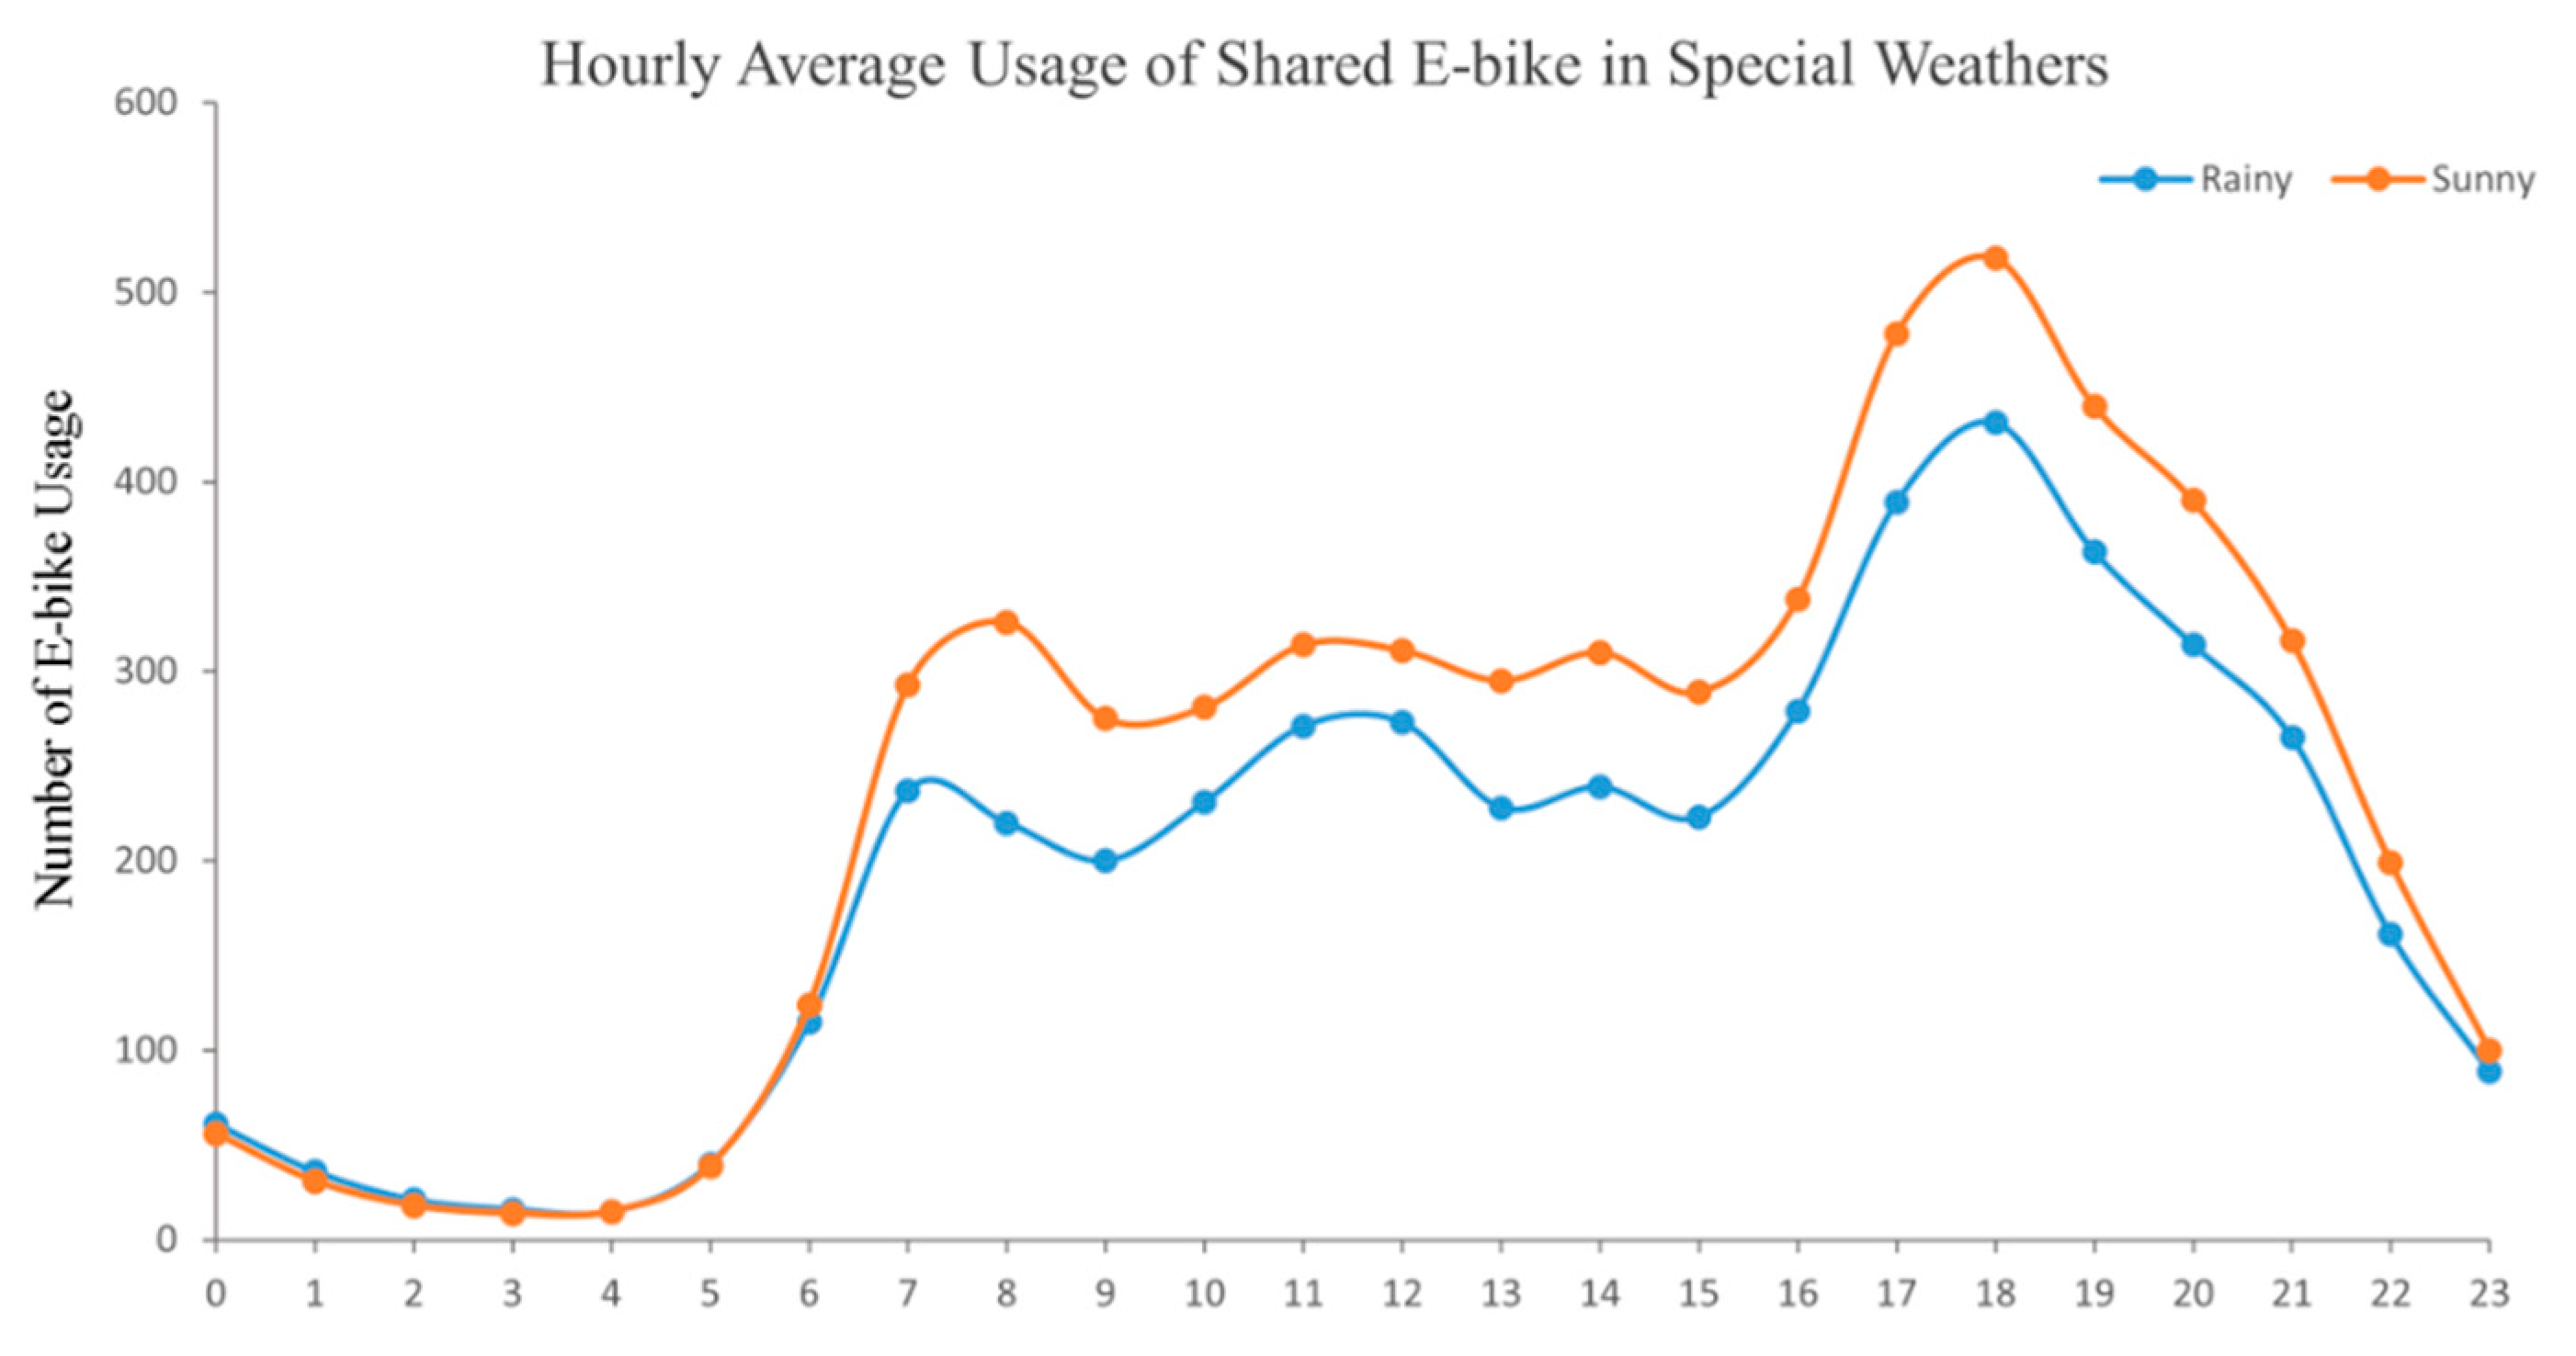
Figure 5 demonstrates the average shared e-bike usage patterns in special weather from May to July in 2018 in Tengzhou City. There are 30 rainy days, based on the weather report from the official website. From the graph, e-bike usage is apparently more frequent on sunny days than rainy days: the difference maximizes at 18:00 (518 trips per hour, a higher mobility, in sunny weather and 287 trips per hour, a lower mobility, on rainy days) and minimizes at 3:00 and 4:00 (sunny weather has only 4 more trips per hour). Influenced by different weather, the changes of citizens’ mobility are reflected in the usage of e-bikes. Inconvenience (forcing to decelerate for the sake of rainy weather) and safety concerns (wet and slippery e-bike lane) dissuades people from employing e-bikes during daytime, and thus decreases their hourly mobility. This discovery is supported by Corcoran et al., 2014, who claimed that precipitation led to a reduction in the usage of environmentally friendly shared transits [27]. In contrast, during nighttime, sleeping behavior is not influenced by weather conditions, and the discrepancy between e-bike usage is low at 3:00 and 4:00, suggesting low citizens’ mobility regardless of sunny or rainy weather.

4.2.4. Hourly Temporal Characterization

Figure 6 illustrates the hourly average e-bike usage pattern from May to July in 2018 in the central area of Tengzhou City. The graph implies that the overall e-bike usage is greater during the daytime than during the nighttime, peaking at 18:00 (approximately 486 rides per hour, an indication of high mobility) and reaching a trough at 2:00 (only approximately 19 trips per hour, suggesting a low mobility); 7:00 and 11:00 are other local maxima, and 9:00 and 14:00 are other local minima. This pattern suggests that, firstly, the morning and evening rush hours in the central area of Tengzhou City are 7:00 and 18:00, when people are highly mobile to commute; trips during rush hours concentrate mainly on home-to-work journeys. Xie et al., 2018 noted a similar result that the morning and evening rush hours based on bike share data are 7:00 and 17:00 [28]. Second, at 11:00–12:00, e-bike usage and mobility is relatively higher because citizens change their focus on work-to-dining journeys (dining behaviors). Bao et al., 2017 also stated that people prefer riding green shared vehicles to restaurants at lunchtime on weekdays [29]. Third, 9:00 and 14:00 are times when people continue working inside plazas and buildings; the reduction of outdoor activities and indoor working behaviors cause a decrease in e-bike usage and citizens’ mobility.
To effectively address problems pertinent to e-bike relocation and to meet fluctuated demand and changing mobility of citizens [30], this paper utilizes the three-mode Gaussian Function to achieve curve fitting for hourly (small time unit) average e-bike usage based on the three-peak characteristics of the average hourly e-bike usage pattern. Seventy percent of the overall data are adopted as training data to derive the three-mode Gaussian Function, and the remaining 30% are used as testing data. As shown in Figure 7, the demand curve for e-bikes in the central area of Tengzhou City at different hours can be expressed by the equation F ( x ) = 502 * e ( ( ( x 18.5 ) / 3.584 ) 2 ) + 332.3 * e ( ( ( x 10.99 ) / 4.119 ) 2 ) + 228.8 * e ( ( ( x 7.234 ) / 1.153 ) ) 2 ) , and the R-square value is 0.9782. The average absolute difference between the fitted value from training data and the actual usage value is 5.814, and average relative change rate (the average absolute difference between fitted value and actual value divide by actual value) is 0.08. The average absolute difference between fitted value from training data and value of testing data is 9.542, and average relative change rate (the average absolute difference between fitted value from training data and value of testing data divided by the value of testing data) is 0.11. These indicate that fitted and actual values have high fitting precision. Based on the regression function, calculations over reallocation at different times of the day in geographic hotspots can be made: for example, 149 e-bikes are demanded at 6:00 and 469 e-bikes at 17:00.
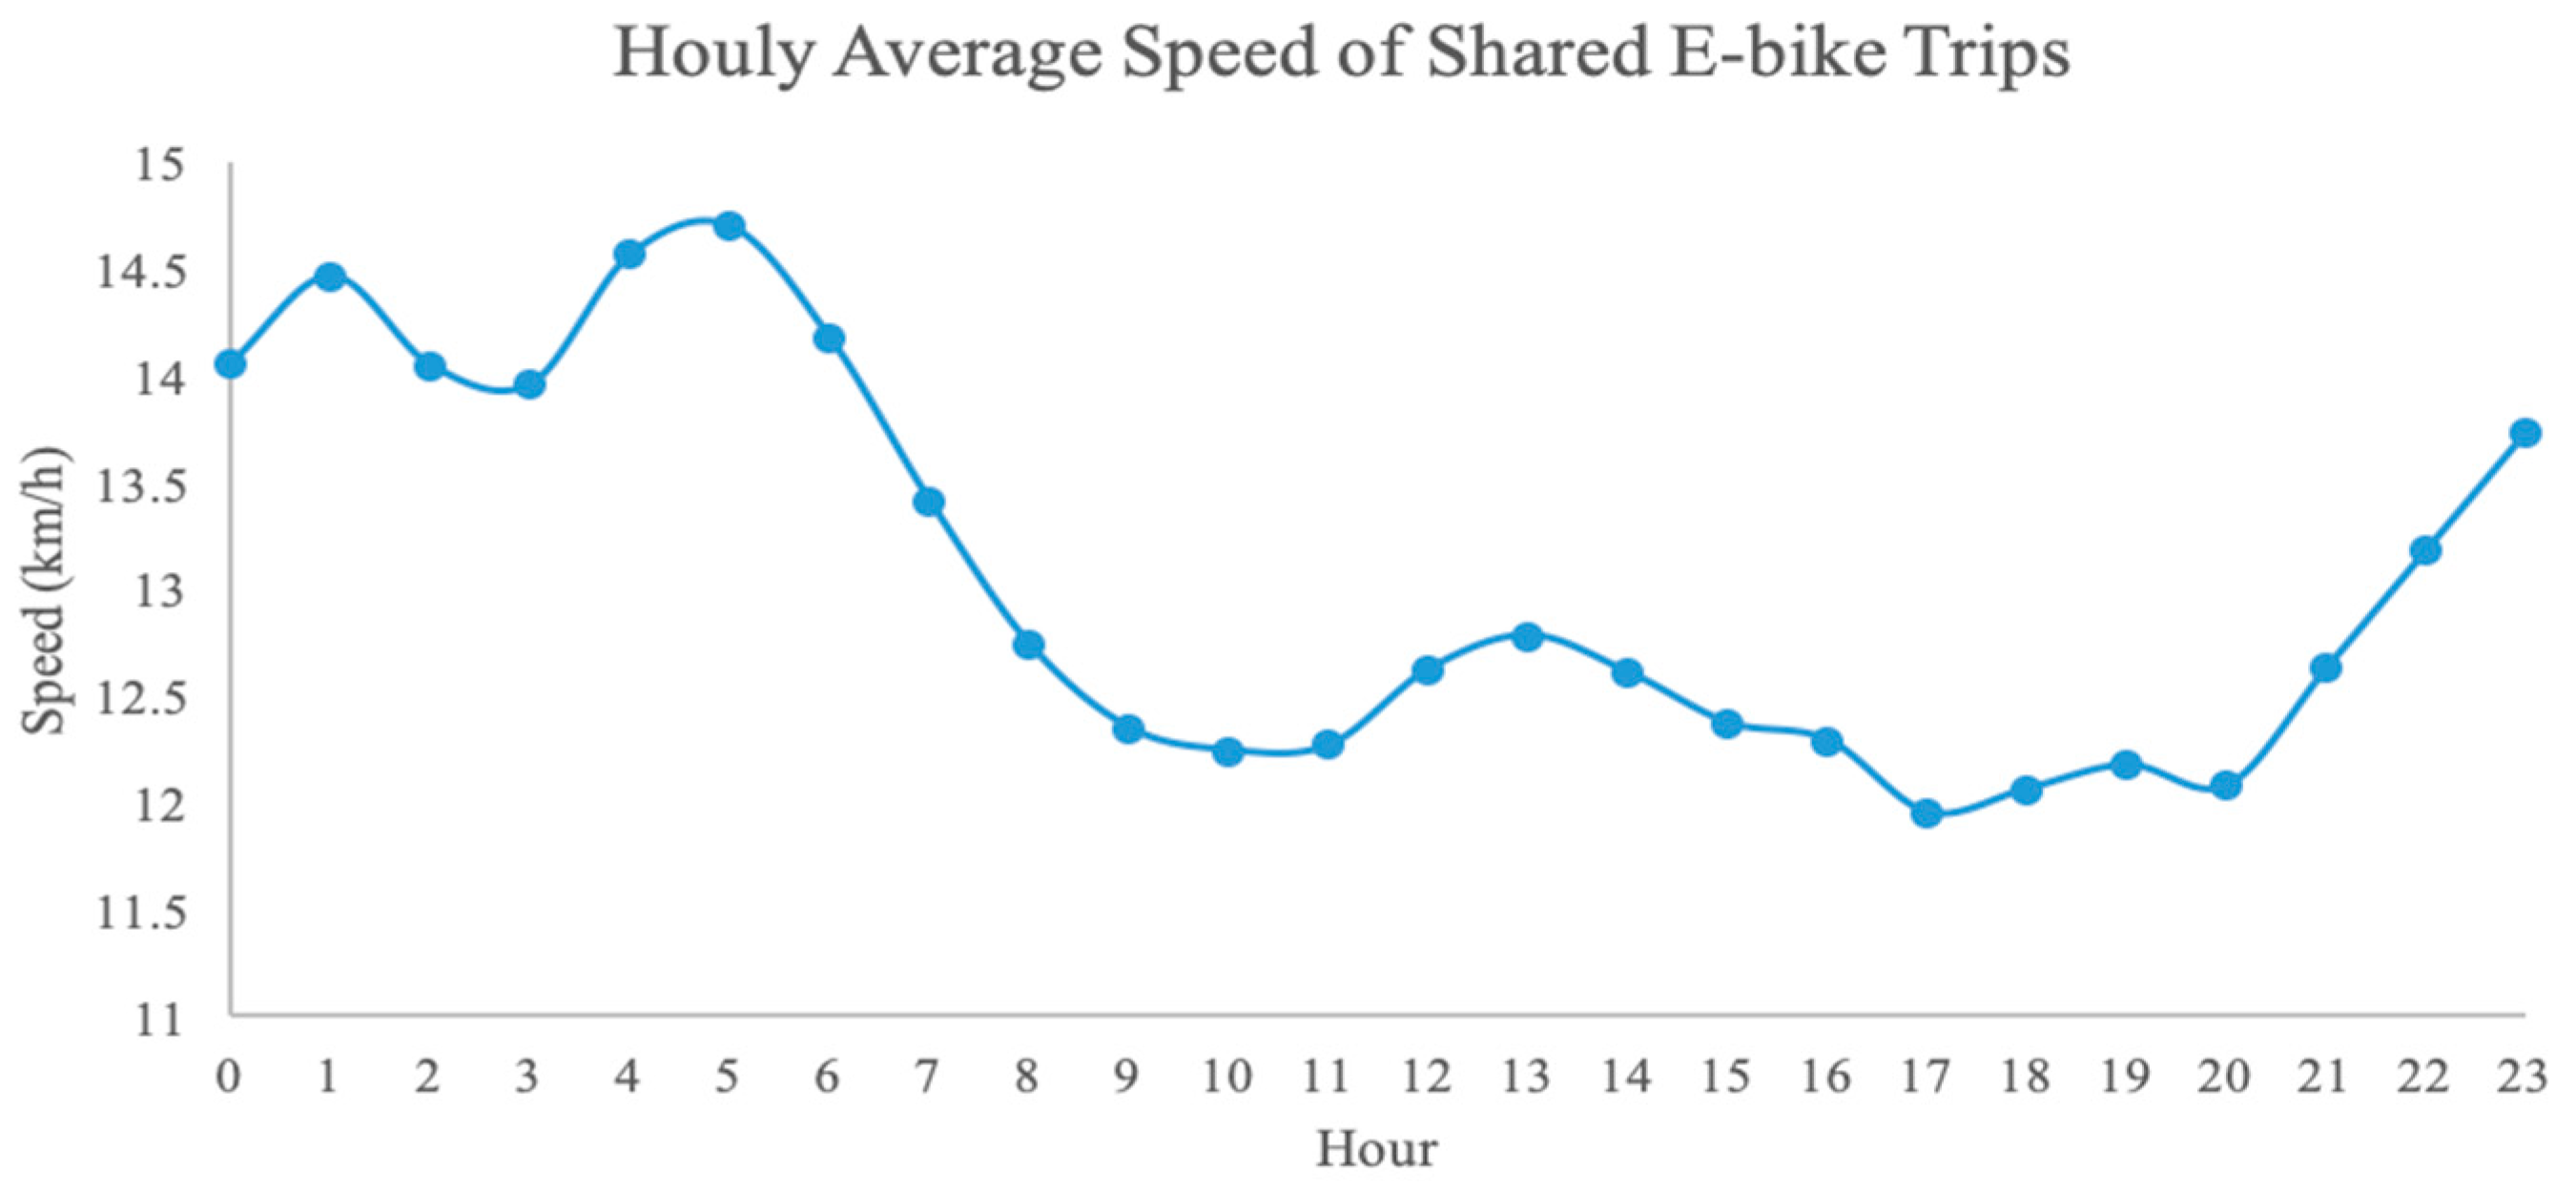
Figure 8 indicates the hourly average speed of e-bike trips: travel speed reaches a global maximum at 5:00 (approximately 15 km/h) and is lower at the morning and evening rush hours, approximately 8:00 and 17:00, (around 12 km/h). Encountering traffic congestion during rush hours, citizens must reduce their speeds instead of flowing smoothly, and thus travel and move with low efficiency. While Jensen et al., (2010) show that when time presses in the morning rush, people tend to bike faster [30], this paper does not find compatible results for e-bike usage given the different research subjects. Additionally, the trip speed is lower at 11:00, as indicated in the graph, possibly due to the fact that people are out dining during lunch time, and the traffic is relatively heavy. Seldom do the citizens travel between 23:00 and 0:00 (owing to their sleeping behaviors), resulting in smooth flow of e-bikes and higher travel speed.

4.3. Spatial Travel Patterns

4.3.1. Travel Characterization Based on Kernel Density Analysis

This study calculates the kernel density of O–D points and trajectory paths during the morning and evening rush hours in the central area of Tengzhou City and then identifies geographic hotspots. Figure 9a,b describes the kernel density of O–D points in the morning rush hour (7:00 and 8:00); Figure 10a,b shows the kernel density of O–D points in the evening rush hour (17:00 and 18:00); and Figure 11a,b demonstrates the kernel density of trajectory paths in the morning and evening rush hours.
In accordance with Figure 9a,b, D-points in the morning rush hour concentrate in the mid-north (bus terminal and city hall) and middle (plazas, business buildings, railway station) parts of the central area of Tengzhou City. Similar to the results in Figure 11a, path density is higher in the middle of the central area and lower in the outer periphery. In addition, paths have a diffusing pattern, which indicates that the central area of Tengzhou City may present the spatial arrangement of residential districts surrounding work and business districts (with major plazas located in the center). Compared with the actual map (Google Maps by Google), it is noteworthy that the outer periphery of the central area of Tengzhou is characterized by small rural villages. Together with Figure 11a, it can be inferred that e-bike usage and citizens’ mobility regarding e-bikes are less common in rural regions. Oates et al., 2017 finding is not supported in this paper: they maintain that the village disadvantage is positively correlated with shared bike usage [31]. The difference in results may be attributed to the discrepancy in research subjects: rural citizens are less likely to take the initiative to take electric transportation vehicles for trips and other daily behaviors.
In line with Figure 10a,b, the kernel density of O-points and D-points during the evening rush hour varies little, signaling that e-bike rides cover short distances, and human behaviors are concentrated in the vicinity. Figure 11b also conveys that the trajectory paths are radiated, with e-bike users traveling to diverse destinations across vast areas. In addition to returning home, citizens may ride shared e-bikes to other places. In the graph, trips (citizens’ mobility) are mainly directed towards the north (north and northwest), the middle, and the east, further proving that geographic hotspots of Tengzhou City are congregated in the northern region and the city center (downtown).

4.3.2. Identification of Geographic Hotspots

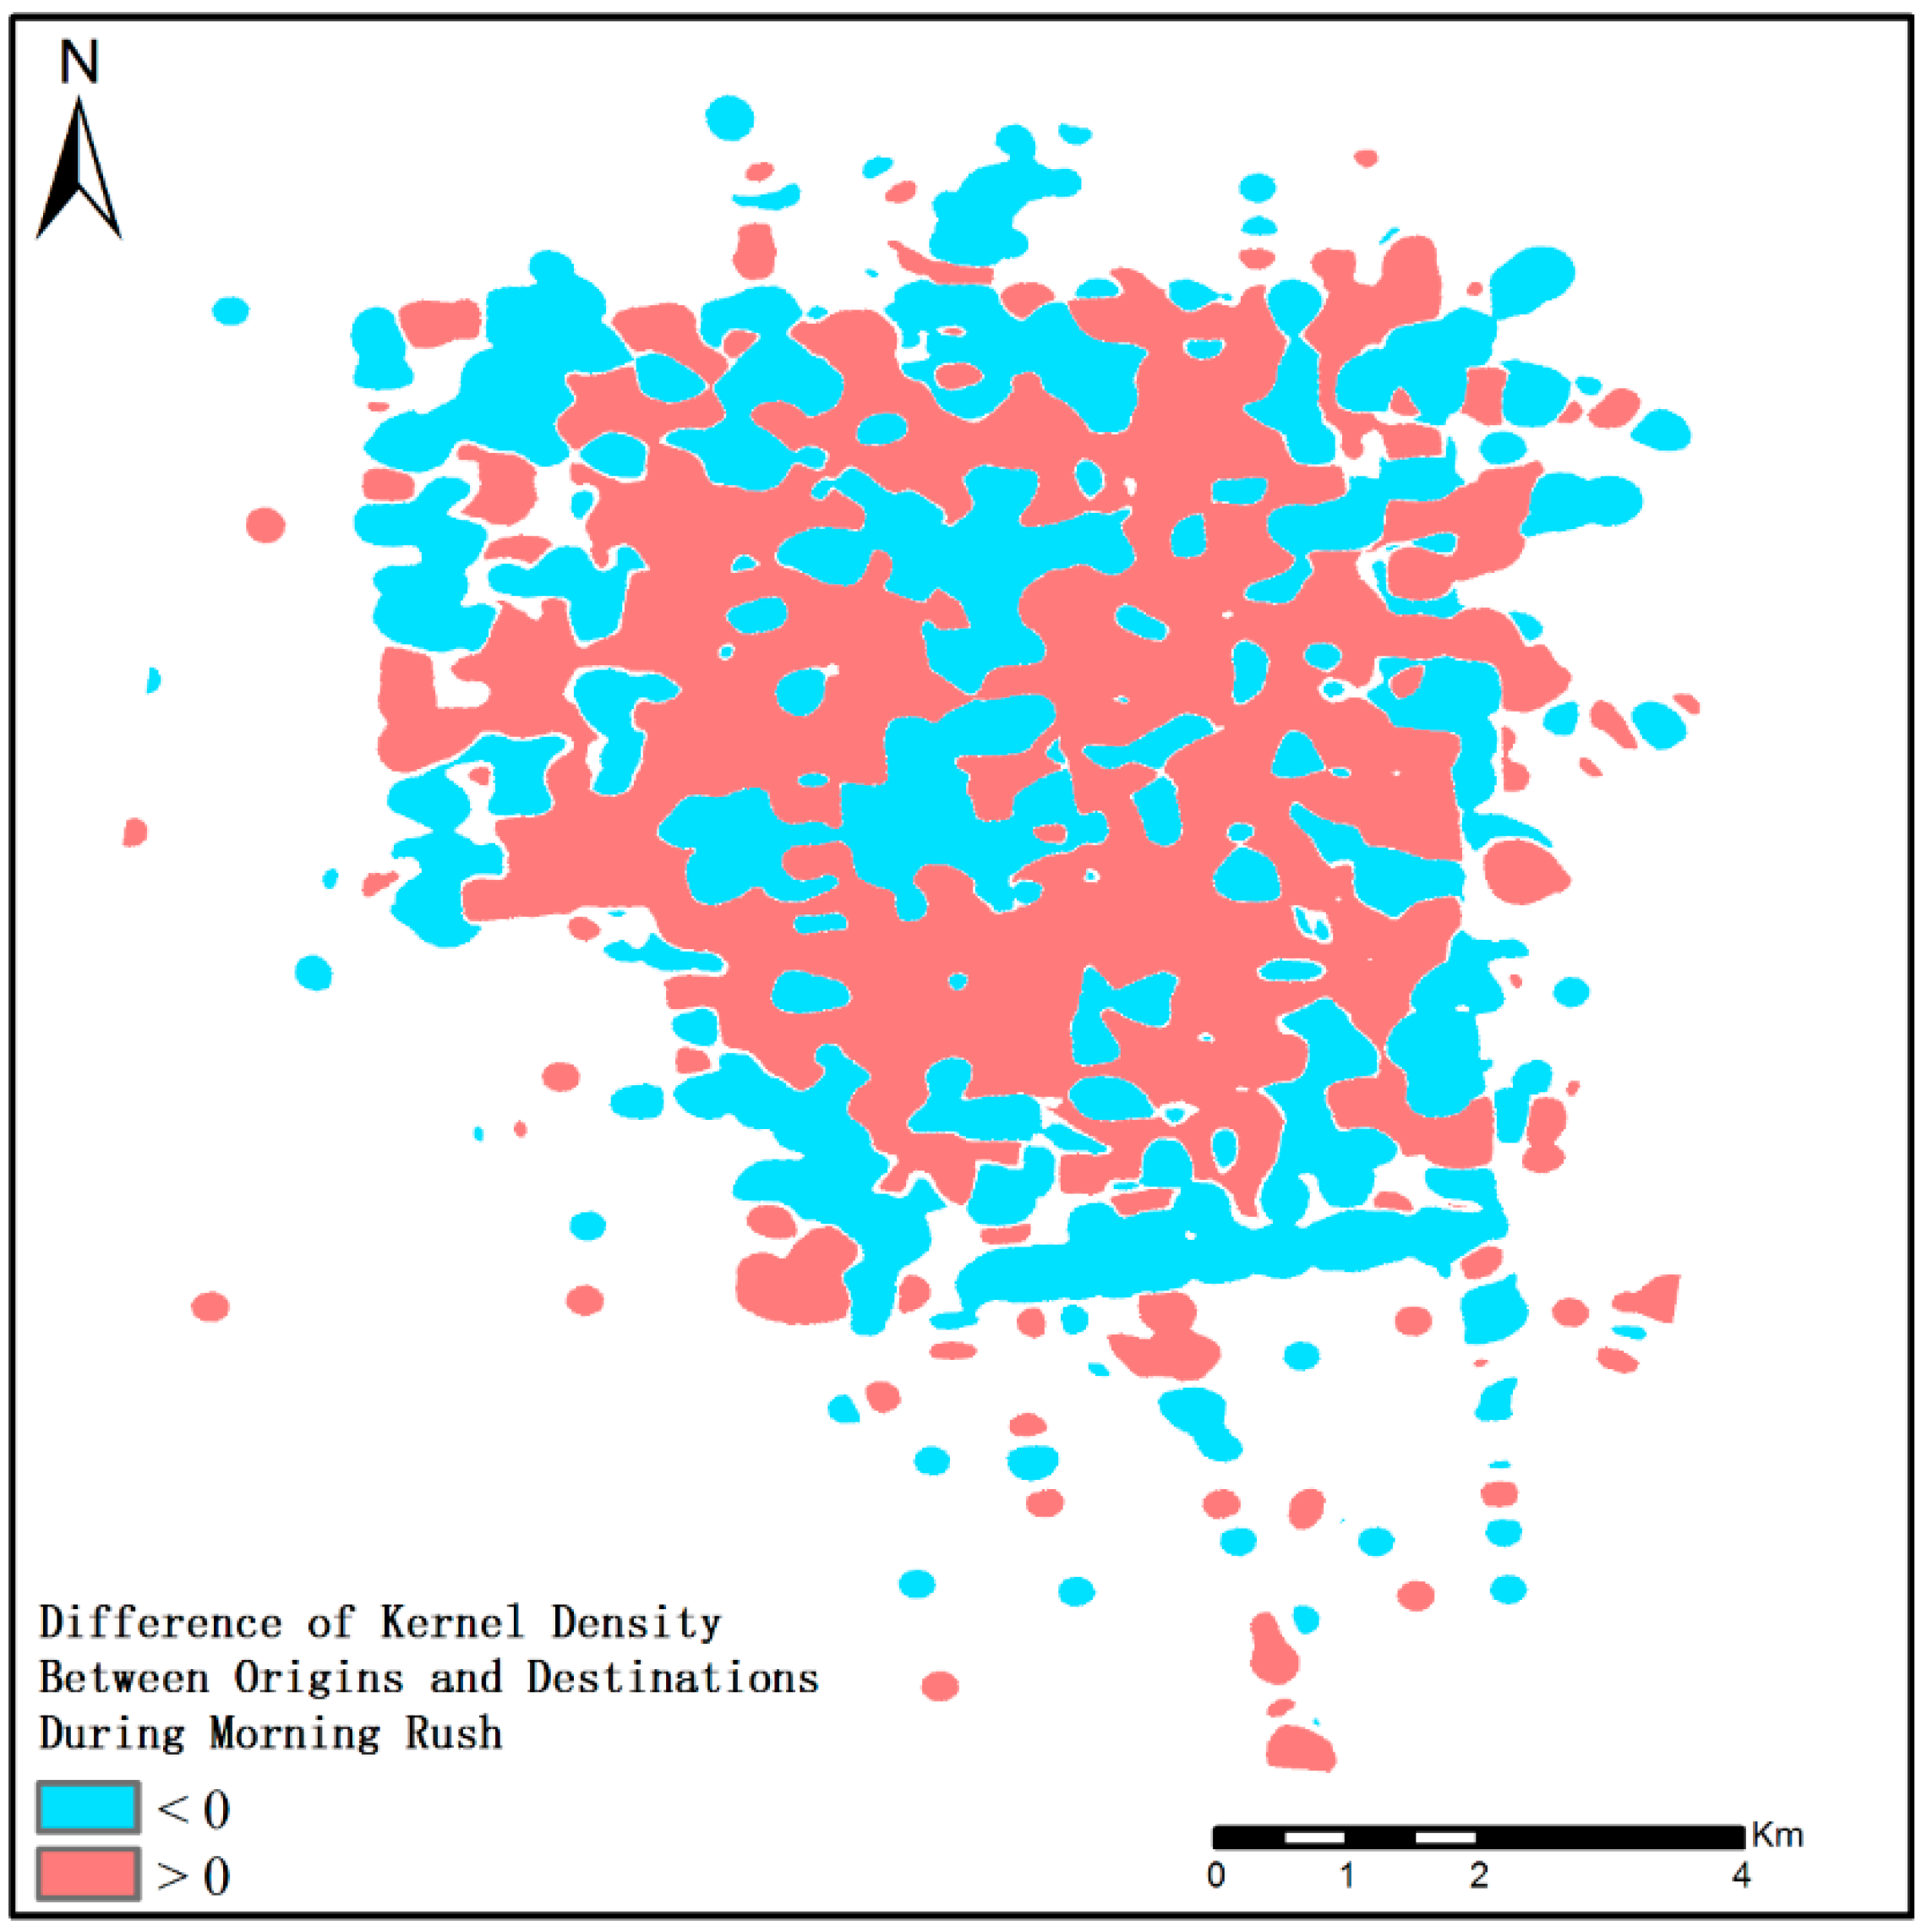
The partition and identification of geographic hotspots is based on the commuting patterns of the destination-oriented (work-zone oriented in the morning rush) e-bike trips. As shown in Figure 12, this paper conducted a subtraction with the kernel density of O-points and D-points in the morning rush. A positive value indicates a possible residential district (more shared e-bike outflows), and a negative value indicates a potential work district (more shared e-bike inflows). A rough partition is drawn based on the difference in kernel density, and, after being matched with the actual map (Google Maps), artificial identified hot districts are verified; finer revisions to the outlines are made. Subsequently, 5 residential districts and 6 work districts are derived, as depicted in Figure 13a. For work districts, zone A includes bus terminals; zone B includes the Tengzhou city hall and planning bureau; zone C includes the Bureau of Radio and Broadcasting, digital square, and banks; zone D includes Tengzhou railway station, plazas, banks, and restaurants; zone E includes international plazas, malls, banks, and memorial museums; and zone F includes restaurants. For residential districts, every zone includes at least three residential communities.
Figure 13b reflects the e-bike densities in each hot zone during the morning rush hour. The city center (downtown) has a higher e-bike density (one e-bike in every 62 m2), as does the mid-north region; the outer periphery, on the other hand, has lower density (one e-bike in every 664 m2). The statistics further corroborate a similar speculation that Tengzhou citizens concentrate their daily activities and mobility in the middle region.

4.3.3. Spillover Commuting

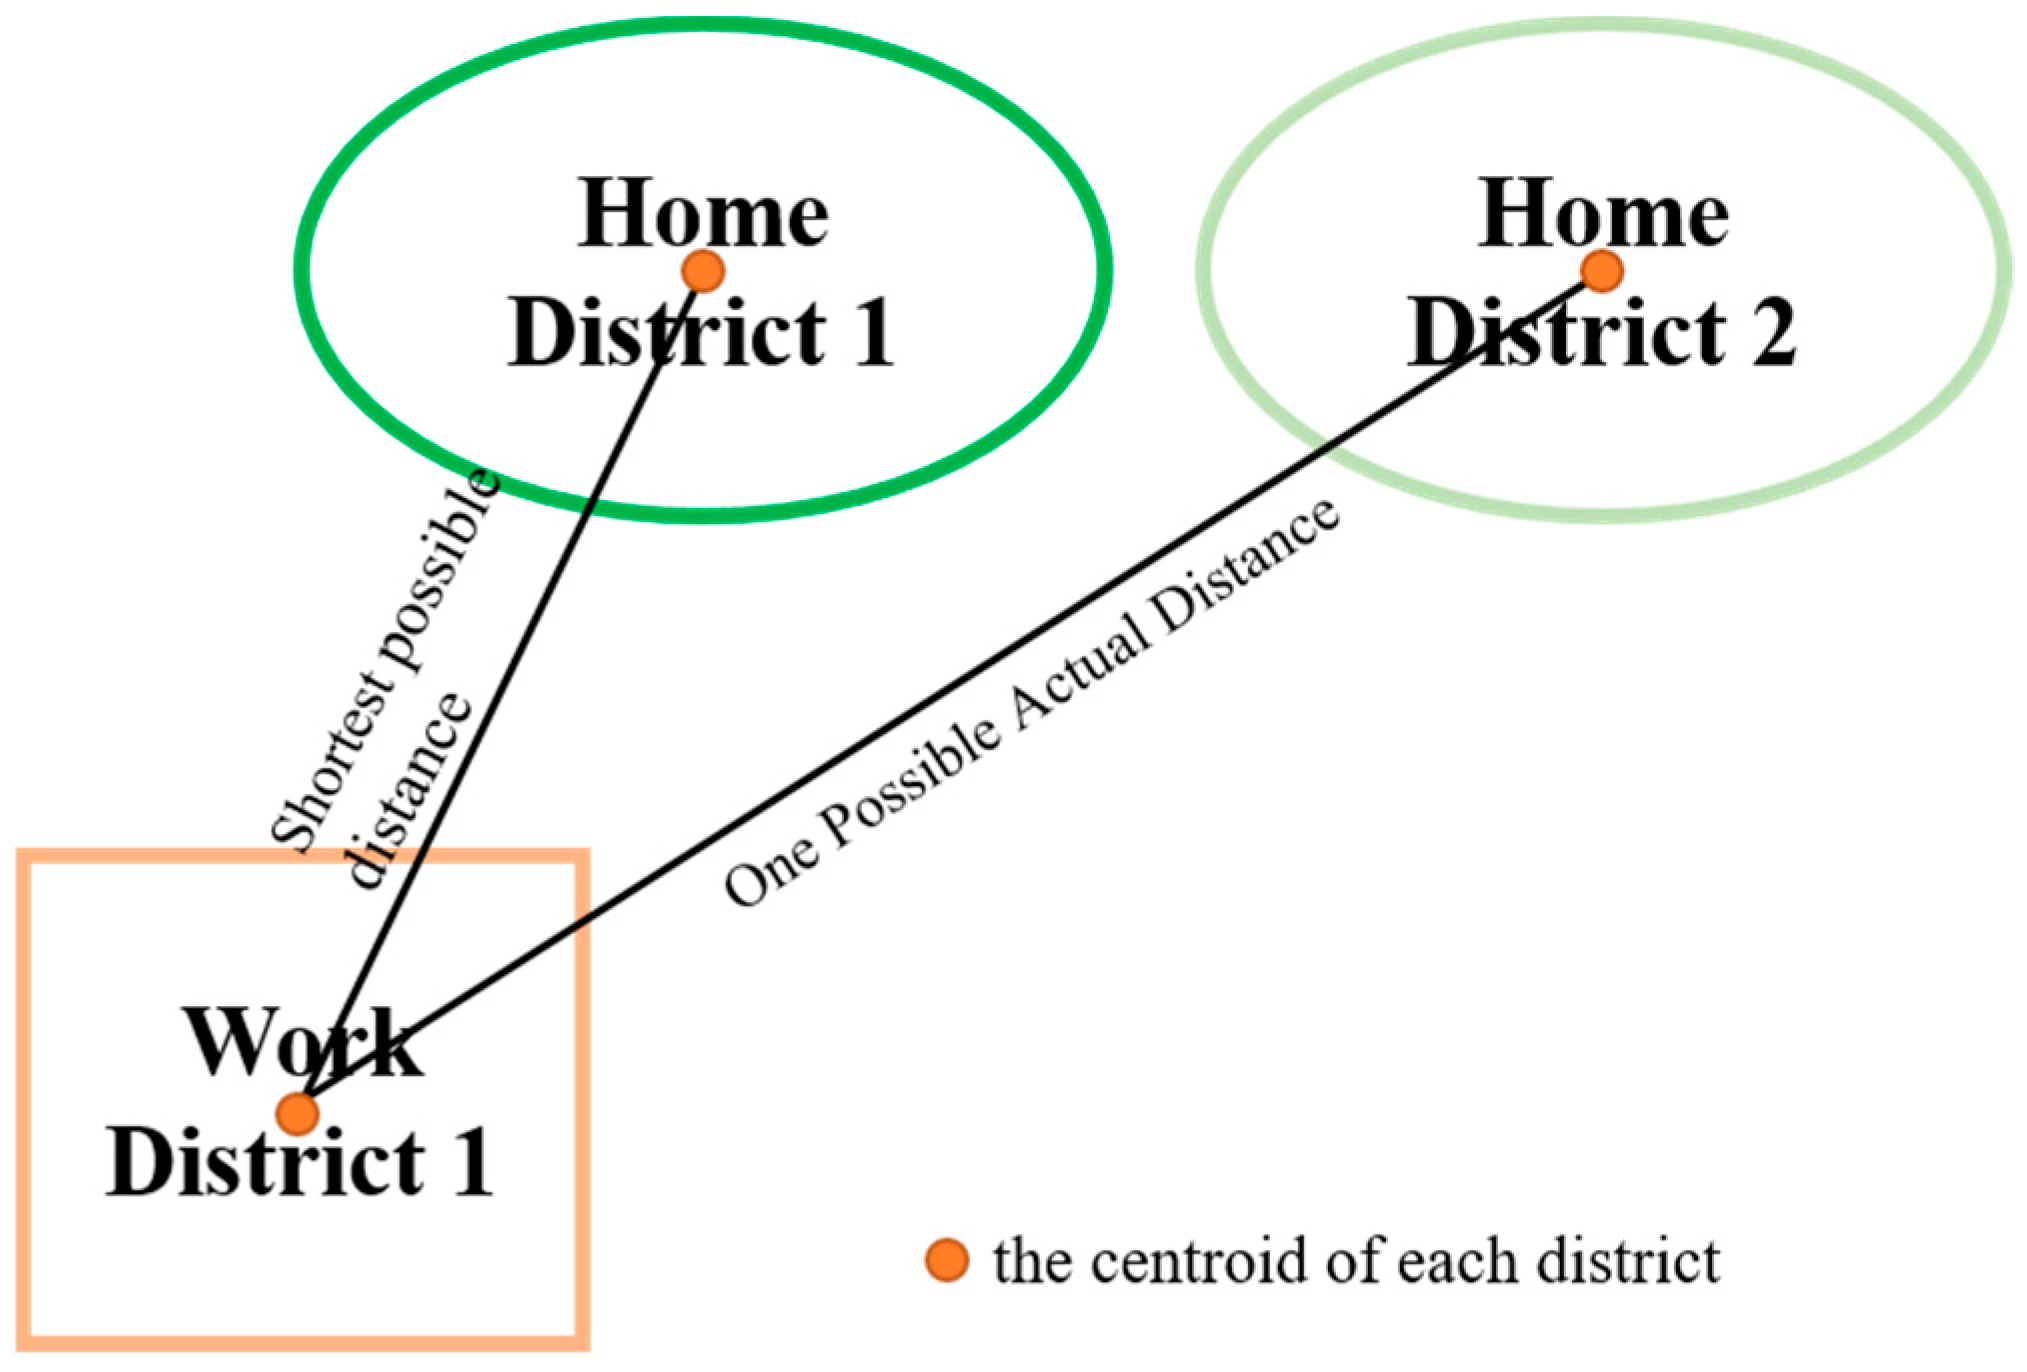
Spillover commuting is calculated primarily based on the illustration in Figure 14. As indicated in the diagram, supposing that there is only one work district and two home districts in the study area, then spillover commuting = (average actual distance minus shortest possible distance) / shortest possible distance.
The shortest possible average commute is approximately 1.437 km, while the actual average commute in the central area of Tengzhou City is approximately 1.586 km, thus obtaining a 9.4% spillover commuting rate (the distances between jobs and residential locations are greater when S approaches 100% and smaller when S approaches 0%). According to the S value, work zones and residential districts are aligned closer together in the central area of Tengzhou City, and citizens’ commuting and mobility to work and business are relatively convenient (98% of the total trips cover less than 5 km). Proposing different results, Liu et al., 2008 and Zhou et al., 2014 studied large metropolitans and found that over 40% of the total commuting is excess commuting (low commuting efficiency) in hotspot provinces and cities, such as Beijing and Guangzhou [1,32]. This paper suggests that, as small-scale regions are being developed into hotspots, commuting efficiency may be sacrificed, causing further separation between work zones and homes.

5. Conclusions and Suggestions

This paper studied e-bike usage patterns and citizens’ spatial and temporal mobility characteristics, based on real-time-extracted e-bike data from station-less BSS with geographic coordinate system information from May to July 2018 in the central area of Tengzhou City, Shandong Province, China. The main conclusions are as follows.
(1) Overall, shared e-bike trips and citizens’ mobility patterns are within 5 km and 10 min, with a speed ranging from 5 km/h to 20 km/h. Accordingly, the spatial arrangement of large business and work districts can maintain 5 km- or 15-min rides from residential districts. In addition, the data show that there are still users exceeding the government speed limit of 20 km/h. To address safety concerns and maintain traffic order, the government needs to reinforce speeding penalties.
(2) Temporally: First, the daily shared e-bike usage and travelling behaviors display a trough on Tuesday and a peak on Friday, positively correlated with temperature in May and negatively correlated with temperature in July, and negatively correlated with the severity of air quality. To address air pollution, the government can advocate shared e-bike usage for commuting and transportation. Second, shared-bike usage is observed to be significantly reduced in number in rainy weather than on sunny days, indicating less travel behaviors, because of the potential safety hazard and traveling inconvenience; thus, speed limits for rainy and sunny weather need to be clearly and reasonably distinguished. Third, the hourly e-bike usage and citizens’ mobility are greater during the daytime than during the nighttime; local minima are at 2:00, 9:00, 14:00, and local maxima are at 7:00, 12:00, 18:00. Therefore, to avoid supply shortages that impede citizens’ travel, e-bikes can be relocated from 9:00 to 10:00, from 13:00 to 15:00, or at and after midnight when people display resting, sleeping, or indoor behaviors; the above-proposed three-mode Gaussian Function can further assist e-bike reallocation with quantified data support so that the changing demands in regard to changing mobility at different times of the day can be met. Moreover, hourly riding speed peaks at 5:00 (high travel efficiency) and is lower at 8:00 and 17:00 (low efficiency).
(3) Spatially: First, D-points (human gatherings) concentrate mainly in the mid-north and middle parts of the central area of Tengzhou City during the morning rush hour, and the trajectory paths (trips) diffuse from the center. During the evening rush hour, the trajectory paths radiate towards the mid-north, the middle, and the east, with shorter distances and more various traveling purposes such as recreational purpose. On account of the northward mobility patterns, this paper suggests that new residential districts can be built adjoining mid-north work zones, such as the city hall and the bus terminal. Second, e-bikes have a higher density in the middle and mid-north parts (areas with frequent human gatherings and activities) and are sparser in the outer periphery, rendering the city center an ideal place for the reallocation of shared e-bikes for the sake of its higher demands for travelling tools. Third, 9.4% of the total commuting is spillover commuting, and compared to metropolises, Tengzhou City, as a prefecture-level city, has an indistinctive separation between work and residential areas. In future city development and planning, the nonmetropolitan commuting advantage [33] and work-residential balance can be preserved to ensure the convenience of citizens’ travel.
This paper contributes to the understanding of the spatial and temporal mobility characteristics and shared e-bike usage of citizens in the central area of Tengzhou City, and the findings build on the results of early spatial and temporal bike-sharing studies. However, this study has limitations. The partition and identification of geographic hotspots are simple, and future studies can adopt more complex methods. The reallocation function does not include complex machine-learning techniques, which can be incorporated into future work, that considers factors such as weather conditions [34,35]. In addition, since the calculation in the data-processing section is based on simple Euclidean distance, future studies can be based on more precise methods like great circle distance. Moreover, more data can be added to develop quantified assessments of the influencing factors, such as human activities and housing types, to further enhance the accuracy of the results.

Author Contributions

Conceptualization, Y.L.; methodology, Y.L. and Z.D.; data cleansing, Y.L. and L.Z.; validation, Y.L. and Z.D.; formal analysis, Y.L.; writing—original draft preparation, Y.L.; writing—review and editing, Y.L., Z.D., and X.L.; visualization, Y.L.

Funding

This research was funded by the National Key Research and Development Program of China (2018YFB2100700) and the Basic Foundation of Chinese Academy of Surveying and Mapping (AR1916).

Conflicts of Interest

The authors declared no conflicts of interest.

References

  1. Bullock, C.; Brereton, F.; Bailey, S. The economic contribution of public bike-share to the sustainability and efficient functioning of cities. Sustain. Cities Soc. 2017, 28, 76–87. [Google Scholar] [CrossRef]
  2. Yao, H.; Tang, X.; Wei, H.; Zheng, G.; Yu, Y.; Li, Z. Modeling Spatial and Temporal Dynamics for Traffic Prediction. arXiv 2018, arXiv:1803.01254. [Google Scholar]
  3. Kabra, A.; Belavina, E.; Girotra, K. Bike-Share Systems: Accessibility and Availability. In Chicago Booth Research Paper; The University of Chicago Booth School of Business: Chicago, IL, USA, 2018. [Google Scholar] [Green Version]
  4. Lohry, G.F.; Yiu, A. Bikeshare in China as a public service: Comparing government-run and public-private partnership operation models. Nat. Resour. Forum 2015, 39, 41–52. [Google Scholar] [CrossRef]
  5. Du, M.Y.; Cheng, L. Better Understanding the Characteristics and Influential Factors of Different Travel Patterns in Free-Floating Bike Sharing: Evidence from Nanjing, China. Sustainability 2018, 10, 1244. [Google Scholar] [CrossRef]
  6. Liu, M.; Xu, X.F. Dockless Bike-sharing Reallocation based on Data Analysis: Solving Complex Problem with Simple Method. In Proceedings of the 2018 IEEE Third International Conference on Data Science in Cyberspace (DSC), Guangzhou, China, 18–21 June 2018. [Google Scholar]
  7. Zhao, Y.; Dai, L.; Peng, L.; Song, Y.; Zhou, Z. Analysis of Spatial distribution of China’s station-free bike-sharing by Clustering Algorithms. In Proceedings of the 2019 4th International Conference on Mathematics and Artificial Intelligence, Chengdu, China, 12–15 April 2019; pp. 15–19. [Google Scholar]
  8. Siła-Nowicka, K.; Vandrol, J.; Oshan, T.; Long, J.A.; Demšar, U.; Fotheringham, A.S. Analysis of human mobility patterns from GPS trajectories and contextual information. Int. J. Geogr. Inf. Sci. 2015, 30, 881–906. [Google Scholar] [CrossRef] [Green Version]
  9. Cools, M.; Moons, E.; Wets, G. Assessing the impact of weather on traffic intensity. Weather Clim. Soc. 2010, 2, 60–68. [Google Scholar] [CrossRef]
  10. Cools, M.; Moons, E.; Creemers, L.; Wets, G. Changes in travel behavior in response to weather conditions: Do type of weather and trip purpose matter? Transp. Res. Rec. 2010, 2157, 22–28. [Google Scholar] [CrossRef]
  11. Cools, M.; Creemers, L. The dual role of weather forecasts on changes in activity-travel behavior. J. Transp. Geogr. 2013, 28, 167–175. [Google Scholar] [CrossRef] [Green Version]
  12. Liu, C. Understanding the Impacts of Weather and Climate Change on Travel Behaviour. Ph.D. Thesis, KTH Royal Institute of Technology, Stockholm, Sweden, 2016. [Google Scholar]
  13. Luo, X.; Dong, L.; Dou, Y.; Zhang, N.; Ren, J.; Li, Y.; Sun, L.; Yao, S. Analysis on spatial-temporal features of taxis’ emissions from big data informed travel patterns: A case of Shanghai, China. J. Clean. Prod. 2017, 142, 926–935. [Google Scholar] [CrossRef]
  14. Yang, Y.; Comber, A.; Heppenstall, A.; Turner, A. Exploring Spatiotemporal Features of Station-Free Bike Sharing Trips: Case Study of Shenzhen. In Proceedings of the GeoComputation ’17, Leeds, UK, 3–7 September 2017. [Google Scholar]
  15. Sun, D.H.; Wang, B. Research on the Characteristics of Bike Sharing Based on Geographic Information Data. Softw. Guide 2019, 18, 138–142. [Google Scholar]
  16. Hao, J.; Zhu, J.; Zhong, R. On Space-Time Characteristics of Shared Bikes in Nanjing Based on Big Data. J. Southwest China Norm. Univ. (Nat. Sci. Ed.) 2018, 43, 66–73. [Google Scholar]
  17. Wei, Z.; Mo, H.; Liu, Y. Spatiotemporal characteristics of bike-sharing: An empirical study of Tianhe District, Guangzhou. Sci. Guid. 2018, 30, 71–80. [Google Scholar]
  18. Wong, J.T.; Cheng, C.Y. Exploring Activity Patterns of The Taipei Public Bikesharing System. J. East. Asia Soc. Transp. Stud. 2015, 11, 1012–1028. [Google Scholar]
  19. Vogel, P.; Greiser, T.; Mattfeld, D.C. Understanding Bike-Sharing Systems using Data Mining: Exploring Activity Patterns. Procedia Soc. Behav. Sci. 2011, 20, 514–523. [Google Scholar] [CrossRef] [Green Version]
  20. Munoz-Mendez, F.; Klemmer, K.; Han, K. Community Structures, Interactions and Dynamics in London’s Bicycle Sharing Network. arXiv 2018, arXiv:1804.05584. [Google Scholar]
  21. Zhou, X.L. Understanding Spatiotemporal Patterns of Biking Behavior by Analyzing Massive Bike Sharing Data in Chicago. PLoS ONE 2015, 10, 1371. [Google Scholar] [CrossRef] [PubMed]
  22. Kou, Z.; Cai, H. Understanding bike sharing travel patterns: An analysis of trip data from eight cities. Phys. A Stat. Mech. Appl. 2019, 515, 785–797. [Google Scholar] [CrossRef]
  23. Faghih-Imani, A.; Eluru, N. Incorporating the impact of spatio-temporal interactions on bicycle sharing system demand: A case study of New York CitiBike system. J. Transp. Geogr. 2016, 54, 218–227. [Google Scholar] [CrossRef]
  24. Li, C.; Dai, Z.; Peng, W.; Shen, J. Green Travel Mode: Trajectory Data Cleansing Method for Shared Electric Bicycles. Sustainability 2019, 11, 1429. [Google Scholar] [CrossRef]
  25. Ma, K.R.; Banister, D. Excess Commuting: A Critical Review. Transp. Rev. 2006, 26, 749–767. [Google Scholar] [CrossRef]
  26. Shen, R.; Xie, H.; Liu, Y. Can Popularity of Rail Transit and Bike-sharing Improve Air Quality? A Case Study on Wuhan City. J. China Univ. Geosci. (Soc. Sci. Ed.) 2018, 18, 95–110. [Google Scholar]
  27. Corcoran, J.; Li, T.; Rohde, D.; Charles-Edwards, E.; Mateo-Babiano, D. Spatio-temporal patterns of a Public Bicycle Sharing Program: The effect of weather and calendar events. J. Transp. Geogr. 2014, 41, 292–305. [Google Scholar] [CrossRef]
  28. Xie, X.F.; Wang, Z.J. Examining travel patterns and characteristics in a bikesharing network and implications for data-driven decision supports: Case study in the Washington DC area. J. Transp. Geogr. 2018, 71, 84–102. [Google Scholar] [CrossRef] [Green Version]
  29. Bao, J.; Xu, C.; Liu, P.; Wang, W. Exploring Bikesharing Travel Patterns and Trip Purposes Using Smart Card Data and Online Point of Interests. Netw. Spat. Econ. 2017, 17, 1231–1253. [Google Scholar] [CrossRef]
  30. Jensen, P.; Rouquier, J.B.; Ovtracht, N.; Robardet, C. Characterizing the speed and paths of shared bicycle use in Lyon. Transp. Res. Part D Transp. Environ. 2010, 15, 522–524. [Google Scholar] [CrossRef] [Green Version]
  31. Oates, G.R.; Hamby, B.W.; Bae, S.; Norena, M.C.; Hart, H.O.; Fouad, M.N. Bikeshare Use in Urban Communities: Individual and Neighborhood Factors. Ethn. Dis. 2017, 27, 303–312. [Google Scholar] [CrossRef] [PubMed] [Green Version]
  32. Zhou, J.; Murphy, E.; Long, Y. Commuting efficiency in the Beijing metropolitan area: An exploration combining smartcard and travel survey data. J. Transp. Geogr. 2014, 41, 175–183. [Google Scholar] [CrossRef]
  33. Gimeneznadal, J.I.; Molina, J.A.; Velilla, J. Excess Commuting in the US: Differences between the Self-Employed and Employees; Social Science Electronic Publishing: New York, NY, USA, 2015. [Google Scholar]
  34. Ashqar, H.I.; Elhenawy, M.; Almannaa, M.H.; Ghanem, A.; Rakha, H.A.; House, L. Modeling Bike Availability in a Bike-Sharing System Using Machine Learning. In Proceedings of the 2017 5th IEEE International Conference on Models and Technologies for Intelligent Transportation System (MT-ITS), Naples, Italy, 26–28 June 2017. [Google Scholar]
  35. Xu, C.; Ji, J.; Liu, P. The station-free sharing bike demand forecasting with a deep learning approach and large-scale datasets. Transp. Res. Part C Emerg. Technol. 2018, 95, 47–60. [Google Scholar] [CrossRef]
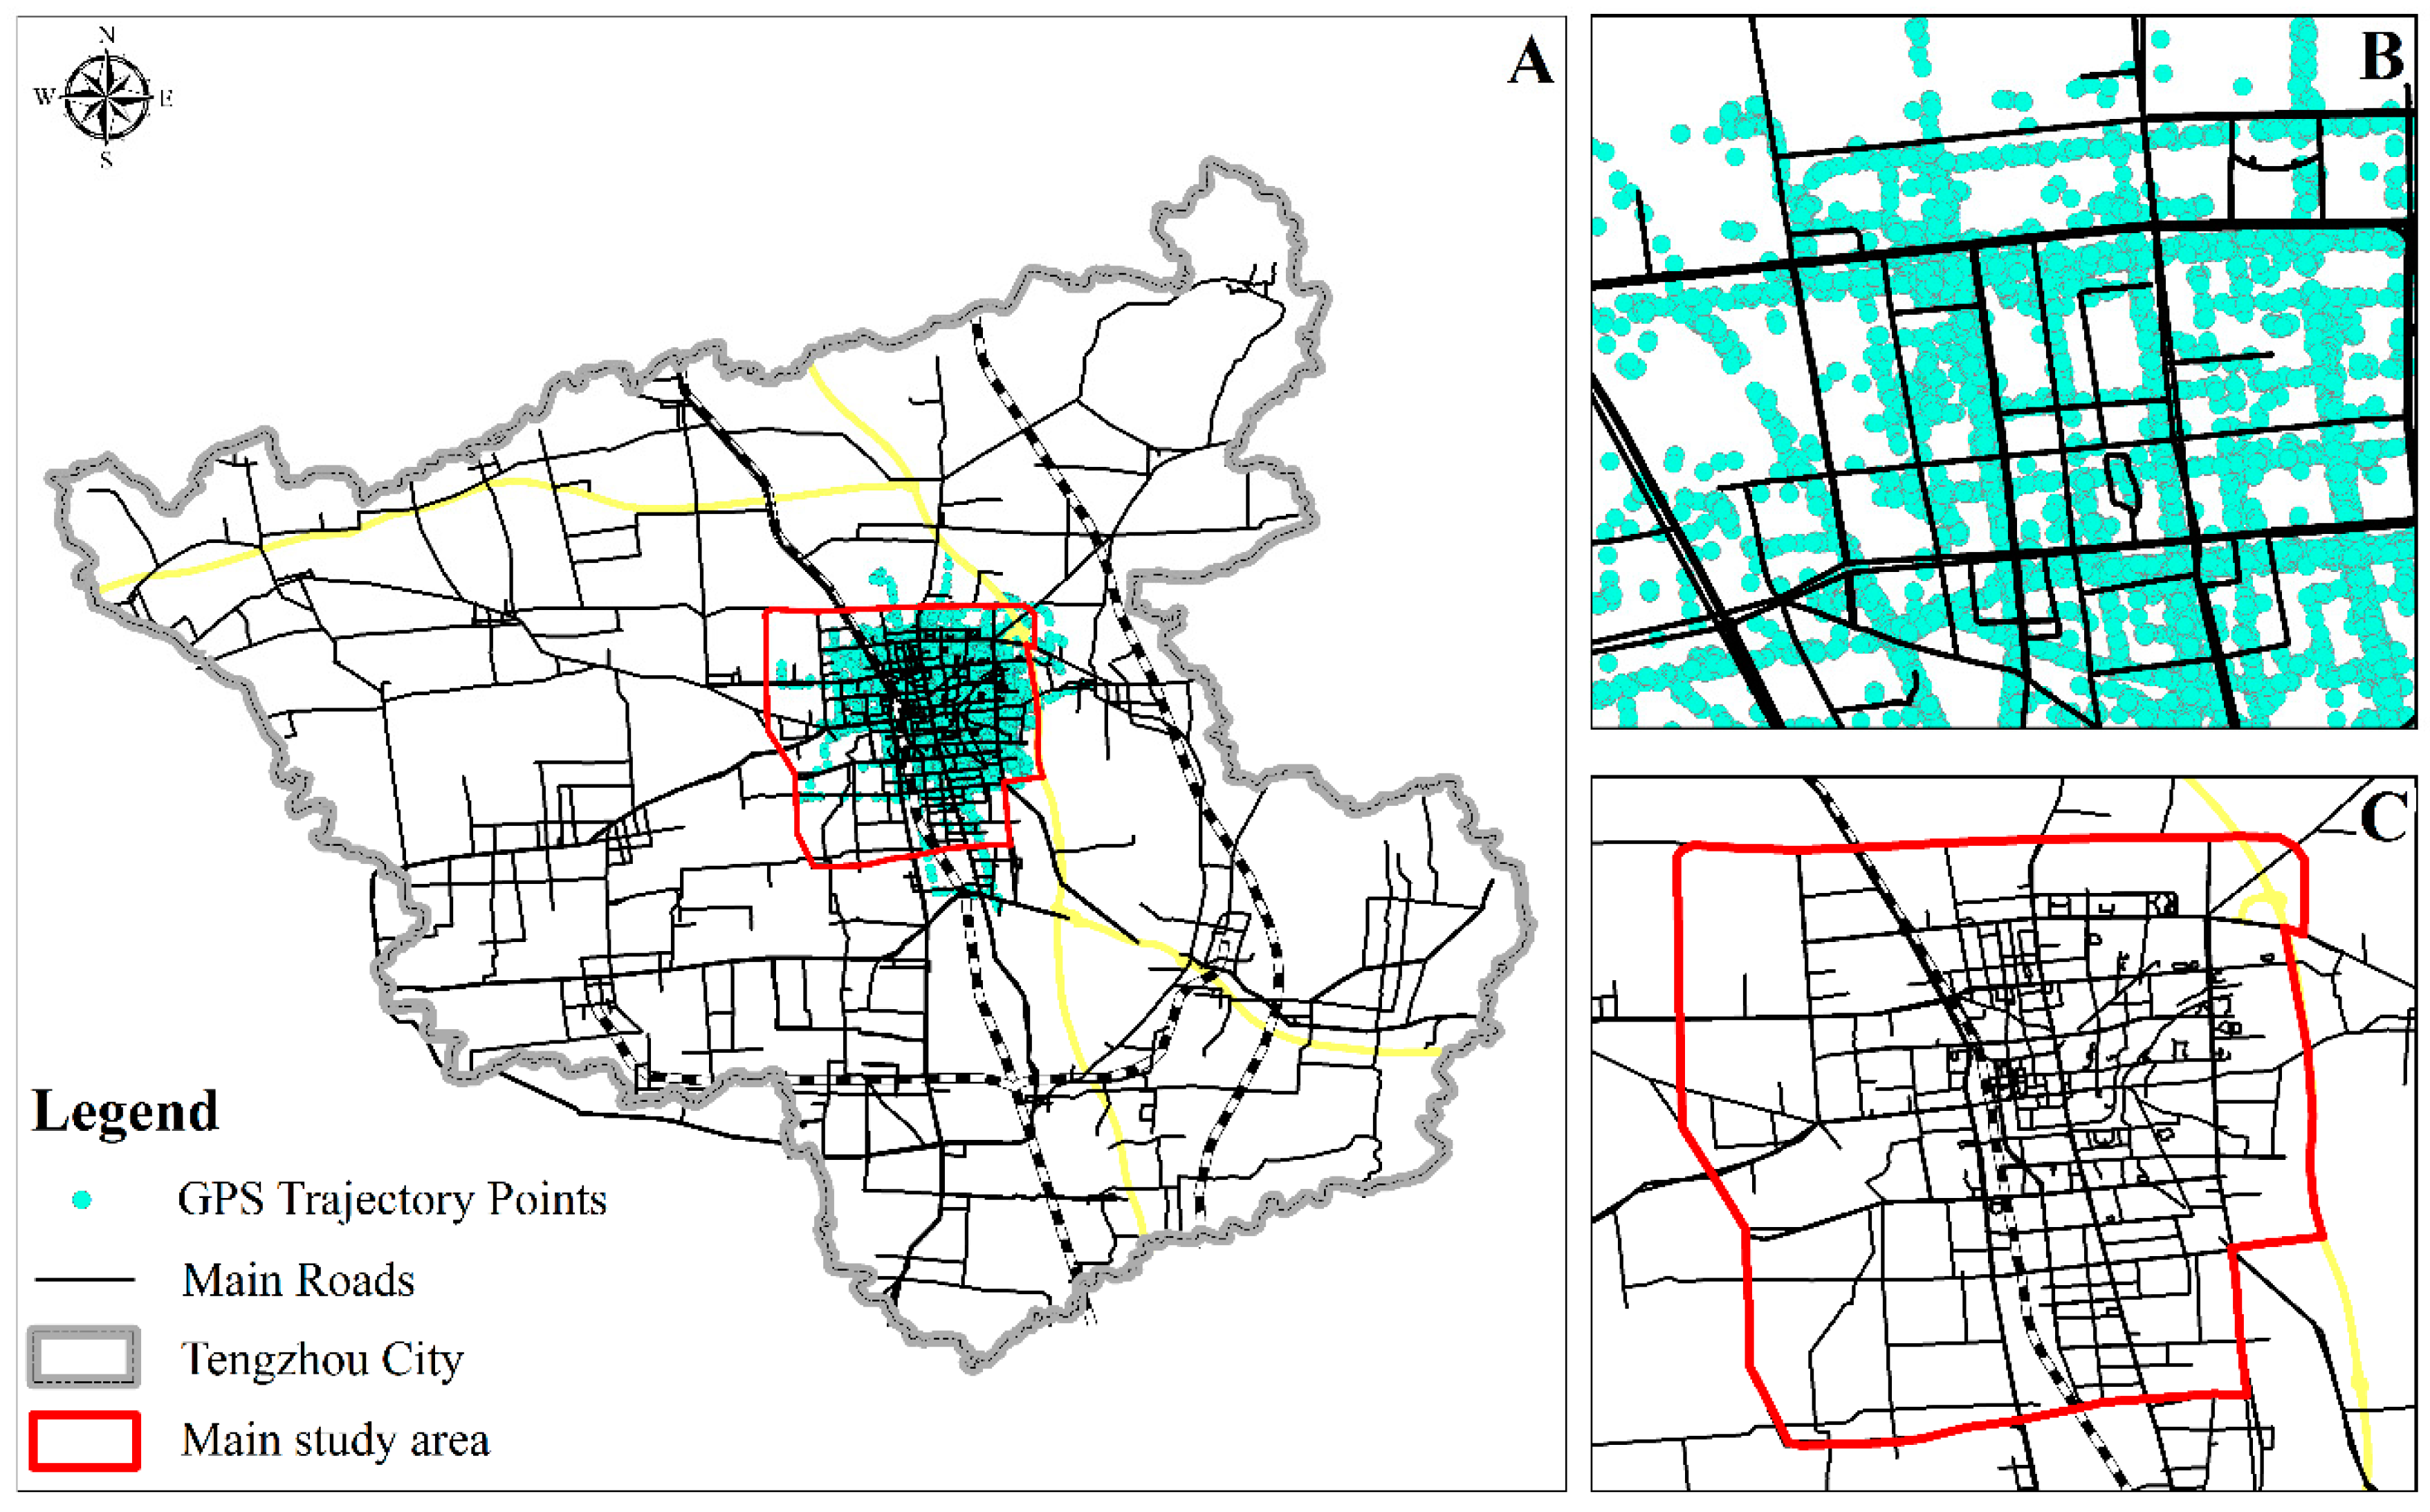
Figure 1. Study area and GPS trajectory points (panel A Tengzhou City; panel B GPS points; and panel C main study area).
Sustainability 11 05003 g001
Figure 2. Structure of raw GPS data (dots mean more GPS data).
Sustainability 11 05003 g002
Figure 3. Overall characteristics of e-bike trip time, distance, and speed from May to July in 2018.
Sustainability 11 05003 g003
Figure 4. Daily average usage of shared e-bikes from May to July in 2018 (bars indicate the average value standard deviation).
Sustainability 11 05003 g004
Figure 5. Hourly average usage of shared e-bike in sunny and rainy days from May to July in 2018 (bars indicate the average value ± standard deviation).
Sustainability 11 05003 g005
Figure 6. Hourly average usage of shared e-bikes from May to July in 2018.
Sustainability 11 05003 g006
Figure 7. Three-mode Gaussian Function of hourly average usage of shared e-bikes from May to July in 2018.
Sustainability 11 05003 g007
Figure 8. Hourly average speed of shared e-bike trips from May to July in 2018.
Sustainability 11 05003 g008
Figure 9. Kernel density of O–D points (Origins and Destinations) during morning rush hour (7:00 and 8:00).
Sustainability 11 05003 g009
Figure 10. Kernel density of O–D points (Origins and Destinations) during evening rush hour (17:00 and 18:00).
Sustainability 11 05003 g010
Figure 11. Kernel density of trajectory paths during morning and evening rush hours.
Sustainability 11 05003 g011
Figure 12. Difference of kernel density between Origins and Destinations during morning rush hour.
Sustainability 11 05003 g012
Figure 13. E-bike density in geographic hotspots (work and home areas).
Sustainability 11 05003 g013
Figure 14. Diagram of the calculation of spillover commuting.
Sustainability 11 05003 g014
Table 1. Statistics of temperatures and air quality index (AQI) from May to July.
MonthAverage TemperatureCorrelation with TemperatureAQICorrelation with AQI
May21.7 °C0.563382.50.71833
June26.7 °C0.09649988.60.257916
July28.2 °C−0.1142250.8−0.26489
Total −0.063 −0.44367