Article

Taxonomic Assessment of Transition to the Green Economy in Polish Regions

by
Joanna Godlewska
1 and
Edyta Sidorczuk-Pietraszko
2,*
1
Faculty of Engineering Management, Bialystok University of Technology, Białystok 15-351, Poland
2
Faculty of Economics and Management, University of Bialystok, Białystok 15-082, Poland
*
Author to whom correspondence should be addressed.
Sustainability 2019, 11(18), 5098; https://doi.org/10.3390/su11185098
Submission received: 13 August 2019 / Revised: 9 September 2019 / Accepted: 13 September 2019 / Published: 18 September 2019
(This article belongs to the Section Economic and Business Aspects of Sustainability)

Abstract

:
In this paper, an aggregate indicator of a regional green economy (Regional Green Economy Index—RGEI) was proposed and applied to assess the level of green economy in Polish regions and its changes in the period 2004–2016. The TOPSIS (Technique for Order of Preference by Similarity to Ideal Solution) method was applied, which is one of the multi-criteria decision making methods (MCDM), widely used to assess the spatial diversity of socio-economic phenomena. Common reference values (ideal and anti-ideal solution) were used for variables for the entire study period. It allowed not only for creating a ranking of regions, but to assess progress towards the green economy as well. It was found that all regions of Poland made progress in this respect. Most importantly, the regions ranked the worst before Poland’s accession to the European Union, made substantial progress. It was stated as well that none among the studied regions had high values of all variables included in the aggregate index. The maximum value of the RGEI index was about 0.5, while the index range is [0,1]. Additionally, an important finding was the fact that the weights of all diagnostic variables obtained using information entropy method were about equal, which confirms the approach of researchers and institutions who do not use weighting in aggregate indicators for well-being or sustainable development—which means implicitly using equal weights.

1. Introduction

The green economy is a response to global problems both in the environmental sphere, and, perhaps above all—economic and social ones. Some scholars even consider it a kind of revolution because its influence goes far beyond the economic sphere [1]. The green economy is a path of economic development that will be permanently possible, taking into consideration environmental restrictions and criteria—mainly concerning the availability of environmental resources and services. It is regarded as an important tool for achieving sustainable development. It should be noted that it provides solutions for policy making, but it should not be seen as a set of rigid rules [2]. The green economy has been anticipated as a catalyzer to renew national policy growth and international cooperation, which fundamentally supports sustainable development as the strategic economy policy agenda [3,4].
Most commonly used in publications is the OECD’s (The Organisation for Economic Co-operation and Development) definition of green economy, as the economy that contributes to the improvement of human well-being and social equality, while significantly reducing the ecological risk and consumption of natural resources [2]. All the definitions of green economy functioning in science and practice contain common elements, such as saving natural resources, reduction of greenhouse gas emissions and other pollutants, protection of biodiversity, quality of life, human well-being and social inclusion [2,4,5,6].
It should be noted as well that green economy, according to some authors, is considered as a certain framework of action, including the creation of strategies and macroeconomic policies. This distinguishes it from green growth, which concerns processes occurring in the economy, including greening products, services, technologies and supply chains [2,4].
Assuming that the green economy is a category operationalizing the concept of sustainable development in the economic dimension and should improve the process of implementing the idea of sustainable development, it is first of all necessary to formulate specific ways of moving the economy to a path that takes into account environmental constraints, and to propose measures of progress in order to achieve this goal.
This article concerns the measurement of the degree of implementation of the green economy principles at the regional level. A composite indicator is developed, i.e., one that compiles a set of individual indicators “into a single index, on the basis of an underlying model of the multi-dimensional concept that is being measured” [7]. Such an indicator is based on range of basic diagnostic indicators that have no common unit of measurement, and there is no clear way of aggregating these basic indicators either, as stated by Saisana and Tarantola in their state-of-the-art report on composite indicators [8]. These two definitions highlight the two basic groups of challenges—conceptual and methodological challenges—involved in building such composite indicators.
The conceptual challenge is related to a complexity and multidimensionality of the idea of green economy itself. The concept of green economy still raises a lot of controversy and ambiguity. Difficulty in defining a general model of the green economy results in problems with its implementation into practice, including problems with measurement of progress. Vukovic et al. claim that green economy indicators have the properties of uncertainty and fuzziness, so many authors involuntarily used the elements of the theory of fuzzy sets to describe the object of research. Finally, by developing criteria for assessing green economy, researchers do not strictly outline defined rules or principles for their formation [9].
While sustainable development refers to the society-economy-environment macrosystem, it is the postulate of the green economy that focuses on the relations between the economy and the environment. For the purposes of this article, the green economy is understood in this narrower sense of being in the context of the relationship between the economy and the environment—which is consistent with the OECD’s approach. This approach was confirmed in the study of Khoshnava’s et al. Their results show that the main categories of academic studies were related to the environment at 30%, while 8% belongs to the green and sustainable science. The second important category was the economic studies at 16%. In addition, green economy studies, in terms of social studies, was only at 4%, which shows the absence of more research in this category [3]. Vukovic perceives the green economy of the region as an ecological–economic system as well [9].
Methodological challenges relate to measurement methods and use of statistical techniques, with a special focus on the regional context. Most of the research on measurement of the progress towards green economy concerns the national level and international comparisons. At this level, four approaches are distinguished based on the work of Stiglitz, Sen and Fitoussi [10], which is confirmed by Narloch, Kozluk and Lloyd [11] or PAGE (Partnership for Action on Green Economy) [12]: dashboards of indicators, composite indicators, environmental footprints and adjusted monetary measures. However, none of the indicators are sufficiently comprehensive to cover the complexity and the multiple objectives of a green economy.
Monetary measures, even though they for example adjust gross domestic products for social and environmental costs (e.g., the Index of Sustainable and Economic Welfare, the Measure of Economic Welfare and the Genuine Progress Indicator)—they still give preference to economic outcomes. On the other hand, physical measurement frameworks such as ecological footprints or material flow accounts focus on the environmental dimension. Detailed indicators (dashboards) are to some extent difficult to interpret as well—especially by the general public and policymakers. These indicators are normally expressed in different units and can provide contrasting signals, making it difficult to develop proper policies [13]. Therefore, some form of a comprehensive, multi-dimensional measure is desired and several international initiatives in this respect take place. Additionally, as discussed in the Green Economy Progress Measurement Framework ([12], p. 10, [11], p. 3) the optimal approach is to use both an aggregate (comprehensive) index as well as a dashboard of detailed indicators describing specific areas of green economy. An aggregate index provides a synthetic view of a phenomenon as a whole, whereas a dashboard of indicators gives complementary information and helps better understand the differences between countries (regions, cities, etc.) and changes across time.
Green economy indicator sets (dashboards) have been proposed by both international and national organizations. The most well-known and applied set of indicators is the one created by the OECD. It widely covers the relationship between the economy and the environment, as well as social aspects directly related to the economy or the environment. The main areas covered by the indicators are [14]:
  • environmental and resource productivity,
  • natural assets base,
  • environmental dimension of quality of life,
  • economic opportunities and policy responses,
  • socio-economic context.
OECD, as a part of its statistical database, runs a database of the green economy indicators calculated according to this methodology for the member countries, candidate countries, main partners and other selected states (total 204 countries, as for 9 August, 2019).
UNEP (United Nations Environment Programme) proposes a different approach to monitoring the green economy [15]. They do not provide any arbitrary set of indicators but propose a certain methodology for creating systems of such indicators, assuming that individual countries, adequately to their specific conditions, should develop their own monitoring systems. The UNEP manual draws attention to the specificity of the country’s environmental and socio-economic conditions and proposes exemplary selection procedures and sets of indicators for countries in different climate zones, in various phases of demographic transition and with different economic structures.
National statistical bodies of some countries provide databases of green economy indicators as well (e.g., Denmark, Poland, Czech Republic, The Netherlands, Korea, Canada). Statistics Poland adopts an approach based mainly on the OECD methodology [16]. The indicators are collected in four main monitoring areas: natural capital (condition of the environment), environmental efficiency of production (relationship between environment and economy), environmental quality of life (relationship environment—society), and economic policies and their consequences (instruments of impact on the economy and society).
Composite indicators are widely applied to a range of issues related to sustainable development: green economy, sustainable consumption [17], agriculture [18] and sustainable energy [19]. The variety and the number of composite indicators built in an economic, political, social or environmental sphere was assessed by Bandura, who in 2011 identified over 400 official composite indices that rank or assess countries according to some measures [20]. In a complementary report published by the United Nations’ Development Programme in 2014, Yang identified over 100 composite measures of human progress [21].
Composite green economy indicators are mostly used for international comparisons. The most known indicator of this kind is the Global Green Economy Index (GGEI), developed since 2010 by the American consulting company Dual Citizen. The report from 2018 covered 20 component indicators for the years 2013–2017 and covered 130 countries [22]. A similar approach was adopted by Nahman, Mahumani and de Lange who built the Green Economy Index (GEI), which includes 20 detailed indicators for 144 countries [13]. Another composite green economy index, Green Economy Progress Index (GEPI), is a result of research within the Partnership for Action on Green Economy (PAGE), an initiative of five agencies of the United Nations that is to facilitate cross-country comparisons of national efforts to transition to greener and more inclusive economies [12]. The fourth and most recent initiative is the initiative by the Global Green Growth Institute [22]. The framework of Green Growth Performance Measurement and Green Growth Index (GGI) attempts to address some methodological constrains of the former indexes (e.g., different economic structures of countries, reference points). Similar indicator for the EU countries was proposed by Ryszawska [23].
Current methodologies of the four indexes with a worldwide coverage are summarized in Table 1, based on the respective reports [11,12,13,22]. All these indicators apply some form of multi-dimensional comparative analysis, as described by the founding father of taxonomic analysis in Poland—Hellwig [24] and internationally – by Hwang and Yoon [25]. The short review made in Table 1 shows that at every stage of the composite indicator’s construction (choice of indicators, data collection, normalisation, weighting and aggregation), many solutions are available with their own specificity, and, in most cases, without clear conclusion as to which solution would be proper in a given situation.
These four indexes reflect different goals of their authors: the GEP Index is focused on progress (comparing green economy efforts across country, measuring progress in meeting selected Sustainable Development Goals and measuring progress in achieving national green economy priorities) whereas the other three indexes rather assess the level of transition to a green economy. All four indicators differ in all aspects of their design, which reflects different views and theoretical concepts of their authors as well. Especially, the difference in the list of subdomains and indicators covered by each index reflects both different approaches to defining the green economy and data availability.
Ideally, the process of building a composite index—especially the choice of indicators—should be guided by a set of criteria, which according to the OECD manual ([7], pp. 48–49) and many other methodological studies [5,9] can be summarized as follows: relevance (the value contributed by the indicator and coverage of the issue), accuracy and transparency (the extent to which an indicator properly describes the quantities or features that it should measure), timeliness (the time between data availability and the event or phenomenon it describes, which affects the applicability of the data in a decision-making process), accessibility (ease of the access to data) and coherence (logical connections and mutual consistence of data). Although the theoretical framework of an index should be the basic factor influencing decisions on measurement, indicators and targets, the availability of data is often the factor that affects both decisions about goals and indicators covered by the index [5]. This may have significant unintended (and often undesired) consequences, i.e., indicator choice can affect actions taken and stimulate progress towards an indicator target and not the original goal. Some examples of such situations are discussed by Georgeson, Maslin and Poessinouw [5].
The issue of normalisation, i.e., transformation of the indicators to a common scale, arises because different indicators are normally measured in different units and on different scales [5,7]. Some of indicators are stimulants (i.e., the higher value of an indicator represents better performance) while other are destimulants (i.e., the higher value of an indicator represents poorer performance). These differences in the direction of an indicator’s impact should be addressed during the normalisation procedure as well [13].
Normalisation means applying a mathematical formula to transform the raw data to a common scale and with higher scores representing better outcome for all indicators. As a result of normalisation, all indicators can be subject to aggregation. Among various normalisation techniques available (ranking, standardisation, min-max normalisation, unitisation) each has its own advantages and disadvantages, and each is appropriate in different circumstances—which is again widely discussed in the OECD manual [7].
Ranking and standardisation (z-scores) are the simplest techniques: ranking means that performance scores of objects are expressed as relative positions, while the standardisation procedure converts indicators to a common scale with a mean of zero and standard deviation of one [7]. Although simple, and not affected by outliers, both methods involve a significant loss of information about an absolute level of performance. They do not use a universal scale either.
Min-max normalisation (0–1 normalisation, zero-unitisation) is a technique used by the Human Development Index (HDI), Green Economy Index [13], Green Growth Index Growth Institute [11] and Sustainable Society Index (SSI) [26]. Indicators are normalised to have a common range (0 to 1) by subtracting the minimum value and dividing by the range of the indicator values. Opposite to rankings and z-scores, min-max normalisation is affected by extreme values and outliers [7]. In cross-country comparisons, outliers can pose a significant difficulty, which is why the authors of the green economy indicators discussed above try to use thresholds (target values) for normalisation instead of historical minima and maxima.
Assigning weights to individual indicators is necessary to add them together into a single composite (aggregate) index. As many researchers emphasize, selection of the relative weights is a crucial step in the multiple criteria decision making [27] and even the decision ‘no weighting’ means that equal weights are applied. Decancq and Lugo discussed construction of multidimensional indexes of well-being and their remarks fully apply to measuring the green economy. Weights may reflect several reasons why the contribution of individual indicators to a composite index are different: first of all, they may reflect relative importance of indicators and a decision-maker’s preference in the context of the phenomenon under study [27]. Second, there may be data-related reasons such as the statistical quality of data, when higher weights are assigned to more statistically reliable data with broad coverage [7]. The variety of methods for setting weights can be summarized to three main approaches: data-driven (objective), normative (subjective) and hybrid [27]. The difference between these approaches concerns a fundamental belief about what weights should reflect. Data-driven weights are a function of the distribution of data describing particular objects and are calculated using some frequency-based or statistical procedures. They do not assign any values (preferences) to particular criteria (indicators). On the other hand, normative approaches assume that weights should reflect a decision-maker’s preference (values assigned) for individual criteria. They can be either equal, arbitrary, based on expert opinion or prices [27]. Hybrid approaches combine the two.
There is vivid discussion about how to set weights in composite indexes describing complexed phenomena such as development, welfare and economy [5,7,8,27,28]. Basic theoretical conclusion refers to Hume’s guillotine as it is impossible to derive a statement about values from a statement about facts, so the data-driven methods should not be applied to assign weights that are supposed to reflect social preferences. However, such conclusion results in a question whose preferences should be used. With the current state of knowledge, this problem remains unsolved [27,28].
Taking into consideration strengths and weaknesses of particular approaches and the complexity of the analysed issue we decided to apply one of the data-driven methods, the entropy weight method, as proposed by Diakoulaki, Mavrotas and Papalakakis [29]. This method was applied for analyses concerning sustainable development and well-being by Carbonaro [30] and Wang et al. [31] and proved to be effective.
The choice of the aggregation method is related as well to some theoretical assumptions, i.e., substitutability and compensability of criteria (indicators)—whether changes in the achievements of different dimensions can or cannot compensate each other. The linear aggregation method assumes that the compensation is possible and is useful when all individual indicators have the same measurement unit, provided that some mathematical properties are respected [7]. Geometric aggregation is applied when some degree of non-compensability between dimensions is desired.
Extensive and interesting review of methods for weighting and aggregating in sustainability indicators done by Gan et al. underlines that the choice of a particular method depends to a large extent on assumptions and needs of the analysis, namely spatial and temporal scale and week or strong sustainability. Statistical methods are better for comparisons when a spatial scale is fine rather than coarse and where opinion-based methods are better [29]. Apart from that, an index should ideally be measured on a fixed scale (e.g., 0–1 or 0–100) to meet a basic objective of composite indicators, i.e., to be easy to communicate [13].
The composite indexes of the green economy discussed above refer to the national level and the data that are collected for the national scale. However, there is a need to measure the green economy at the regional level—not only for cognitive reasons but for at least two practical purposes as well. First of all, the spatial approach to this phenomenon is useful in planning and implementing green economy policy at the national level. Secondly, in many countries, including Poland, regions have important competences in the field of socio-economic development policy.
Regional self-government authorities are subjects of regional development policies in Poland—individual regions implement their own development strategies. Currently, greening the economy is an important dimension of these strategies, mainly because it is strongly supported by the European Union’s regional policy. A transition towards a more green, resource-efficient and low-carbon economy is one of the pillars of the EU development strategy [32] and a focal point of its implementation programs concerning such issues as moving to a competitive low carbon economy in 2050 [33], creating resource efficient Europe [34], and the circular economy [35]. Referring to these documents, the EU regional policy and its instruments pay more and more attention to actions contributing to different aspects of the green economy. In the programming period of 2014–2020, a minimum share of each region’s European Regional Development Fund allocation (20% in more developed regions, 15% in transition regions and 12% in less-developed regions) should be “invested in measures supporting the shift to a low-carbon economy” [36].
Measuring the effectiveness of implementation of these strategies is a necessary element of a policy-making process. According to national regulations, regional authorities are required to monitor and analyse the development processes in the spatial dimension, the development strategy of the region and regional operational programmes for the use of EU structural funds, amongst others. A composite index covering all detailed aspects of a phenomenon as complex as the green economy would be useful in such a monitoring process by providing a synthetic view, allowing for better communication and for a better identification of problems and relationships between different dimensions.
However, measuring the green economy performance at the regional level involves additional constrains as compared to national level indexes. At the regional level, the direct transfer of indicators (both used as a set of separate indicators as well as a part of the aggregate indicator) applied at the national level often encounters a limitation in the form of data availability. Considering this barrier, in studies devoted to the regional dimension of the green economy, authors usually use their own sets of indicators or their own aggregate indicators, according to the accessible data at the regional level.
In relation to Poland, hardly any attempts have been made to create a composite green economy measure. The regions were ranked in terms of various aspects of sustainable development, such as social development ranking by Roszkowska and Filipowicz-Chomko [37] or ranking of the Eastern Poland regions in terms of sustainable development using the Hellwig method [38]. The research concerned individual regions as well, such as the study by Perło, who in the work devoted to modelling the green economy of the Podlaskie voivodship used 22 indicators related to the economic, social and environmental sphere, with 10 indicators taken into account for the latter sphere [39].
Many studies deal with various aspects of a green economy at the regional level in China and, to our knowledge, China is the only country where the regional green economy index is published on a regular basis. China Green Development Index includes over 60 indicators covering three areas: resource efficiency, carrying capacity potential of natural resources and environment (indicators of resource and ecological conservation, environmental pressure and climate change) and government policies (indicators of green investment, infrastructure, and environmental management) [40].
In a study devoted to the green economy in China, Li and Lin examined 275 cities using the boundary analysis of the DEA (Data Envelopment Analysis) envelope and the green economy performance indicator [41]. Most research focus on selected aspects of the green economy such as CO2 emissions, renewable energy or green jobs (see [42,43,44]). In these works, static approaches were adopted; the authors assessed the indicators in a selected period, such as Su et al. [43], who analysed 12 cities by constructing an aggregated low-carbon economy index using a multicriteria comparative analysis approach (although it was not explicitly named) and determining the weights by entropy of information. In another Chinese study, Shi et al. built a city green economy evaluation index system based on R cluster analysis and coefficient of variation and, by using it, assessed 15 sub-regional cities in a given year [44].
A type of dynamic approach has been used in the work of Shi et al. [45], where the changes in the aggregate low carbon economy index for the city of Xiamen in China were calculated. The authors applied entropy weight method and a linear additive model. The proposed indicator allowed the assessment of changes in the analyzed unit. However, due to the adopted set of indicators (some of them were in absolute numbers), it is not suitable for spatial comparisons.
Taking into account this experience, the purpose of the work is to create an aggregate indicator of regional green economy and to apply it for assessing Polish regions in terms of the level of green economy and its changes in the period 2004–2016. Based on recent studies regarding the measurement of a green economy at the national level, a Regional Green Economy Index for Poland is proposed. Objectives of the study are mostly cognitive and policy-related; however, we wish to answer a methodological question relating to weights as well. We adapt existing methodologies designed for international comparisons to the regional level and adjust them to Polish conditions (mostly related to data availability). We aim to present a tool that can be used in the process of designing and implementing Poland’s policy of the transition to a green economy—both at the national and regional level.

2. Materials and Methods

2.1. Socio-Economic Characteristics of Studied Regions

The study covered 16 regions (voivodships) into which the territory of Poland is divided. Regional diversification of development is typical: there is diversification of indicators in two dimensions:
  • the central region and the remaining regions of the country (Mazowieckie with Warsaw, the capital of Poland clearly dominates in terms of GDP per capita, as seen in Figure 1);
  • geographical axis: North East–South West (in the north-east there are less developed regions (except for Mazowieckie), with a smaller share of industry, while moving towards the south-west, regions are more developed).
The list of selected indicators of socio-economic development (Table 2) was made for 2016. Data were extracted from the database of strategic indicators called STRATEG [46], run by Statistics Poland and the publication of the Statistical Yearbook of the Regions, Poland [47].
The most developed region is the Mazowieckie voivodeship, where the capital of the country is located. It is characterized by the largest population, the highest index of urbanization as well as the highest level of industrialization. GDP per inhabitant in percent of national average is the highest for this region as well, at almost 160%. The high development levels are achieved by three other regions as well: Slaskie, Wielkopolskie and Dolnoslaskie. The areas with the highest share of protected areas are located in the south of Poland, namely the Swietokrzyskie, Malopolskie and Podkarpackie regions, and the Warminsko-Mazurskie region in the north-east of the country.

2.2. Description of the Method

In this work a synthetic measure of the green economy has been constructed for Polish regions and has been used to assess Polish regions (voivodships) in terms of the green economy and changes in this respect in the period 2004–2016. Technique for Order of Preference by Similarity to Ideal Solution (TOPSIS) was applied in this study, and is one of the methods of multi-dimensional decision analysis commonly used to assess various decision variants—and recently to analyse the spatial diversity of socio-economic phenomena as well [25]. The method was originally designed by Hwang for assessing a set of alternative decision variants in terms of their similarity to the ideal solution (the most desired situation). Each alternative is characterized by a set of criteria of different importance (expressed by weights). The method is based on the assumption that the best alternative should have the shortest geometric distance from the positive ideal solution (the best solution, pattern) and the longest geometric distance from the negative ideal solution (anti-ideal solution, anti-pattern). It allows for making a final ranking or variants [25].
Some modifications were made to the method, taking into account the specifics of the phenomenon under study. A common pattern (ideal and anti-ideal solution) was used for the entire period studied. For each variable, its maximum and minimum value for the whole period were used for normalization. Then, the best scores of all variables included into the index (considering the whole period under study) were aggregated into the ideal solution, and the worse scores into the anti-ideal solution. This modification allowed not only to create a ranking of regions, but to assess progress in building the green economy over the period considered as well. In this way, a certain weakness of this group of methods has been overcome, i.e., the fact that they allow for the ranking of objects in their original shape without taking into account the temporal dimension.
The direct inspiration for the approach used in our work were the recent changes made in the HDI formula. Minimum and maximum values are now set as fixed and are used for standardization of component indicators [48]. Minimum values for particular variables are their “natural zeros” i.e., the lowest possible level. Maximum values are set as “aspirational targets” since 2014 (until 2013 they were the highest observed values in the preceding years since 1980 (e.g., in 2013, the years 1980–2012) For example, the maximum of GDP per capita is set at USD 75,000 per capita, as according to Kahneman and Deaton [49] there is no gain in human development and well-being from annual income per capita above USD 75,000. Although there are several countries exceeding this number, their standardized indicator for GDP per capita is still 1.
Minima and maxima of particular variables in the analysed period were used as ideal and anti-ideal solutions as well, instead of using thresholds. Using thresholds would be better, and this tendency is present in methodologies of green economy indexes developed for cross-country comparisons (Table 1). However, it was impossible due to the lack of up-to-date factual knowledge allowing to determine fixed patterns for particular detailed indicators, which is a field for future research. Apart from the studies concerning measurement of welfare and sustainable development, the multicriteria approach using fixed patterns were applied in the work of Roszkowska and Lašakevič, among others, to assess changes in the labor market in a regions of Lithuania [50]. Thanks to this approach, they were able to assess the dynamics of the phenomenon. This experience was applied in this study.
In the index aggregation process, information entropy weights were applied. While considering the choice of the method of weighing, recent achievements in the area of aggregate indicators of welfare and sustainable development were taken into account. Normative approach based on preferences was regarded as unfeasible in a situation when a large number of criteria are relevant and therefore difficult to evaluate. For example, the authors of the OECD manual on composite indicators state that the optimum number of indicators suitable for participatory assessment is between 10 and 12. Too many indicators can induce serious cognitive stress in the experts who are asked to assign weights to a significant number of variables [7]. This is the first reason why a data-driven approach has been applied. In Poland, the normative (expert) approach has been used for example by Ryszawska, who created the Green Economy Index (GEI) for EU countries [23]. She determined weights based on surveys completed by 14 experts. Her GEI covered seven thematic areas, for which the weights ranged from 0.12 to 0.15. Within these areas, total of 21 variables were included and the weights assigned by the experts deviated from equal weights by a maximum of 20%. In our index, the number of variables was similar (23 indicators) and we decided to use a different approach for comparison. For the same reason, equal weights were not applied. Two of the discussed green economy indexes (GGEI and GEI, see Table 1) apply equal weights and it would be valuable to compare them with weights derived using a different method.
The research procedure consisted of the following stages:
Step 1. A list of potential diagnostic features was established, and their nature was determined, indicating stimulants (variables which higher values determine a better performance) and destimulants (variables whose higher values determine a worse situation of the object considering the studied phenomenon).
The list of potential diagnostic features of the green economy was built based on the OECD Green Economy Indicator Set. They were supplemented with important for Poland indicators not included by the OECD but included in other studies. Another criterion was the availability of data for the regional level in Poland. All features taken into account by the OECD or their equivalents were included, as long as the data were available for Poland at the regional level. Another selection criterion, was the possibilities of comparisons (features expressed in relative terms were selected). Diagnostic features were analyzed in the division into five thematic areas (subsystems), according to the classification adopted in Green Growth Database OECD: environmental and resource productivity, natural asset base, environmental quality of life, policy response and socio-economic context. The spatial scope covered all voivodships (regions) of Poland, and the time range was the years 2004–2016—the period after Poland’s accession to the European Union. For this period a full series of analyzed data is available for Polish regions.
Step 2. The set of potential diagnostic features was reduced, eliminating features with relatively low variability (with a variation coefficient below 10%), as well as strongly correlated with other diagnostic features, using the parametric method as described by Młodak [51]. Detailed information on the procedure of choice and selection of diagnostic variables is provided in Table 3.
At the selection stage, a number of variables were excluded due to mutual correlation. In the OECD Green Growth Database, numerous issues are described by several variables that are inevitably correlated. This mainly applies to variables describing the level of industrialization and urbanization, which are correlated with energy consumption and CO2 emissions, as well as with built-up and devastated land. For the purpose of constructing the RGEI, the aim was to ensure that the key individual aspects of the green economy were represented by at least one variable in the index. As a result, 23 variables were included in RGEI, divided into five thematic areas (subsystems) according to the OECD’s Green Growth Indicators.
The data matrix has the form:
X = [ x i j t ] ,
where: x i j t j value—the indicator of the green economy (j = 1,2, …, 30) for i—the voivodeship (i = 1,2, …, 16) in t—the year (t = 2004, 2005, …, 2016).
Step 3. The diagnostic variables were normalized according to the min-max normalization formula, to bring all values into the range [0,1]:
for stimulants:
y i j t = x i j t min i { x i j t } max i { x i j t } min i { x i j t } ,
for destimulants:
y i j t = max i { x i j t } x i j t max i { x i j t } min i { x i j t } ,
where y i j t is the value of the normalized variable j for the i-the region in the year t, z i j t [ 0 , 1 ] , x i j t is the value of j-the indicator of the green economy (j = 1,2, …, 30) for i-the voivodeship (i = 1,2, …, 16) in t-the year (t = 2004, 2005, …, 2016), m a x i { x i j t } is the maximum value of j-the variable (indicator) of the green economy in years 2004–2016, and m i n i { x i j t } is the minimum value of j-the variable (indicator) of the green economy in years 2004–2016.
Common patterns (minimum and maximum value) were adopted for individual variables throughout the entire period under study, which made it possible to assess change trends.
In order to eliminate the influence of the logarithmic calculation of the standardized value [ 0 ,   1 ] , the coordinate of y i j t was translated according to the formula:
z i j t = y i j t + θ ,
where θ is the amplitude of the translation. In this study, the value of θ is 0.001.
Step 4. Indicator weights were determined using the information entropy method.
The concept of Shannon’s entropy was applied for weighting, as it reflects the level of uncertainty or disorder in a particular set of information. The greater the value of the entropy corresponding to a particular variable, the smaller variable’s weight and the less the discriminate power of this variable in ranking process. In the article the entropy weighting was applied as described by Lotfi and Fallahnejad [52].
The entropy values E j and entropy weights w j for the j-th variable are calculated as:
E j = 1 ln ( m × t ) i = 1 m f i j t f j ln f i j t f j   ( j = 1 ,   2 ,   ,   n ) ,
w j = 1 E j n j = 1 n E j ( j = 1 ,   2 ,   ,   n ) ,
where f j = i = 1 m f i j .
Step 5. Determining the entropy weight for each subcategory (thematic area).
In order to carry out a more detailed analysis of individual aspects of the green economy and establish indexes for specific thematic areas, weights of individual criteria were established within thematic areas w j k as well. Assuming that within each of the k thematic areas the indicator includes s variables, the weights of variables for the calculation of ‘thematic indexes’ were calculated according to the formula:
w j k = w j j = s ( k 1 ) + 1 s w j   ( k = 1 ,   2 ,   3 ,   4 ) .
Step 6. Calculation of the Euclidean distance of regions from the pattern and anti-pattern (ideal and anti-ideal solution) for all variables of the Regional Green Economy Index and thematic areas indexes, according to the formulas:
D i t + =   j = 1 m w j ( y i j t y j + ) 2 ,
D i t = j = 1 m w j ( y i j t y j ) 2 ,
where y j + = 1 is the ideal value for variable j in period t and y j = 0 is the anti-ideal value for the variable j in the examined period t.
The values of the synthetic measure of the green economy were determined for the i-region in the t-year, according to the formula:
R G E I i t = C i t = D i t D i t + + D i t .
The values of the synthetic RGEI and indexes for thematic areas are within the range [0,1]. Higher index values indicate a higher level of development of the green economy (its thematic aspects) in the analysed period in the considered group of regions.
The values of the RGEI indicator in subsequent years have been presented, divided into five individual thematic areas, and a ranking of regions has been established according to the value of the composite index and indexes for thematic areas. The regions were grouped into three classes in terms of index level as well.
Additionally, Ward’s method was used as well to isolate clusters of Polish voivodships due to the similarity in the level of advancement in creating the green economy. Ward’s method is a hierarchical clustering procedure which applies minimum variance criterion to minimize the total within-cluster variance. At each step, the pair of clusters that leads to minimum increase in total within-cluster variance after merging is found. Squared Euclidean distance was applied as a measure of distance between individual objects. Predictive Solutions software by IBM was used.

3. Results

3.1. Ideal and Anti-Ideal Solution and Weights for Variables and Subsystems

In the research procedure, the range of variability for each variable, i.e., the minimum and maximum values of the variable, from those observed in the examined period were adopted as the reference points for normalization (Table 4). The diversity of these values reflects the socio-economic specificity of regions described in the introduction.
The weights obtained for individual variables of the aggregate index were practically equal and ranged from 0.043379 to 0.043534. Therefore, omitting weighting and applying equal weights would give comparable results for the analysed data set. This confirms the recommendation by Gan et al., who recommended equal weights as the most universal weighting method in terms of spatial and temporal scale and possible comparisons [29]. Different weights of individual subsystems resulted from a different number of variables included in each of these subsystems.

3.2. Green Economy Index and Indexes for Thematic Areas in Polish Regions in 2004–2016

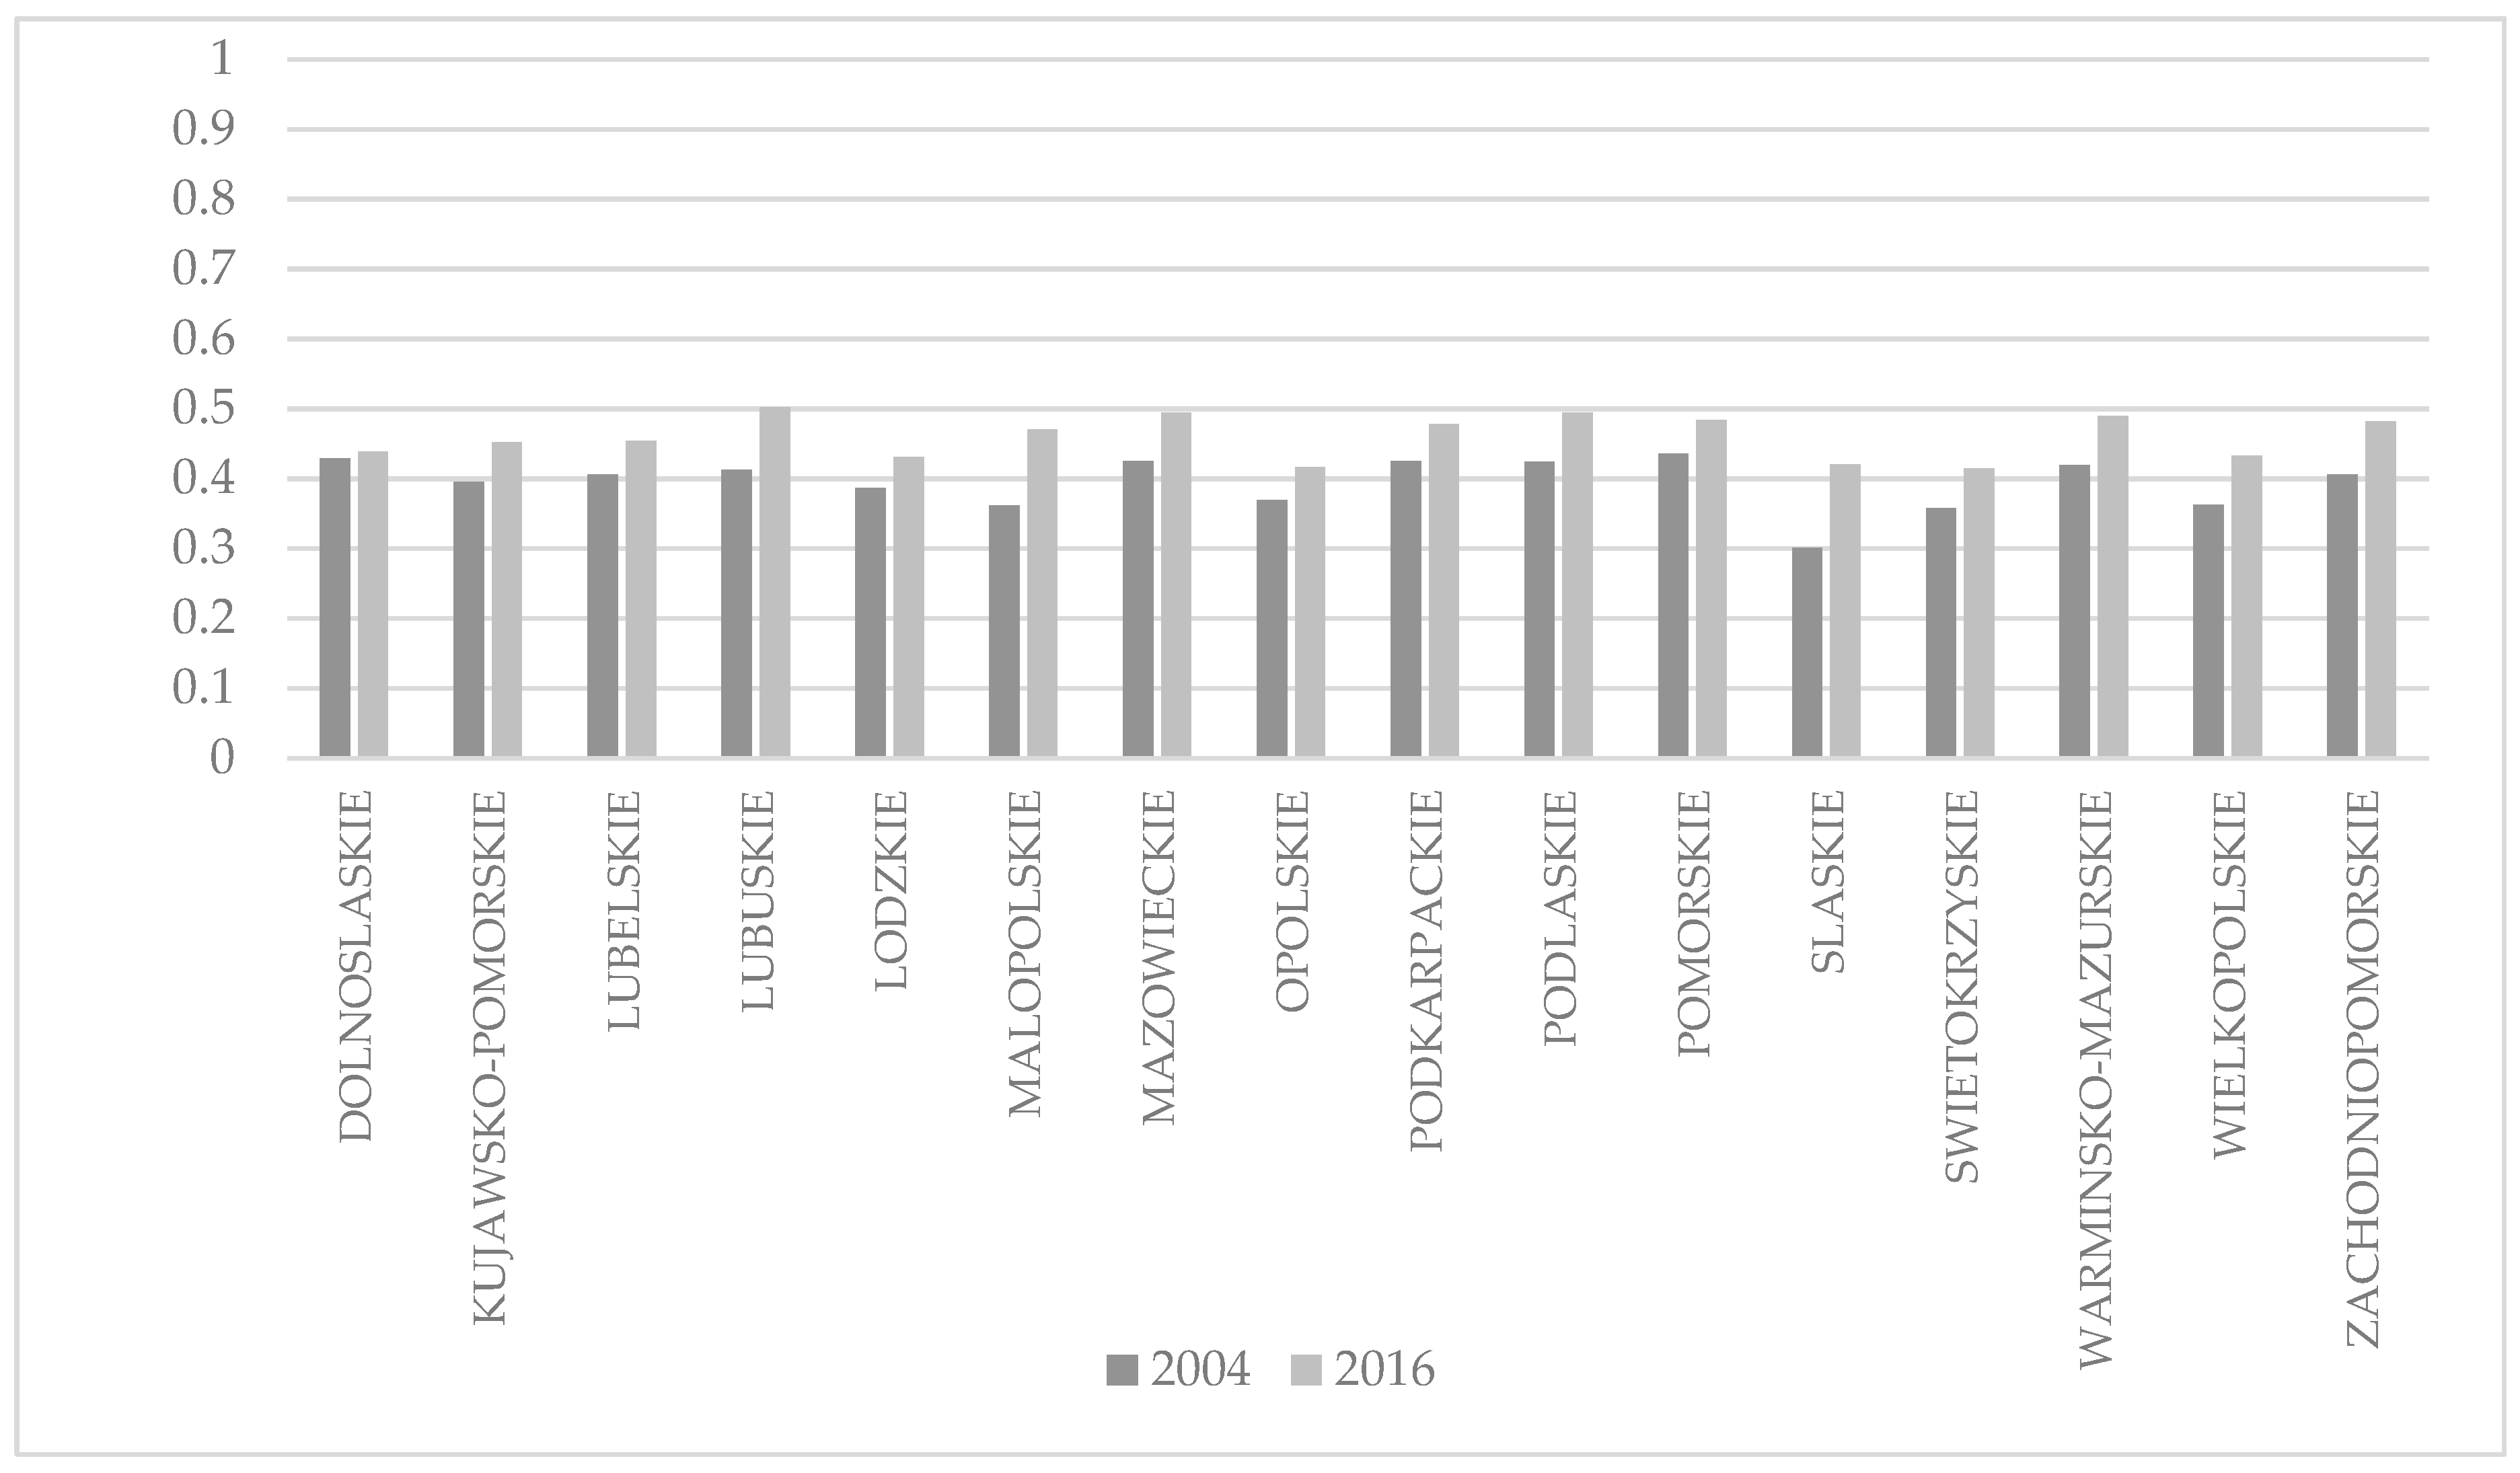
According to RGEI, the most advanced region in terms of the green economy was the Lubuskie voivodship in 2016 (index value 0.502), the second and third were the Podlaskie and Mazowieckie voivodships (0.494), as shown in Figure 2. The Slaskie voivodship had the lowest level of the indicator in 2016 (0.301), which was the level clearly lower in the region, with the second lowest level of the indicator (Swietokrzyskie 0.357).
Given the fact that, in principle, the index can take values in the range of [0,1], the highest values of the indicator observed at the level of 0.5 indicate that there is no region that would have the highest values for all or the vast majority of variables. Regions with high scores in some areas have low scores in different ones and the final level of RGEI is subject to compensation effect during the aggregation procedure. Considering the fact that Lubuskie and Podlaskie regions are less developed, considering GDP per capita (as shown in Figure 1), and Mazowieckie—the most developed—one may conclude that in terms of the Regional Green Economy Index, the low level of GDP per capita is compensated by the smaller negative impact of the economy on the environment and the better quality of the environment.
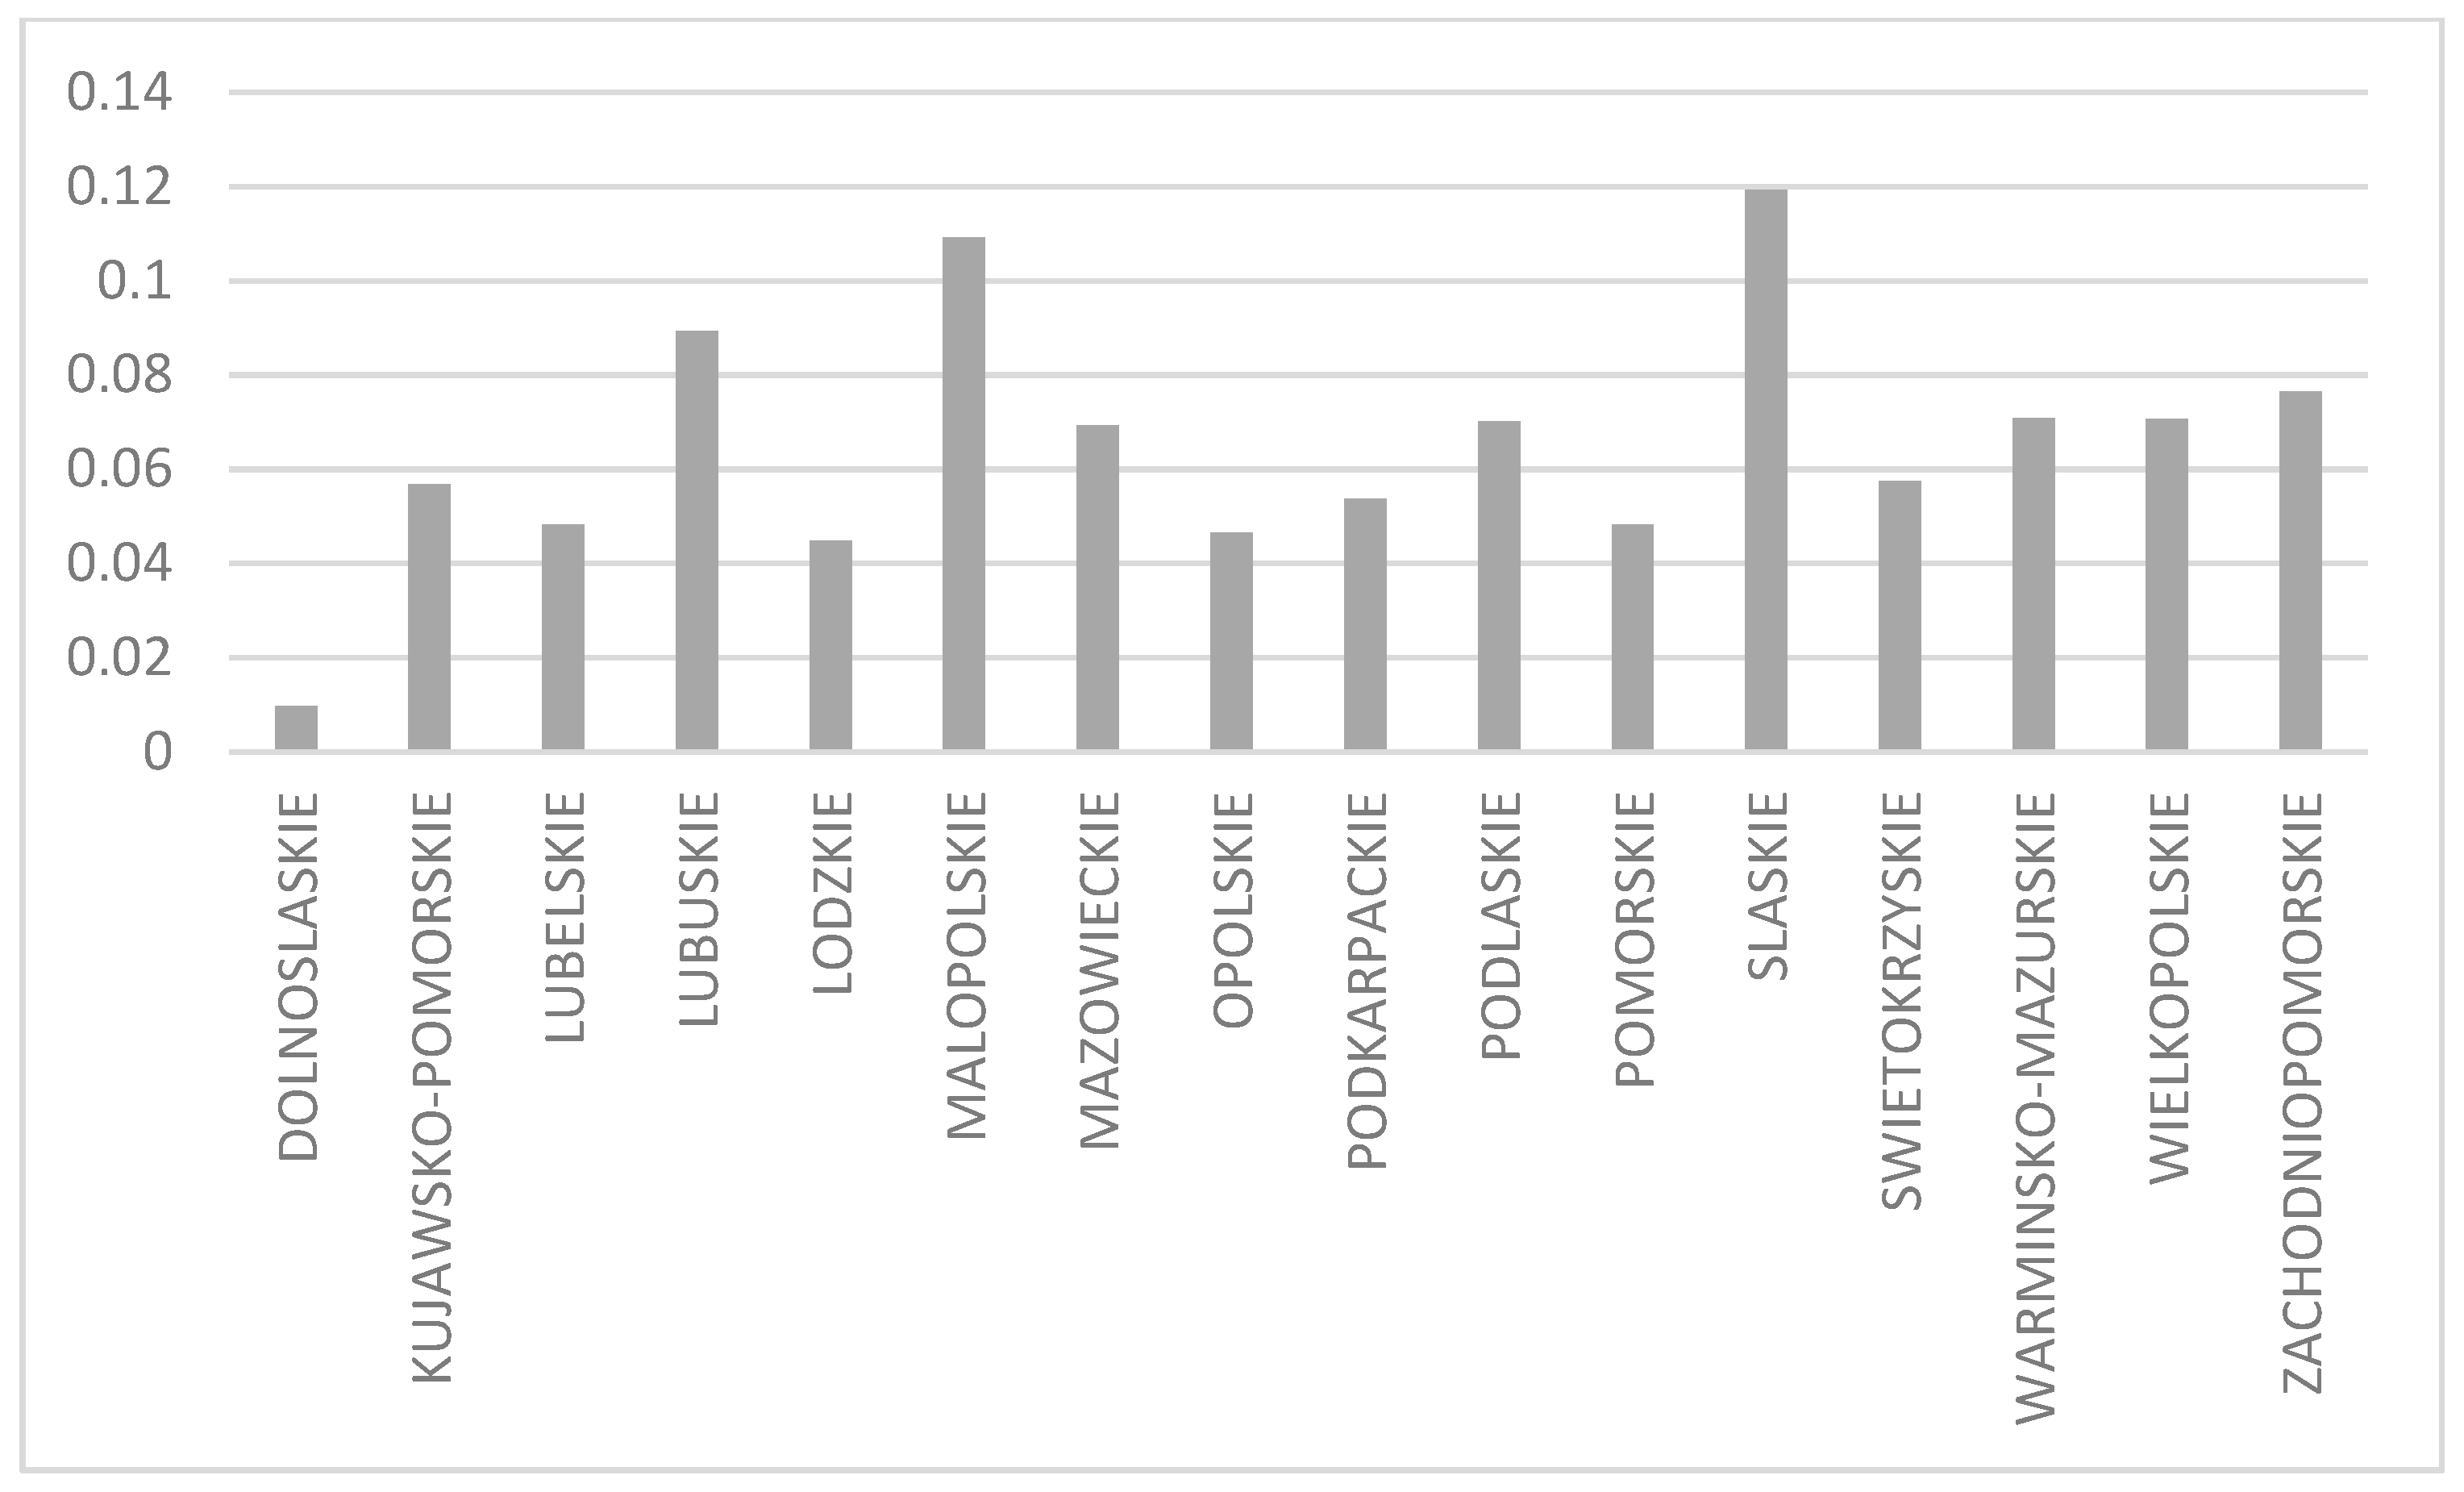
Research results indicate that regions of Poland experience systematic progress in the area of green economy. The Regional Green Economy Index for all regions of the country was higher in 2016 than in 2004. The highest increase in the level of the index was observed in the Slaskie voivodship, which is a large cluster of environmentally harmful industries compared to the rest of the country. As a result of economic changes during the period under study, it was possible to bridge the large gap that divided the Slaskie voivodeship in comparison with other regions, as shown in Figure 3. A similar situation took place in the neighbouring Malopolskie voivodeship.
In order to make the analysis of the issue more thorough, indexes were calculated for five sub-areas related to specific aspects of the green economy (Table 5). In the area of environment and resource productivity, the index values for individual regions increased as well in the period under consideration.
Changes in the base of natural resources had a different character. Only in five out of 16 regions the level of the index increased in the analyzed period. This applies to the following voivodships: Zachodniopomorskie, Warminsko-mazurskie, Podlaskie, Malopolskie and Lubuskie. These are regions with a relatively low (except for the Malopolskie voivodship) share of industry in the economic structure and a significant share of organic farming. It is worrying situation: environmental assets of the majority of regions are depleted and urgent actions are necessary to secure the environmental base for future development.
The environmental dimension of the quality of life in Poland is a difficult issue to assess because there are no data available for regions regarding the population exposed to poor air quality. The index includes three issues: water supply, access to the sewage system, and gas and dust emissions to air. While in the case of water and sewage management in most areas of the country (except mountain areas) over 90% of inhabitants have access to the water supply and sewage system, in the case of air quality, the data included in the index concern gas and dust emissions from large industrial plants. In Poland, however, the main problem is low emission, for which the regional data are not available as part of official statistics. Of course, air quality monitoring is carried out, but available data relate to exceeded levels at the measuring stations and specific zones, not regions.
Available data show that the environmental component of quality of life in some regions is satisfactory in all aspects (the indicator is close to unity), such as in Pomorskie and Zachodniopomorskie voivodships. However, there are regions of southern Poland where poor air quality determines the low level of environmental quality of life (Slaskie and Malopolskie).
In the area of socio-economic conditions, changes and variation of the indicator are typical for all countries. In terms of the level of the indicator, the Mazowieckie Voivodeship, in which the capital of Poland, Warsaw, is located, dominates. Additionally in this region, the dynamics of economic development in the analyzed period was very high, therefore the index values increased relatively as well. In all other regions this indicator increased, but the growth rate was not as high as in the central region. As a result, in terms of economic indicators, the distance between the capital and other regions of the country increased, which, however, did not compensate for the worse results of the Mazowieckie voivodeship in the other areas.

3.3. Ranking of Regions in Terms of Green Economy Indexes

The rankings of voivodships have been established on the basis of the aggregate value of the Regional Green Economy Index and indexes for thematic areas. Table 6 compares the rankings in the first and last years of the period under study.
While in terms of the RGEI level in the analyzed period, there was significant progress in regions with a high concentration of noxious industrial plants (Slaskie, Wielkopolskie and Swietokrzyskie), the ranking of regions with the lowest levels of the indicator did not change significantly: voivodships with the lowest levels of the indicator in 2004 (Slaskie: 16; and Swietokrzyskie: 15) remained the same (Swiętokrzyskie: 16; Slaskie: 15). In these regions, the economy’s efficiency increased significantly (among others due to the dynamic development of the service sector), but their overall economic structure did not change.
The order of regions with the highest levels of the indicator changed within the group of seven units: Pomeranian voivodeship, the first in 2004 was the fifth in 2016, and Lubuskie—the seventh in 2004—was the first in 2016. However, it should be noted that in 2016 the differences between regions narrowed significantly. That is why the order of individual regions in the ranking is not so important.

3.4. Classification of Regions Due to Changes in the Level of the Green Economy Index

For the purpose of cartographical presentation of indicator changes, RGEI index values for each year were divided into three classes, as follows:
  • low: R G E I < R G E I ¯ 0.5 S D ;
  • medium: R G E I ¯ 0.5 S D R G E I < R G E I ¯ + 0.5 S D ;
  • high: R G E I R G E I ¯ + 0.5 S D ,
where R G E I ¯ is the mean Regional Green Economy Index for the whole period and SD is the standard deviation of the RGEI.
The following limits of the index ranges for the analyzed dataset were obtained:
  • low: below 0.4074;
  • medium: between 0.4074 and 0.4471;
  • high: more than 0.4471.
In 2004, nine Polish regions had low levels of the RGEI, while in 2016 there were none (Figure 4). Only one region with the medium level of RGEI in 2004 has not changed its status (Dolnoslaskie, RGEI2004 = 0.4292; RGEI2016 = 0.4389). All other regions made progress to the medium or high level of the RGEI index. The following regions: Kujawsko-Pomorskie, Lubelskie, Malopolskie and Zachodniopomorskie changed their status from ‘low’ to ‘high’.
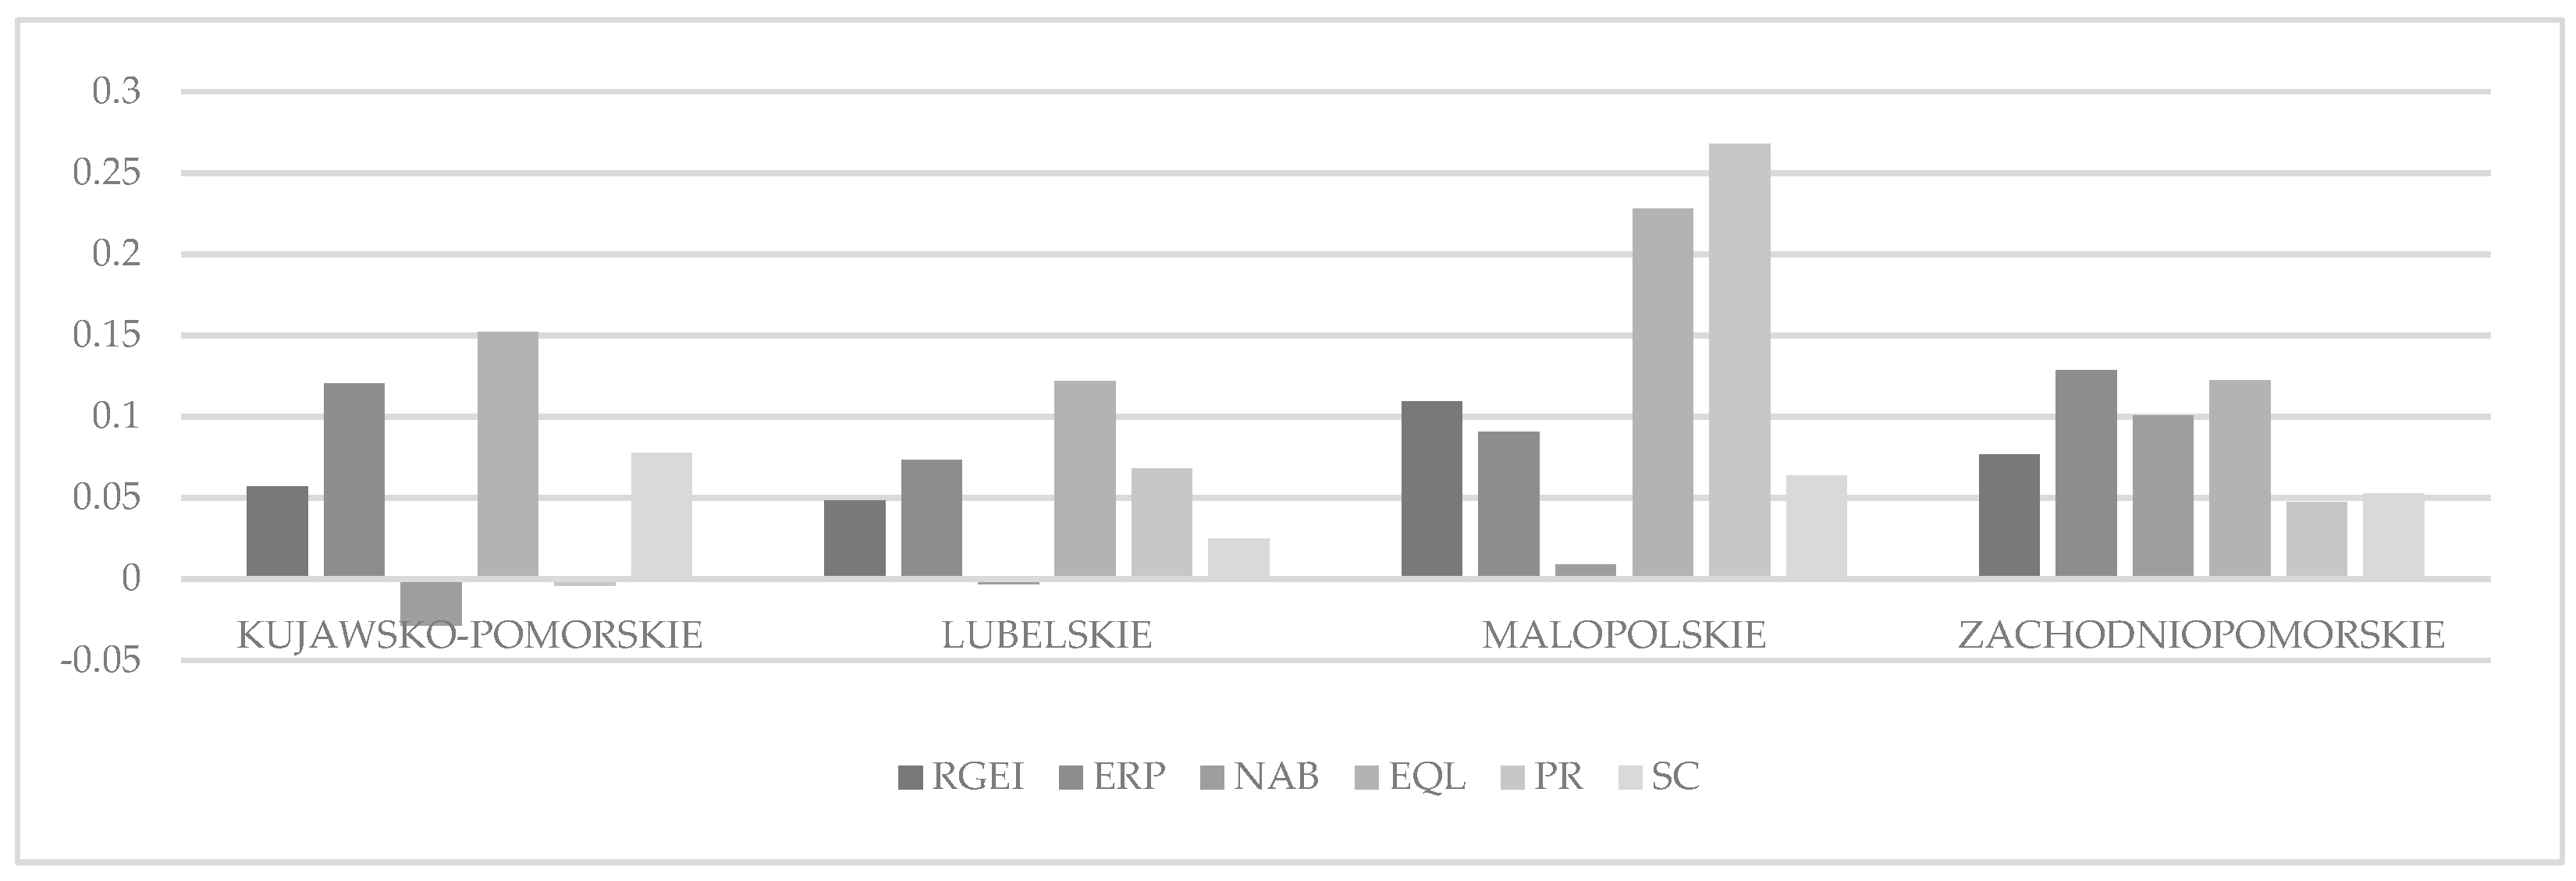
The values of the RGEI for the years 2004 and 2016 show that progress has been made in most regions of the country. When analyzing the four regions where the substantial change was noticed (from low to high level of RGEI), one cannot determine any consistent pattern (Figure 5).
In three regions, the index of the natural assets base has changed slightly, while in the Zachodniopomorskie region, this thematic index significantly increased mainly due to the dynamic development of organic farming. Malopolskie region experienced a significant increase in the indexes of environmental quality of life (due to the reduction of air pollution by the heavy industry) and political response (increase in the number of protected animals and expenditures on energy efficiency and waste management).
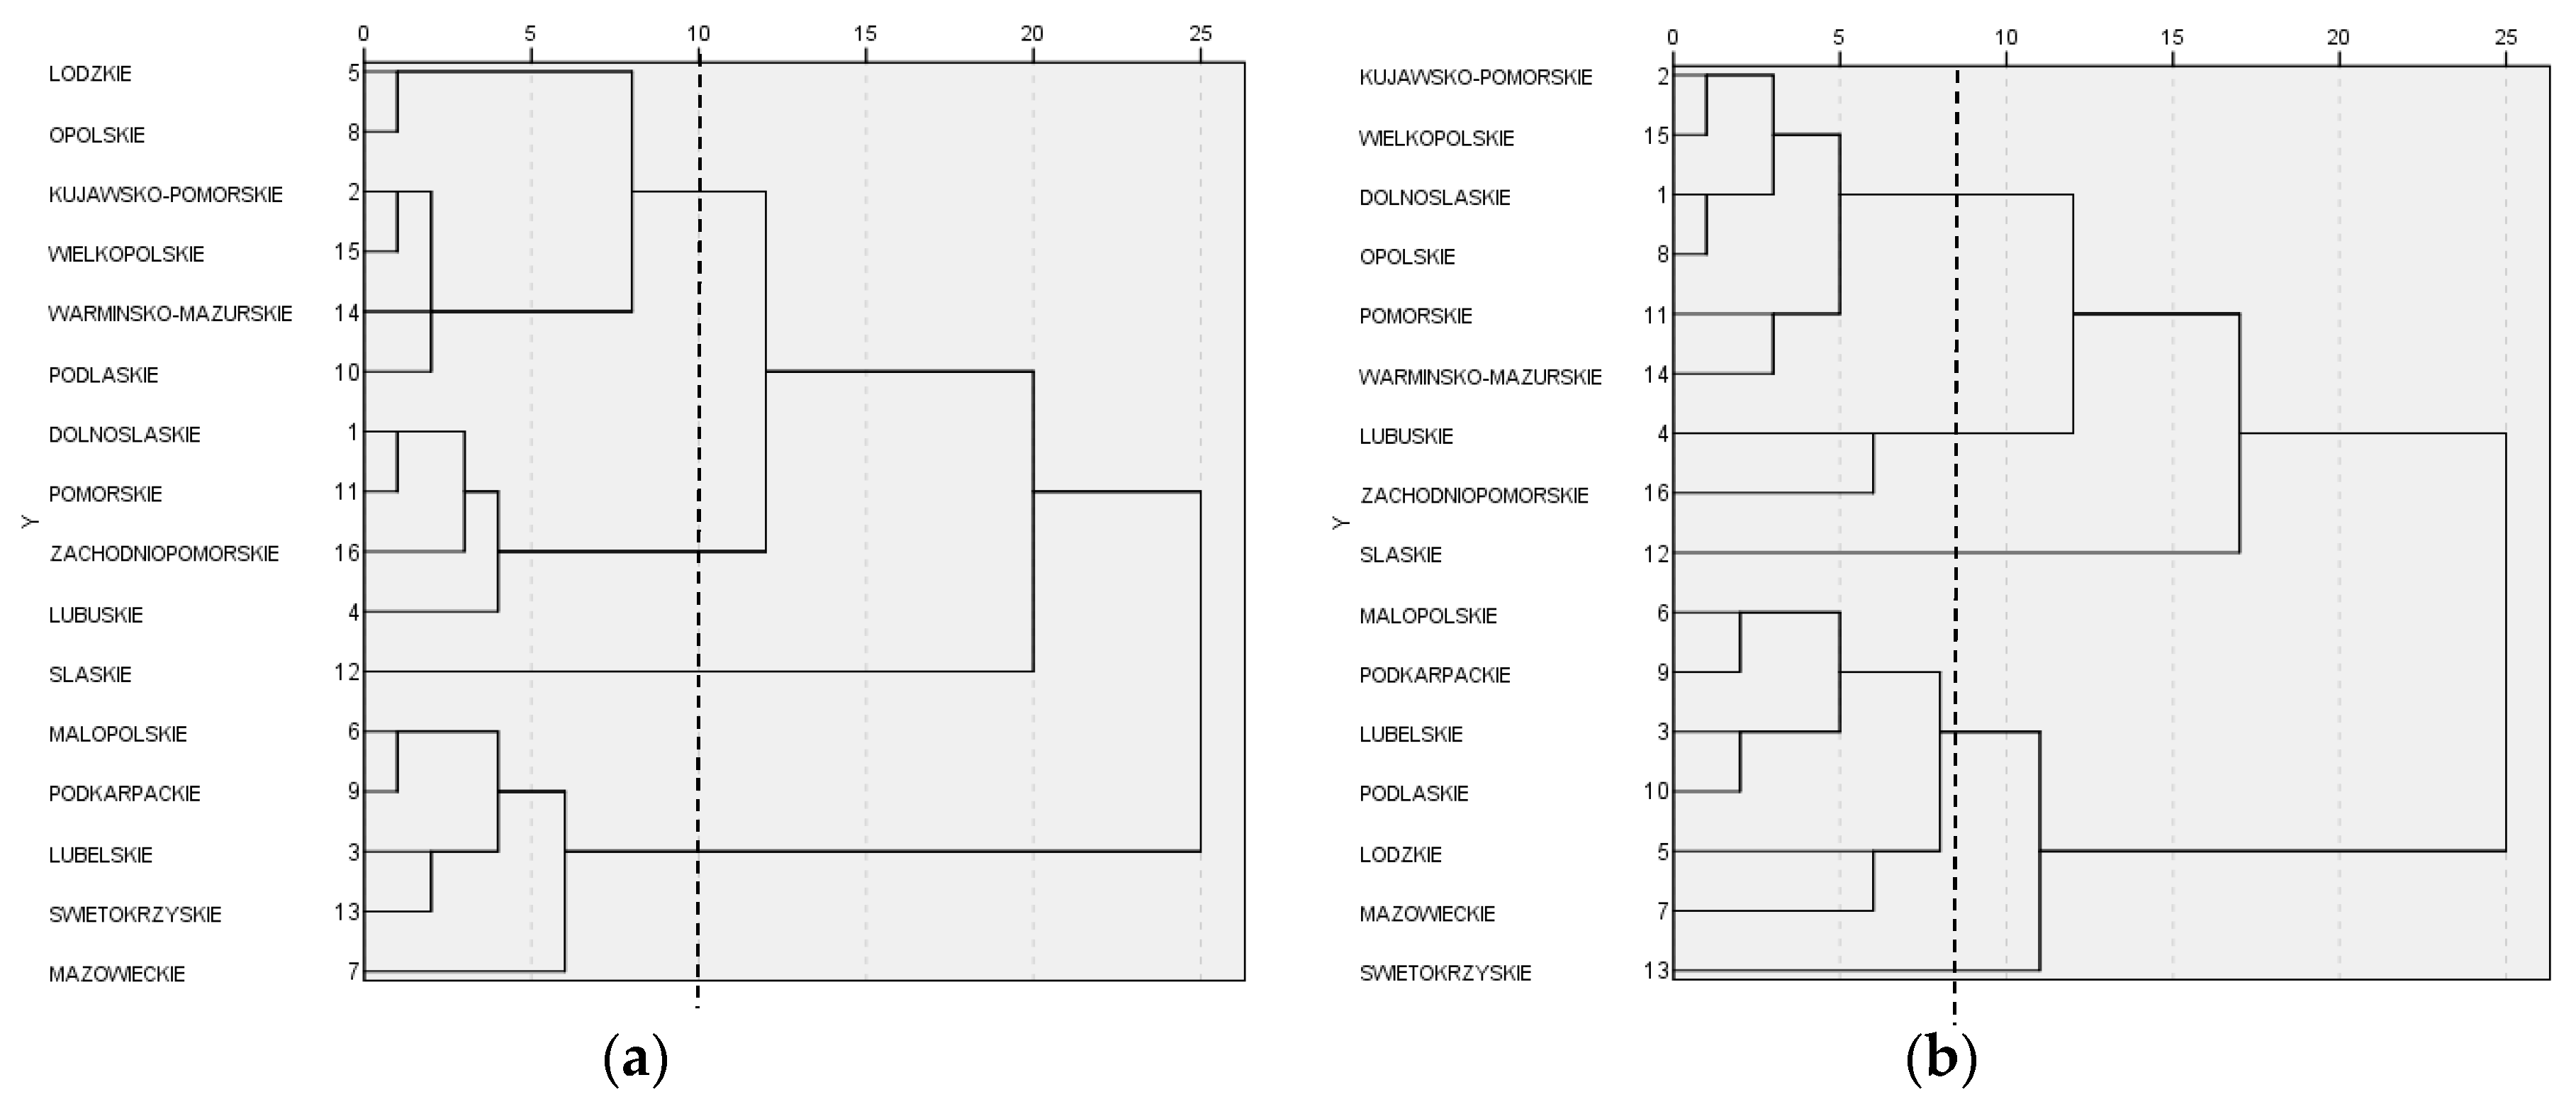
Clustering of regions in terms of RGEI for the two extreme years of the examined period: 2004 and 2016 using Ward’s method gave results consistent with previous conclusions (Figure 6).
In the entire analyzed period, two regions with the lowest level of the indicator—Slaskie and Swietokrzyskie—were outliers in terms of the level of the green economy. In subsequent years, these regions narrowed the distance to the others—but still stood out from them. The analysis of the resulting clusters showed that the similarity of regions in individual years was not stable. Clusters were formed in individual years as part of groups of regions adjacent to each other, and thus somewhat similar in terms of economic structure and environmental conditions, but these groupings were variable. Generally, it can be stated that similarities in terms of the green economy are demonstrated by:
  • regions of south-west Poland: Lubuskie, Zachodniopomorskie (with industrial enclaves, but also relatively less populated and with less transformed environments), followed by Slaskie and Dolnoslaskie (higher urbanized, with a greater role for industry);
  • regions of eastern and south-eastern Poland, less developed economically, with less developed industry, with a greater share of rural areas and agriculture, with urban enclaves (Podlaskie, Lubelskie, Podkarpackie, but also the Malopolskie Voivodeship);
  • central regions with dynamically developing services, with enclave-located industries: Pomorskie, Wielkopolskie, Kujawsko-Pomorskie.
Nevertheless, the key conclusion is that the regions with traditional industrial (Slaskie) and energy (Swietokrzyskie) specialization stand out from the others in terms of the level of greening the economy. A difficult heritage of the centrally planned economy (1945–1989)—the heavy industry and its negative environmental impact still affects the present situation. It contributed to the significantly worse state of the environment and significantly worse initial level of the green economy performance in these regions. The cluster analysis confirmed that at the beginning of the period under consideration, the Slaskie voivodeship stood out from other regions in terms of the RGEI indicator, and largely made up for this distance in the period under study. It was a result of the Polish environmental and economic policy especially in terms of the activities in the field of low-carbon economy. An important role in the overall progress in greening the regions’ economy has been played by the use of EU funds focused on reducing emissions in various sectors of the economy, including the use of renewable energy sources. In the Slaskie region, historically with the highest indicators of air pollution, the positive change caused by i.e., EU regulations is the most visible.

4. Discussion and Conclusions

In the study, similarly to the TOPSIS method of prosperity analysis for Italian regions [30] it has been confirmed that regions adequately to their socio-economic characteristics differ in terms of advancement of the transition to the green economy. They differ in terms of the scale of changes that took place during the period considered as well. This is a result of both natural (natural resources, terrain, location) and historical (concentration of industry or high urbanization in some regions) conditions.
In Poland, as in many countries undergoing economic transformation, the period after 2000, and especially after 2010, was a period of significant acceleration of the transformation towards a green economy. This was largely related to the implementation of the principles and obligations arising from participation in the European Union (water and wastewater management, waste management, energy, including renewable energy). In all current Polish regional strategies, development objectives and tasks related to the key areas of the green economy are present. It should be highlighted that it is rather not a result of the environmental awareness of regional authorities, but the requirements related to the implementation of the EU funds. In the EU’s budgetary period of 2014–2020 the priority areas are: the low-carbon economy, including the use of renewable energy sources, improvement of energy efficiency as well as the introduction of eco-innovation in this area. In the next financial perspective, there will be even more focus on the proper policy planning and evaluation, including appropriate monitoring frameworks, as underlined by the European Commission in its guidelines [53]. The European Commission recommends a more result-oriented approach for EU cohesion funding for the perspective 2014–2020 and this approach will most likely continue in future. Therefore, the results of this paper could be an inspiration to decision-makers to use some new policy evaluation concepts. Composite indexes, including our proposal, could enrich regional strategies evaluation framework by providing an easy to communicate single indicator. The need for further improvement of monitoring systems for regional strategies and regional programs for the use of EU funds is confirmed by studies concerning EU’s financial perspectives 2004–2006 and 2007–2013, by Dvorak [54] and Kupiec, who stated that “most studies were of limited value as they concentrated on the implementation process, not on the effects and justification of intervention” [55]. Similar problems are faced by other EU countries in terms of EU structural funds [56].
The proposed synthetic and dynamic approach is characterized by relatively high transparency and is therefore easy to communicate. It could enrich the range of monitoring measures for regional development—especially given the important role that is assigned to regions in EU countries in planning and managing development (including the transition towards a green economy). The usual sets of indicators monitoring individual goals do not allow for synthesis, which is an advantage of the aggregate indicator as proposed in this work. The modification of the TOPSIS method proposed in this article allowed for a synthetic analysis of progress in the field of green economy of the regions in both spatial and temporal dimensions. Previous analyzes of the regional green economy presented a static approach; various authors proposed calculating green economy indexes for specific periods for different objects, regions or cities. Classical multi-criteria analyses, including the TOPSIS method, allow ranking objects and analyzing changes in this ranking, but they do not allow the assessment of the progress of individual units over time. Our modification of the TOPSIS method overcomes this limitation. The use of common patterns for individual features for all surveyed years (currently adopted in the case of HDI) allows to rank the aggregate indicator values for a given object (in our case the region) calculated for individual periods and thus assess the progress of a given unit. At the same time, on the same scale, one can rank individual objects in a given period and compare them with each other. This approach can be used to modify other similar indicator structures used within multi-criteria methods where there is a need to measure changes over time.
Determining fixed reference values for variables would be an important issue to resolve in further research on the green economy. In an original TOPSIS approach, the positive ideal solution is the one that maximizes the benefit criteria and minimizes the cost criteria while the negative ideal solution (anti-ideal solution maximizes the cost criteria or minimizes the benefit criteria [11]. In this study, the maximum and minimum values of each variable over the period considered were considered as ideal and anti-ideal solution. However, these extreme values of each variable may be outliers. We believe that as part of further work it is worth considering—and determining for each of these variables—these reference values on the basis of detailed research relating to individual phenomena and their significance for the level of development of the green economy, as was done in the case of HDI.

Author Contributions

Conceptualization, J.G. and E.S.-P.; methodology, J.G. and E.S.-P.; data curation and formal analysis J.G. and E.S.-P., investigation, J.G. and E.S.-P.; resources, J.G. and E.S.-P.; writing—original draft, review and editing, J.G. and E.S.-P.; visualization, J.G., E.S.-P.

Funding

This research was funded by the Ministry of Science and Higher Education of the Republic of Poland: funds awarded to the University of Bialystok, Faculty of Economics and Management, grant number BST-401.

Acknowledgments

The authors wish to thank Jacek Marcinkiewicz, Ph.D. for his valuable methodological advice.

Conflicts of Interest

The authors declare no conflict of interest.

References

  1. Roland Berger Strategy Consultants Gmbh. Green Growth, Green Profit. How Green Transformation Boosts Business; Palgrave Macmillan: Basingstoke, UK, 2011; p. 21. [Google Scholar]
  2. Allen, C.; Clouth, S. A guidebook to the Green Economy; UNDESA: New York, NY, USA, 2012; pp. 6–8. [Google Scholar]
  3. Khoshnava, S.M.; Rostami, R.; Zin, R.M.; Štreimikienė, D.; Yousefpour, A.; Strielkowski, W.; Mardani, A. Aligning the Criteria of Green Economy (GE) and Sustainable Development Goals (SDGs) to Implement Sustainable Development. Sustainability 2019, 11, 4615. [Google Scholar] [CrossRef]
  4. Newton, A.C. The green economy and the knowledge economy: Exploring the interface. Int. J. Green Econ. 2011, 5, 231. [Google Scholar] [CrossRef]
  5. Georgeson, L.; Maslin, M.; Poessinouw, M. The global green economy: A review of concepts, definitions, measurement methodologies and their interactions. Geo Geogr. Environ. 2017, 4, e00036. [Google Scholar] [CrossRef]
  6. Ryszawska, B. Green economy—Theoretical Basics of the Concept and Measuring its Implementation in the European Union, (Zielona Gospodarka—Teoretyczne Podstawy Koncepcji i Pomiar jej Wdrażania w Unii Europejskiej); Wroclaw University of Economics: Wroclaw, Poland, 2013; pp. 50–70. [Google Scholar]
  7. Nardo, M.; Saisana, M.; Saltelli, A.; Tarantola, S.; Hoffman, A.; Giovannini, E. Handbook on Constructing Composite Indicators; OECD Publishing: Paris, France, 2005. [Google Scholar]
  8. Saisana, M.; Tarantola, S. State-of-the-Art Report on Current Methodologies and Practices for Composite Indicator Development; European Commission, Joint Research Centre, Institute for the Protection and the Security of the Citizen, Technological and Economic Risk Management Unit: Ispra, Italy, 2002. [Google Scholar]
  9. Vukovic, N.; Pobedinsky, V.; Mityagin, S.; Drozhzhin Mingaleva, Z. A Study on Green Economy Indicators and Modeling: Russian Context. Sustainability 2019, 11, 4629. [Google Scholar] [CrossRef]
  10. Stiglitz, J.E.; Sen, A.; Fitoussi, J.P. Report by the Commission on the Measurement of Economic Performance and Social Progress; Commission on the Measurement of Economic Performance and Social Progress: Paris, France, 2010. [Google Scholar]
  11. Narloch, U.; Kozluk, T.; Lloyd, A. Measuring Inclusive Green Growth at the Country Level. Taking Stock of Measurement Approaches and Indicators; GGKP Working Paper; Green Growth Knowledge Platform, UNEP: Nairobi, Kenya, 2016. [Google Scholar]
  12. United Nations Environment Programme. PAGE Green Economy Progress Measurement Framework. Evaluating National Progress Towards Poverty Eradication and Shared Prosperity within Planetary Boundaries; Partnership for Action on Green Economy, United Nations Environment Programme: Nairobi, Kenya, 2017. [Google Scholar]
  13. Nahman, A.; Mahumani, B.K.; de Lange, W.J. Beyond GDP: Towards a Green Economy Index. Dev. South. Afr. 2016, 33, 215–233. [Google Scholar] [CrossRef]
  14. OECD. Towards Green Growth: Monitoring Progress OECD Indicators; OECD: Paris, France, 2011; pp. 31–35. [Google Scholar]
  15. UNEP. Measuring Progress towards an inclusive Green Economy; UNEP: Nairobi, Kenya, 2012; pp. 9–18. [Google Scholar]
  16. Statistics Poland and Statistical Office in Bialystok. Green Economy Indicators in Poland 2017; Statistics Poland and Statistical Office in Bialystok: Bialystok, Poland, 2017.
  17. Bartolj, T.; Murovec, N.; Slabe-Erker, R. Development of a Household Sustainable Consumption Index and Its Application to EU-28. Sustain. Dev. 2018, 26, 34–50. [Google Scholar] [CrossRef]
  18. Li, M.; Wang, J.; Chen, Y. Evaluation and Influencing Factors of Sustainable Development Capability of Agriculture in Countries along the Belt and Road Route. Sustainability 2019, 11, 2004. [Google Scholar] [CrossRef]
  19. Iddrisu, I.; Bhattacharyya, S.C. Sustainable Energy Development Index: A multi-dimensional indicator for measuring sustainable energy development. Renew. Sustain. Energy Rev. 2015, 50, 513–530. [Google Scholar] [CrossRef] [Green Version]
  20. Bandura, R. Composite indicators and rankings: Inventory 2011; Technical report; Office of Development Studies, United Nations Development Programme (UNDP): New York, NY, USA, 2011. [Google Scholar]
  21. Yang, L. An inventory of composite measures of human progress, Technical report; United Nations Development Programme Human Development Report Office: New York, NY, USA, 2014. [Google Scholar]
  22. Global Green Economy Index: Dual Citizen Inc. Available online: dualcitizeninc.com/global-green-economy-index/economic-environmental-indicators.php?id=3 (accessed on 24 July 2019).
  23. Ryszawska, B. Green Economy Indicators. In Towards a green economy. From ideas to practice; Burchard-Dziubińska, M., Ed.; Wydawnictwo Uniwersytetu Lodzkiego: Lodz, Poland, 2015. [Google Scholar]
  24. Hellwig, Z. Wielowymiarowa analiza porównawcza i jej zastosowanie w badaniach wielowymiarowych obiektów gospodarczych. (Multidimensional comparative analysis and its application in research on multidimensional economic objects), (chapter in Polish); In Metody i Modele Ekonomiczno-Matematyczne w Doskonaleniu Zarządzania Gospodarką Socjalistyczną; Welfe, W., Ed.; PWE: Warszawa, Poland, 1981; pp. 46–68. [Google Scholar]
  25. Hwang, C.-L.; Yoon, K. Multiple Attribute Decision Making: Methods and Applications A State-of-the-Art Survey. In Lecture Notes in Economics and Mathematical Systems; Springer: Berlin/Heidelberg, Germany, 1981. [Google Scholar]
  26. Van De Kerk, G.; Manuel, A. Short Survey of Relevant Indexes and Sets of Indicators Concerning Development towards Sustainability; Northern Alliance for Sustainability: Brussels, Belgium, 2010. [Google Scholar]
  27. Decancq, K.; Lugo, M.A. Weights in Multidimensional Indices of Wellbeing: An Overview. Econom. Rev. 2013, 32, 7–34. [Google Scholar] [CrossRef]
  28. Diakoulaki, D.; Mavrotas, G.; Papayannakis, L. Determining objective weights in multiple criteria problems: The critic method. Comput. Oper. Res. 1995, 22, 763–770. [Google Scholar] [CrossRef]
  29. Gan, X.; Fernandez, I.; Guo, J.; Wilson, M.; Zhao, Y.; Zhou, B.-B.; Wu, J. When to use what: Methods for weighting and aggregating sustainability indicators. Ecol. Indic. 2017, 81, 491–502. [Google Scholar] [CrossRef]
  30. Carbonaro, I. Measuring Italian well-being by modified TOPSIS. In Proceedings of the 58th World Statistical Congress, Dublin, Ireland, 21–26 August 2011; pp. 4079–4084. [Google Scholar]
  31. Wang, M.; Zhao, X.; Gong, Q.; Ji, Z. Measurement of Regional Green Economy Sustainable Development Ability Based on Entropy Weight-Topsis-Coupling Coordination Degree—A Case Study in Shandong Province, China. Sustainability 2019, 11, 280. [Google Scholar] [CrossRef]
  32. Communication from the Commission EUROPE 2020 A strategy for smart, sustainable and inclusive growth, European Commission Brussels, 3.3.2010 COM(2010) 2020. Available online: https://eur-lex.europa.eu/legal-content/en/ALL/?uri=CELEX%3A52010DC2020 (accessed on 11 April 2019).
  33. European Parliament resolution of 15 March 2012 on a Roadmap for moving to a competitive low carbon economy in 2050, 2011/2095(INI). Available online: https://eur-lex.europa.eu/legal-content/en/ALL/?uri=CELEX:52011DC0112 (accessed on 11 April 2019).
  34. Communication from the Commission to the European Parliament, the Council, the European Economic and Social Committee and the Committee of the Regions Roadmap to a Resource Efficient Europe, COM/2011/0571 final. Available online: https://eur-lex.europa.eu/legal-content/EN/TXT/?uri=CELEX%3A52011DC0571 (accessed on 11 April 2019).
  35. Communication from the Commission to the European Parliament, the Council, the European Economic and Social Committee and the Committee of the Regions: Closing the loop - An EU action plan for the Circular Economy, COM/2015/0614 final. Available online: https://eur-lex.europa.eu/legal-content/EN/TXT/?uri=CELEX%3A52015DC0614 (accessed on 12 April 2019).
  36. EU Cohesion Policy 2014–2020, Targeting Investments on Key Growth Priorities, European Commission 2013. Available online: https://ec.europa.eu/regional_policy/sources/docgener/informat/2014/fiche_low_carbon_en.pdf (accessed on 30 August 2019).
  37. Roszkowska, E.; Filipowicz-Chomko, M. Ocena realizacji koncepcji zrównoważonego rozwoju województw Polski w zakresie poziomu rozwoju społecznego w roku 2005 oraz 2013. Optimum 2016, 3, 94–118. [Google Scholar] [CrossRef]
  38. Iwacewicz-Orłowska, A.; Sokołowska, D. Ocena realizacji koncepcji zrównoważonego rozwoju w podregionach województw Polski Wschodniej z wykorzystaniem metody wzorca rozwoju Hellwiga. Optimum 2016, 1, 182–197. [Google Scholar] [CrossRef]
  39. Perło, D. Modelling green economy in the Podlaskie province as a management tool of sustainable development of the region (article in Polish). Zarządzanie Finans. 2013, 11, 207–224. [Google Scholar]
  40. Li, X.; Pan, J. China Green Development Index Report 2012; Springer: Berlin, Germany, 2013. [Google Scholar]
  41. Li, J.; Lin, B. Green Economy Performance and Green Productivity Growth in China’s Cities: Measures and Policy Implication. Sustainability 2016, 8, 947. [Google Scholar] [CrossRef]
  42. Wei, C.; Ni, J.; Du, L. Regional allocation of carbon dioxide abatement in China. China Econ. Rev. 2012, 23, 552–565. [Google Scholar] [CrossRef]
  43. Su, M.; Li, R.; Lu, W.; Chen, C.; Chen, B.; Yang, Z. Evaluation of a Low-Carbon City: Method and Application. Entropy 2013, 15, 1171–1185. [Google Scholar] [CrossRef]
  44. Shi, B.; Yang, H.; Wang, J.; Zhao, J. City Green Economy Evaluation: Empirical Evidence from 15 Sub-Provincial Cities in China. Sustainability 2016, 8, 551. [Google Scholar] [CrossRef]
  45. Shi, L.; Xiang, X.; Zhu, W.; Gao, L. Standardization of the Evaluation Index System for Low-Carbon Cities in China: A Case Study of Xiamen. Sustainability 2018, 10, 3751. [Google Scholar] [CrossRef]
  46. STRATEG. Available online: https://strateg.stat.gov.pl (accessed on 12 July 2019).
  47. Statistics Poland. Statistical Yearbook of the Regions—Poland; Statistics Poland: Warsaw, Poland, 2017.
  48. United Nations. Human Development Report 2014. Technical notes; United Nations: San Francisco, CA, USA, 2014.
  49. Kahneman, D.; Deaton, A. High income improves evaluation of life but not emotional well-being. Proc. Natl. Acad. Sci. USA 2010, 107, 16489. [Google Scholar] [CrossRef] [PubMed]
  50. Roszkowska, E.; Lašakevič, R. Taxonomic analysis of development disparities of Lithuanian labour market in 2004–2014 (paper in Polish). Optim. Econ. Stud. 2018, 6, 42–61. [Google Scholar] [CrossRef]
  51. Młodak, A. Taxonomic Analysis in Regional Statistics; (Analiza Taksonomiczna w Statystyce Regionalnej); Difin: Warszawa, Poland, 2006; pp. 28–33. [Google Scholar]
  52. Lotfi, F.H.; Fallahnejad, R. Imprecise Shannon’s Entropy and Multi Attribute Decision Making. Entropy 2010, 12, 53–62. [Google Scholar] [CrossRef]
  53. Guidance Document on Evaluation Plans. Terms of Reference for Impact Evaluations. Guidance on Quality Management of External Evaluations, European Commission, DG Regional and Urban Policy, Brussels 2015. Available online: https://ec.europa.eu/regional_policy/sources/docoffic/2014/working/evaluation_plan_guidance_en.pdf (accessed on 4 September 2019).
  54. Dvorak, J. Evaluation of the European Union structural funds’ support in Poland: Scope and significance. Balt. J. Law Politics 2010, 3, 53–75. [Google Scholar] [CrossRef]
  55. Kupiec, T. Evaluation Practice of Regional Operational Programmes in Poland. Manag. Bus. Adm. Cent. Eur. 2014, 126, 135–151. [Google Scholar] [CrossRef]
  56. Nigohosyan, D.; Vutsova, A. The 2014–2020 European Regional Development Fund Indicators: The Incomplete Evolution. Soc. Indic. Res. 2018, 137, 559–577. [Google Scholar] [CrossRef]
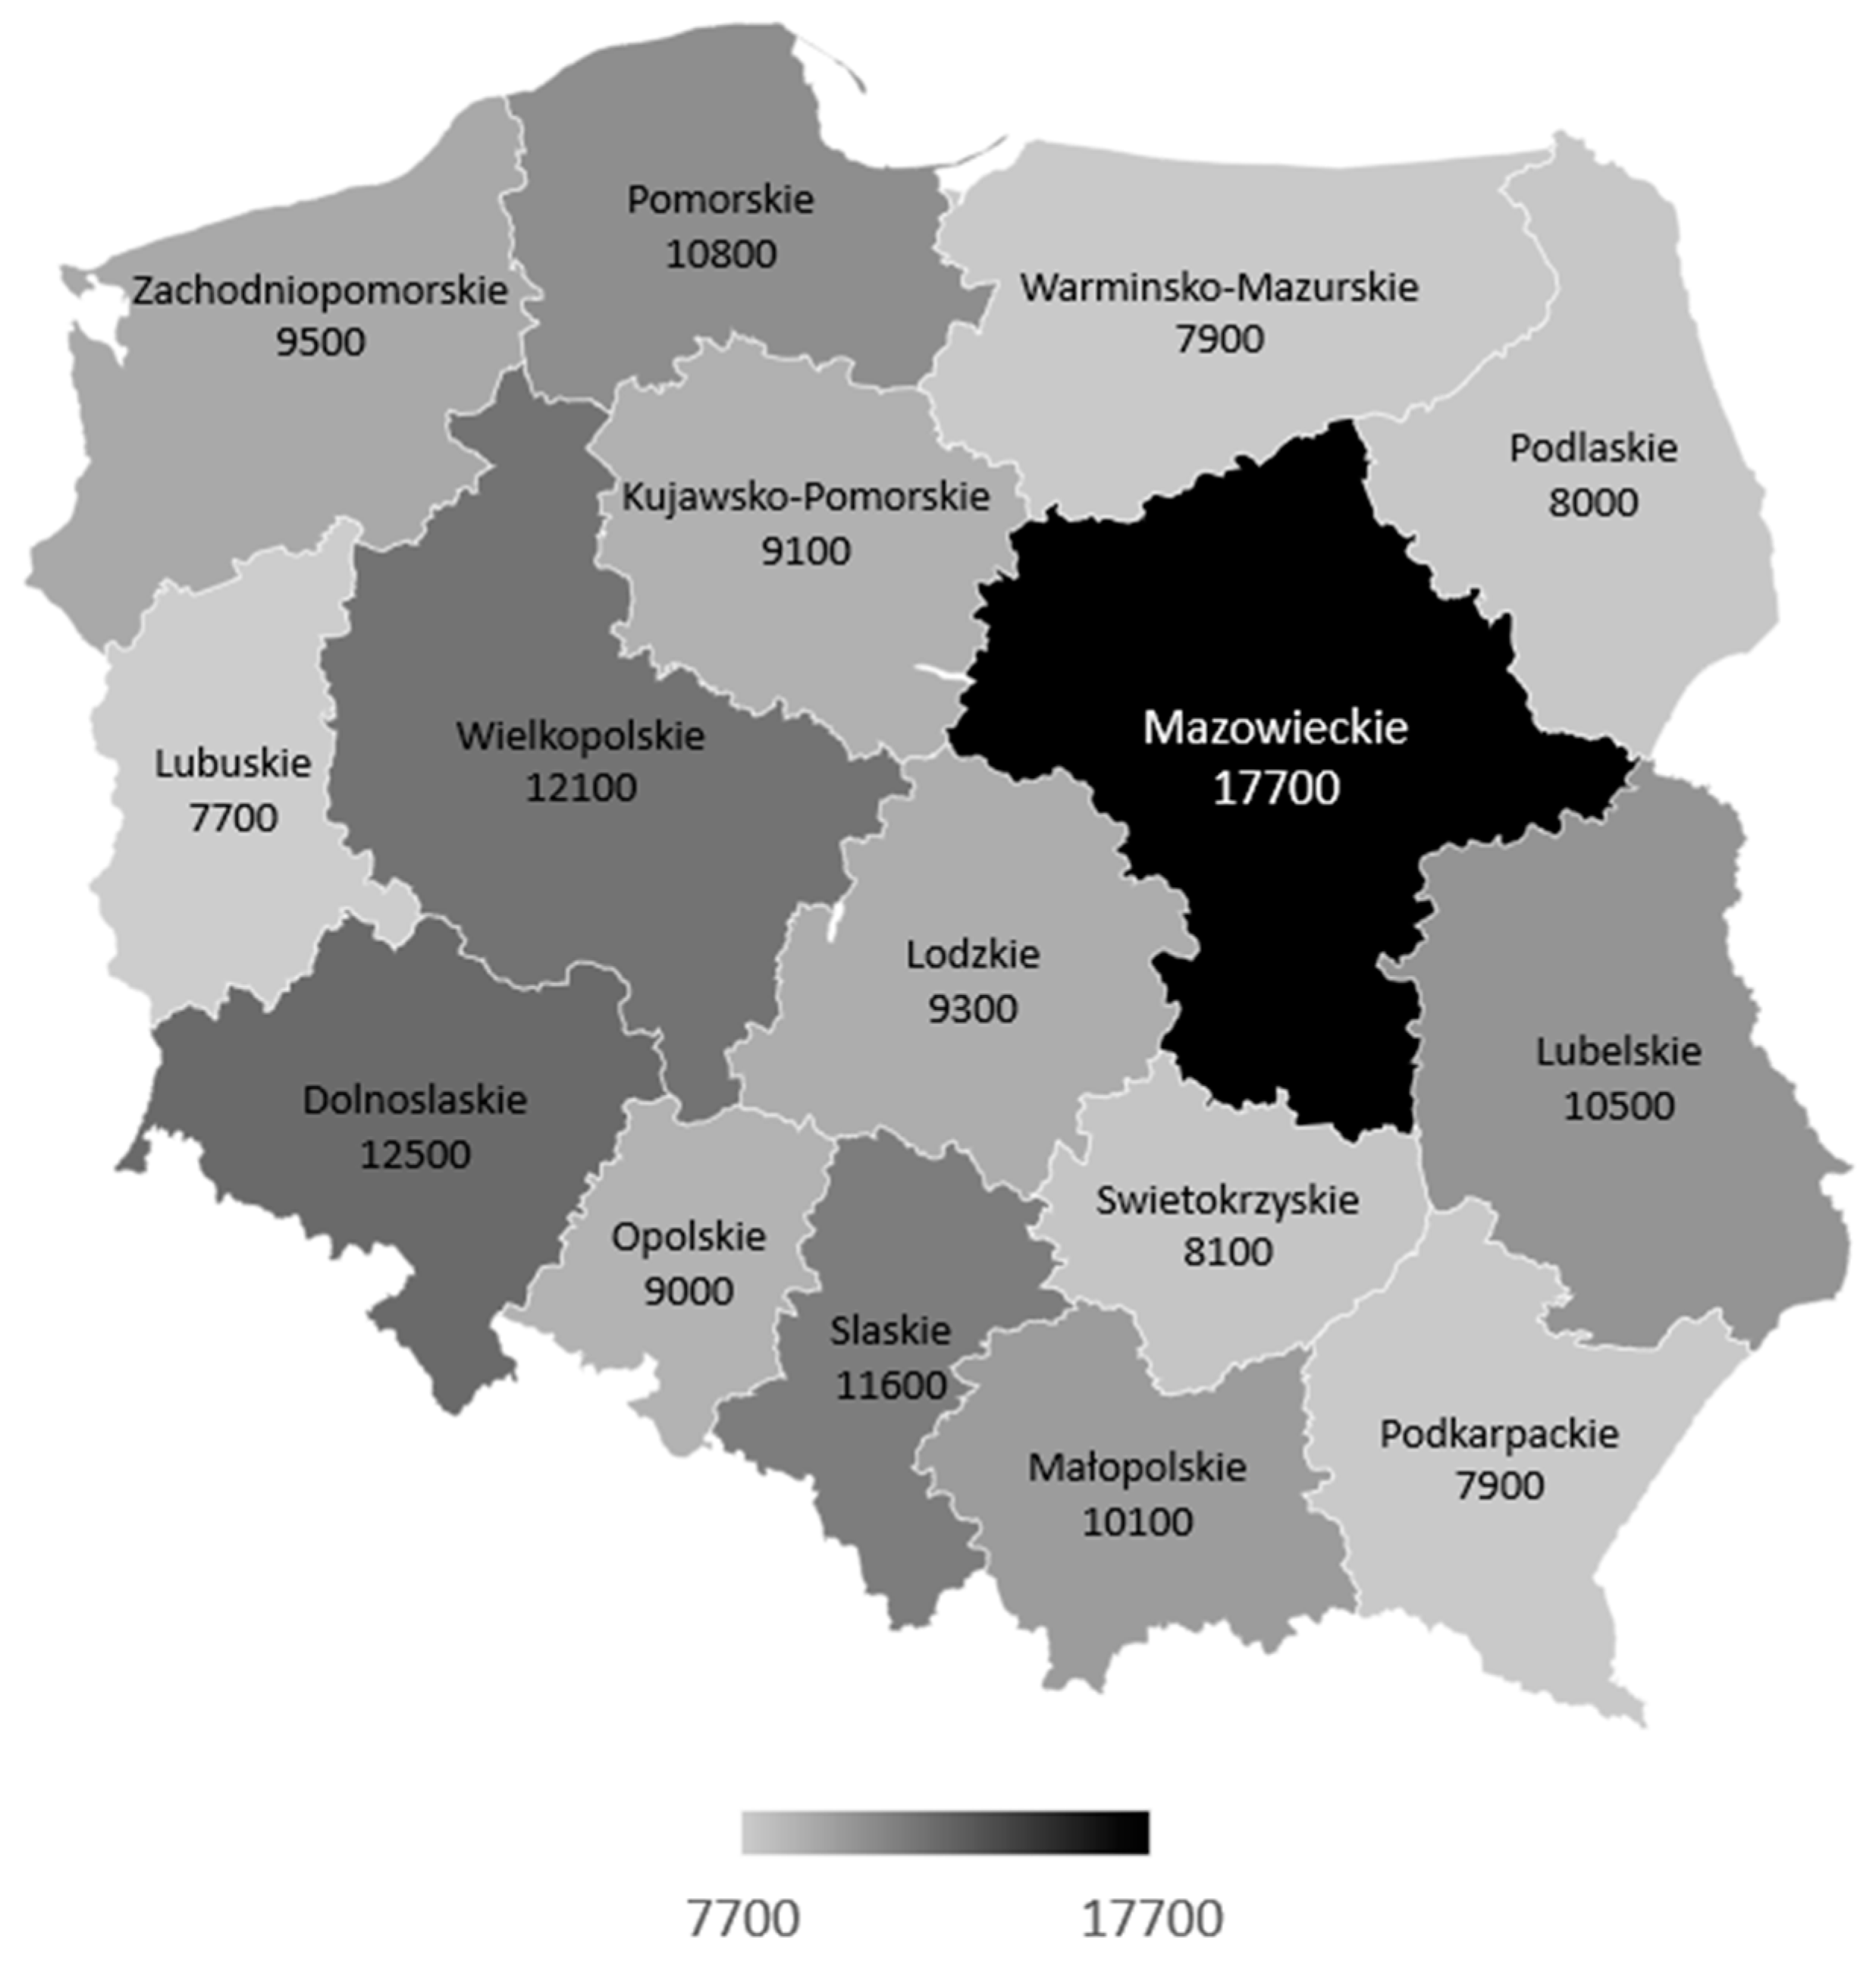
Figure 1. Regional GDP per capita (EUR, current prices, 2016), extracted from Eurostat.
Sustainability 11 05098 g001
Figure 2. Regional Green Economy Index in the years 2004 and 2016.
Sustainability 11 05098 g002
Figure 3. Change in values of the Regional Green Economy Index 2004–2016.
Sustainability 11 05098 g003
Figure 4. Regional Green Economy Index ranges in (a) 2004 and (b) 2016.
Sustainability 11 05098 g004
Figure 5. Change in RGEI and indexes for thematic areas 2004 and 2016 for the regions with the largest change in RGEI status.
Sustainability 11 05098 g005
Figure 6. Dendrograms using Ward linkage (rescaled distance cluster combine) (a) 2004 and (b)2016.
Sustainability 11 05098 g006
Table 1. Design of composite green economy indexes.
AspectsGlobal Green Economy IndexGreen Economy IndexGreen Economy Progress IndexGreen Growth Index
Subdomains covered/indicatorsLeadership and climate change, efficiency sectors, markets and investment, environment. Total of 20 indicatorsTotal of 26 indicators (currently data available for 20 indicators)Total of 13 indicatorsNatural assets, resource efficiency and decoupling, risks and resilience, economic opportunities/efforts, inclusiveness. Total of 15 indicators
Normalization (standardisation) methodZ-score and associated percentilesMin-max [0–10], values for minimum and maximum based on natural or target minima and maxima, if possibleRelative distance between the actual change observed and the desired change (target) of an indicator with respect to a threshold for the indicatorMin-max [0–1], values for minimum and maximum thresholds based on international standards or targets; adjustment for outliers and scaling
WeightingEqual weights except for the Leadership and climate change dimensionEqual weightsIndividual weights for countriesUnder discussion
Form of final result0–1000–10<0 regress
<−1 high regress
>0 progress
1—target met
>1—high progress
0–1
Table 2. Selected indicators of socio-economic development of regions in Poland (in 2016).
RegionPopulation [In Thousands]Index of Urbanization [%]GDP per Inhabitant in Relation to the National Average [%]Sold Production of Industry [%]Protected Natural Area [% of Grand Total Area]
Poland38,433.060.2100.0100.032.5
Dolnoslaskie2903.769.0110.89.018.6
Kujawsko-Pomorskie2083.959.581.64.231.8
Lubelskie2133.346.468.92.822.8
Lubuskie1017.464.983.92.538.1
Lodzkie2485.362.993.35.819.7
Małopolskie3382.348.490.66.953.0
Mazowieckie5365.964.3159.719.029.7
Opolskie993.051.979.61.927.7
Podkarpackie2127.741.270.43.344.9
Podlaskie1186.660.770.81.831.6
Pomorskie2315.664.296.96.732.7
Slaskie4559.277.0103.616.622.0
Swietokrzyskie1252.944.671.51.964.6
Warminsko-Mazurskie1436.459.071.32.446.7
Wielkopolskie3481.654.7109.112.231.6
Zachodniopomorskie1708.268.583.83.021.9
Table 3. Variables included in the Regional Green Economy Index.
SubsystemOECD IndicatorRegional Indicator for PolandUnitIndicator Type (+/-)Selection Decision
Environmental and resource productivity (ERP)Production-based CO2 productivity, GDP per unit of energy-related CO2 emissionsProduction-based CO2 productivity, GDP per unit of CO2 emissions from plants especially noxious to air purityPLN(2004) per kg CO2+Excluded by correlation
Production-based CO2 intensity, energy-related CO2 per capitaProduction-based CO2 intensity, CO2 emissions from plants especially noxious to air purity per capitatonnes per person_Included
Energy productivity, GDP per unit of TPESEnergy productivity, GDP per electric energy consumption PLN(2004) per kWh+Included
Energy intensity, TPES per capitaElectric energy consumption per capitakWh per person_Excluded by correlation
Renewable electricity, % total electricity generationShare of renewable energy sources in total consumption of electricity%+Included
Nitrogen balance, kg per hectareConsumption of nitrogenous (N) fertilizers per 1 ha of agricultural land kg/ha_Included
Phosphorus balance, kg per hectareConsumption of phosphatic (P2O5) fertilizers per 1 ha of agricultural landkg/ha_Excluded by correlation
Municipal waste generated, kg per capitaMunicipal waste collected during the year per capitakg per person_Included
Municipal waste disposed to landfills, % treated wasteWaste landfilled in relation to the mixed municipal waste collected%_Included
Municipal waste recycled or composted, % treated wasteWaste collected separately in relation to the total municipal waste collected%+Excluded by correlation
Natural asset base (NAB)Total freshwater abstraction per capitaConsumption of water per capita m3 per person_Included
Natural and semi-natural vegetated land, % totalNatural and semi-natural vegetated areas (forests and ecological areas)% of total area+Included
Bare land, % totalWaste land% of total area-Excluded by correlation
Cropland, % totalAgricultural land % of total area+Included
Artificial surfaces, % totalBuilt-up and urbanized areas% of total area-Excluded by correlation
Water, % totalLands under waters% of total area+Excluded by correlation
-Organic farming% of agricultural land+Included
Intensity of use of forests resourcesWood extractionm3 of wood per ha of forests-Included
Environmental dimension of quality of life (EDQL)Exposure to air pollutionEmission of air pollutants-gases (excluding CO2)tonnes per 1 km2 of area-Included
Percentage of population exposed to more than 35 micrograms/m3Emission of air pollutants—particulatestonnes per 1 km2 of area-Included
Population with access to improved drinking water sources, % total populationPopulation connected to water supply systems% of total population+Included
Population connected to public sewerage, % total populationPopulation connected to sewerage systems, % of total population+Included
Population connected to sewerage with tertiary treatment, % total populationPopulation connected to wastewater treatment plants with increased biogene removal, % of population% of total population+Excluded by correlation
Economic opportunities and policy responses (EOPR)-Regeneration and afforestation in relation to forest area%+Included
Threatened mammal/bird/vascular plant species, % total known speciesNumber of protected animalsIndex, 2004 = 100+Included
Renewable energy public RD and D budget, % total energy public RD and DOutlays on fixed assets related to energy savings % GDP+Included
-Outlays on fixed assets related to waste management, % GDP% GDP+Included
Socio-economic context (SEC)Value added in agriculture, % of total gross value addedValue added in agriculture% of total value added-Included
Value added in industry, % of total gross value addedValue added in industry% of total value added-Excluded by correlation
Value added in services, % of total gross value addedValue added in services% of total value added+Included
Gross domestic product per capitaReal GDP per capitaPLN (2004) per capita+Included
Population density, person per 1 km2Population densityinhabitants per km2-Included
Table 4. Ideal and anti-ideal solution and weights for variables and subsystems.
SubsystemVariableMaxMinWeightWeight of an Index for a SubsystemWeight of a Variable within a Subsystem
Environmental and resource productivityProduction-based CO2 intensity, CO2 emissions from plants especially noxious to air purity, [tonnes per capita]17.04 (Lodzkie 2013)0.95 (Warminsko-Mazurskie 2011)0.0435150.2607870.166859
Energy productivity, GDP per electric energy consumption, [PLN 2004/1 kWh]21.58 (Mazowieckie 2015)5.29 (Opolskie 2006)0.043490.166765
Share of renewable energy sources in total consumption of electricity, [%]63.82 (Zachodnio—pomorskie 2015)0.08 (Lubelskie 2004)0.0433790.166338
Consumption of nitrogenous (N) fertilizers per 1 ha of agricultural land [kg/ha]129.70 (Opolskie 2011)30.82 (Podkarpackie 2004)0.043520.166879
Municipal waste collected during the year per capita [kg/person]360.62 (Dolnoslaskie 2011)132.31 (Swietokrzyskie 2013)0.0434960.166786
Waste landfilled in relation to the mixed municipal waste collected [%]100.00 (Lubelskie. Opolskie. Podkarpackie. Swietokrzyskie 2004)29.90 (Malopolskie 2016)0.0433880.166373
Natural asset baseConsumption of water per capita [m3/person]1129.34 (Swietokrzyskie 2016)64.51 (Podlaskie 2004)0.0435150.2173730.200186
Forests and ecological areas, [% of total area]51.63 (Lubuskie 2016)21.04 (Lodzkie 2004)0.0434640.199951
Agricultural land total, [% of total area]72.27) (Lodzkie 2004)40.33 (Lubuskie 2016)0.0435030.200129
Organic farming [% of agricultural land]15.59 (Zachodnio-pomorskie 2016)0.08 (Opolskie 2004)0.0433910.199614
Intensity of use of forests resources, wood extraction [m3 of per ha of forests]5.96 (Slaskie 2007)2.34 (Mazowieckie 2006)0.0435010.20012
Environmental dimension of quality of lifePopulation connected to water supply systems [% of population]96.80 (Opolskie 2016)71.40 (Malopolskie 2004)0.0435130.1740750.250408
Population connected to sewerage systems [% of population]82.90 (Pomorskie 2016)43.00 (Swietokrzyskie 2004)0.0435030.25035
Emission of air pollutants-gases (excluding CO2) [t per 1 km2 of area]62.81 (Slaskie 2015)0.35 (Warminsko-Mazurskie 2014)0.0435250.250473
Emission of air pollutants—particulates [t per 1 km2 of area]2.15 (Slaskie 2004)0.03 (Warminsko-Mazurskie 2016)0.0435340.250525
Policy responcesRegeneration and afforestations in relation to forest area [%]1.19 (Warminsko-mazurskie 2006)0.30 (Podlaskie 2009)0.0435040.173770.250355
Number of protected animals, index [2004 = 100]1364.74 (Slaskie 2016)21.55 (Mazowieckie 2005)0.0434190.249864
Outlays on fixed assets serving energy efficiency, [% of GDP]0.13 (Swietokrzyskie 2015)0.00 (Podkarpackie 2007)0.0434360.249961
Outlays on fixed assets serving waste management, [% of GDP]0.60 (Wielkopolskie 2015)0.00 (Lubuskie 2006)0.0434110.24982
Socio-economic contextValue added in agriculture, [% of total gross value added]8.70 (Podlaskie 2013)0.60 (Slaskie 2015)0.0435160.1739960.250425
Value added in services, [% of total gross value added]74.50 (Mazowieckie 2009)54.00 (Dolnoslaskie 2011)0.0434910.250281
Gross domestic product per capita, [constant prices 2004]62841.63 (Mazowieckie 2016)17302.00 (Lubelskie 2004)0.043470.250161
Population density [person per 1 km2]381.23 (Slaskie 2004)58.78 (Podlaskie 2016)0.0435180.250434
Table 5. Indexes for thematic areas.
RegionsEnvironment and Resource ProductivityNatural Assets BaseEnvironmental Quality of LifePolicy ResponseSocio-Economic Context
2004201620042016200420162004201620042016
Dolnoslaskie0.220.250.480.450.730.900.390.260.510.56
Kujawsko-Pomorskie0.240.360.500.470.680.830.260.250.420.50
Lubelskie0.260.340.540.540.500.620.110.180.500.52
Lubuskie0.250.310.490.550.680.870.270.500.480.50
Lodzkie0.200.350.540.530.620.760.360.340.430.52
Malopolskie0.260.350.530.540.400.630.080.350.510.57
Mazowieckie0.250.310.510.510.560.770.130.130.680.82
Opolskie0.200.260.500.440.640.860.300.330.420.49
Podkarpackie0.280.380.560.540.490.670.220.190.520.53
Podlaskie0.270.410.540.570.640.750.130.210.450.48
Pomorskie0.240.350.480.470.820.980.240.330.560.59
Slaskie0.230.270.480.460.440.610.250.520.380.46
Swietokrzyskie0.270.410.460.380.490.690.170.220.440.49
Warminsko-Mazurskie0.260.350.460.540.710.880.290.250.440.47
Wielkopolskie0.220.320.440.420.660.850.240.260.410.53
Zachodniopomorskie0.220.350.300.400.840.960.280.330.550.60
Bold—regions with decrease in the value of an index.
Table 6. Rankings for Regional Green Economy Index 2004 and 2016.
RegionsRGEI 2004Ranking 2004RGEI 2016Ranking 2016
Dolnoslaskie0.429320.438911
Kujawsko-Pomorskie0.3955100.452210
Lubelskie0.405680.45379
Lubuskie0.412570.50171
Lodzkie0.3865110.431213
Malopolskie0.3613140.47058
Mazowieckie0.424930.49422
Opolskie0.3696120.416115
Podkarpackie0.424840.47847
Podlaskie0.424050.49413
Pomorskie0.435810.48405
Slaskie0.3012160.420514
Swietokrzyskie0.3574150.414816
Warminsko-Mazurskie0.418860.48974
Wielkopolskie0.3621130.432712
Zachodniopomorskie0.405490.48196