Comparative Life Cycle Assessment of Mobile Power Banks with Lithium-Ion Battery and Lithium-Ion Polymer Battery


Abstract
:1. Introduction
2. Methods
2.1. Goal and Scope
- (i)
- To evaluate the life cycle environmental impacts of the MPB model and identify influential materials and processes from cradle to grave.
- (ii)
- To compare the environmental performance of the LIB based MPB and LIPB based MPB and analyze causes of the differences.
2.1.1. Functional Unit
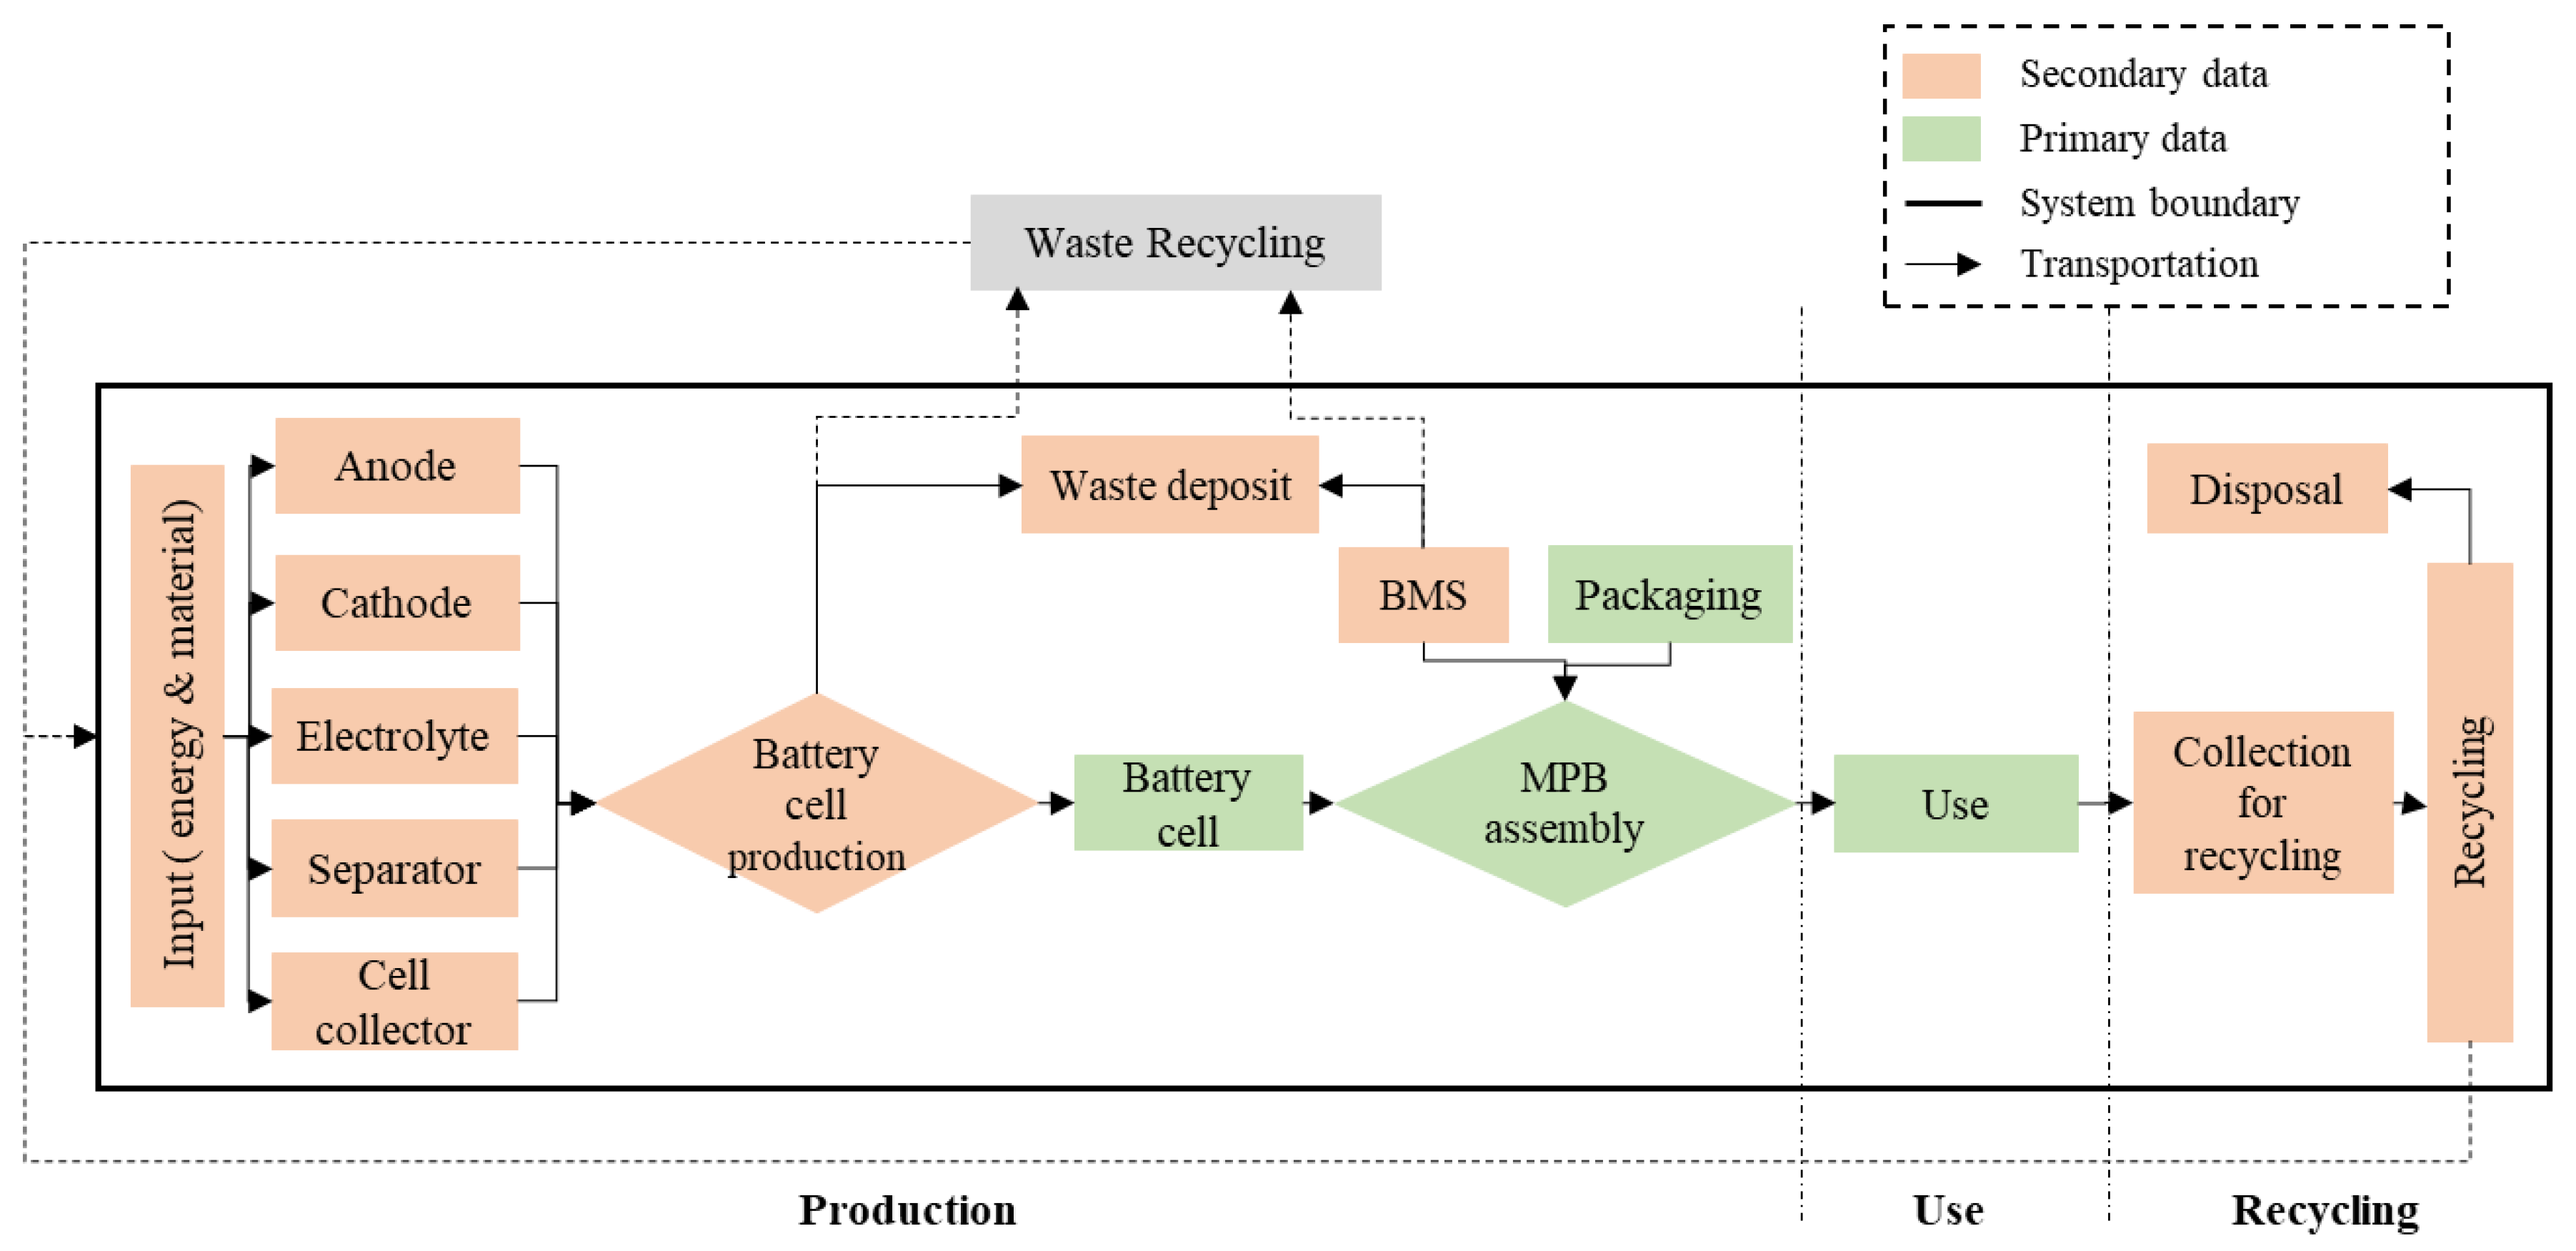
2.1.2. System Boundaries
2.2. Life Cycle Inventory
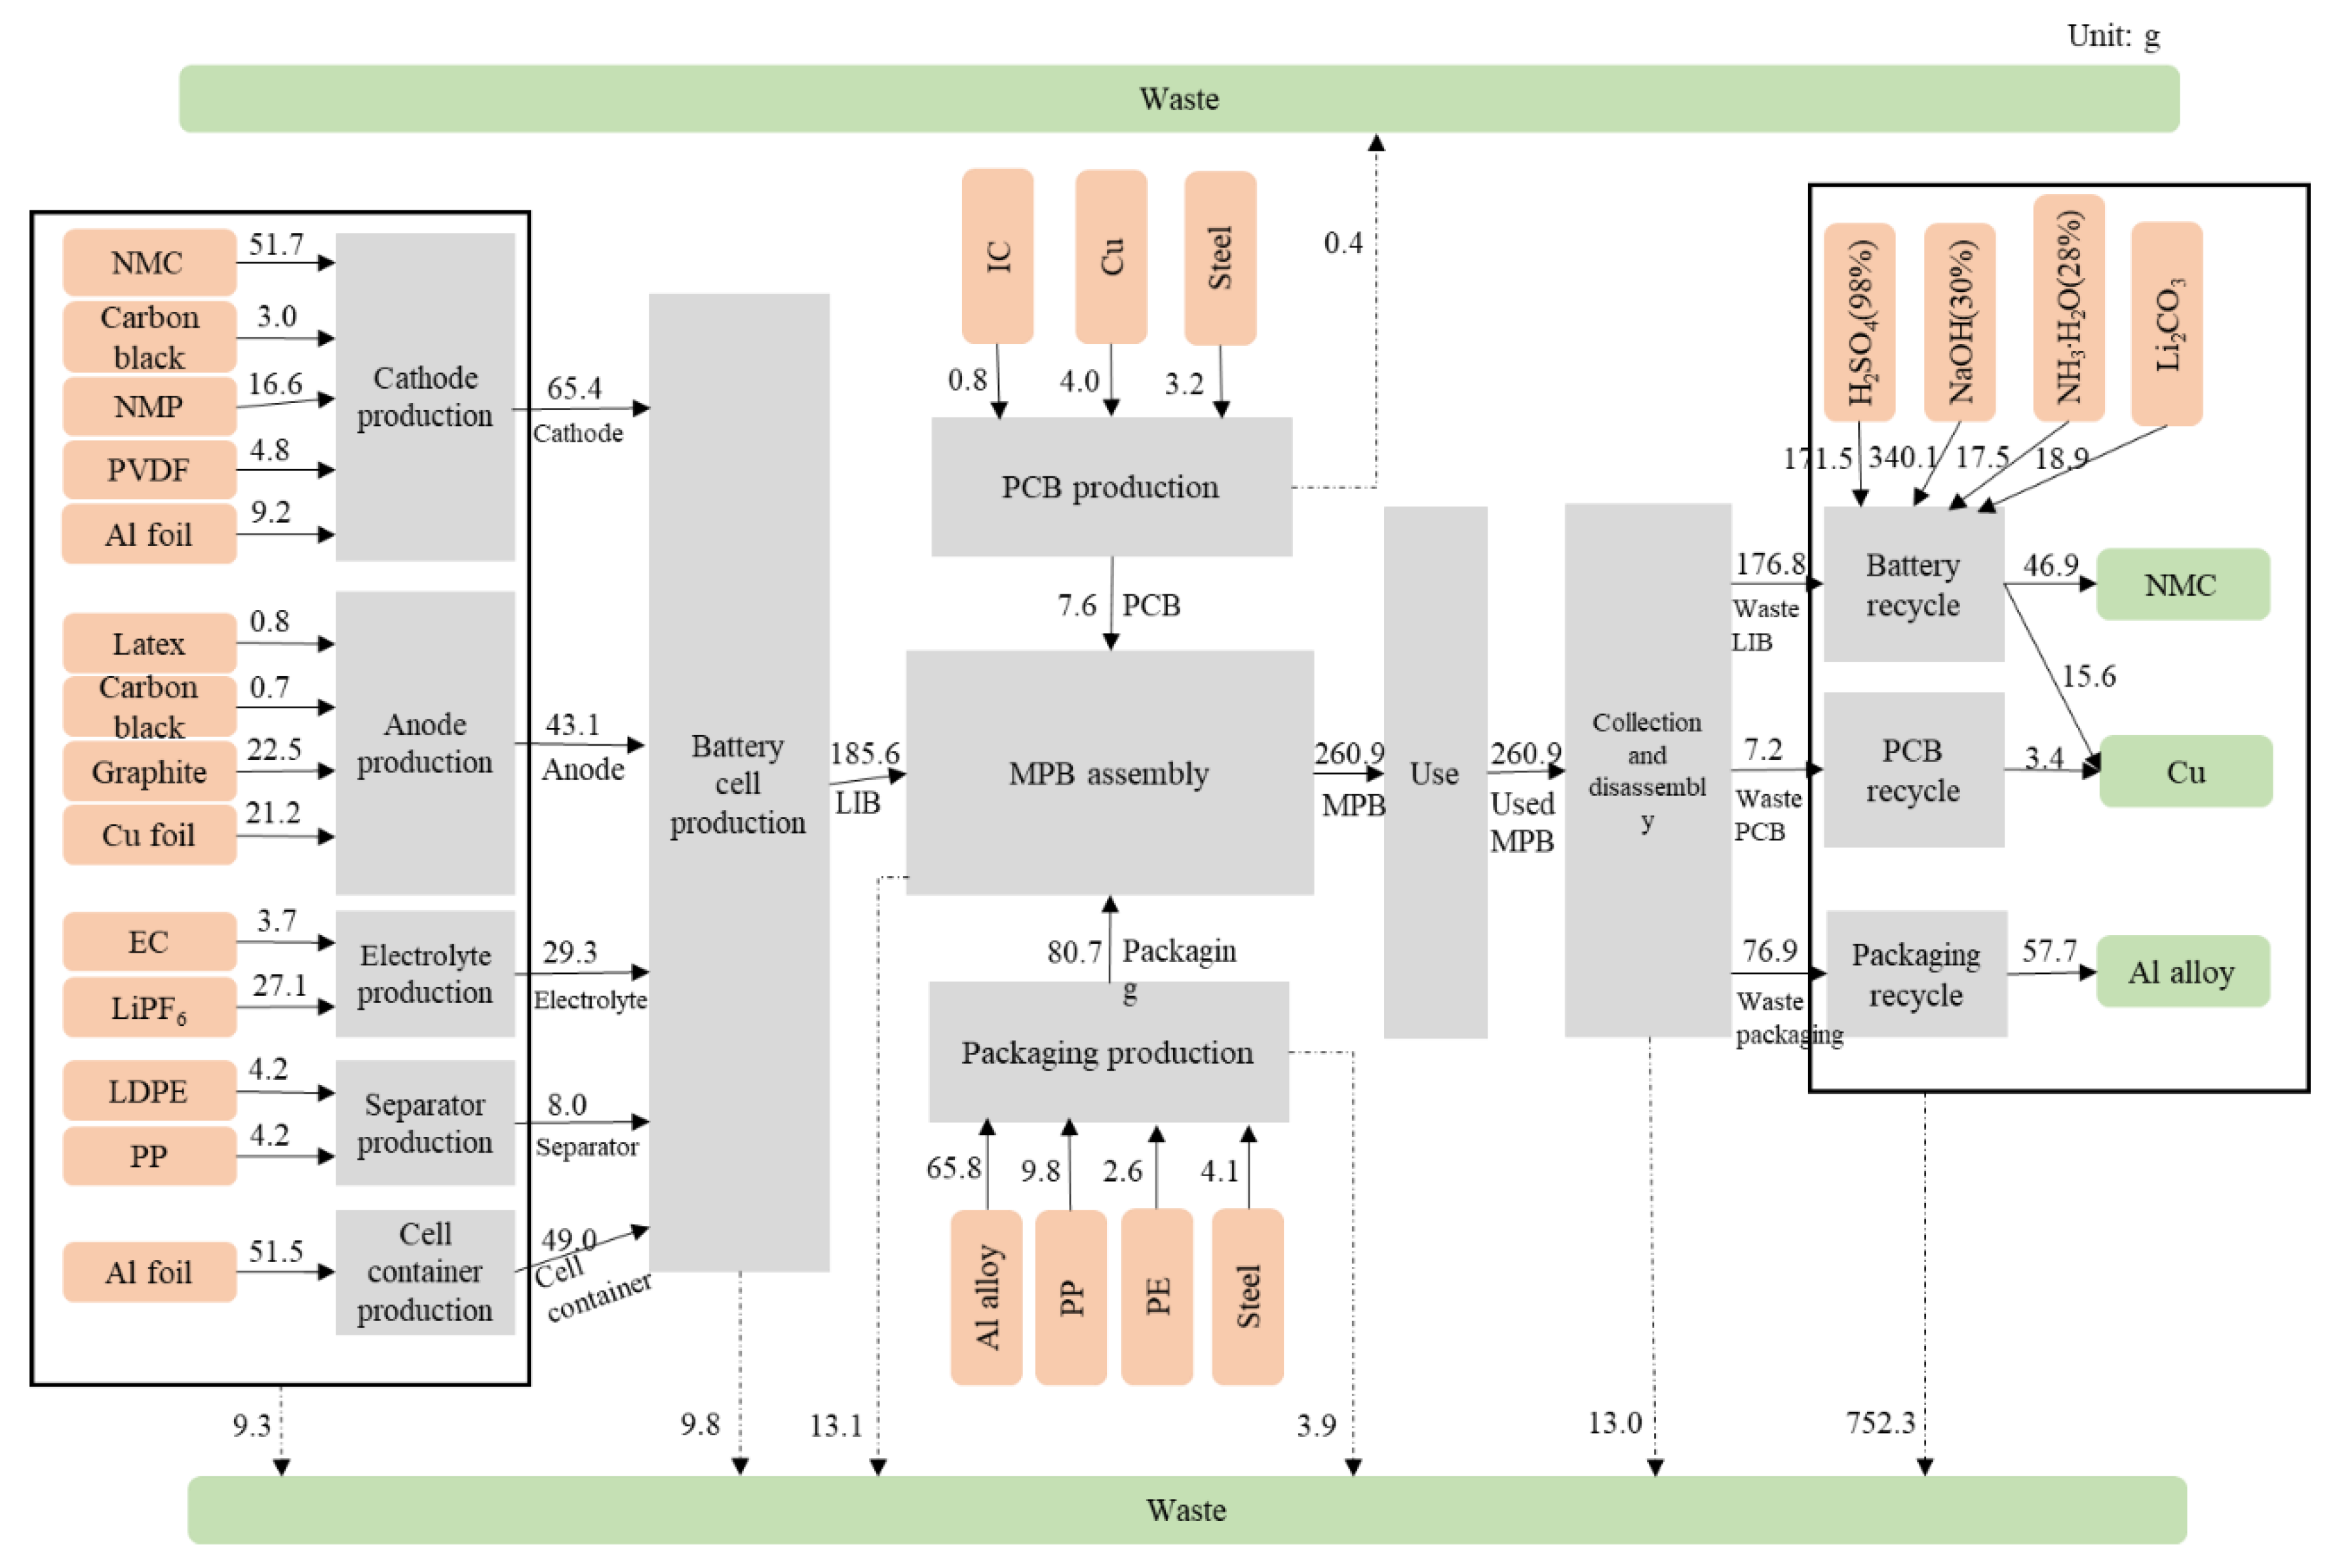
2.2.1. Production
2.2.2. Use
2.2.3. Recycling
2.3. Impact Assessment
2.4. Sensitivity Analysis
- (1)
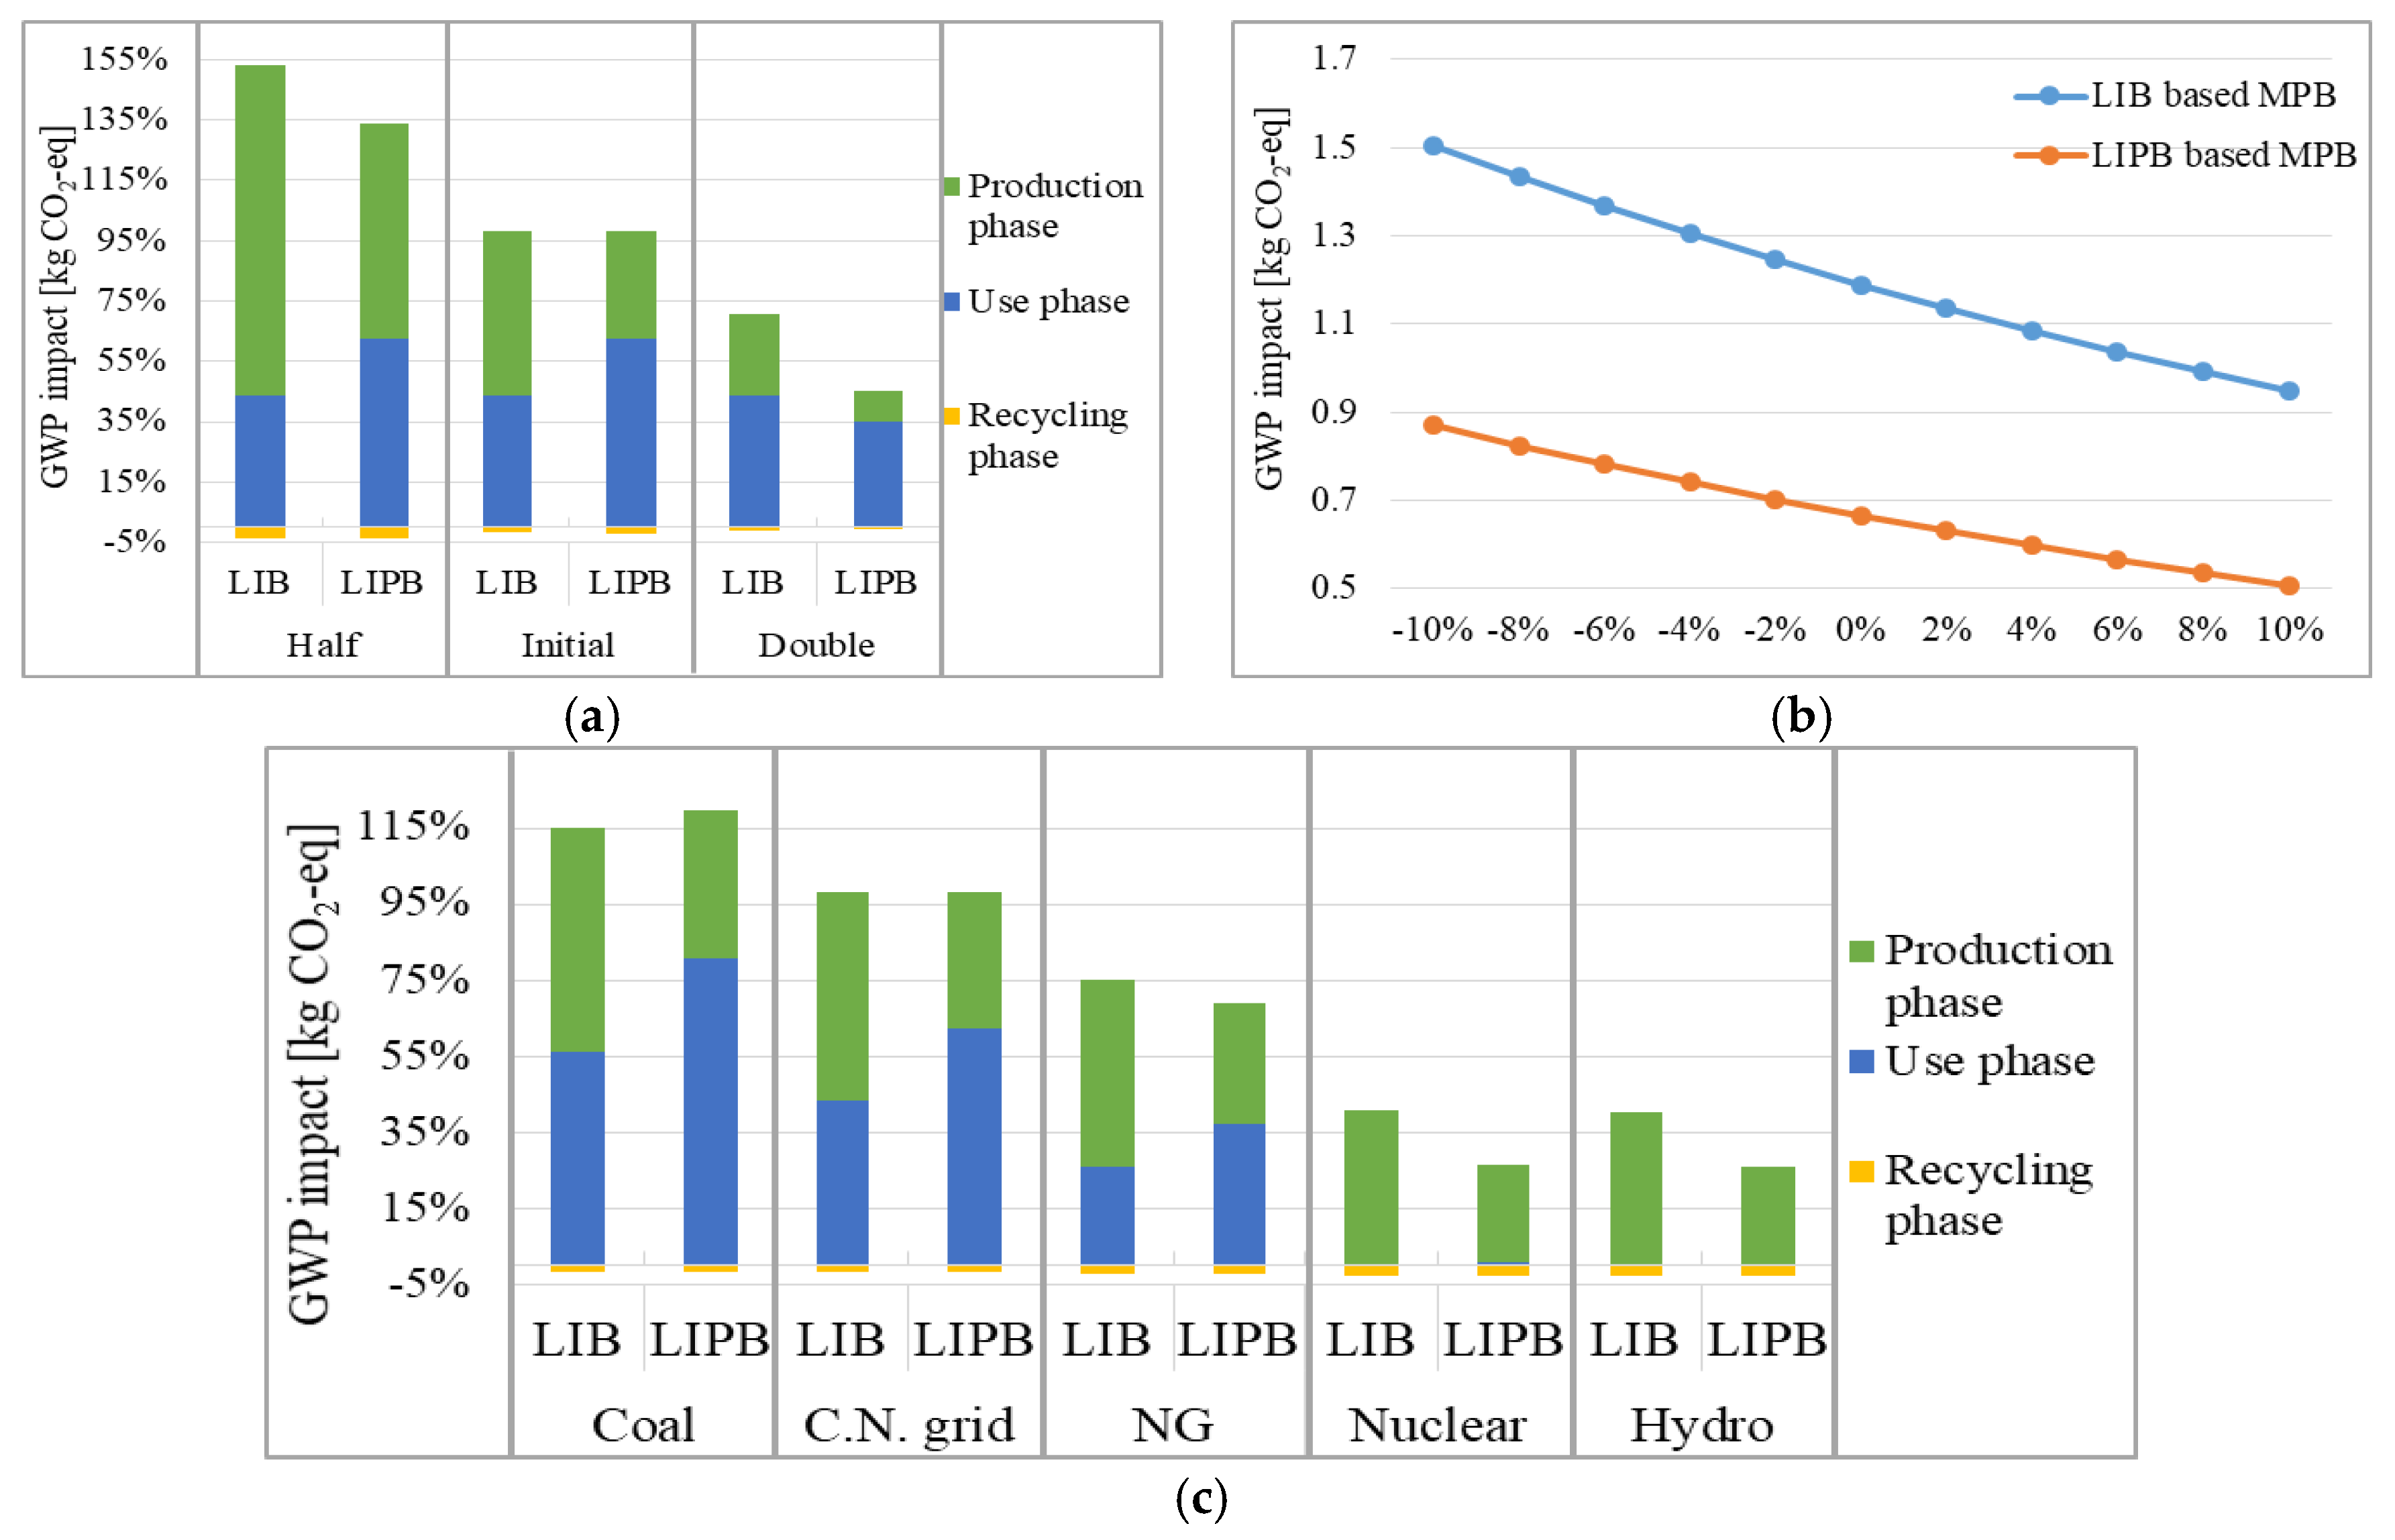
- Internal factor: According to the previous literature [38], the cycle life and the efficiency varies significantly, and these two parameters are proved to largely affect the energy consumption during the use phase of batteries [39]. To analyze the fluctuations in the environmental impacts to these parameters, two varied scenarios are considered in this study: (a) the lowest and highest values of the cycle life are set to be 50% and 200% of the initial value respectively; (b) for the discharging efficiency, the value is assumed with an alteration of 10 percentage points.
- (2)
- External factor: The electricity supplement is required throughout MPB’s entire life cycle, and a carbon-intensive electricity mix could result in significant GWP impacts. As one of the world’s most carbon-intensive economies [40], China has set mandatory policies to increase the use of renewable energies [41]. In this case, five different electricity sources including coal, Chinese current electricity grid, natural gas, hydro, and nuclear are built into five different scenarios, and how the electricity mix influences the total impact of MPBs is further assessed.
3. Results
3.1. Results of Life Cycle Assessment
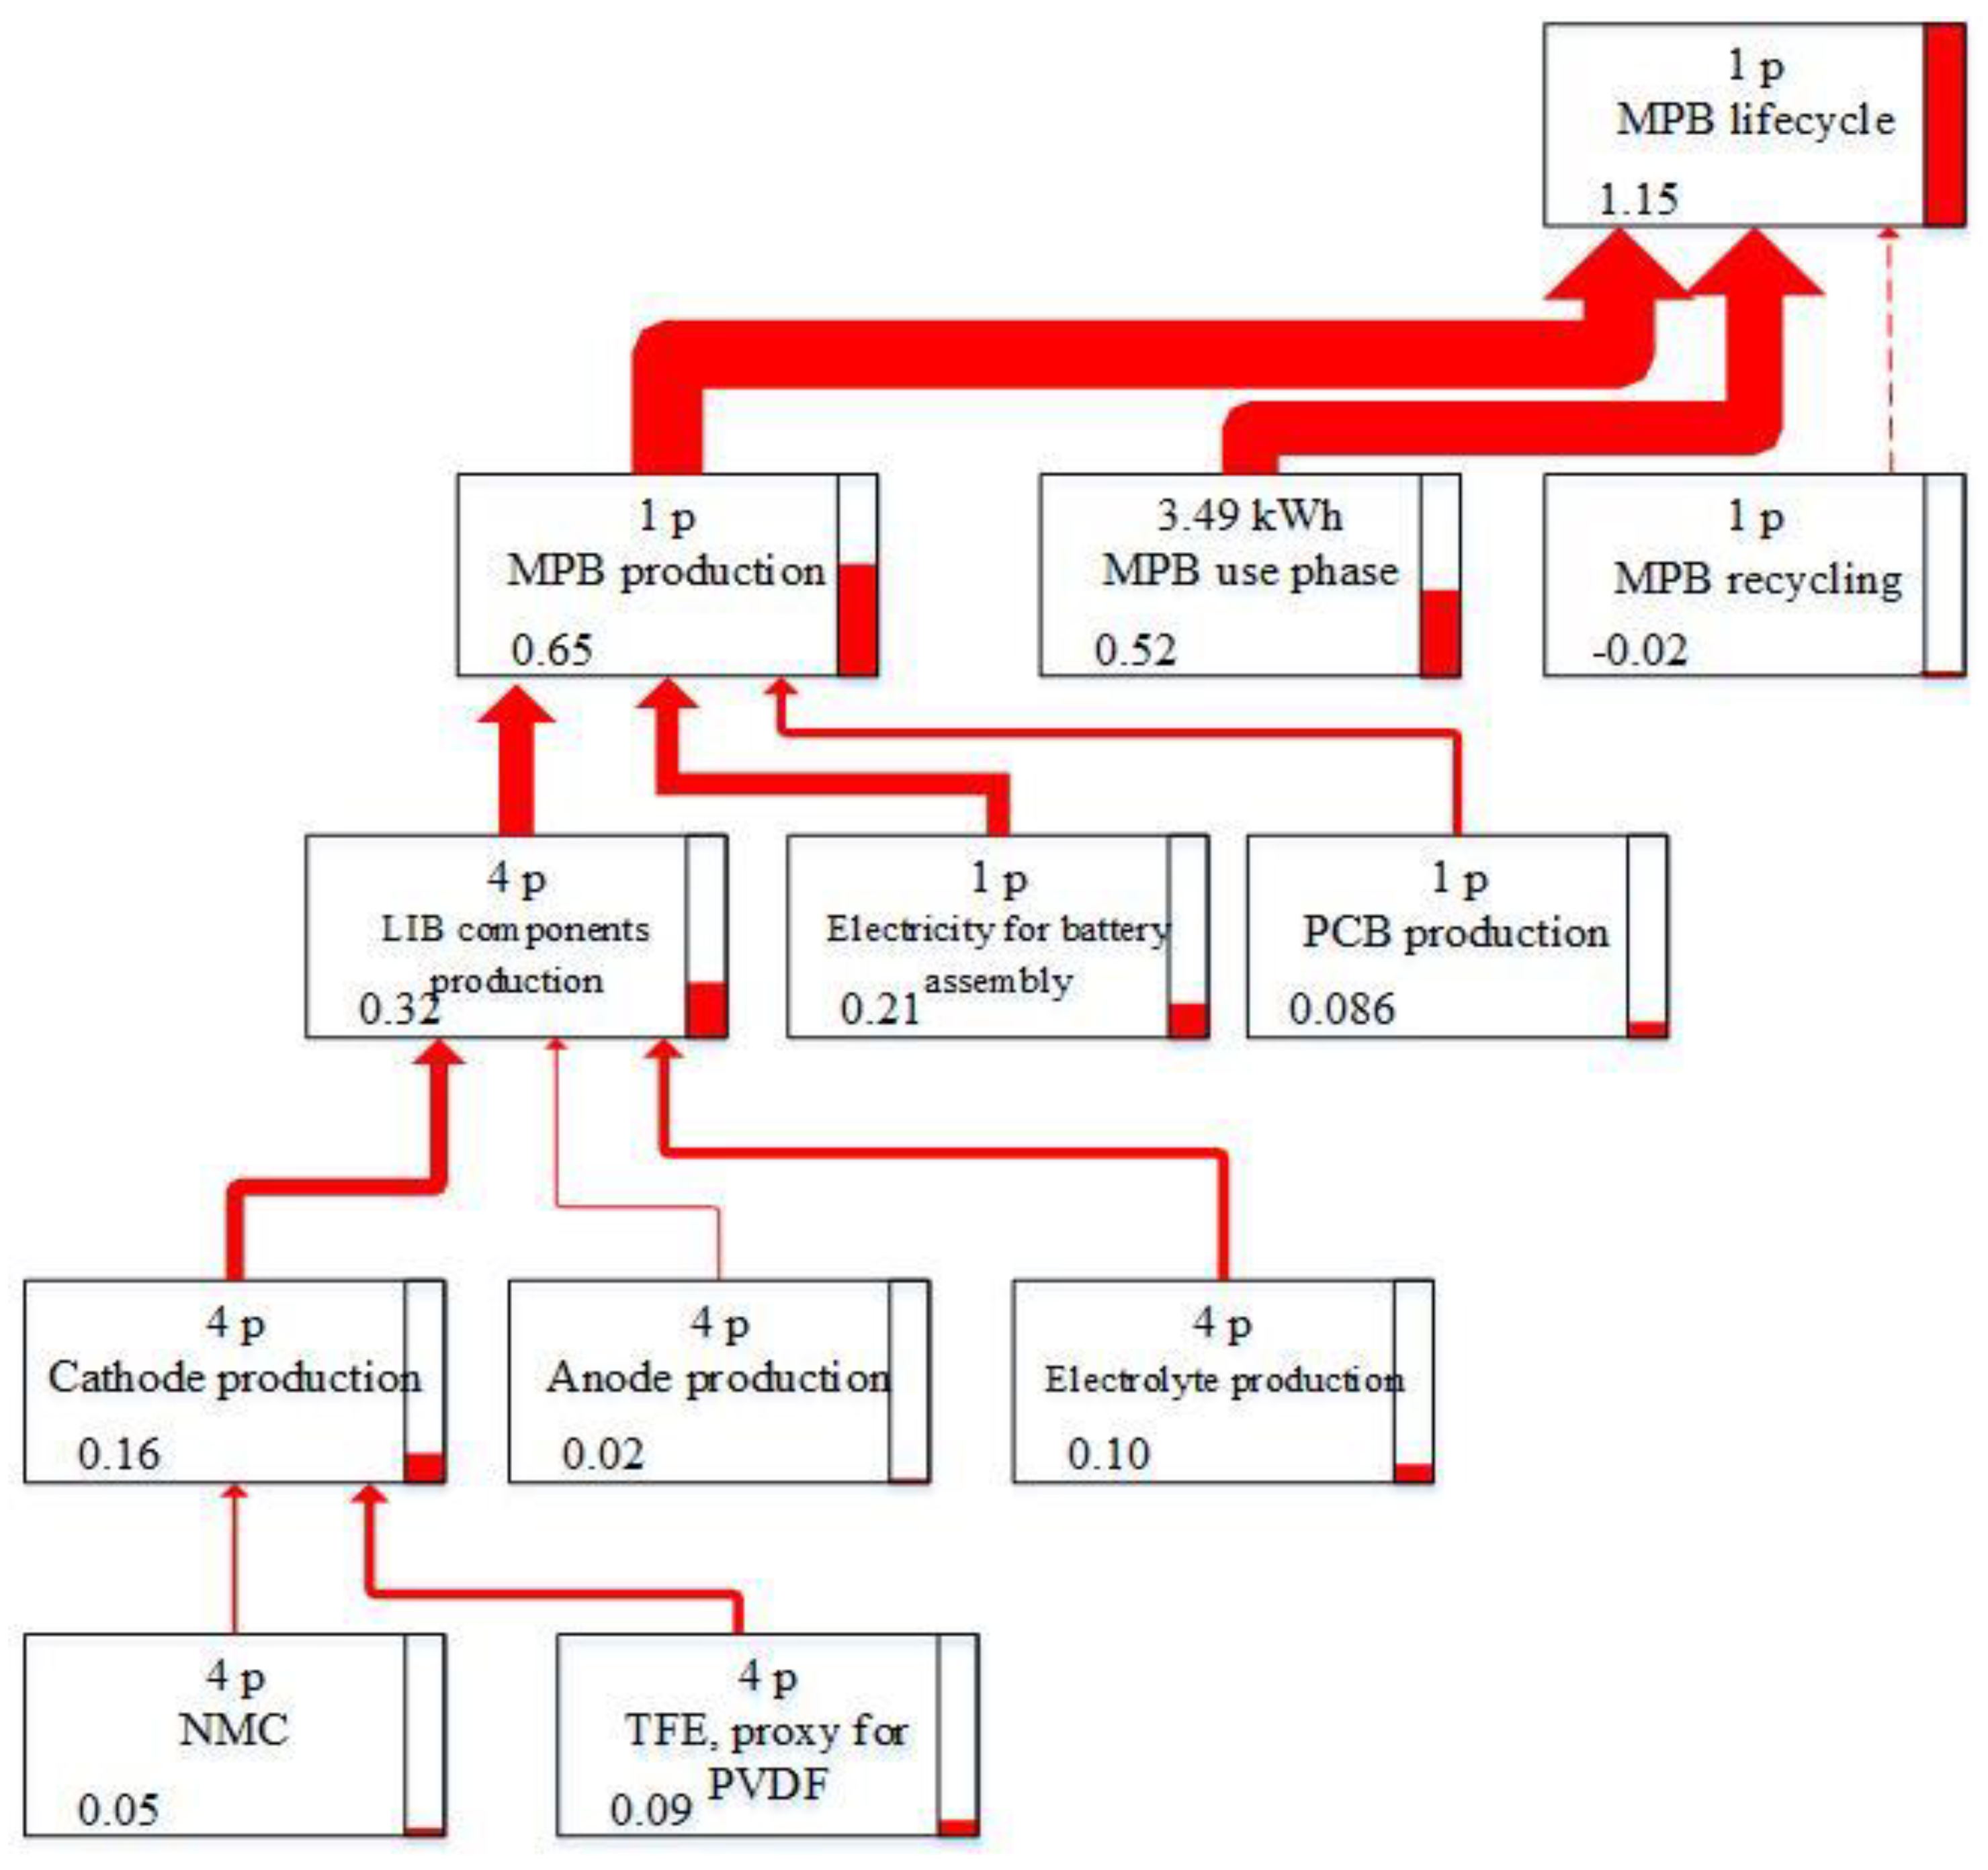
3.1.1. Overall Life Cycle
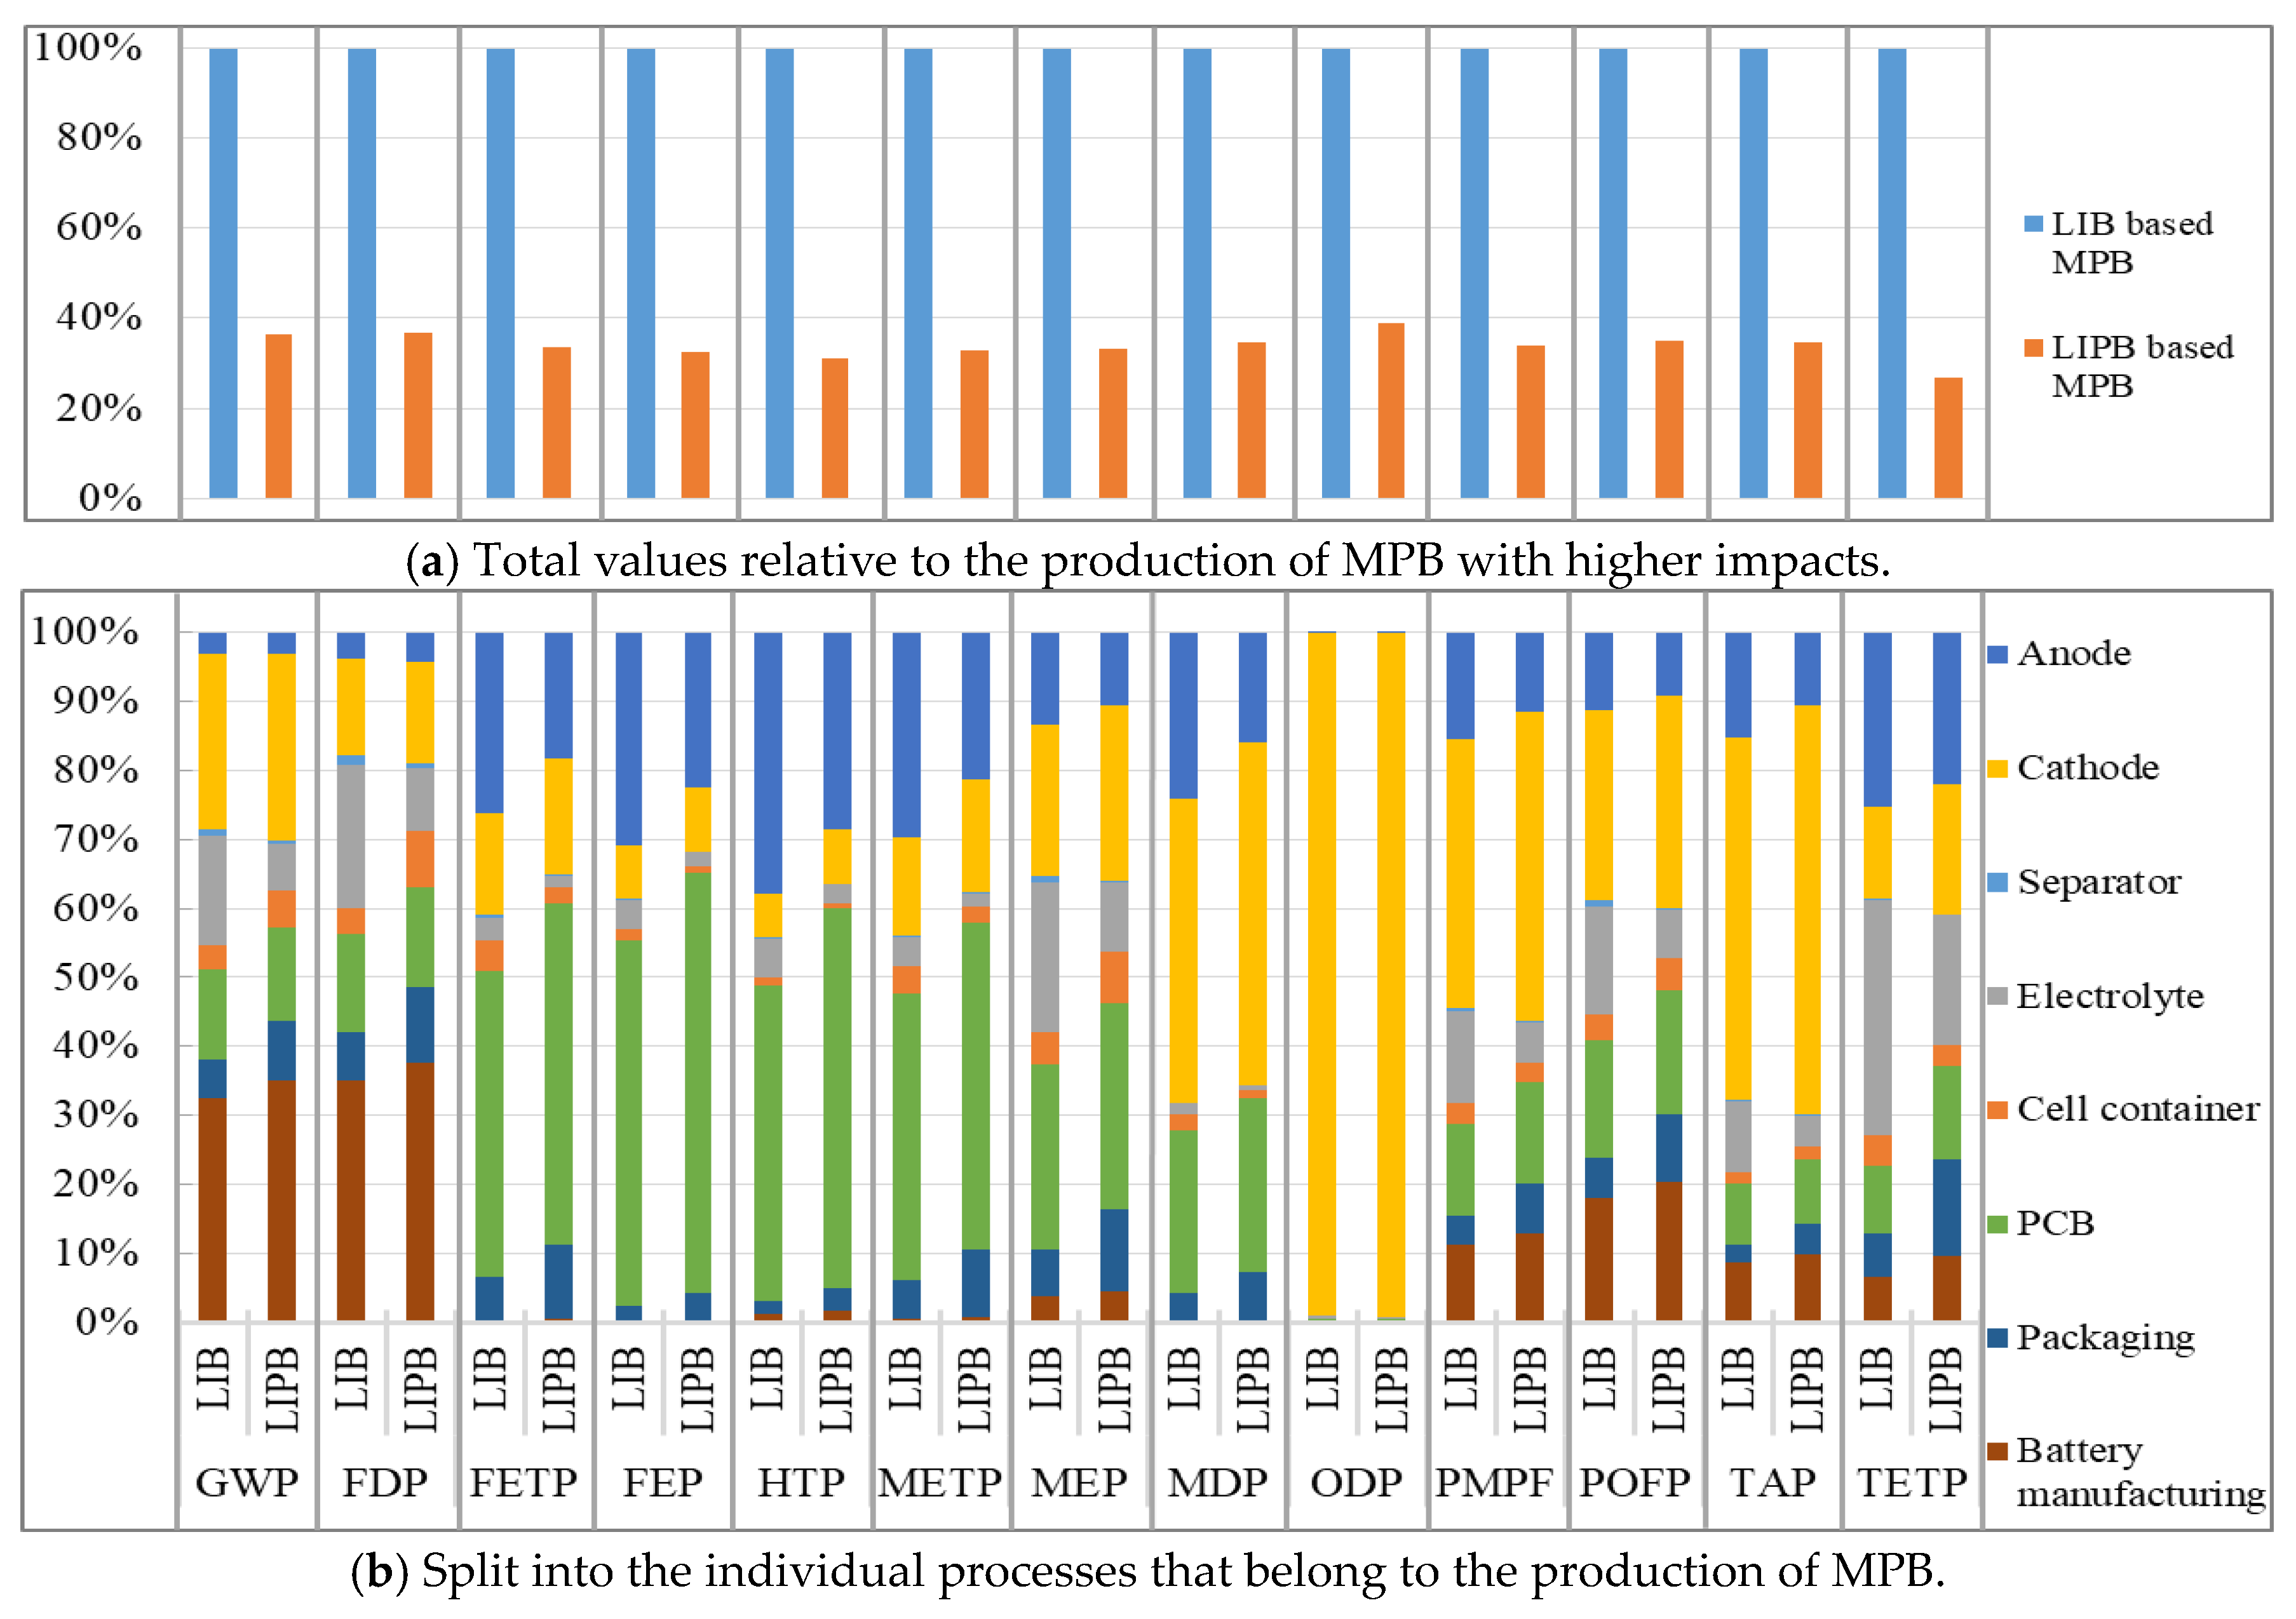
3.1.2. Production Phase
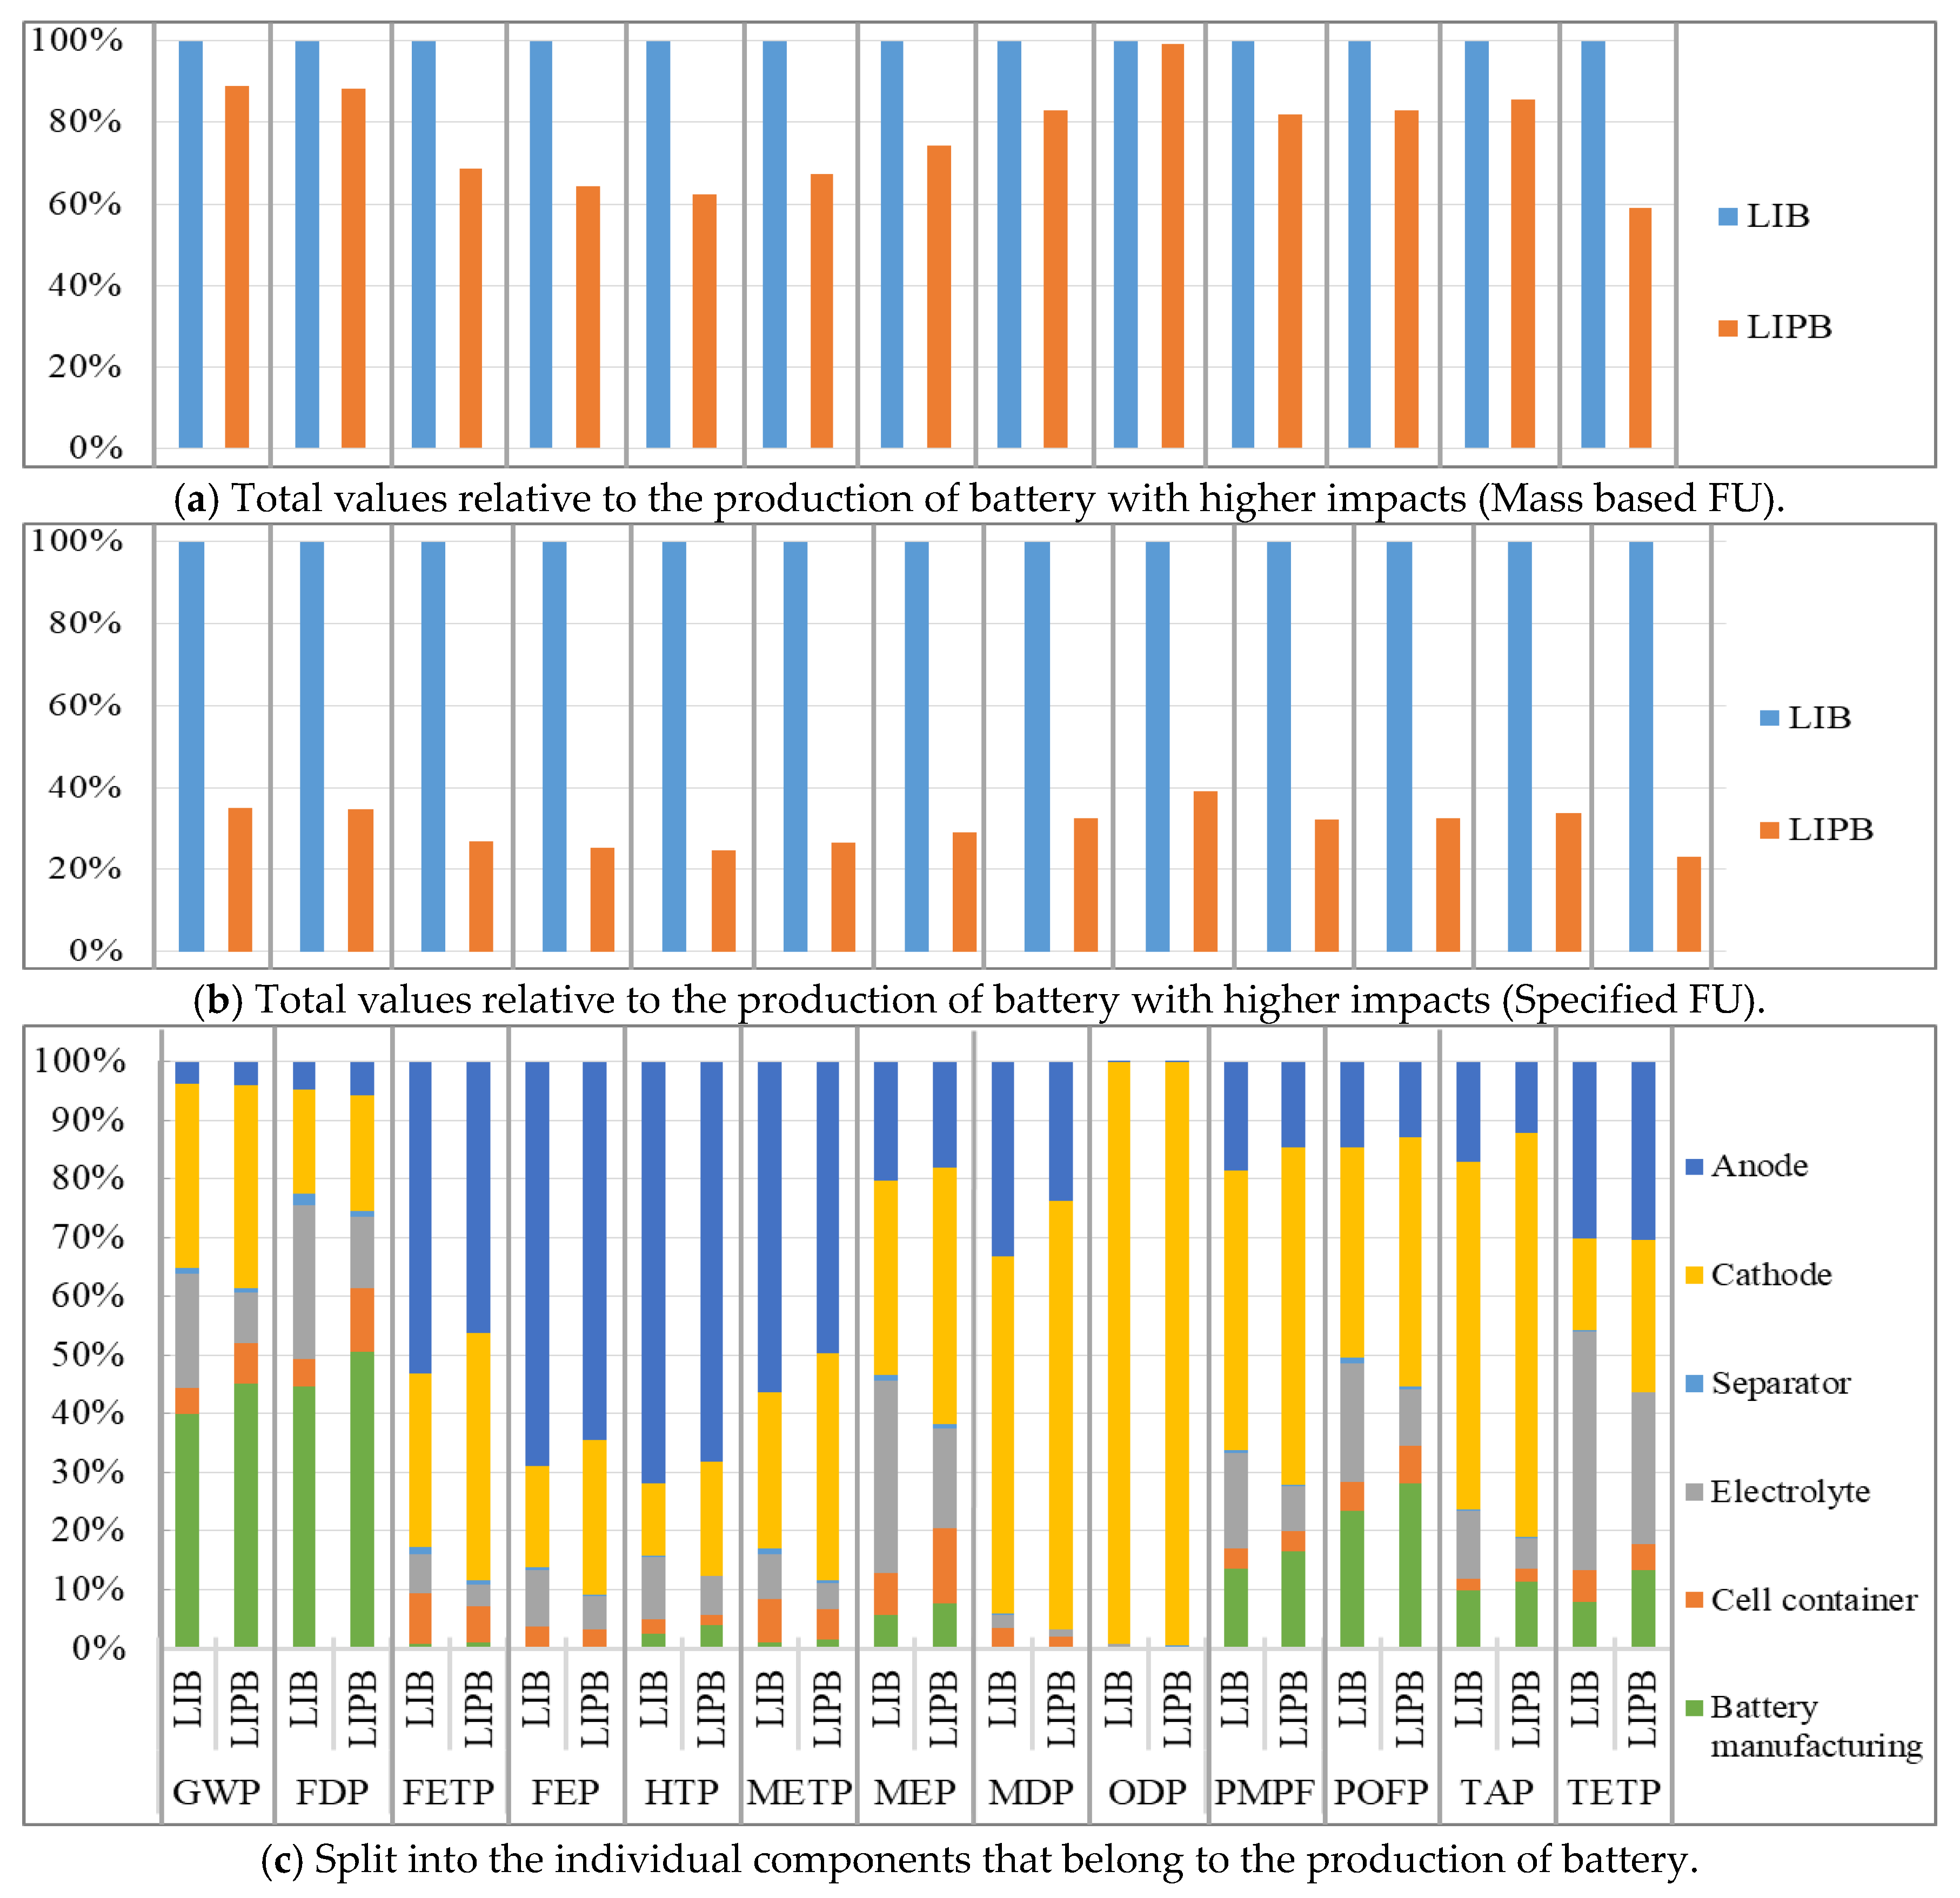
3.1.3. Comparison of Batteries
3.2. Results of Sensitivity Analysis
3.3. Resource Depletion
4. Discussion
5. Conclusions
Author Contributions
Funding
Conflicts of Interest
Appendix A

| Rank | Brand | Model | Capacity | Mass | Size (mm) | Battery | Packaging Material | Theoretical Cycle Life | Theoretical Efficiency | Additional Component | Price (RMB) |
|---|---|---|---|---|---|---|---|---|---|---|---|
| 1 | Xiaomi | PLM06ZM | 20,000 mAh/74 WH | 358 g | L149.5 * W69.6 * H24 | LIPB | Plastic | - | ~93% | - | 129 |
| 2 | ROMOSS | sense 6 | 20,000 mAh/74 WH | 445 g | L160 * W80 * H22.6 | LIPB | Plastic | >300 | ~85% | - | 99 |
| 3 | Xiaomi | 2 | 10,000 mAh/37 WH | 260 g | L147 * W71 * H14 | LIPB | Aluminum alloy | - | ~90% | - | 79 |
| 4 | ROMOSS | sense 6LCD | 20,000 mAh/74 WH | 445 g | L160 * W80 * H22.6 | LIPB | Plastic | >300 | ~85% | LCD | 99 |
| 5 | HUAWEI | AP20Q | 20,000 mAh/74 WH | 374 g | L150 * W79 * H22.5 | LIB | Plastic | - | ~85% | - | 299 |
| 6 | ROMOSS | sense 9 | 25,000 mAh/92.5 WH | 585 g | L210 * W80 * H22.6 | LIPB | Plastic | >300 | ~85% | - | 119 |
| 7 | ROMOSS | HO20 | 20,000 mAh/74 WH | 450 g | L168 * W82 * H22.5 | LIPB | Plastic | - | - | LED | 89 |
| 8 | PHILIPS | DLP2103 | 10,000 mAh 3.8V/38 WH | 201 g | L148 * W78 * H10.9 | LIPB | Plastic | >500 | - | - | 149 |
| 9 | Aigo | E10000 | 10,000 mAh/37 WH | 210 g | L115.5 * W66.2 * H22 | LIPB | Plastic | - | - | LED | 79 |
| 10 | ROMOSS | sense 4 | 10,400 mAh 3.7 V/38.5 WH | 296 g | L138 * W62 * H22 | LIB | Plastic | >300 | ~85% | - | 59 |
| 11 | Xiaomi | - | 10,000 mAh/37 WH | 260 g | L128.5 * W75 * H12.5 | LIPB | Aluminum alloy | - | ~93% | - | 149 |
| 12 | PISEN | TS-D199 | 20,000 mAh/74 WH | 475 g | L161 * W83 * H23 | LIB | Plastic | - | ~90% | LCD | 129 |
| 13 | Aigo | E20000 | 20,000 mAh/74 WH | 396 g | L162.3 * W76.3 * H21.7 | LIPB | Plastic | - | - | LED | 118 |
| 14 | ROMOSS | sense 6P | 20,000 mAh/74 WH | 445 g | L160 * W80 * H22.6 | LIPB | Plastic | >300 | ~85% | LED | 99 |
| 15 | Aigo | W200 | 20,000 mAh/74 WH | 465 g | L165.2 * W78 * H23 | LIB | Plastic | - | - | LED | 99 |
| 16 | Xiaomi | - | 5000 mAh/18.5 WH | 190 g | L125 * W69 * H9.9 | LIPB | Aluminum alloy | - | - | - | 59 |
| 17 | TAIHUO | TW4 | 5000 mAh/18.5 WH | 109 g | H8 | LIPB | Plastic | - | - | - | 138 |
| 18 | MORUI | ML20 | 20,000 mAh/74 WH | 445 g | L157 * W71 * H24 | LIB | Plastic | >300 | ~90% | LED | 79 |
| 19 | ZMI | MF885 | 10,000 mAh/37 WH | 257 g | L111.5 * W70 * H22 | LIB | Aluminum alloy | - | - | Portable router | 399 |
| 20 | HUAWEI | AP09S | 5000 mAh/18.5 WH | 252 g | L138 * W71 * H16 | LIPB | Aluminum alloy | - | ~91% | - | 229 |
| 21 | PHILIPS | DLP1130V | 10,000 mAh/38 WH | 210 g | L160 * W80 * H11 | LIPB | Plastic | - | - | Cable | 249 |
| 22 | HUAWEI | AP09Q | 10,000 mAh/37 WH | 252 g | L138 * W71 * H15.9 | LIPB | Aluminum alloy | - | ~89% | - | 169 |
| 23 | DIVI | - | 5000 mAh/18.5 WH | 118 g | L141 * W70 * H15 | LIPB | Plastic | - | - | - | 109 |
| 24 | PHILIPS | DLP2109 | 10,000 mAh/37 WH | 220 g | L149 * W78 * H12.5 | LIPB | Aluminum alloy | - | - | LCD | 139 |
| 26 | ZMI | QB815 | 15,600 mAh 3.6 V/56.16 WH | 393 g | L160.4 * W81.4 * H21 | LIB | Aluminum alloy | - | ~90% | - | 239 |
| 27 | TECLAST | A10-R | 10,000 mAh/37 WH | 179 g | L88 * W62 * H23 | LIB | Plastic | - | ~93% | - | 129 |
| 28 | KNK | A-50000 | 20,000 mAh/74 WH | - | L170 * W106 * H15 | - | Plastic | - | ~95% | LED | 79 |
| 29 | Besiter | BST-0137DT | 10,000 mAh/37 WH | 244 g | L100 * W78 * H23 | LIB | Plastic | - | ~85% | - | 69.9 |
| 29 | Besiter | BST-K6X | 20,000 mAh/74 WH | 465 g | L165 * W80 * H22 | LIPB | Plastic | - | ~60% | LED | 89 |
| 30 | PHILIPS | DLP2119 | 20,000 mAh/74 WH | 425 g | L161.3 * W82.1 * H24.5 | LIPB | Aluminum alloy | - | - | LED | 239 |
| 31 | Besiter | G-5 | 5000 mAh/18.5 WH | 100 g | L140 * W70 * H5.7 | LIPB | Plastic | - | - | - | 199 |
| 32 | ROMOSS | PB10 | 10,000 mAh/37 WH | 204 g | L142 * W65 * H14.8 | LIPB | Plastic | >600 | ~85% | - | 69 |
| 33 | ANKER | A1621 | 5000 mAh/18.5 WH | 189 g | L72 * W70 * H31 | LIB | Plastic | - | - | Charger | 148 |
| 34 | HUAWEI | AP08Q | 10,000 mAh/37 WH | 215 g | L139 * W73.7 * H15.5 | LIPB | Plastic | - | - | - | 139 |
| 35 | PADO | K20 | 21,200 mAh/78.44 WH | 440 g | L153 * W77 * H19 | LIB | Plastic | >3000 | - | - | 69 |
| 36 | TECLAST | T100CE | 10,000 mAh/37 WH | 278.9 g | L140.1 * 64.05 * H22 | LIB | Plastic | - | - | - | 49 |
| 37 | F&O | F4 | 7000 mAh/25.9 WH | 160 g | L142 * W72 * H16 | LIPB | Plastic | - | - | - | 148 |
| 38 | YICF | Y50000 | 20,000 mAh/74 WH | 205 g | L153 * W75 * H10 | LIPB | Aluminum alloy | - | ~93% | Solar panel | 69.9 |
| 39 | ROMOSS | HO10C | 10,000 mAh/37 WH | 220 g | L145 * W73.5 * H15 | LIPB | Plastic | - | - | LED | 79 |
| 41 | KNK | 50000 | 20,000 mAh/74 WH | 280 g | L160 * W78 * H10 | LIPB | Aluminum alloy | - | - | - | 69 |
| 42 | PISEN | TS-D189 | 10,000 mAh/37 WH | 301 g | L130.5 * W61 * H31.5 | LIB | Plastic | - | - | Charger | 78.9 |
| 43 | PHILIPS | DLP1201V | 20,000 mAh 3.8 V/76 WH | 378 g | L160 * W80 * H19.5 | LIPB | Plastic | - | - | Cable | 369 |
| 44 | ZMI | APB01 | 6500 mAh 3.63 V/23.6 WH | 199 g | L72 * W70.5 * H31.6 | LIB | Plastic | - | - | Charger | 129 |
| 46 | KELIFANG | 50000M | 20,000 mAh/74 WH | 400 g | L160 * W80 * H20 | LIB | Aluminum alloy | >800 | ~93% | LED | 98 |
| 47 | SOLOVE | A8 | 20,000 mAh 3.8 V/76 WH | 528 g | L166 * W116 * H15 | LIPB | Aluminum alloy | - | ~93% | - | 139 |
| 50 | Aigo | OL10400 | 10,400 mAh 3.7 V/38.5 WH | 240 g | L90 * W90 * H23 | LIB | Plastic | - | - | - | 64.9 |
| Module | Component | Subcomponent | Description of Data and Assumptions Used | Mean Value | Unit | |
| LIB | LIPB | |||||
| Battery cell | Anode | Negative electrode paste | Datasets “graphite, RoW”, “carbon black, RoW” and the binder “latex, RoW” are used, with the dataset “deionised water, RoW” as the solvent. | 0.0030 | 0.0024 | g/Wh |
| Negative electrode substance | Datasets “copper ingot, RoW” and “sheet rolling, copper, RoW” are used. | 0.0027 | 0.0006 | g/Wh | ||
| Cathode | Positive electrode paste | The inventory of NMC production from LiOH and Ni0.4Co0.2Mn0.4(OH)2 is based on protocol descriptions by Majeau-Bettez et al. [24]. Datasets “tetrafluoroethylene, RoW”, “polyethylene, RoW” and “N-methyl-2-pyrrolidone, RoW” are used as the binder and solvent respectively. Since no LCA data exists for PVDF, it is substituted with equal amounts of TFE and PE. | 0.0075 | 0.0029 | g/Wh | |
| Positive electrode substance | Datasets “aluminium ingot, RoW” and “sheet rolling, aluminium, RoW” are used. | 0.0012 | 0.0003 | g/Wh | ||
| Electrolyte | Solvent | Dataset “ethylene carbonate, CN” is used. For LIPB, dataset “polycarbonate, RoW” is additionally used. | 0.0039 | 0.0009 | g/Wh | |
| Salt | Dataset “lithium hexafluorophosphate, CN” is used. | |||||
| Separator | - | Dataset “separator, RoW” is used. | 0.0011 | 0.0002 | g/Wh | |
| Cell container | - | Datasets “aluminium ingot, RoW” and “sheet rolling, aluminium, RoW” are used. For LIPB, since no LCA data exists for aluminum plastic foil, it is substituted with the combination of dataset “glass fiber reinforced plastic, RoW”, “aluminium ingot, RoW” and “polypropylene granulate, RoW”. | 0.0065 | 0.0028 | g/Wh | |
| Assembly | - | Dataset “electricity, CN” is used, and the data is based on the estimation of Majeau-Bettez et al. [24]. | 0.0257 | 0.0101 | /g | |
| PCB | - | - | Datasets “integrated circuit production, GLO”, “copper ingot, RoW” and “chromium steel 18/8, RoW” are used, for which the future processing dataset “wire drawing, copper, RoW” and “sheet rolling, chromium steel, RoW” are also used. | 0.0011 | 0.0004 | g/Wh |
| Packaging | Shell | - | Datasets “aluminum alloy, RoW” and “hot rolling, steel, RoW” are used. | 0.0089 | 0.0051 | g/Wh |
| Tray | - | Datasets “polypropylene granulate, RoW” and “extrusion and thermoforming, RoW” are used, and the tray is used to fix the batteries. | 0.0013 | 0.0011 | g/Wh | |
| Other | - | Dataset “chromium steel 18/8, RoW” and “low density polyethylene, RoW” are used. | 0.0009 | 0.0003 | g/Wh | |
| Process | Description of Data and Assumptions Used | |||||
| Transportation | The transportation data for each component production is based on Majeau-Bettez et al. [24] and Notter et al. [23]; the datasets “transport, freight, lorry, RoW” and “transport, freight train, diesel, CN” are used. | / | / | / | ||
| Assembly | No available data. | / | / | / | ||
| Use | Based on the assumption of a complete charge and discharge every time, dataset “electricity, CN” is used; and there is no other output during the use phase. It is assumed that there are no maintenance activities in the use phase. | 6.8875 | 12.9071 | kWh | ||
| Recycling | Disassembly | This process is performed manually, assuming no energy consumption. | / | / | / | |
| Battery | The inventory of battery recycling is based on Hao et al. [27], in which an optimized hydrometallurgical process is adopted. Active anode materials (NMC) and copper are recycled from this process. | 0.0257 | 0.0101 | g/Wh | ||
| PCB | According to Li and Xu [34] and Ghosh et al. [28], PCBs are shredded mechanically into metal powder, and copper is extracted through the hydrometallurgical route, with a recycling rate of 95%. | 0.0011 | 0.0004 | g/Wh | ||
| Packaging | Quantifying with the 75% reduction of environmental impact of aluminum alloy production. | 0.0112 | 0.0066 | g/Wh | ||

- The cathode paste is made of Li(Ni0.4Co0.2Mn0.4)O2, small amounts of carbon black, binder, and other additives. These materials are mixed in a chemical vessel and then pumped to the coating machine.
- Coating machines spread the paste on both sides of the Aluminum foil, drying the foil and calendaring it to make the thickness more uniform and then slit to the desirable sizes.
- The anode paste is made of synthetic graphite and s binders in a process similar to that used for the cathode paste and then spread on copper foil to produce the anodes.
- The separator is a porous low-density polyethylene (LDPE) film, and the dried three-layer assembly is calendared, slit, and cylindrically for the 18650 container.
- The layers are secured within a polyethylene pouch and tucked into a steel canister. The battery cell is filled with a premixed non-aqueous electrolyte solution of lithium hexafluorophosphate (LiPF6) in ethylene carbonate.
- The cell casing is sealed and the copper end tab is attached, then the laminated cell is racked, and it undergoes activation by charge-discharge cycling. Inspection and testing follow completion of the formation step.
| ReCiPe Midpoint (H) | Production Phase | Use Phase | Recycling Phase | Absolute Value | Sum | |
|---|---|---|---|---|---|---|
| GWP | LIB | 0.651422 | 0.517195 | −0.02111 | 1.189727 | 1.147508 |
| LIPB | 0.237839 | 0.416381 | −0.01285 | 0.667067 | 0.641373 | |
| FDP | LIB | 0.161779 | 0.123802 | 0.00223 | 0.287812 | 0.287812 |
| LIPB | 0.05937 | 0.09967 | −0.00028 | 0.159324 | 0.158756 | |
| FETP | LIB | 0.051562 | 3.31 × 10⁻⁵ | −0.02186 | 0.073458 | 0.029732 |
| LIPB | 0.017274 | 2.66 × 10⁻⁵ | −0.00908 | 0.026381 | 0.008222 | |
| FEP | LIB | 0.001302 | 1.19 × 10⁻⁷ | −0.00035 | 0.001653 | 0.000951 |
| LIPB | 0.000422 | 9.59 × 10⁻⁸ | −0.00014 | 0.000564 | 0.000279 | |
| HTP | LIB | 2.622341 | 0.090894 | −1.16186 | 3.875093 | 1.551376 |
| LIPB | 0.812216 | 0.073177 | −0.46071 | 1.346106 | 0.424678 | |
| METP | LIB | 0.052201 | 0.000622 | −0.02376 | 0.076578 | 0.029068 |
| LIPB | 0.017102 | 0.000501 | −0.00976 | 0.027362 | 0.007842 | |
| MEP | LIB | 0.000665 | 4.88 × 10⁻⁵ | −0.00012 | 0.000833 | 0.000596 |
| LIPB | 0.000222 | 3.93 × 10⁻⁵ | −5.4 × 10⁻⁵ | 0.000315 | 0.000207 | |
| MDP | LIB | 0.547148 | 0.002465 | −0.39378 | 0.943393 | 0.155834 |
| LIPB | 0.190054 | 0.001984 | −0.15718 | 0.349224 | 0.034854 | |
| ODP | LIB | 2.85 × 10⁻⁶ | 1.62 × 10⁻¹³ | 9.15 × 10⁻⁹ | 2.86 × 10⁻⁶ | 2.86 × 10⁻⁶ |
| LIPB | 1.11 × 10⁻⁶ | 1.31 × 10⁻¹³ | 3.19 × 10⁻⁹ | 1.11 × 10⁻⁶ | 1.11 × 10⁻⁶ | |
| PMPF | LIB | 0.002742 | 0.000823 | −0.00134 | 0.004901 | 0.002229 |
| LIPB | 0.000932 | 0.000663 | −0.00054 | 0.002135 | 0.001056 | |
| POFP | LIB | 0.002561 | 0.00129 | −0.0008 | 0.004647 | 0.003055 |
| LIPB | 0.000895 | 0.001038 | −0.00033 | 0.002265 | 0.001601 | |
| TAP | LIB | 0.00886 | 0.001968 | −0.00574 | 0.016572 | 0.005083 |
| LIPB | 0.003066 | 0.001584 | −0.00229 | 0.006936 | 0.002365 | |
| TETP | LIB | 0.000247 | 4.23 × 10⁻⁵ | −9.6 × 10⁻⁵ | 0.000386 | 0.000193 |
| LIPB | 6.62 × 10⁻⁵ | 3.4 × 10⁻⁵ | −4 × 10⁻⁵ | 0.000141 | 5.99 × 10⁻⁵ | |
| ReCiPe Midpoint (H) | Separator | Cell Container | Electrolyte | Cathode | Anode | PCB | Packaging | Battery Manufacturing | Sum | |
|---|---|---|---|---|---|---|---|---|---|---|
| GWP | LIB | 0.0088648 | 0.035868947 | 0.158129365 | 0.254619 | 0.030754 | 0.131772 | 0.0540467 | 0.32594563 | 1 |
| LIPB | 0.004294915 | 0.054078619 | 0.068369593 | 0.270361 | 0.030771 | 0.134495 | 0.0870993 | 0.3505309 | 1 | |
| FDP | LIB | 0.014277904 | 0.037338646 | 0.20725733 | 0.141333 | 0.036845 | 0.143004 | 0.0682645 | 0.35168003 | 1 |
| LIPB | 0.006882164 | 0.081450791 | 0.090275585 | 0.147929 | 0.042509 | 0.145213 | 0.1094499 | 0.3762902 | 1 | |
| FETP | LIB | 0.005108167 | 0.043439213 | 0.032911642 | 0.146874 | 0.262138 | 0.444067 | 0.0621099 | 0.00335166 | 1 |
| LIPB | 0.002697085 | 0.024652611 | 0.014728686 | 0.167993 | 0.183016 | 0.493941 | 0.1090812 | 0.00389077 | 1 | |
| FEP | LIB | 0.001528506 | 0.016208797 | 0.043108548 | 0.077471 | 0.308621 | 0.52995 | 0.022303 | 0.00080899 | 1 |
| LIPB | 0.00083514 | 0.010587316 | 0.019861024 | 0.092295 | 0.224939 | 0.609991 | 0.0405336 | 0.00095744 | 1 | |
| HTP | LIB | 0.000889172 | 0.01292937 | 0.056061804 | 0.064737 | 0.377956 | 0.456728 | 0.0180035 | 0.01269563 | 1 |
| LIPB | 0.000507819 | 0.008037145 | 0.026782496 | 0.080673 | 0.284204 | 0.549513 | 0.0342011 | 0.01608198 | 1 | |
| METP | LIB | 0.004336379 | 0.038487043 | 0.041410277 | 0.141137 | 0.297171 | 0.416851 | 0.0551848 | 0.0054227 | 1 |
| LIPB | 0.002341391 | 0.022025921 | 0.018784517 | 0.165371 | 0.211742 | 0.47416 | 0.099112 | 0.00646316 | 1 | |
| MEP | LIB | 0.007122754 | 0.047154884 | 0.217901644 | 0.219705 | 0.134342 | 0.267936 | 0.0675075 | 0.03833047 | 1 |
| LIPB | 0.003778112 | 0.073883244 | 0.099341469 | 0.254002 | 0.105507 | 0.299402 | 0.1191073 | 0.04497936 | 1 | |
| MDP | LIB | 0.000481439 | 0.022158053 | 0.017579123 | 0.441568 | 0.239912 | 0.234877 | 0.0413327 | 0.00209142 | 1 |
| LIPB | 0.000245174 | 0.011442203 | 0.007557937 | 0.496168 | 0.160279 | 0.251983 | 0.0700142 | 0.00231099 | 1 | |
| ODP | LIB | 0.000459844 | 0.000670058 | 0.00538928 | 0.988606 | 0.000754 | 0.002189 | 0.000922 | 0.00101037 | 1 |
| LIPB | 0.000208354 | 0.00041961 | 0.00226714 | 0.991986 | 0.000626 | 0.002089 | 0.0013895 | 0.00101449 | 1 | |
| PMPF | LIB | 0.004764352 | 0.029234524 | 0.133127403 | 0.391336 | 0.153662 | 0.134591 | 0.0419027 | 0.11138291 | 1 |
| LIPB | 0.002478183 | 0.027560396 | 0.059355356 | 0.448319 | 0.113744 | 0.147483 | 0.0724989 | 0.12856129 | 1 | |
| POFP | LIB | 0.008032905 | 0.038113798 | 0.156022913 | 0.275686 | 0.11298 | 0.170266 | 0.0576542 | 0.18124425 | 1 |
| LIPB | 0.004066792 | 0.046182043 | 0.068862352 | 0.305947 | 0.092625 | 0.181595 | 0.0970891 | 0.20363233 | 1 | |
| TAP | LIB | 0.003039946 | 0.018040327 | 0.102219738 | 0.524849 | 0.151519 | 0.08744 | 0.0257105 | 0.0871813 | 1 |
| LIPB | 0.001553859 | 0.018763943 | 0.044467548 | 0.592635 | 0.105794 | 0.094157 | 0.0437136 | 0.0989149 | 1 | |
| TETP | LIB | 0.001904767 | 0.045785865 | 0.341572889 | 0.13139 | 0.253538 | 0.096032 | 0.0641161 | 0.06566073 | 1 |
| LIPB | 0.001257997 | 0.032120549 | 0.187696596 | 0.187233 | 0.220976 | 0.133614 | 0.1408526 | 0.09624941 | 1 | |
| ReCiPe Midpoint (H) | Separator | Cell Container | Electrolyte | Cathode | Anode | Assembly | Sum | |
|---|---|---|---|---|---|---|---|---|
| GWP | LIB | 0.010887993 | 0.044055236 | 0.194218874 | 0.31273 | 0.037773 | 0.4003355 | 1 |
| LIPB | 0.005517578 | 0.069473559 | 0.087832843 | 0.347326 | 0.039531 | 0.450319 | 1 | |
| FDP | LIB | 0.018102357 | 0.047340107 | 0.262772897 | 0.17919 | 0.046714 | 0.4458804 | 1 |
| LIPB | 0.009233623 | 0.109280443 | 0.121120445 | 0.198473 | 0.057033 | 0.5048589 | 1 | |
| FETP | LIB | 0.01034413 | 0.087965191 | 0.066646669 | 0.297423 | 0.530834 | 0.0067872 | 1 |
| LIPB | 0.006794049 | 0.062100777 | 0.037102067 | 0.42318 | 0.461023 | 0.009801 | 1 | |
| FEP | LIB | 0.003413769 | 0.036200759 | 0.096278716 | 0.173025 | 0.689275 | 0.0018068 | 1 |
| LIPB | 0.002389698 | 0.030294906 | 0.056831011 | 0.264097 | 0.643648 | 0.0027397 | 1 | |
| HTP | LIB | 0.001692794 | 0.024614773 | 0.106729763 | 0.123245 | 0.719548 | 0.0241698 | 1 |
| LIPB | 0.001219879 | 0.01930678 | 0.064336741 | 0.193792 | 0.682713 | 0.038632 | 1 | |
| METP | LIB | 0.008213397 | 0.072897083 | 0.078433887 | 0.267323 | 0.562862 | 0.010271 | 1 |
| LIPB | 0.005486843 | 0.051615795 | 0.044019851 | 0.387532 | 0.496199 | 0.0151458 | 1 | |
| MEP | LIB | 0.010718055 | 0.070956918 | 0.327890305 | 0.330604 | 0.202152 | 0.0576783 | 1 |
| LIPB | 0.006497288 | 0.12705838 | 0.17083936 | 0.436811 | 0.181442 | 0.0773518 | 1 | |
| MDP | LIB | 0.000665164 | 0.030613921 | 0.024287598 | 0.610077 | 0.331467 | 0.0028895 | 1 |
| LIPB | 0.000361612 | 0.016876326 | 0.011147347 | 0.731807 | 0.236399 | 0.0034085 | 1 | |
| ODP | LIB | 0.000461279 | 0.000672149 | 0.005406096 | 0.991691 | 0.000756 | 0.0010135 | 1 |
| LIPB | 0.000209082 | 0.000421075 | 0.002275054 | 0.995448 | 0.000628 | 0.001018 | 1 | |
| PMPF | LIB | 0.005785446 | 0.035500055 | 0.161659212 | 0.475207 | 0.186594 | 0.1352544 | 1 |
| LIPB | 0.003177084 | 0.035333023 | 0.076094849 | 0.574754 | 0.145822 | 0.1648184 | 1 | |
| POFP | LIB | 0.010404243 | 0.049365103 | 0.202081335 | 0.357069 | 0.146332 | 0.2347481 | 1 |
| LIPB | 0.005638019 | 0.064024721 | 0.095467689 | 0.424151 | 0.128412 | 0.2823068 | 1 | |
| TAP | LIB | 0.003427804 | 0.020342045 | 0.115261685 | 0.591813 | 0.170851 | 0.0983045 | 1 |
| LIPB | 0.001802351 | 0.021764656 | 0.051578758 | 0.687409 | 0.122712 | 0.1147333 | 1 | |
| TETP | LIB | 0.00226798 | 0.05451661 | 0.406706223 | 0.156444 | 0.301884 | 0.0781813 | 1 |
| LIPB | 0.001733893 | 0.044271634 | 0.258701527 | 0.258063 | 0.30457 | 0.1326602 | 1 | |
References
- Gu, F.; Guo, J.; Yao, X.; Summers, P.A.; Widijatmoko, S.D.; Hall, P. An investigation of the current status of recycling spent lithium-ion batteries from consumer electronics in China. J. Clean. Prod. 2017, 161, 765–780. [Google Scholar] [CrossRef]
- Peters, J.F.; Baumann, M.; Zimmermann, B.; Braun, J.; Weil, M. The environmental impact of Li-Ion batteries and the role of key parameters—A review. Renew. Sustain. Energy Rev. 2017, 67, 491–506. [Google Scholar] [CrossRef]
- Bian, J.; Bai, H.; Li, W.; Yin, J.; Xu, H. Comparative environmental life cycle assessment of waste mobile phone recycling in China. J. Clean. Prod. 2016, 131, 209–218. [Google Scholar] [CrossRef]
- Yazdani, P.; Chatterjee, M.; Montero-Simo, J.; Araque-Padilla, R.A. An Integrated Multi-Attribute Model for Evaluation of Sustainable Mobile Phone. Sustainability 2019, 11, 3704. [Google Scholar] [CrossRef]
- Espinosa, N.; Garcíavalverde, R.; Krebs, F.C. Life-cycle analysis of product integrated polymer solar cells. Energy Environ. Sci. 2011, 4, 1547–1557. [Google Scholar] [CrossRef]
- Liang, S.S.; Yan, W.; Wu, X.; Zhang, Y.; Zhu, Y.; Wang, H. Gel polymer electrolytes for lithium-ion batteries: Fabrication, characterization and performance. Solid State Ion. 2017, 318, 2–18. [Google Scholar] [CrossRef]
- Singh, S.K.; Balo, L.; Gupta, H.; Singh, V.K.; Tripathi, A.K.; Verma, Y.L.; Singh, R.K. Improved electrochemical performance of EMIMFSI ionic liquid based gel polymer electrolyte with temperature for rechargeable lithium battery. Energy 2018, 150, 890–900. [Google Scholar] [CrossRef]
- Sen, B.; Onat, N.C.; Kucukvar, M.; Tatari, O. Material footprint of electric vehicles: A multiregional life cycle assessment. J. Clean. Prod. 2019, 209, 1033–1043. [Google Scholar] [CrossRef]
- Bakas, I.; Fischer, C.; Haselsteiner, S.; McKinnon, D.; Milios, L.; Harding, A.; Wittmer, D. Present and Potential Future Recycling of Critical Metals in WEEE; 2014. Available online: https://epub.wupperinst.org/frontdoor/deliver/index/docId/5687/file/5687_WEEE.pdf (accessed on 1 May 2018).
- Soo, V.K.; Doolan, M. Recycling mobile phone impact on life cycle assessment. Procedia CIRP 2014, 15, 263–271. [Google Scholar] [CrossRef]
- Elduque, D.; Javierre, C.; Pina, C.; Martinez, E.; Jimenez, E. Life cycle assessment of a domestic induction hob: Electronic boards. J. Clean. Prod. 2014, 76, 74–84. [Google Scholar] [CrossRef]
- Rubin, R.S.; de Castro, M.A.S.; Brandão, D.; Schalch, V.; Ometto, A.R. Utilization of Life Cycle Assessment methodology to compare two strategies for recovery of copper from printed circuit board scrap. J. Clean. Prod. 2014, 64, 297–305. [Google Scholar] [CrossRef]
- GU, F.; GUO, J.; HALL, P.; GU, X. An integrated architecture for implementing Extended Producer Responsibility in the context of Industry 4.0. Int. J. Prod. Res. 2019, 57, 1458–1477. [Google Scholar] [CrossRef]
- Gu, F.; Zheng, Y.; Zhang, W.; Yao, X.; Pan, D.; Wong, A.S.M.; Sharmin, N. Can bamboo fibres be an alternative to flax fibres as materials for plastic reinforcement? A comparative life cycle study on polypropylene/flax/bamboo laminates. Ind. Crops Prod. 2018, 121, 372–387. [Google Scholar] [CrossRef]
- Lv, J.; Gu, F.; Zhang, W.; Guo, J. Life cycle assessment and life cycle costing of sanitary ware manufacturing: A case study in China. J. Clean. Prod. 2019, 238, 117938. [Google Scholar] [CrossRef]
- ISO. International Organization for Standardization. 14040 Series: Environmental Management-Life Cycle Assessment-Principles and Framework; ISO: Geneva, Switzerland, 2006. [Google Scholar]
- Vandepaer, V.; Cloutier, J.; Amor, B. Environmental impacts of lithium metal polymer and lithium-ion stationary batteries. Renew. Sustain. Energy Rev. 2017, 78, 46–60. [Google Scholar] [CrossRef]
- Hiremath, M.; Derendorf, K.; Vogt, T. Comparative Life Cycle Assessment of Battery Storage Systems for Stationary Applications. Environ. Sci. Technol. 2015, 49, 825–4833. [Google Scholar] [CrossRef] [PubMed]
- Bobba, S.; Mathieux, F.; Ardentea, F.; Blengini, G.A.; Cusenza, M.A.; Podias, A.; Pfrang, A. Life Cycle Assessment of repurposed electric vehicle batteries: An adapted method based on modelling energy flows. J. Energy Storage 2018, 19, 213–225. [Google Scholar] [CrossRef]
- Ahmadi, L.; Young, S.B.; Fowler, M.; Fraser, R.A.; Achachlouei, M.A. A cascaded life cycle: Reuse of electric vehicle lithium-ion battery packs in energy storage systems. Int. J. Life Cycle Assess. 2017, 22, 111–124. [Google Scholar] [CrossRef]
- Hao, H.; Mu, Z.; Jiang, S.; Liu, Z.; Zhao, F. GHG Emissions from the production of lithium-ion batteries for electric vehicles in China. Sustainability 2017, 9, 504. [Google Scholar] [CrossRef]
- JD.com Announces Fourth Quarter and Full Year 2017 Results. 2018. Available online: http://ir.jd.com/phoenix.zhtml?c=253315&p=irol-newsArticle_pf&ID=2335867 (accessed on 1 May 2018).
- Notter, D.A.; Gauch, M.; Widmer, R.; Wager, P.; Stamp, A.; Zah, R.; Althaus, H.J. Contribution of Li-ion batteries to the environmental impact of electric vehicles. Environ. Sci. Technol. 2010, 44, 6550–6556. [Google Scholar] [CrossRef]
- Majeau-Bettez, G.; Hawkins, T.R.; Strømman, A.H. Life cycle environmental assessment of lithium-ion and nickel metal hydride batteries for plug-in hybrid and battery electric vehicles. Environ. Sci. Technol. 2011, 45, 4548–4554. [Google Scholar] [CrossRef] [PubMed]
- Wang, Q.; Liu, W.; Yuan, X.; Tang, H.; Tang, Y.; Wang, M.; Zuo, J.; Song, Z.; Sun, J. Environmental impact analysis and process optimization of batteries based on life cycle assessment. J. Clean. Prod. 2018, 174, 1262–1273. [Google Scholar] [CrossRef]
- Xie, Y.; Yu, H.; Ou, Y.; Li, C. Environmental impact assessment of recycling waste traction battery. Inorg. Chem. Ind. 2015, 47, 43–46. [Google Scholar]
- Hao, H.; Qiao, Q.; Liu, Z.; Zhao, F. Impact of recycling on energy consumption and greenhouse gas emissions from electric vehicle production: The China 2025 case. Resour. Conserv. Recycl. 2017, 122, 114–125. [Google Scholar] [CrossRef]
- Ghosh, B.; Ghosh, M.K.; Parhi, P.; Mukherjee, P.K.; Mishra, B.K. Waste printed circuit boards recycling: An extensive assessment of current status. J. Clean. Prod. 2015, 94, 5–19. [Google Scholar] [CrossRef]
- Zhou, D.; Shanmukaraj, D.; Tkacheva, A.; Armand, M.; Wang, G. Polymer Electrolytes for Lithium-Based Batteries: Advances and Prospects. Chem 2019, 5, 2326–2352. [Google Scholar] [CrossRef]
- Mathieu, R.; Baghdadi, I.; Briat, O.; Gyan, P.; Vinassa, J.M. D-optimal design of experiments applied to lithium battery for ageing model calibration. Energy 2017, 141, 2108–2119. [Google Scholar] [CrossRef]
- Uddin, K.; Dubarry, M.; Glick, M.M.B. The viability of vehicle-to-grid operations from a battery technology and policy perspective. Energy Policy 2018, 113, 342–347. [Google Scholar] [CrossRef]
- Richa, K.; Babbitt, C.W.; Gaustad, G.; Wang, X. A future perspective on lithium-ion battery waste flows from electric vehicles. Resour. Conserv. Recycl. 2014, 83, 63–76. [Google Scholar] [CrossRef]
- Faria, R.; Marques, P.; Garcia, R.; Moura, P.; Freire, F.; Delgado, J.; de Almeida, A.T. Primary and secondary use of electric mobility batteries from a life cycle perspective. J. Power Sources 2014, 262, 169–177. [Google Scholar] [CrossRef]
- Li, J.; Xu, Z. Environmental friendly automatic line for recovering metal from waste printed circuit boards. Environ. Sci. Technol. 2010, 44, 1418–1423. [Google Scholar] [CrossRef] [PubMed]
- Schrynmakers, P.D. Life cycle thinking in the aluminium industry. Int. J. Life Cycle Assess. 2009, 14, 2–5. [Google Scholar] [CrossRef] [Green Version]
- McManus, M.C. Environmental consequences of the use of batteries in low carbon systems: The impact of battery production. Appl. Energy 2012, 93, 288–295. [Google Scholar] [CrossRef] [Green Version]
- Ellingsen, L.A.W.; Majeau-Bettez, G.; Singh, B.; Srivastava, A.K.; Valøen, L.O.; Strømman, A.H. Life cycle assessment of a lithium-ion battery vehicle pack. J. Ind. Ecol. 2014, 18, 113–124. [Google Scholar] [CrossRef]
- Peters, J.F.; Weil, M. Providing a common base for life cycle assessments of Li-Ion batteries. J. Clean. Prod. 2018, 171, 704–713. [Google Scholar] [CrossRef]
- Hawkins, T.R.; Singh, B.; Majeau-Bettez, G.; Strømman, A.H. Comparative environmental life cycle assessment of conventional and electric vehicles. J. Ind. Ecol. 2013, 17, 53–64. [Google Scholar] [CrossRef]
- Hou, J.; Teo, T.; Zhou, F.; Ming, K.; Chen, H. Does industrial green transformation successfully facilitate a decrease in carbon intensity in china? an environmental regulation perspective. J. Clean. Prod. 2018, 184, 1060–1071. [Google Scholar] [CrossRef]
- Komiyama, R.; Fujii, Y. Assessment of massive integration of photovoltaic system considering rechargeable battery in Japan with high time-resolution optimal power generation mix model. Energy Policy 2014, 66, 73–89. [Google Scholar] [CrossRef]
- Yuan, J.; Na, C.; Lei, Q.; Xiong, M.; Guo, J.; Hu, Z. Coal use for power generation in China. Resour. Conserv. Recycl. 2018, 129, 443–453. [Google Scholar] [CrossRef]
- Deng, Y.; Li, J.; Li, T.; Gao, X.; Yuan, C. Life cycle assessment of lithium sulfur battery for electric vehicles. J. Power Sources 2017, 343, 284–295. [Google Scholar] [CrossRef] [Green Version]
- Deng, Y.; Li, J.; Li, T.; Zhang, J.; Yang, F.; Yuan, C. Life cycle assessment of high capacity molybdenum disulfide lithium-ion battery for electric vehicles. Energy 2017, 123, 77–88. [Google Scholar] [CrossRef]
- Yang, H.; Guo, C.; Naveed, A.; Lei, J.; Yang, J.; Nuli, Y.; Wang, J. Recent progress and perspective on lithium metal anode protection. Energy Storage Mater. 2018, 14, 199–221. [Google Scholar] [CrossRef]
- Cheung, G.; Davies, P.J. In the transformation of energy systems: What is holding australia back? Energy Policy 2017, 109, 96–108. [Google Scholar] [CrossRef]
- Troy, S.; Schreiber, A.; Reppert, T.; Gehrke, H.G.; Finsterbusch, M.; Uhlenbruck, S.; Stenzel, P. Life cycle assessment and resource analysis of all-solid-state batteries. Appl. Energy 2016, 169, 757–767. [Google Scholar] [CrossRef]
- Ziemann, S.; Weil, M.; Schebek, L. Tracing the fate of lithium––The development of a material flow model. Resour. Conserv. Recycl. 2012, 63, 26–34. [Google Scholar] [CrossRef]
- Hao, H.; Liu, Z.; Zhao, F.; Geng, Y.; Sarkis, J. Material flow analysis of lithium in china. Resour. Policy 2017, 51, 100–106. [Google Scholar] [CrossRef]
- Mo, J.; Jeon, W. The impact of electric vehicle demand and battery recycling on price dynamics of lithium-ion battery cathode materials: A vector error correction model (VECM) analysis. Sustainability 2018, 10, 2870. [Google Scholar] [CrossRef]
- Mudd, G.M.; Weng, Z.; Jowitt, S.M.; Turnbull, I.D.; Graede, T.E. Quantifying the recoverable resources of by-product metals: The case of cobalt. Ore Geol. Rev. 2013, 55, 87–98. [Google Scholar] [CrossRef]
- Zeng, X.; Li, J.; Liu, L. Solving spent lithium-ion battery problems in China: Opportunities and challenges. Renew. Sustain. Energy Rev. 2015, 52, 1759–1767. [Google Scholar] [CrossRef]
- Zeng, X.; Li, J. On the sustainability of cobalt utilization in China. Resour. Conserv. Recycl. 2015, 104, 12–18. [Google Scholar] [CrossRef]
- Zubi, G.; Dufo-López, R.; Carvalho, M.; Pasaoglu, G. The lithium-ion battery: State of the art and future perspectives. Renew. Sustain. Energy Rev. 2018, 89, 292–308. [Google Scholar] [CrossRef]
- Few, S.; Schmidt, O.; Offer, G.J.; Brandon, N.; Nelson, J.; Gambhir, A. Prospective improvements in cost and cycle life of off-grid lithium-ion battery packs: An analysis informed by expert elicitations. Energy Policy 2018, 114, 578–590. [Google Scholar] [CrossRef]
- Xin, S.; Chang, Z.; Zhang, X.; Guo, Y. Progress of rechargeable lithium metal batteries based on conversion reactions. Natl. Sci. Rev. 2017, 4, 54–70. [Google Scholar] [CrossRef]
- Yang, F.; Wang, D.; Zhao, Y.; Tsui, K.L.; Bae, S.J. A study of the relationship between coulombic efficiency and capacity degradation of commercial lithium-ion batteries. Energy 2018, 145, 486–495. [Google Scholar] [CrossRef]
- Gu, F.; Zhang, W.; Guo, J.; Hall, P. Exploring “Internet+Recycling”: Mass balance and life cycle assessment of a waste management system associated with a mobile application. Sci. Total Environ. 2019, 649, 172–185. [Google Scholar] [CrossRef]


| Parameter | LIB Based MPB | LIPB Based MPB | Source of Information |
|---|---|---|---|
| Battery material composition | NMC/C | NMC/C | Based on [23,24,25] |
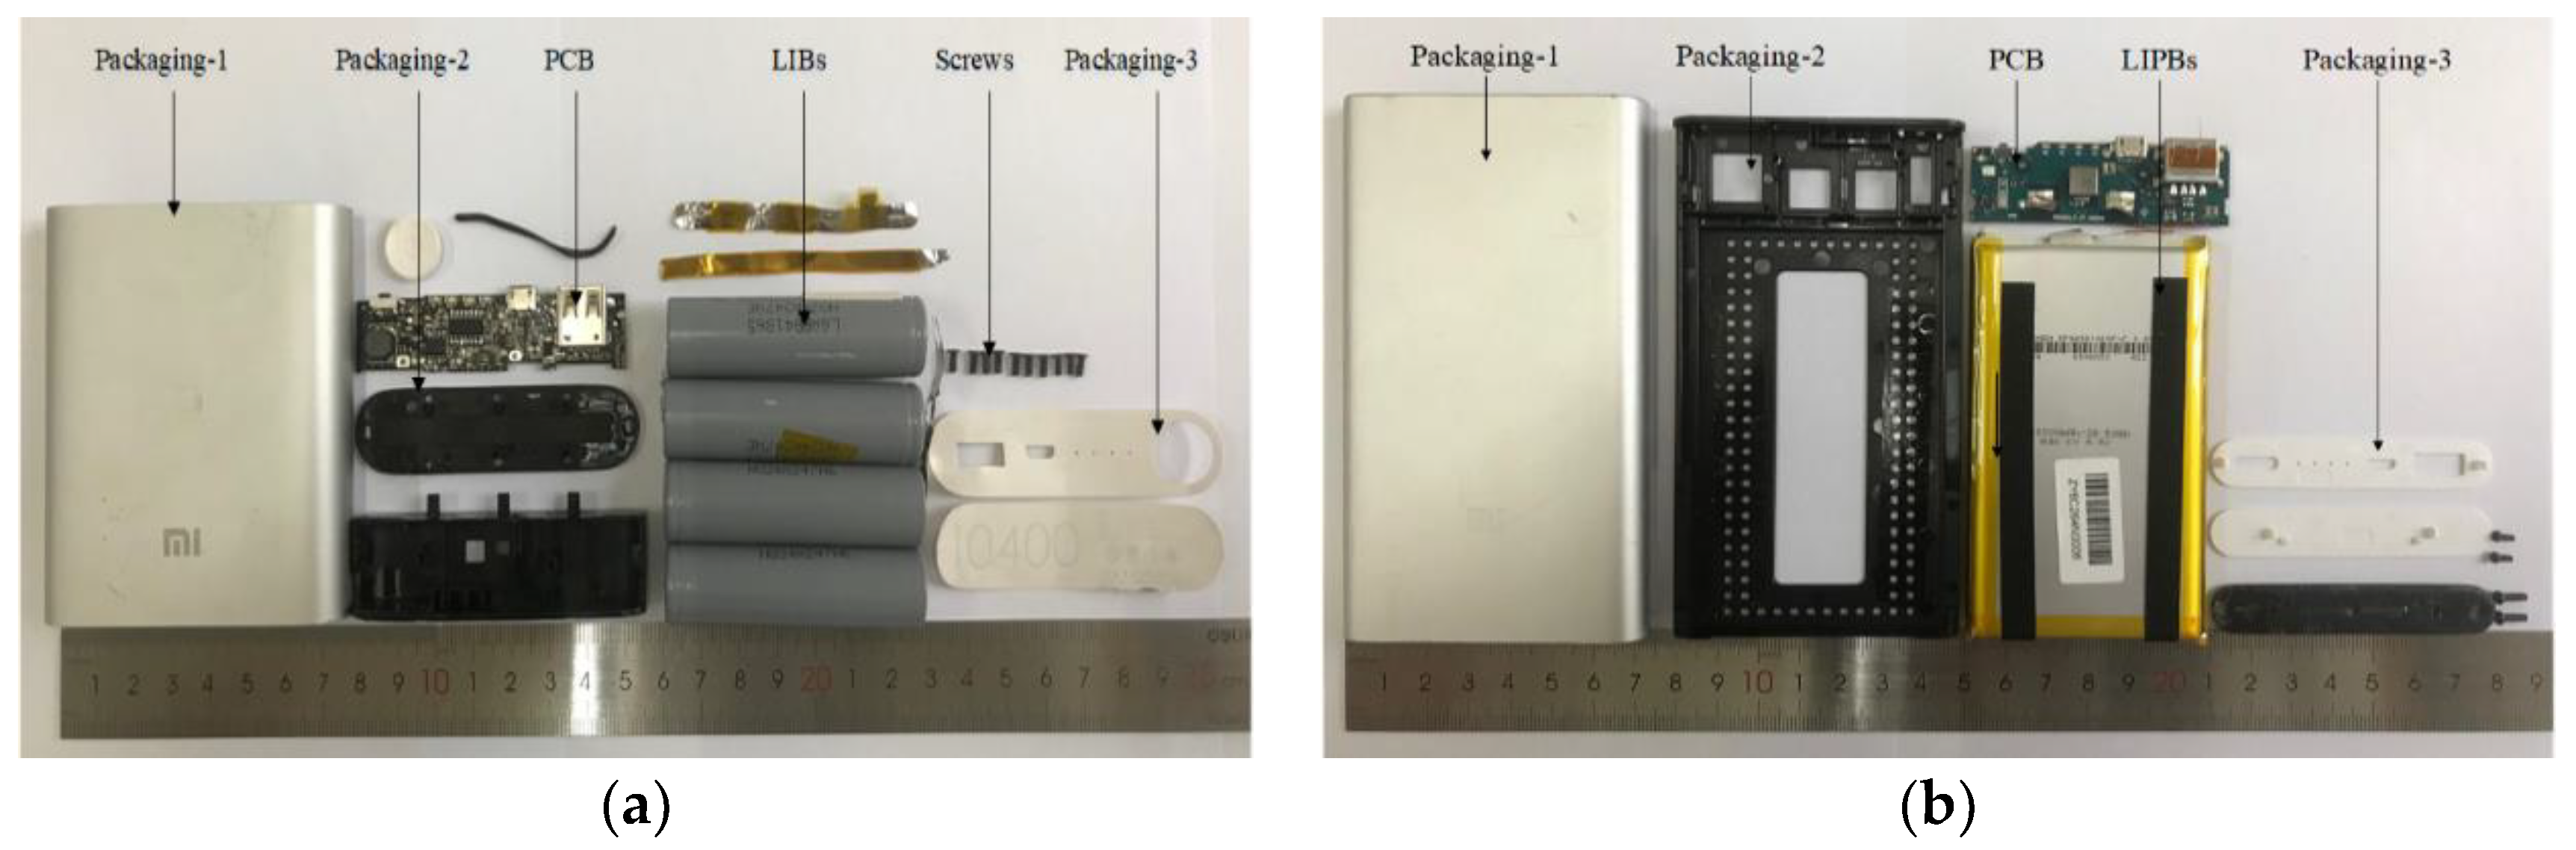
| MPB module composition | LIBs, PCB and metal packaging | LIPBs, PCB and metal packaging | Primary data |
| Nominal capacity (Wh) | 37.44 | 37 | Manufacturer’s guidance |
| Number of cells per MPB | 4 | 2 | Primary data |
| Cycle life (times) | 300 | 500 | Manufacturer’s guidance |
| Charging/Discharging efficiency | 82.92%/76.65% | 78.44%/87.21% | Primary data |
| Recycling route | Hydrometallurgical process | Hydrometallurgical process | Based on [26,27,28] |
| Component | Material | LIB Based (%) | LIPB Based (%) |
|---|---|---|---|
| Battery | 67.76 | 59.16 | |
| Cathode | Li(Ni0.4Co0.2Mn0.4)O2 | 29.04 | 28.96 |
| Cathode substrate | Aluminum foil | 4.51 | 2.64 |
| Anode | Graphite | 11.76 | 24.17 |
| Anode substrate | Copper foil | 10.38 | 6.13 |
| Electrolyte: salt | LiPF6 | 13.22 | 4.93 |
| Electrolyte: solvent | Ethylene carbonate | 1.80 | 3.05 |
| Polycarbonate | - | 0.98 | |
| Separator | Polypropylene (PP) | 4.13 | 0.93 |
| Polyethylene (PE) | - | 0.93 | |
| Cell packaging | Aluminum foil | 25.16 | - |
| Al-plastic film | - | 27.28 | |
| Printed circuit board | 2.78 | 2.31 | |
| Integrated circuit | 10 | 10 | |
| Copper | 50 | 50 | |
| Chromium steel 18/8 | 40 | 40 | |
| Packaging | Aluminum alloy | 29.46 | 38.53 |
| Battery Recycling | PCB Recycling | Packaging Recycling | |||||
|---|---|---|---|---|---|---|---|
| LIB | LIPB | LIB | LIPB | LIB | LIPB | ||
| Recycling route | Hydrometallurgical route | Mechanically separating & hydrometallurgical route | Material recycling in smelter | ||||
| Energy consumption (kWh/unit) | |||||||
| Electricity | 0.10 | 0.07 | 4.598 × 10⁻⁶ | 3.211 × 10⁻⁶ | - | ||
| Natural gas | 2.1 × 10⁻⁴ | 1.6 × 10⁻⁴ | - | - | |||
| Recovered material (g/unit) | |||||||
| NMC | 46.9 | 34.5 | - | - | |||
| Copper | 15.6 | 11.5 | 3.4 | 2.5 | - | ||
| Aluminum alloy | - | - | 76.9 | 84.8 | |||
| Data sources | Xie et al., [26]; Hao et al., [27] | Li and Xu, [34]; Ghosh et al., [28] | EcoInvent dataset | ||||
© 2019 by the authors. Licensee MDPI, Basel, Switzerland. This article is an open access article distributed under the terms and conditions of the Creative Commons Attribution (CC BY) license (http://creativecommons.org/licenses/by/4.0/).
Share and Cite
Yang, J.; Gu, F.; Guo, J.; Chen, B. Comparative Life Cycle Assessment of Mobile Power Banks with Lithium-Ion Battery and Lithium-Ion Polymer Battery. Sustainability 2019, 11, 5148. https://doi.org/10.3390/su11195148
Yang J, Gu F, Guo J, Chen B. Comparative Life Cycle Assessment of Mobile Power Banks with Lithium-Ion Battery and Lithium-Ion Polymer Battery. Sustainability. 2019; 11(19):5148. https://doi.org/10.3390/su11195148
Chicago/Turabian StyleYang, Jie, Fu Gu, Jianfeng Guo, and Bin Chen. 2019. "Comparative Life Cycle Assessment of Mobile Power Banks with Lithium-Ion Battery and Lithium-Ion Polymer Battery" Sustainability 11, no. 19: 5148. https://doi.org/10.3390/su11195148