Abstract
With the increasingly prominent problems of resources and environment, thermal power enterprises in China are facing more severe challenges. To improve energy efficiency, a great number of thermal power enterprises implement the technical renovation of equipment. However, current methods cannot meet the needs of scientific and effective evaluations. In this context, the internal rate of return (IRR) is used as the main index to evaluate the economic benefits of the technical renovation of combined heat and power (CHP) plants. In order to improve the accuracy of the economic benefit evaluation results, the incremental cash flow is calculated through the incremental method, which is based on the existence and non-existence method, and the improved factor analysis method is utilized to eliminate the influence of price factors from markets that have no direct and definite relationship with the technical renovation. Then, the evaluation method is validated by taking a CHP technical renovation project in B city of China as an example. By comparing with other methods, the results show that the IRRs calculated by different methods are quite different, and the difference between the maximum and the minimum can reach 69.95%. The result of the method proposed in this paper is more reasonable and reliable and can effectively evaluate the economic benefits of CHP technical renovation projects.
1. Introduction
With the acceleration of China’s industrialization and urbanization, the continuous upgrading of consumption structure and the rigid growth of energy demand, the problem of resources and environment is still one of the main bottlenecks restricting economic development at present [1]. As the world’s largest energy producer and consumer, China’s coal consumption ranks first in the world [2]. China’s total coal consumption was 1892.6 million tons of oil equivalent in 2017, accounting for 50.7% of global coal consumption [3]. From the point of view of power supply structure, thermal power units are still an important part of China’s power generation and central heating because of the need for heating, the insufficient production of natural gas in China and high dependence on the international natural gas market. China’s thermal power generation capacity was 4662.7 billion kW in 2017, as shown in Figure 1, accounting for 71.8% of the total power generation And as can be seen from Figure 2, in 2017, electricity accounted for 51.9% of the total coal consumption [4]. As one of the main bodies of energy consumption and pollutant emission [5], thermal power enterprises are facing more severe challenges. Therefore, technical innovation and transformation should be actively carried out to improve energy efficiency, and contribute to energy conservation, emission reduction and environmental protection. According to the requirements of the “Comprehensive Program of Work for Energy Conservation and Emission Reduction in the 13th Five-Year Plan” issued by the State Council, the task of the ultra-low emission renovation of 580 million kilowatt units will be accomplished by 2020 [6]. For thermal power enterprises, a cogeneration unit is one of the production modes to achieve the efficient use of energy [7,8]. The advantages of CHP technology for energy savings and emissions reduction have been widely accepted [9]. The boiler of a cogeneration unit has high thermal efficiency [10], a remarkable dust removal effect, and can reduce the emission of smoke into the atmosphere [11], which can effectively improve the environmental quality and save a lot of fuel [12].
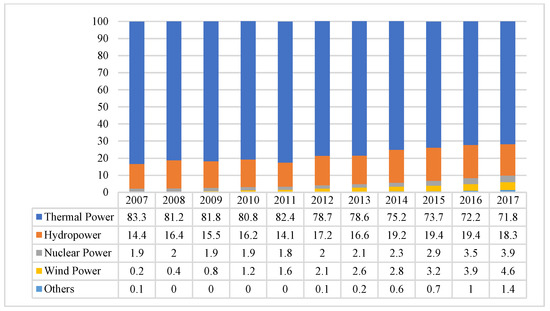
Figure 1.
Proportion of China’s power generation structure between 2007 and 2017 (Data source: China Energy Development Report 2018).
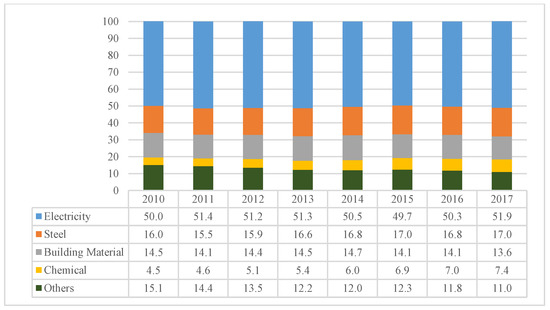
Figure 2.
Proportion of coal consumption in China’s major coal-consuming industries between 2010 and 2017 (Data source: China Energy Development Report 2018).
According to existing literature, a great number of domestic and overseas scholars have mainly studied the technical route, energy-saving effect, project investment risk and economic benefits of cogeneration. In terms of technical routes, the common heat supply innovation technologies of generating unit perforation, air extraction, high back pressure, optical axis and heat pump are mainly studied. For example, Wang et al. [13] analyzed the characteristics of the four renovation schemes and discussed the influence of heat load and circulating water flow on the technological renovation combined with the actual renovation contents. Chen et al. [14] proposed a high back pressure heating system combined with the pre-drying of raw coal, in order to improve the performance of cogeneration units. In terms of energy-saving effects, the current research mainly focuses on two aspects: the contribution of cogeneration to reducing greenhouse gas emissions such as carbon dioxide from the macro level [15,16,17] and the analysis of the energy-saving measurement and emission reduction potential of cogeneration units at the micro level [18,19]. Luking [20] calculated the reduction of standard coal consumption before and after technical innovation by evaluating the efficiency of cogeneration units and auxiliary power consumption rate. In terms of project investment risk analysis, the current research mainly focused on risk factor analysis, risk measurement and management. Maribu and Fleten [21] considered the fluctuation of energy price and used the Monte Carlo simulation model to analyze the impact of energy tax and energy load on project investment risk. In terms of economic benefits, the feasibility of cogeneration was discussed mainly by calculating net present value, rate of return and other indicators [22]. Compernolle et al. [23] took a self-managed cogeneration system as an example and discussed the economic feasibility of a cogeneration system by calculating the net present value (NPV). On the premise of energy saving and pollutant emission reduction, Torchio [24] compared the difference in economic benefit between heat and power distribution production and cogeneration through a life cycle cost analysis of cogeneration units. Recently, some researchers considered integrating renewable energy, such as wind power and photovoltaic power, into the cogeneration system to promote the development of renewable energy. Wang et al. [25] investigated the improvement of renewable energy penetration through a CHP-based energy system in complementary and stand-alone renewable energy scenarios modeled by EnergyPLAN. Chen et al. [26] explored opportunities for increasing the flexibility of CHP units using electrical boilers and heat storage tanks for the better integration of wind power.
The main research methods include three categories. The first one is the comprehensive evaluation method. The Balanced Scorecard method, Fuzzy Delphi method, Hybrid Multi-Criteria Decision-Making method [27], Fuzzy Comprehensive Evaluation method [28], Analytic Hierarchy Process [29], Weighted Russell Directional Distance method [30], technique for order preference by similarity to an ideal solution (TOPSIS) method and so on were often used [31,32]. Gu et al. [33] and Liang et al. [34] have combined the Delphi method, Grey System Theory and Logical Regression method to evaluate the safe operation of thermal power enterprises. Wu et al. [35] developed a multi-criteria assessment model by combining the improved grey relation analysis (GRA) approach and the analytic hierarchy process (AHP) method to comprehensively evaluate the overall benefits of a the building combined heat and power (BCHP) system. Based on the difference in pollutant reduction schemes, Bi et al. [36] proposed a new two-stage network data envelopment analysis (DEA) model to evaluate the performance of thermal power units in China by improving the link constraints different from the traditional network DEA method. In addition, considering the limitations of environmental regulation, some scholars also applied the DEA method to the thermal power industry in China, and analyzed the impact of environmental efficiency on energy efficiency [37,38]. The second category includes a genetic algorithm (GA), a back propagation (BP) neural network and other intelligent algorithms. For example, in view of the security of investment and financing in the power industry, Sun and Xu [39] used a genetic algorithm to optimize the connection weights and thresholds of the traditional BP neural network, and effectively evaluated the financial security of China’s power industry. The third category is the evaluation index. Some scholars have done a lot of research on financial evaluation indexes [40], technical and economic indexes [41] and low-carbon economic development indexes and so on [42]. In view of the particularity of the production and operation of thermal power enterprises themselves, different researchers have improved and perfected the traditional internal rate of return, net present value, payback period and other indexes, and put forward specific improvement programs, which made the evaluation index system more reasonable and objective. The application of these methods has effectively improved the decision-making ability of thermal power enterprises in sustainable development.
According to the research mentioned above, current research mainly focused on the technical, economic and energy-saving aspects of cogeneration projects, or took thermal power enterprises as a whole as the research object and studied its evaluation index system and methods. However, little research has been devoted to the evaluation of the economic benefit of technical innovation projects in thermal power plants. On the one hand, the technical renovation of cogeneration projects is only a link of power production. The object of renovation cannot form an independent production system, and the project itself cannot directly bring economic benefits either. On the other hand, the evaluation of the economic benefits of thermal power cogeneration is more complex, the boundary between cost and income accounting is vague, and the inflow and outflow of cash are difficult to define, which leads to the evaluation results cannot accurately and comprehensively reflect the economic benefits brought by technical innovation.
With this background, on the premise of meeting the requirements of systematicness and operability, the IRR index is applied in this paper to evaluate the economic benefit of CHP technical renovation projects. The main innovations and contributions of this paper are as follows:
- The composition of incremental cash flow for calculation was defined, which includes electricity sales revenue, electricity production cost, heat sales revenue and heat production cost.
- The improved factor analysis method and incremental method were combined, and the influence of price from market which is not directly related to technical renovation was eliminated. On the one hand, the improved factor analysis method avoids the disadvantage of inconsistent results caused by a different substitution order in the traditional factor analysis method, on the other hand, it makes up for the disadvantage of the incremental method in calculating incremental cash flow, which could not distinguish the contribution of each influencing factor.
- This method can be further applied to the evaluation of technical renovation projects in other fields to improve the evaluation accuracy and scientificity.
2. Theoretical Background
2.1. Principles for the Economic Benefit Evaluation of the Technical Renovation Project
The economic benefit evaluation principles of technical renovation projects mainly include four parts: systematicness, operability, objectivity and practicality [43].
- Systematicness. The systemic principle is to consider any problem with a systematic concept in the process of evaluating the economic benefit of technical renovation projects. It requires full consideration of the internal relations among various elements, overcomes the rigid thought pattern of analyzing the problem in isolation and stationary state, and evaluates the economic benefit of the project in the process of a comprehensive, systematic and dynamic analysis and demonstration.
- Operability. The selection of evaluation indexes should be based on objective facts, and the calculation formulas should be as simple as possible. The parameters in the formulas should be easy to obtain and the correlation should be high. In order to make the best use of existing information resources, statistical indexes for which data are easily accessible and reliable should be selected. In the actual evaluation process, the indexes should be convenient and concise, operable and effective, scientific and reasonable, and easy to be accepted by the public.
- Objectivity. Objectivity means that in the process of the post-evaluation of technical renovation projects, we should respect the objective law and emphasize scientificity without subjectivity and arbitrariness, insist that everything proceeds from reality, carry out an in-depth investigation and research, and seek truth from facts. On the premise of comprehensively and systematically grasping information and materials, we should eliminate the interference of subjective consciousness and strive to reflect the objective reality of the relevant results calculated by post-evaluation.
- Practicality. The results of the post-evaluation should provide support for future project decision making, so it is necessary to ensure the clarity and refinement of textual expression and guarantee it with strong pertinence and focus. At the same time, it is necessary to establish a suitable index system in a targeted manner. Furthermore, in the calculation of the index, it is necessary to solve the problem that existing calculation methods cannot accurately evaluate the economic benefit of a single project, so as to truly play the role of a post-evaluation and provide a reliable basis for decision makers [39].
2.2. Technical Renovation Characteristics of Thermal Power Enterprises
- Thermal power enterprises are highly asset-intensive, and their asset management costs account for a large proportion of total production costs. The newly added cost of a technical renovation project is too small to be reflected in the overall management costs.
- Most of the technical renovation projects of thermal power enterprises are aimed at the transformation and upgrading of a certain link in production. On the premise of the safety and stability of its equipment, the focus of technical renovation is to improve energy efficiency, reduce environmental pollution and further enhance the comprehensive social benefits of the enterprise.
- The technical renovation projects of thermal power enterprises cannot form independent production systems. The benefit of most technical renovation projects is manifested as the overall benefit of the system, and it is difficult to calculate the benefit of a single equipment renovation. Therefore, the comprehensive benefit created by the technical renovation project is often difficult to quantify by using traditional technical economics and financial evaluation methods.
Through the analysis of the technical renovation characteristics of thermal power enterprises, it can be seen that it is extremely important for the post-evaluation of the technical renovation project to distinguish the influence on benefits which are directly related to the factors of the project itself and exclude the influence of other factors besides the project.
2.3. Main Cash Flow Composition of Technological Renovation Projects
The main cash flow of technological renovation projects includes the main business income and main business cost. Among them, the main business income involved in technical innovation includes electricity sales revenue and heat sales revenue; the main business cost mainly refers to the electricity production cost and heat production cost [44].
(1) Electricity sales revenue: expressed as the product of the electricity quantity to access the grid and the electricity price to access the grid.
where is the electricity sales revenue and is the electricity quantity to access the grid, which refers to the amount of electricity that a thermal power enterprise enters into electric power company at the metering point of power consumption on the grid—that is, the amount of electricity that a power plant sells to an electric power company. is the electricity price to access the grid, which refers to the measurement price at which the electric power company purchases the power and electricity of the power generation enterprise and connects the power generation enterprise to the main grid.
(2) Heat sales revenue: expressed as the product of the quantity of heat supply and unit price of heat supply.
where is heat sales revenue and is the quantity of heat supply, which refers to the heat of steam and hot water supplied by thermal power enterprises to users of heat load while generating electricity. is the unit price of heat supply, which refers to the price at which thermal power enterprises supply heat to users through certain heating facilities.
(3) Electricity production cost: mainly refers to the fuel cost generated by electric power production, which is expressed as the product of the unit price of standard coal for power generation, the quantity of power generation and the coal consumption rate for power generation.
where is the electricity production cost and is the unit price of standard coal for power generation. Because there are many kinds of energy and the calories are different, in order to facilitate mutual comparison and research on the total amount, the standard coal with 7000 kilocalories per kilogram is defined as standard coal. The unit price of standard coal for power generation is calculated by the ratio of heat to electricity, and then converted according to the corresponding price. is the quantity of power generation, which refers to the amount of power produced by the cogeneration unit through energy conversion. is the coal consumption rate for power generation, which refers to the standard coal consumption per kilowatt-hour of electricity generated by power generation enterprises. It is one of the main indexes to assess the energy efficiency of power generation enterprises.
(4) Heat production cost: mainly refers to the fuel cost generated by heat production, which is expressed as the product of the unit price of standard coal for heat supply, the quantity of heat generation and the coal consumption rate for heat supply.
where is heat production cost and is the unit price of standard coal for heat supply, which is obtained by calculating the consumption of coal and oil in heating through the ratio of heat to electricity and then converted according to the corresponding price. is the quantity of heat generation and is the coal consumption rate for heat supply, which refers to the standard coal consumption per gigajoule supplied by a cogeneration unit [40].
3. Mathematical Model
3.1. Internal Rate of Return
Internal rate of return is an important index for technical and economic evaluation [45].
where represents the internal rate of return; represents the net present value. The expression of is as follows:
where represents the cash inflows in year ; represents the cash outflows in year ; represents the investment expenditure in year ; represents the cash outflows in year except investment expenditure, i.e., ; represents the life span of the project; represents the basic discount rate.
The economic implication of the IRR is that there are always unrecoverable investment in the life cycle of a project when calculated at interest rate , and at the end of the project’s lifetime, the investment will be completely recovered. That is to say, during the life cycle of the project, the project is always in the state of “repaying” the unrecovered investment [41].
Unlike new projects, technical renovation projects are constructed on the basis of the original projects of enterprises. For new projects, the costs and benefits incurred can be attributed to the projects, while the costs and benefits of technical renovation projects involve not only the new investment but also the original basic part. Therefore, the original basic part should be excluded when evaluating the economic benefits of technical renovation projects, and only the benefits of the new investment should be considered. Therefore, the incremental method can be used to evaluate the economic benefits of the technical renovation project. The incremental cash flow generated by technical renovation projects is firstly calculated, and then the incremental internal rate of return (IRR) can be calculated according to the incremental cash flow.
The incremental can be obtained by solving the following Equation (7):
where represents the technical renovation investment in year , represents the asset transfer income available in year with technical renovation; represents the asset transfer income available in year without technical renovation; represents the cash inflows in year with technical renovation (excluding income from asset transfer and recovery of residual assets at the end of analysis period); represents the cash inflows in year without technical renovation (excluding income from asset transfer and recovery of residual assets at the end of analysis period); represents the cash flow in year with technical renovation (excluding investment in technical renovation); represents the actual cash flow in year without technical renovation; represents the residual value of assets at the end of year with technical renovation; represents the residual value of assets at the end of year without technical renovation; represents the life cycle of projects without technical renovation; represents the incremental internal rate of return.
Among them, the residual value of assets at the end of year technical renovation is calculated according to the residual value rate of assets stipulated by the enterprise, as shown in formula (8).
where represents the residual value rate of fixed assets, which is relevant to enterprise regulations; represents the life span of technical renovation projects; represents the basic discount rate.
The calculation of incremental cash flow is the key step of the incremental method. It is noteworthy that the common method of calculating incremental cash flow is to subtract the cash flow after the technical renovation from the corresponding cash flow before the technical renovation, which is called the “Before-and-After Method”. However, there is a hypothesis in this calculation method: without technical renovation, the cash flow will remain unchanged before the technical renovation. Yet, the actual situation is often inconsistent with this hypothesis. In order to ensure the time consistency of cash flow in the comparison of the schemes, the cash flow at the same time should be used to calculate—that is, the future cash flow after technical renovation is subtracted from the future cash flow corresponding to the project without technical renovation. Therefore, it is necessary to separately predict the possible future situation of the project with or without technical renovation. This method is called the “Existence and Non-Existence Method”.
3.2. Improved Factor Analysis Method
The factor analysis method, also known as the interlocking substitution method, is an analysis method to quantitatively analyze the influence of the change in each influencing factor on the change in the comprehensive index. It is mainly used in the accounting of production costs and revenue of enterprises.
The limitations of the traditional factor analysis method mainly lie in three aspects: first, the influence of each sub-index on the comprehensive index varies with the substitution order, which makes the results have a certain degree of subjectivity; secondly, only the contribution value of a single sub-index can be calculated, but the interaction between multiple indexes cannot be analyzed; thirdly, the nonlinear relationship between the change in each sub-index and the difference in the comprehensive index is simplified into a linear relationship artificially.
The factor analysis method based on the continuous growth rate method avoids discussing the substitution order of factors, which makes the results consistent and objective. At the same time, it can separate the influence of each sub-index on the comprehensive index and overcome the limitation of traditional factor analysis method.
The calculation steps of the factor analysis method based on the continuous growth rate are as follows:
Assume that the change in the comprehensive index is influenced by the change in sub-indexes , as shown in formula (9).
Take the derivative of both sides of Equation (9) with respect to time .
Divide the two sides of the formula (10) by .
The formula (12) is the same as formula (12).
where separately represent the continuous growth rates of . In practical calculations, the continuous growth rate can be obtained by the discrete growth rate, taking factor as an example:
where represents the discrete growth rate of factor ; represents the numerical value of factor in the calculation period; represents the numerical value of factor in the base period. Taking as an example, the influence of the sub-index on the comprehensive index can be calculated as follows:
where represents the change in factor caused by the change in index .
3.3. Economic Benefit Evaluation Model of the Cogeneration Technical Renovation Project Based on the Improved Factor Analysis and Incremental Method
The steps of the economic benefit evaluation model of the cogeneration technical renovation project based on the improved factor analysis and incremental method are as follows:
Step 1: Data collection and processing
According to the relevant description in Section 2.3, it is necessary to obtain relevant data of the technical renovation unit, including electricity quantity to access the grid, the quantity of power generation, electricity price to access the grid, the unit price of standard coal for power generation, the coal consumption rate for power generation, the quantity of heat supply, the unit price of heat supply, and the unit price of standard coal for heat supply.
In addition, in order to calculate the incremental internal rate of return, the original asset value, asset transfer income and residual value rate at the end of the project lifetime should be determined according to the financial documents and relevant regulations of the unit under evaluation.
Step 2: Data forecasting
The data analysis period should be from the year of the heating unit technical renovation to the end of the project lifetime. According to the above analysis, the consistency of analysis time should be guaranteed when using the incremental analysis method based on the existence and non-existence method. Therefore, it is necessary to predict the possible future situation of the project with or without technical renovation.
As can be seen from Figure 3, for the project without technical renovation, the data after the technical renovation year should be predicted. As for the project with technical renovation, in practical work, since the start time of the post-evaluation of the technical renovation project is usually 1–5 years after the project is put into operation but does not reach the end of the project lifetime, thus the data used from the technical renovation year to the evaluation year are real data, while the later data are forecasting data. That is to say, since the beginning of the evaluation year, the indexes such as electricity quantity to access the grid, quantity of power generation, electricity price to access the grid and the unit price of standard coal for power generation and so on need to be predicted based on existing data.
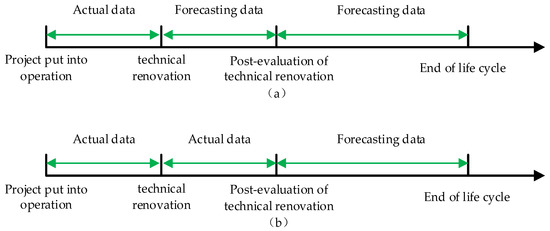
Figure 3.
Data description of the incremental method based on the existence and non-existence method. (a) Project life span without technical renovation; (b) Project life span with technical renovation.
To predict the later data of the project, the related factors such as power generation and the heat supply capacity of units, local power demand, heat demand and policy should be taken into account. There are many forecasting methods that can be used, such as the proportional coefficient growth method, linear regression and other methods.
Step 3: Calculate the incremental sales revenue and incremental operating cost
The accounting of cash inflows and outflows involves quantity indexes such as the quantity of power generation, electricity sales and the quantity of heat supply; quality indexes such as the coal consumption rate for power generation and for heat supply; and price indexes such as the electricity price to access the grid, the unit price of heat supply, the unit price of standard coal for power generation and for heat supply. Generally speaking, the technical renovation of heat supply will affect the first two categories of indexes, resulting in changes in income and cost. However, the change in price indexes is related to multiple factors such as market, policy and so on, and has no direct and explicit relationship with heating technology renovation. Thus, the influence of price indexes on income and cost should be excluded from the incremental income and cost, only the influence of quantity indexes and quality indexes on the technical renovation project should be considered.
Step 4: Calculate the incremental internal rate of return
On the basis of Step 2, the incremental cash flow should be defined, including the sales (electricity and heat supply) income increment, the operating cost (electricity and heat supply) increment, the residual recovery income increment, and so on. Additionally, the internal rate of return of the project should be further calculated.
Step 5: Compare and analyze the calculation results
After calculating the internal rate of return, the results should be compared with the forecasting results obtained in the feasibility study stage of the technical renovation project or the relevant regulations of the evaluated sector, so as to find out the reasons for the gap between calculating results and forecasting results, and put forward suggestions and improvement plans to enhance the project’s income.
4. Empirical Study
In this paper, the analysis method is illustrated by an example of a cogeneration renovation project of a thermal power plant in B city of China.
4.1. Background Introduction
City B covers a total area of 22,000 square kilometers, with a resident population of 11.695 million and a natural population growth rate of 6.67% (in 2017). Its economy is relatively developed, and its gross domestic product (GDP) reached 305 billion yuan in 2018. According to the relevant data, in 2018, 33.8 billion kWh of electricity was used in City B, an increase of 6.5% over the previous year, thus the demand for electricity and energy in City B is strong. Generally speaking, the growth of electricity consumption in the primary industry is stable, the growth rate and proportion of industrial electricity consumption have both declined, and the proportion of electricity consumption by the tertiary industry and residents has increased at a high speed.
The thermal power plant was originally built with two 300 MW subcritical coal-fired thermal power units. In order to meet the local heat demand, the two units of the whole plant are all equipped with cogeneration units to provide central thermal energy for winter heating for the residents in the city while providing power for social and economic development. With the rapid development of economy in B city, the demand for thermal load is increasing constantly. In order to improve the heat supply capacity of Unit 2 and save energy and reduce cost, the thermal power plant carried out the technical renovation.
The objectives of the technical renovation of the project are as follows:
- To fulfill social responsibility and meet heating demand. This technical renovation can further enhance the heat supply capacity of the power plant and improve the safety and reliability of heat supply, and at the same time improve the economic benefit of the power plant. After the renovation, the heat supply capacity of the whole plant increased by 25%, which can solve the problem of insufficient heat supply capacity in the coming years.
- To save energy and reduce consumption and to meet the requirements of energy conservation and emission reduction policy. After the technical renovation, the coal consumption of Unit 2 reduced by approximately 50%, and the loss of exhaust steam and cold source reduced to zero. The renovation will improve the heat supply capacity and energy efficiency of the power plant, and bring enormous energy-saving benefits, environmental protection and social benefits.
- To improve the economic benefit of the thermal power plant. Due to the continuous rise of coal prices in China recently, thermal power plants are facing extremely severe operating conditions. On the basis of not increasing coal consumption and environmental protection emissions of the power plants, the project recovers residual heat from exhausted steam or circulating water to supply heat to the city, so as to improve the external heat supply capacity of the power plant and increase the heat sales revenue of the power plant. In addition, due to the technical renovation, the dispatcher of the power grid has increased electricity quantity to access the grid of the power plant, which can increase the electricity sales revenue of the power plant.
According to the relevant regulations of the company which the power plant is affiliated with, the internal rate of return of the technical renovation project should be no less than 15%. This is the basis and standard for the post-evaluation of the technical renovation project.
4.2. Data Processing
(1) Data type
The data used in the empirical analysis include the following: (1) quantity indexes, such as the quantity of power generation, electricity sales and the quantity of heat supply; (2) quality indexes, such as the coal consumption rate for power generation and for heat supply; (3) price indexes, such as the electricity price to access the grid, the unit price of heat supply, and the unit price of standard coal for power generation and for heat supply; (4) other index data, such as other variable incomes and other variable costs, which are composed of environmental protection fees, repair fees, urban construction taxes and education surcharges; and fixed incomes and fixed costs brought about by technical renovation, including financial subsidies and the residual value of fixed assets.
(2) Time span
The technical renovation project was constructed in 2015 and put into operation in the same year. In calculations, the data before 2018 and 2018 are real data, and the data after 2019 are forecasting data.
When using the incremental method based on the existence and non-existence method to predict the future cash flow of the project without technical renovation, the data for five years from 2010 to 2014 are used as the calculation basis.
For the quantity indexes, the growth rates of the quantity indexes from 2010 to 2014 are calculated. After 2015, the quantity indexes will increase according to the calculated growth rates and will no longer grow after reaching the maximum generation capacity of the unit. For quality indexes and price indexes, the averages of quality indexes and price indexes from 2010 to 2014 are respectively calculated. After 2016, the averages of the first five years’ data of the quality indexes and price indexes are used as the forecasting values.
When using the incremental method based on the existence and non-existence method to predict the future cash flow of the project with technical renovation, the forecasting method is the same as the above forecasting method, but the calculation basis is the actual data of four years from 2015 to 2018.
In addition, if the project was not technically renovated, the project lifetime will be up to 2025, and the project lifetime will be extended to 2030 after technical renovation. In this paper, the life span of the short-lived scheme is used as the analysis period, and the residual value of assets at the end of the analysis period of the long-lived scheme is included in the cash flow.
(3) Comparative analysis
To illustrate the applicability of the method proposed in this paper, we propose three different methods for comparison.
- Method A: the incremental cash flow is calculated using the incremental method based on the existence and non-existence method—that is, the future cash flow of the project with technical renovation is subtracted from the future cash flow of the corresponding project without technical renovation, but the price factor is not eliminated by the factor analysis method. This method considers the consistency of indexes in time but thinks that all incremental cash flows are brought about by technical renovation.
- Method B: the incremental cash flow is calculated by the incremental method based on the before-and-after method—that is, the cash flow after technical renovation is subtracted from the corresponding cash flow before technical renovation. But the price factor is not excluded by the factor analysis method. This method does not consider the consistency of the indexes in time, nor the impact of price factors on the post-evaluation of technical effects.
- Method C: the incremental cash flow is calculated using the incremental method based on the before-and-after method, and the price factor is eliminated by the factor analysis method. This method does not consider the consistency of indexes in time but excludes the price factor that is not related to technical renovation.
The method proposed in this paper is called method D, which uses the existence and non-existence method to calculate the incremental cash flow and uses the factor analysis method to eliminate the influence of the market price factor on the benefit analysis.
Table 1 shows the comparison of the four methods in a more intuitive way.

Table 1.
Method comparison.
5. Results and Discussion
5.1. Calculation Results
The cash flow composition calculated by each method is shown in Figure 4. And the original data used for the calculation of the cash flow is shown in Table A1, Table A2, Table A3 and Table A4 in Appendix A.
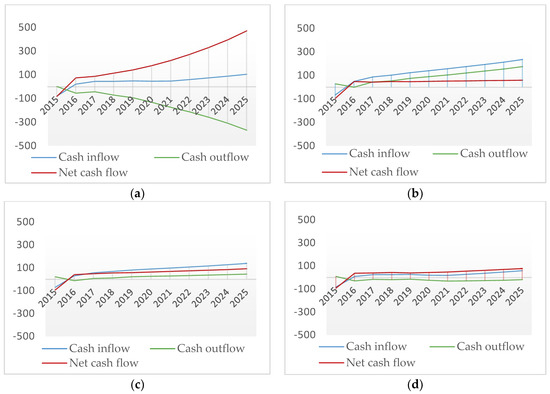
Figure 4.
Cash flow composition of four methods (Unit: Million Yuan). (a) The cash flow of method A; (b) the cash flow of method B; (c) the cash flow of method C; (d) the cash flow of method D.
Based on the above data, the internal rates of return of the four methods are calculated separately, and the results are as follows:
5.2. Results Analysis
As can be seen from Table 2, although all the results obtained by the four methods show that the economic benefits of the project meet the requirements of the group, the internal rates of return are quite different. Among the four methods, the IRR calculated by method A is the largest, which is 115.64% and much higher than the evaluation standard of the group company; the result calculated by method D is the smallest, which is 45.69%; the results obtained by method B and method C are close, and they are 50.49% and 55.49%, respectively.
Table 2.
Calculation results of the internal rate of return (IRR) index.
It can be seen intuitively from Figure 5a that the cash inflows of the four methods have the same growth trend, but the cash inflows calculated by method B have the largest growth rate and the cash inflows calculated by method B have the most stable growth rate. As can be seen from Figure 5b, due to the increase in the price of standard coal for power generation and the reduction of the consumption of standard coal for power generation, the cash outflows calculated by method A decline significantly year by year without eliminating price factors. According to Figure 5c, it can be seen more intuitively that different accounting methods have an obvious influence on cash inflows and outflows, which leads to greater differences in net cash flows.
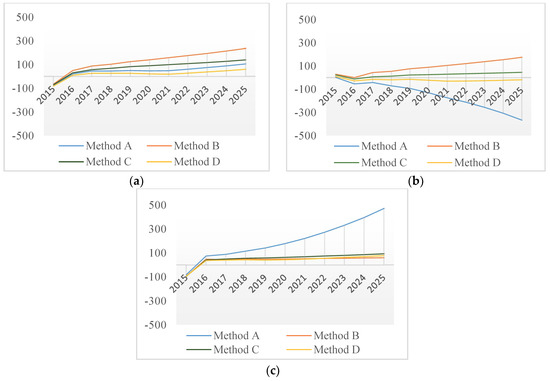
Figure 5.
Differences in cash composition by four methods (Unit: Million Yuan). (a) Cash inflows; (b) cash outflows; (c) net cash flows.
Based on the results calculated by method D, the reasons for the differences among the calculation results of other methods are analyzed.
The similarity between method A and method D is that both of them use the existence and non-existence method to calculate the incremental cash flow, but the difference is that method A does not use the factor analysis method to eliminate price factors. From the comparison of (a) and (d) in Figure 4, it can be seen that the growth trend of cash inflows calculated by method A and method D is comparatively consistent. But the cash outflows of method A decrease sharply year by year, resulting in the rapid growth of net cash flows year by year, while the change in cash outflows of method D are relatively flat, resulting in the slow growth of net cash flows.
It can be seen from Figure 6 that for the electricity sales revenue, except for the construction year, the continuous growth rate of each index in the remaining years is relatively balanced, and the influence of the electricity price to access the grid on the electricity sales revenue is relatively small; the continuous growth rates of the price indexes, such as the unit price of heat supply, the unit price of standard coal for power generation and heat supply and so on, account for a large proportion of the continuous growth rates of the electricity production cost, electricity sales revenue and the heat production cost—in other words, the continuous growth rates of the price indexes have a great impact on cash inflows and outflows. Therefore, the price factor is an important factor affecting the economic benefit evaluation of technical renovation projects, but because its change is influenced by multiple factors such as policy, market and so on, which have neither a clear nor direct connection with technical renovation, it should be eliminated in the evaluation.
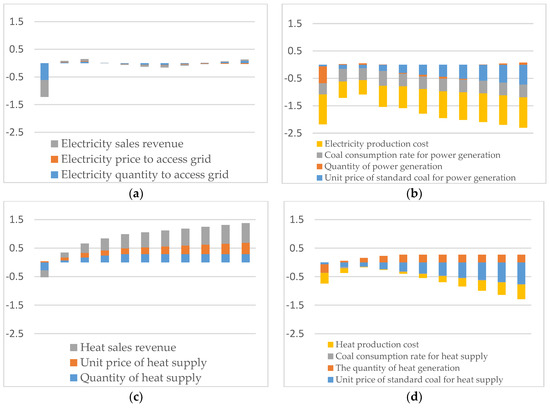
Figure 6.
Cash flow composition (based on the existence and non-existence method). (a) Electricity sales revenue; (b) electricity production cost; (c) heat sales revenue; (d) heat production cost.
The similarity between method C and method D is that they both use the factor analysis method to eliminate the influence of the market price factor on incremental cash flow, but method C uses the technical and economic index data of 2014 which is the year before the renovation of the project as the calculation data of the project without technical renovation.
As can be seen from (c) and (d) in Figure 4, the product sales revenue increment and cost increment calculated by method C are both positive, and the revenue increment is larger than the cost increment, resulting in a net cash flow increment lower than the product sales revenue increment; the product sales revenue increment calculated by method D is positive, while the product production cost (fuel cost) increment is negative, resulting in a net cash flow increment higher than the product sales revenue increment. Nevertheless, the net cash flow increment calculated by method C is still higher than the net cash flow increment calculated by method D, so the IRR calculated by method C is higher.
Method B does not consider the consistency of incremental cash flow in time, nor does it use factor analysis to eliminate the influence of the market price factor on cash flow. According to (b), (c) and (d) in Figure 4, similar to the cash flow of method C, the product sales revenue increment and cost increment calculated by method B are both positive, and the revenue increment is larger than the cost increment, resulting in a net cash flow increment lower than the product sales revenue increment. Since the price factor is not eliminated, the cash flow calculated by method B is more variable than method C.
In this paper, the differences between different methods used in the empirical study are mainly reflected in two aspects: whether to consider the time consistency of cash flow indexes and whether to exclude the influence of factors that have no clear connection with technical renovation. These two aspects of the differences have been illustrated in Table 1. Compared with Figure 5, the difference between the curves of method A and method D can show the influence of factors unrelated to technical renovation on the cash flow of a project; the difference between the curves of method C and method D can show the influence of the time consistency of indexes on the cash flow of a project; and the difference between the curves of method B and method D can show the comprehensive influence of irrelevant factors of technical renovation and the time consistency of indexes on the cash flow of a project. Finally, Figure 6 depicts the influence of market price factors (electricity price to access the grid, unit price of standard coal for power generation, unit price of thermal supply and unit price of standard coal for thermal supply) which are not clearly related to technical renovation on the composition of cash flow.
As can be seen from Figure 4 and Figure 5, if price factors are not excluded, the fluctuation range of cash inflows and cash outflows will increase. Figure 6 shows the influence of market price factors (the electricity price to access the grid, the unit price of standard coal for power generation, the unit price of thermal supply and the unit price of standard coal for thermal supply) which are not clearly related to technical renovation on cash flow composition. In addition, if the time consistency of the indexes is not guaranteed, the quantitative relationship of cash inflows, outflows and net cash flows will be significantly different.
Therefore, eliminating the influence of price factors on the economic benefit evaluation of technical renovation projects by the factor analysis method and ensuring the time consistency of indexes are of great significance for reasonably accounting the net cash flow composition of technical renovation projects and effectively evaluating the economic benefit of technical renovation projects.
6. Conclusions
In this paper, on the premise of meeting the requirements of the system and operability, the IRR, combined with the improved factor analysis method and the incremental method, is applied as the main index to evaluate the economic benefit of the technical renovation of CHP systems.
Through the analysis above, it can be seen that the internal rates of return calculated by different evaluation methods are quite different, the difference between the maximum and the minimum IRR can reach 69.95%. By using the improved factor analysis method, this paper can quantify the impact of factors that have no clear connection with technical renovation on the cash flow of a project. By eliminating this part of the impact, the large fluctuation of cash flow caused by market price factors can be avoided. The accuracy of cash flow forecasting can be further enhanced by using the existence and non-existence method to ensure the time consistency of the indexes. Therefore, the results calculated by the method proposed in this paper are more reasonable and reliable and can effectively evaluate the economic benefit of the cogeneration technical renovation project.
The main contributions and innovations of this paper are as follows:
First, the composition of incremental cash flow was defined for calculation, including electricity sales revenue, electricity production cost, heat sales revenue and heat production cost.
Second, the improved factor analysis method and incremental method were combined, and the influence of the market price, which is not directly related to technical renovation, was eliminated. On the one hand, the improved factor analysis method avoids the disadvantage of inconsistent results caused by different substitution orders in the traditional factor analysis method; on the other hand, it makes up for the disadvantage of the incremental method in calculating incremental cash flow, which could not distinguish the contribution of each influencing factor.
Third, this method proposed in this paper can be further applied to the evaluation of technical renovation projects in other fields to improve the evaluation accuracy and scientificity.
The limitation of this paper is that the method we proposed can only be applied to cases where the comprehensive index (such as the electricity sales revenue) can be expressed as the product form of various influencing factors (such as the electricity quantity to access the grid and electricity price to access the grid). In addition, the prediction value of the influencing factor will affect the accuracy of the results. Therefore, how to improve the prediction accuracy of these influencing factors is an important aspect which can be further studied in the future.
Author Contributions
All of the authors have contributed to this research. X.Y. and Y.L. collected the data and wrote this paper; D.N. provided professional guidance; L.S. revised this manuscript. All authors have approved the submitted manuscript.
Funding
This work was supported by the 2018 Key Projects of Philosophy and Social Sciences Research (grant number 18JZD032), Ministry of Education, China; 111 Project (grant numberB18021), Ministry of Science and Technology of People’s Republic of China, China.
Acknowledgments
The completion of this paper has been helped by many teachers and classmates. We would like to express our gratitude to them for their guidance and help.
Conflicts of Interest
The authors declare no conflict of interest.
Appendix A
Table A1.
Cash flow (no technical innovation).
Table A1.
Cash flow (no technical innovation).
| Index | Unit | 2014 | 2015 | 2016 | 2017 | 2018 | 2019 | 2020 | 2021 | 2022 | 2023 | 2024 | 2025 |
|---|---|---|---|---|---|---|---|---|---|---|---|---|---|
| Electricity Quantity to Access the grid | MWh | 398,705.8 | 426,002.9 | 455,168.9 | 486,331.6 | 519,628.0 | 555,203.9 | 593,215.5 | 622,468.8 | 622,468.8 | 622,468.8 | 622,468.8 | 622,468.8 |
| Electricity Price to Access the grid | Yuan/MWh | 329.56 | 335.64 | 341.82 | 348.12 | 354.54 | 361.08 | 367.73 | 374.51 | 381.42 | 388.45 | 395.61 | 402.90 |
| Electricity Sales Revenue | Million Yuan | 131.40 | 142.98 | 155.59 | 169.30 | 184.23 | 200.47 | 218.15 | 233.12 | 237.42 | 241.80 | 246.26 | 250.79 |
| Unit Price of Standard Coal for Power Generation | Yuan/ton | 598.42 | 674.88 | 761.10 | 858.34 | 968.01 | 1091.69 | 1231.17 | 1388.47 | 1565.86 | 1765.93 | 1991.55 | 2246.00 |
| Quantity of Power Generation | MWh | 415,059.1 | 443,475.8 | 473,838.1 | 506,279.0 | 540,941.0 | 577,976.2 | 617,546.9 | 648,000.0 | 648,000.0 | 648,000.0 | 648,000.0 | 648,000.0 |
| Coal Consumption Rate for Power Generation | G/kWh | 241.33 | 247.85 | 247.85 | 247.85 | 247.85 | 247.85 | 247.85 | 247.85 | 247.85 | 247.85 | 247.85 | 247.85 |
| Electricity Production Cost | Million Yuan | 59.94 | 74.18 | 89.38 | 107.71 | 129.78 | 156.38 | 188.44 | 223.00 | 251.49 | 283.62 | 319.85 | 360.72 |
| Quantity of Heat Supply | GJ | 2,990,909.00 | 3,052,131.84 | 3,052,131.84 | 3,052,131.84 | 3,052,131.84 | 3,052,131.84 | 3,052,131.84 | 3,052,131.84 | 3,052,131.84 | 3,052,131.84 | 3,052,131.84 | 3,052,131.84 |
| Unit Price of Heat Supply | Yuan/GJ | 27.05 | 27.32 | 27.59 | 27.87 | 28.15 | 28.43 | 28.71 | 29.00 | 29.29 | 29.58 | 29.88 | 30.17 |
| Heat Sales Revenue | Million Yuan | 80.91 | 83.39 | 84.22 | 85.06 | 85.91 | 86.77 | 87.63 | 88.51 | 89.39 | 90.28 | 91.19 | 92.10 |
| Unit Price of Standard Coal for Heat Supply | Yuan/ton | 595.42 | 674.14 | 763.27 | 864.18 | 978.43 | 1107.79 | 1254.25 | 1420.07 | 1607.81 | 1820.38 | 2061.05 | 2333.54 |
| Quantity of Heat Generation | GJ | 3,332,489.14 | 3,400,704.00 | 3,400,704.00 | 3,400,704.00 | 3,400,704.00 | 3,400,704.00 | 3,400,704.00 | 3,400,704.00 | 3,400,704.00 | 3,400,704.00 | 3,400,704.00 | 3,400,704.00 |
| Coal Consumption Rate for Heat Supply | kg/GJ | 39.97 | 40.11 | 40.11 | 40.11 | 40.11 | 40.11 | 40.11 | 40.11 | 40.11 | 40.11 | 40.11 | 40.11 |
| Heat Production Cost | Million Yuan | 79.31 | 91.96 | 104.12 | 117.89 | 133.47 | 151.12 | 171.10 | 193.72 | 219.33 | 248.33 | 281.16 | 318.33 |
Table A2.
Cash flow (technical innovation).
Table A2.
Cash flow (technical innovation).
| Index | Unit | 2014 | 2015 | 2016 | 2017 | 2018 | 2019 | 2020 | 2021 | 2022 | 2023 | 2024 | 2025 |
|---|---|---|---|---|---|---|---|---|---|---|---|---|---|
| Electricity Quantity to Access the grid | MWh | 398,705.8 | 231,092.1 | 466,172.0 | 511,577.8 | 520,956.2 | 54,061.7 | 561,010.8 | 582,178.6 | 604,145.1 | 626,940.4 | 650,595.8 | 675,143.8 |
| Electricity Price to Access the grid | Yuan/ MWh | 329.56 | 335.60 | 347.91 | 356.45 | 354.79 | 359.76 | 364.79 | 369.90 | 375.08 | 380.33 | 385.65 | 391.05 |
| Electricity Sales Revenue | Million Yuan | 131.40 | 77.55 | 162.19 | 182.35 | 184.83 | 194.49 | 204.65 | 215.35 | 226.60 | 238.44 | 250.90 | 264.02 |
| Unit Price of Standard Coal for Power Generation | Yuan/ton | 598.42 | 632.45 | 652.87 | 752.15 | 768.91 | 807.40 | 847.81 | 890.25 | 934.81 | 981.61 | 1030.74 | 1082.34 |
| Quantity of Power Generation | MWh | 415,059.1 | 240,095.7 | 484,334.5 | 531,509.4 | 541,253.2 | 561,675.5 | 582,868.4 | 604,860.9 | 627,683.2 | 651,366.6 | 675,943.7 | 701,448.1 |
| Coal Consumption Rate for Power Generation | G/kWh | 241.33 | 164.25 | 156.12 | 160.40 | 144.24 | 156.25 | 156.25 | 156.25 | 156.25 | 156.25 | 156.25 | 156.25 |
| Electricity Production Cost | Million Yuan | 59.94 | 24.94 | 49.37 | 64.12 | 60.03 | 70.86 | 77.21 | 84.14 | 91.68 | 99.91 | 108.86 | 118.63 |
| Quantity of Heat Supply | GJ | 2,990,909.00 | 2,305,061.00 | 3,267,853.00 | 3623567.00 | 3,893,159.00 | 4,067,252.35 | 4,067,252.35 | 4,067,252.35 | 4,067,252.35 | 4,067,252.35 | 4,067,252.35 | 4,067,252.35 |
| Unit Price of Heat Supply | Yuan/ GJ | 27.05 | 28.36 | 30.56 | 32.65 | 33.56 | 35.00 | 36.51 | 38.08 | 39.71 | 41.42 | 43.20 | 45.06 |
| Heat Sales Revenue | Million Yuan | 80.91 | 65.37 | 99.87 | 118.31 | 130.65 | 142.36 | 148.48 | 154.87 | 161.52 | 168.47 | 175.71 | 183.26 |
| Unit Price of Standard Coal for Heat Supply | Yuan/ton | 595.42 | 629.60 | 648.95 | 749.30 | 769.10 | 808.56 | 850.04 | 893.66 | 939.51 | 987.71 | 1038.39 | 1091.67 |
| Quantity of Heat Generation | GJ | 3,332,489.14 | 2,526,648.03 | 3,581,993.86 | 3,971,902.88 | 4,267,410.94 | 4,458,240.00 | 4,458,240.00 | 4,458,240.00 | 4,458,240.00 | 4,458,240.00 | 4,458,240.00 | 4,458,240.00 |
| Coal Consumption Rate for Heat Supply | kg/GJ | 39.97 | 39.90 | 38.21 | 39.34 | 39.90 | 39.34 | 39.34 | 39.34 | 39.34 | 39.34 | 39.34 | 39.34 |
| Heat production cost | Million Yuan | 79.31 | 63.47 | 88.82 | 117.08 | 130.95 | 141.80 | 149.08 | 156.73 | 164.77 | 173.22 | 182.11 | 191.45 |
Table A3.
Incremental quantity cash flow based on existence and non-existence method.
Table A3.
Incremental quantity cash flow based on existence and non-existence method.
| Index | Unit | 2015 | 2016 | 2017 | 2018 | 2019 | 2020 | 2021 | 2022 | 2023 | 2024 | 2025 | |
|---|---|---|---|---|---|---|---|---|---|---|---|---|---|
| Continuous Growth Rate | Electricity Quantity to Access the grid | % | −0.61 | 0.02 | 0.05 | 0.00 | −0.03 | −0.06 | −0.07 | −0.03 | 0.01 | 0.04 | 0.08 |
| Electricity Price to Access the grid | % | 0.00 | 0.02 | 0.02 | 0.00 | 0.00 | −0.01 | −0.01 | −0.02 | −0.02 | −0.03 | −0.03 | |
| Electricity Sales Revenue | % | −0.61 | 0.04 | 0.07 | 0.00 | −0.03 | −0.06 | −0.08 | -0.05 | −0.01 | 0.02 | 0.05 | |
| Incremental Quantity of Electricity Sales Revenue | Million Yuan | −65.43 | 6.60 | 13.05 | 0.60 | −5.98 | −13.49 | −17.78 | −10.82 | −3.35 | 4.65 | 13.22 | |
| Incremental Quantity of Electricity Sales Revenue in Technical Innovation | Million Yuan | −65.42 | 3.79 | 8.89 | 0.47 | −5.26 | −11.80 | −15.00 | −6.93 | 1.72 | 10.99 | 20.90 | |
| Continuous growth rate | Unit Price of Standard Coal for Power Generation | % | −0.06 | −0.15 | −0.13 | −0.23 | −0.30 | −0.37 | −0.44 | −0.52 | −0.59 | −0.66 | −0.73 |
| Quantity of Power Generation | % | −0.61 | 0.02 | 0.05 | 0.00 | −0.03 | −0.06 | −0.07 | −0.03 | 0.01 | 0.04 | 0.08 | |
| Coal Consumption Rate for Power Generation | % | −0.41 | −0.46 | −0.44 | −0.54 | −0.46 | −0.46 | −0.46 | −0.46 | −0.46 | −0.46 | −0.46 | |
| Electricity Production Cost | % | −1.09 | −0.59 | −0.52 | −0.77 | −0.79 | −0.89 | −0.97 | −1.01 | −1.04 | −1.08 | −1.11 | |
| Incremental Quantity of Electricity Production Cost | Million Yuan | −49.24 | −40.02 | −43.58 | −69.75 | −85.52 | −111.23 | −138.86 | −159.80 | −183.71 | −210.99 | −242.09 | |
| Incremental Quantity of Electricity Production Cost in Technical Innovation | Million Yuan | −46.30 | −29.68 | −32.48 | −48.92 | −52.93 | −64.72 | −75.54 | −78.11 | −80.32 | −82.05 | −83.18 | |
| Continuous Growth Rate | Quantity of Heat Supply | % | −0.28 | 0.07 | 0.17 | 0.24 | 0.29 | 0.29 | 0.29 | 0.29 | 0.29 | 0.29 | 0.29 |
| Unit Price of Heat Supply | % | 0.04 | 0.10 | 0.16 | 0.18 | 0.21 | 0.24 | 0.27 | 0.30 | 0.34 | 0.37 | 0.40 | |
| Heat Sales Revenue | % | −0.24 | 0.17 | 0.33 | 0.42 | 0.50 | 0.53 | 0.56 | 0.59 | 0.62 | 0.66 | 0.69 | |
| Incremental Quantity of Heat Sales Revenue | Million Yuan | −18.02 | 15.64 | 33.25 | 44.74 | 55.60 | 60.85 | 66.36 | 72.13 | 78.18 | 84.52 | 91.17 | |
| Incremental Quantity of Heat Sales Revenue in Technical Innovation | Million Yuan | −20.78 | 6.27 | 17.29 | 25.97 | 32.24 | 33.13 | 34.06 | 35.01 | 35.99 | 37.00 | 38.04 | |
| Continuous Growth Rate | Unit Price of Standard Coal for Heat Supply | % | −0.07 | −0.16 | −0.14 | −0.24 | −0.31 | −0.39 | −0.46 | −0.54 | −0.61 | −0.69 | −0.76 |
| Quantity of Heat Generation | % | −0.30 | 0.05 | 0.16 | 0.23 | 0.27 | 0.27 | 0.27 | 0.27 | 0.27 | 0.27 | 0.27 | |
| Coal Consumption Rate for Heat Supply | % | −0.01 | −0.05 | −0.02 | −0.01 | −0.02 | −0.02 | −0.02 | −0.02 | −0.02 | −0.02 | −0.02 | |
| Heat Production Cost | % | −0.37 | −0.16 | −0.01 | −0.02 | −0.06 | −0.14 | −0.21 | −0.29 | −0.36 | −0.43 | −0.51 | |
| Incremental Quantity of Heat Production Cost | Million Yuan | −28.49 | −15.30 | −0.81 | −2.52 | −9.32 | −22.02 | −36.99 | −54.56 | −75.11 | −99.05 | −126.88 | |
| Incremental Quantity of Heat Production Cost in Technical Innovation | Million Yuan | −23.24 | 0.32 | 15.95 | 29.31 | 36.78 | 40.15 | 43.86 | 47.92 | 52.39 | 57.29 | 62.69 | |
Table A4.
Incremental quantity cash flow based on before-and-after method.
Table A4.
Incremental quantity cash flow based on before-and-after method.
| Index | Unit | 2015 | 2016 | 2017 | 2018 | 2019 | 2020 | 2021 | 2022 | 2023 | 2024 | 2025 | |
|---|---|---|---|---|---|---|---|---|---|---|---|---|---|
| Continuous Growth Rate | Electricity Quantity to Access the grid | % | −0.55 | 0.16 | 0.25 | 0.27 | 0.30 | 0.34 | 0.38 | 0.42 | 0.45 | 0.49 | 0.53 |
| Electricity Price to Access the grid | % | 0.02 | 0.05 | 0.08 | 0.07 | 0.09 | 0.10 | 0.12 | 0.13 | 0.14 | 0.16 | 0.17 | |
| Electricity Sales Revenue | % | −0.53 | 0.21 | 0.33 | 0.34 | 0.39 | 0.44 | 0.49 | 0.54 | 0.60 | 0.65 | 0.70 | |
| Incremental Quantity of Electricity Sales Revenue | Million Yuan | −53.84 | 30.79 | 50.95 | 53.43 | 63.09 | 73.26 | 83.95 | 95.20 | 107.05 | 119.51 | 132.62 | |
| Incremental Quantity of Electricity Sales Revenue in Technical Innovation | Million Yuan | −55.70 | 22.86 | 38.76 | 41.88 | 48.99 | 56.46 | 64.33 | 72.60 | 81.31 | 90.47 | 100.10 | |
| Continuous Growth Rate | Unit Price of Standard Coal for Power Generation | % | 0.06 | 0.09 | 0.23 | 0.25 | 0.30 | 0.35 | 0.40 | 0.45 | 0.49 | 0.54 | 0.59 |
| Quantity of Power Generation | % | −0.55 | 0.15 | 0.25 | 0.27 | 0.30 | 0.34 | 0.38 | 0.41 | 0.45 | 0.49 | 0.52 | |
| Coal Consumption Rate for Power Generation | % | −0.38 | −0.44 | −0.41 | −0.51 | −0.43 | −0.43 | −0.43 | −0.43 | −0.43 | −0.43 | −0.43 | |
| Electricity Production Cost | % | −0.88 | −0.19 | 0.07 | 0.00 | 0.17 | 0.25 | 0.34 | 0.42 | 0.51 | 0.60 | 0.68 | |
| Incremental Quantity of Electricity Production Cost | Million Yuan | −35.00 | −10.58 | 4.18 | 0.09 | 10.92 | 17.27 | 24.20 | 31.74 | 39.96 | 48.92 | 58.69 | |
| Incremental Quantity of Electricity Production Cost in Technical Innovation | Million Yuan | −37.21 | −15.32 | −10.00 | −14.95 | −8.63 | −6.49 | −4.15 | −1.57 | 1.25 | 4.34 | 7.74 | |
| Continuous Growth Rate | Quantity of Heat Supply | % | −0.26 | 0.09 | 0.19 | 0.26 | 0.31 | 0.31 | 0.31 | 0.31 | 0.31 | 0.31 | 0.31 |
| Unit Price of Heat Supply | % | 0.05 | 0.12 | 0.19 | 0.22 | 0.26 | 0.30 | 0.34 | 0.38 | 0.43 | 0.47 | 0.51 | |
| Heat Sales Revenue | % | −0.21 | 0.21 | 0.38 | 0.48 | 0.57 | 0.61 | 0.65 | 0.69 | 0.73 | 0.78 | 0.82 | |
| Incremental Quantity of Heat Sales Revenue | Million Yuan | −15.54 | 18.96 | 37.40 | 49.75 | 61.46 | 67.58 | 73.96 | 80.62 | 87.56 | 94.80 | 102.35 | |
| Incremental Quantity of Heat Sales Revenue in Technical Innovation | Million Yuan | −18.98 | 7.97 | 18.89 | 27.37 | 33.43 | 34.21 | 35.02 | 35.84 | 36.70 | 37.58 | 38.48 | |
| Continuous Growth Rate | Unit Price of Standard Coal for Heat Supply | % | 0.06 | 0.09 | 0.23 | 0.26 | 0.31 | 0.36 | 0.41 | 0.46 | 0.51 | 0.56 | 0.61 |
| Quantity of Heat Generation | % | −0.28 | 0.07 | 0.18 | 0.25 | 0.29 | 0.29 | 0.29 | 0.29 | 0.29 | 0.29 | 0.29 | |
| Coal Consumption Rate for Heat Supply | % | 0.00 | −0.05 | −0.02 | 0.00 | −0.02 | −0.02 | −0.02 | −0.02 | −0.02 | −0.02 | −0.02 | |
| Heat Production Cost | % | −0.22 | 0.11 | 0.39 | 0.50 | 0.58 | 0.63 | 0.68 | 0.73 | 0.78 | 0.83 | 0.88 | |
| Incremental Quantity of Heat Production Cost | Million Yuan | −15.84 | 9.51 | 37.77 | 51.64 | 62.49 | 69.77 | 77.42 | 85.46 | 93.91 | 102.80 | 112.14 | |
| Incremental Quantity of Heat Production Cost in Technical Innovation | Million Yuan | −19.81 | 2.28 | 15.48 | 25.29 | 29.58 | 30.41 | 31.27 | 32.15 | 33.07 | 34.02 | 35.00 | |
References
- Li, Y.; Chang, J.; Yong, D.; Huan, Q.; Ma, C. Policy and case study on heat and power cogeneration and industrial centralized heat supply in China. Resour. Conserv. Recycl. 2017, 121, 93–102. [Google Scholar] [CrossRef]
- Lin, J.; Fridley, D.; Lu, H.; Price, L.; Zhou, N. Has coal use peaked in China: Near-term trends in China’s coal consumption. Energy Policy 2018, 123, 208–214. [Google Scholar] [CrossRef]
- Amoco, B. 2018 BP Statistical Review of World Energy; BP: London, UK; Amoco: Chicago, IL, USA, 2018. [Google Scholar]
- Institute, C.E.R. China Energy Development Report 2018; China Building Materials Industry Publishing House: Beijing, China, 2018. [Google Scholar]
- Li, W.D.; Li, T.; Wang, H.X.; Dong, J.; Li, Y.L.; Cui, D.; Ge, W.C.; Yang, J.Y.; Okoye, M.O. Optimal Dispatch Model Considering Environmental Cost Based on Combined Heat and Power with Thermal Energy Storage and Demand Response. Energies 2019, 12, 817. [Google Scholar] [CrossRef]
- State Council. Comprehensive Program of Work for Energy Conservation and Emission Reduction in the 13th Five-Year Plan; 2017. Available online: http://www.gov.cn/zhengce/content/2017-01/05/content_5156789.htm (accessed on 21 June 2019).
- Anand, H.; Narang, N.; Dhillon, J.S. Multi-objective combined heat and power unit commitment using particle swarm optimization. Energy 2019, 172, 794–807. [Google Scholar] [CrossRef]
- Bhattacharyya, S.C.; Thang, D.N.Q. Economic buy-back rates for electricity from cogeneration: Case of sugar industry in Vietnam. Energy 2004, 29, 1039–1051. [Google Scholar] [CrossRef]
- Liao, C.; Ertesvåg, I.S.; Zhao, J. Energetic and exergetic efficiencies of coal-fired CHP (combined heat and power) plants used in district heating systems of China. Energy 2013, 57, 671–681. [Google Scholar] [CrossRef]
- Majidi, M.; Mohammadi-Ivatloo, B.; Anvari-Moghaddam, A. Optimal robust operation of combined heat and power systems with demand response programs. Appl. Therm. Eng. 2019, 149, 1359–1369. [Google Scholar] [CrossRef]
- Narang, N.; Sharma, E.; Dhillon, J.S. Combined heat and power economic dispatch using integrated civilized swarm optimization and Powell’s pattern search method. Appl. Soft Comput. 2017, 52, 190–202. [Google Scholar] [CrossRef]
- Yan, B.; Xue, S.; Li, Y.; Duan, J.; Zeng, M. Gas-fired combined cooling, heating and power (CCHP) in Beijing: A techno-economic analysis. Renew. Sustain. Energy Rev. 2016, 63, 118–131. [Google Scholar] [CrossRef]
- Wang, X.D.; Zhao, Y.Z.; Yan, C.W.; Zheng, H.; Publicat, I.D. Analysis of Different Retrofit Technology for Heating Supply with High Back Pressure of 135 MW Grade Steam Turbine. In Proceedings of the 2018 3rd International Conference on Automation, Mechanical and Electrical Engineering, Shanghai, China, 22–23 July 2015; Destech Publications Inc.: Lancaster, UK, 2018; Volume 298, pp. 390–397. [Google Scholar]
- Chen, H.; Qi, Z.; Chen, Q.; Wu, Y.; Xu, G.; Yang, Y.P. Modified High Back-Pressure Heating System Integrated with Raw Coal Pre-Drying in Combined Heat and Power Unit. Energies 2018, 11, 2487. [Google Scholar] [CrossRef]
- Zhang, X.; Strbac, G.; Shah, N.; Teng, F.; Pudjianto, D. Whole-System Assessment of the Benefits of Integrated Electricity and Heat System. IEEE Trans. Smart Grid 2019, 10, 1132–1145. [Google Scholar] [CrossRef]
- Park, J.H.; Lim, S.Y.; Yoo, S.H. Does combined heat and power mitigate CO2 emissions? A cross-country analysis. Environ. Sci. Pollut. Res. 2019, 26, 11503–11507. [Google Scholar] [CrossRef] [PubMed]
- Kaplan, P.O.; Witt, J.W. What is the role of distributed energy resources under scenarios of greenhouse gas reductions? A specific focus on combined heat and power systems in the industrial and commercial sectors. Appl. Energy 2019, 235, 83–94. [Google Scholar] [CrossRef]
- Chen, H.; Xiao, Y.; Xu, G.; Xu, J.; Yao, X.; Yang, Y. Energy-saving mechanism and parametric analysis of the high back-pressure heating process in a 300 MW coal-fired combined heat and power unit. Appl. Therm. Eng. 2019, 149, 829–840. [Google Scholar] [CrossRef]
- Seifert, S.; Cullmann, A.; von Hirschhausen, C. Technical efficiency and CO2 reduction potentials—An analysis of the German electricity and heat generating sector. Energy Econ. 2016, 56, 9–19. [Google Scholar] [CrossRef]
- Luking, R.M. Proposal for a new approach to assess the efficiency of combined heat and power installations. BAUPHYSIK 2011, 33, 329–337. [Google Scholar]
- Maribu, K.M.; Fleten, S.E. Combined heat and power in commercial buildings: Investment and risk analysis. Energy J. 2008, 29, 123–150. [Google Scholar]
- Garcia-Saez, I.; Mendez, J.; Ortiz, C.; Loncar, D.; Becerra, J.A.; Chacartegui, R. Energy and economic assessment of solar Organic Rankine Cycle for combined heat and power generation in residential applications. Renew. Energy 2019, 140, 461–476. [Google Scholar] [CrossRef]
- Compernolle, T.; Witters, N.; Van Passel, S.; Thewys, T. Analyzing a self-managed CHP system for greenhouse cultivation as a profitable way to reduce CO2-emissions. Energy 2011, 36, 1940–1947. [Google Scholar] [CrossRef]
- Torchio, M.F. Energy-Exergy, Environmental and Economic Criteria in Combined Heat and Power (CHP) Plants: Indexes for the Evaluation of the Cogeneration Potential. Energies 2013, 6, 2686–2708. [Google Scholar] [CrossRef]
- Wang, K.; Chen, S.; Liu, L.; Zhu, T.; Gan, Z. Enhancement of renewable energy penetration through energy storage technologies in a CHP-based energy system for Chongming, China. Energy 2018, 162, 988–1002. [Google Scholar] [CrossRef]
- Chen, X.; Kang, C.; O’Malley, M.; Xia, Q.; Bai, J.; Liu, C.; Sun, R.; Wang, W.; Li, H. Increasing the Flexibility of Combined Heat and Power for Wind Power Integration in China: Modeling and Implications. IEEE Trans. Power Syst. 2015, 30, 1848–1857. [Google Scholar] [CrossRef]
- Zhao, H.; Li, N. Evaluating the performance of thermal power enterprises using sustainability balanced scorecard, fuzzy Delphic and hybrid multi-criteria decision making approaches for sustainability. J. Clean. Prod. 2015, 108, 569–582. [Google Scholar] [CrossRef]
- Liang, Z.; Yang, K.; Sun, Y.; Yuan, J.; Zhang, H.; Zhang, Z. Decision support for choice optimal power generation projects: Fuzzy comprehensive evaluation model based on the electricity market. Energy Policy 2006, 34, 3359–3364. [Google Scholar] [CrossRef]
- Yagmur, L. Multi-criteria evaluation and priority analysis for localization equipment in a thermal power plant using the AHP (analytic hierarchy process). Energy 2016, 94, 476–482. [Google Scholar] [CrossRef]
- Xie, J.; Liang, Z.; Zhang, X.; Zhu, L. Efficiency evaluation of thermal power plants in China based on the weighted Russell directional distance method. J. Clean. Prod. 2019, 222, 573–583. [Google Scholar] [CrossRef]
- Wang, T.; Xin, B.C. Thermal Power Plant Sitting Based on TOPSIS method. Procedia Eng. 2011, 15, 5384–5388. [Google Scholar] [CrossRef][Green Version]
- Naizhong, X.; Weihua, Z. A Comprehensive Method Based on Interval-value for Evaluation of Energy-saving and Emission-reducing Technology of Thermal Power Industry. Environ. Sci. Technol. 2014, 37, 187–192. [Google Scholar]
- Gu, D.-X.; Liang, C.-Y.; Bichindaritz, I.; Zuo, C.-R.; Wang, J. A case-based knowledge system for safety evaluation decision making of thermal power plants. Knowl.-Based Syst. 2012, 26, 185–195. [Google Scholar] [CrossRef]
- Liang, C.; Gu, D.; Bichindaritz, I.; Li, X.; Zuo, C.; Cheng, W. Integrating gray system theory and logistic regression into case-based reasoning for safety assessment of thermal power plants. Expert Syst. Appl. 2012, 39, 5154–5167. [Google Scholar] [CrossRef]
- Wu, Q.; Ren, H.; Gao, W.; Ren, J. Multi-criteria assessment of building combined heat and power systems located in different climate zones: Japan-China comparison. Energy 2016, 103, 502–512. [Google Scholar] [CrossRef]
- Bi, G.-B.; Shao, Y.; Song, W.; Yang, F.; Luo, Y. A performance evaluation of China’s coal-fired power generation with pollutant mitigation options. J. Clean. Prod. 2018, 171, 867–876. [Google Scholar] [CrossRef]
- Bi, G.-B.; Song, W.; Zhou, P.; Liang, L. Does environmental regulation affect energy efficiency in China’s thermal power generation? Empirical evidence from a slacks-based DEA model. Energy Policy 2014, 66, 537–546. [Google Scholar] [CrossRef]
- Xie, B.-C.; Gao, J.; Zhang, S.; Pang, R.-Z.; Zhang, Z. The environmental efficiency analysis of China’s power generation sector based on game cross-efficiency approach. Struct. Chang. Econ. Dyn. 2018, 46, 126–135. [Google Scholar] [CrossRef]
- Sun, W.; Xu, Y. Financial security evaluation of the electric power industry in China based on a back propagation neural network optimized by genetic algorithm. Energy 2016, 101, 366–379. [Google Scholar] [CrossRef]
- Ye, C.; Sun, M.; Wang, L. Research on fnancial evaluation index system of thermal power enterprises. Friends Account. 2012, 5, 8–11. [Google Scholar]
- LI, T.; Guo, X.; Hu, H. Construction of Financial Operation Evaluation System for Thermal Power Enterprises. Res. Finance Account. 2011, 76, 63–65. [Google Scholar]
- Mi, G. Evaluation of low carbon economic development of China’s thermal power enterprises. Resour. Sci. 2012, 34, 2390–2397. [Google Scholar]
- Dongxiao, N.; Weijun, W.; Hao, Z.; Lidong, D. Post-Evaluation Method and Application of Thermal Power Projects; China Electric Power Publishing House: Chongqing, China, 2010. [Google Scholar]
- Ming, G.; Hualong, Z. Technical and Economic Indicators of Electric Power Production; China Electric Power Publishing House: Chongqing, China, 1999. [Google Scholar]
- Fu, J.; Tong, Y. Industrial Technology Economics; Tsinghua University Press: Beijing, China, 1996. [Google Scholar]


© 2019 by the authors. Licensee MDPI, Basel, Switzerland. This article is an open access article distributed under the terms and conditions of the Creative Commons Attribution (CC BY) license (http://creativecommons.org/licenses/by/4.0/).